Embed Size (px)
Citation preview

WEB BASED MULTI PARTICIPANT SPATIAL DATA ENTRY
IN CRIME MAPPING
A THESIS SUBMITTED TO THE GRADUATE SCHOOL OF NATURAL AND APPLIED SCIENCES
OF MIDDLE EAST TECHNICAL UNIVERSITY
BY
YUNUS EMRE AYDIN
IN PARTIAL FULFILLMENT OF THE REQUIREMENTS FOR
THE DEGREE OF MASTER OF SCIENCE IN
GEODETIC AND GEOGRAPHIC INFORMATION TECHNOLOGIES
MAY 2006

Approval of the Graduate School of Natural and Applied Sciences
Prof. Dr. Canan Özgen Director
I certify that this thesis satisfies all the requirements as a thesis for the degree of Master of Science.
Assoc. Prof. Dr. Zuhal Akyürek
Head of Department This is to certify that we have read this thesis and that in our opinion it is fully adequate, in scope and quality, as a thesis for the degree of Master of Science.
Assoc. Prof. Dr. Oğuz Işık Supervisor
Examining Committee Members Assoc. Prof. Dr. Nurünnisa Usul (METU, CE) Assoc. Prof. Dr. Oğuz Işık (METU, CP) Assoc. Prof. Dr. Şebnem Düzgün (METU, GGIT) Assoc. Prof. Dr. Yasemin Yardımcı (METU, IS) Assoc. Prof. Dr. Zuhal Akyürek (METU, CE)

iii
I hereby declare that all information in this document has been obtained and
presented in accordance with academic rules and ethical conduct. I also
declare that, as required by these rules and conduct, I have fully cited and
referenced all material and results that are not original to this work.
Name, Last Name: Yunus Emre Aydın
Signature:

iv
ABSTRACT
WEB BASED MULTI PARTICIPANT SPATIAL DATA ENTRY
IN CRIME MAPPING
Aydın, Yunus Emre
M.Sc., Department of Geodetic and Geographic Information Technologies
Supervisor: Assoc. Prof. Dr. Oğuz Işık
May 2006, 96 pages
Geographic Information Systems (GIS) development in crime analyses
encourages sustainable platforms within various types of users and decision
makers. Since patterns of crime incidents are pinpointed and analyzed in
crime mapping, accurate data acquisition must be considered as a key
concept to construct a successful GIS application.
Ankara City Police Department utilizes a semi-automated geocoding interface
in which crime incidents including offenders and victims are pinpointed.
However, this system has some accuracy errors during geocoding, because
in this process point based data are located in the center of street line

v
segments, and this may cause position errors up to 200 meters. Therefore,
additional data editing must be done to reach a reasonable accuracy. In this
context, real time data editing provides opportunity to gain time instead of
expanding the GIS database within received hardcopy files from each police
station. As the crime incidents occur daily, online editing must be used to
maintain such an accurate and efficient spatial database.
In this study, for effective and accurate geocoding, a Web based data
acquisition method is proposed. This online entry system enables real-time
editing for GIS repository. In this way this study aims to provide a fast and
reliable data acquisition system by constructing a multi participant platform
enabling online data entry from each police station.
Keywords: Crime Mapping, Geographic Information Systems (GIS), Web
based GIS, Geocoding

vi
ÖZ
SUÇ HARİTALARINDA WEB TABANLI ÇOK KATILIMLI
MEKANSAL VERİ GİRİŞ SİSTEMİ OLUŞTURMAK
Aydın, Yunus Emre
Yüksek Lisans, Jeodezi ve Coğrafi Bilgi Teknolojileri Bölümü
Tez Yöneticisi: Doç. Dr. Oğuz Işık
Mayıs 2006, 96 sayfa
Suç analizlerinde; Coğrafi Bilgi Sistemleri (CBS) oluşturulması kullanıcılar ve
karar mekanizmaları için önemli avantajlar sağlar. Haritalarda suç olaylarının
doğru işlenip hatasız saptanması ve bunun sürdürülebilir olması başarılı bir
CBS kurulumunda anahtar rol oynar.
Ankara Emniyet Müdürlüğü suç olaylarının ve karışanların haritalara
işlenmesi için yarı otomatik adreslendirme arayüzü kullanmaktadır. Fakat
kullanılan bu sistemde adreslendirme esnasında bir takım hatalar ortaya
çıkmaktadır. Çünkü bu süreç boyunca veriler olay mahaline birtakım konum
hatalarıyla işlenmektedir. Bu da sokak uzunluğuna bağlı olarak 200 metreye

vii
kadar pozisyon hatasına neden olmaktadır. Bu sebeple verilerin doğru
işlenmesi için ilave düzenlenmeler yapılmalıdır. Bu noktada karakollardan
ulaştırılan verilerin merkezde tek tek işlenmesi yerine, gerçek zamanlı veri
düzenleme metoduyla hem zaman kazandıran hem de hassas veri elde
edilmesini sağlayan bir alternatif sunulmaktadır. Suç olaylarının günlük
gerçekleştiği düşünüldüğünde Web tabanlı CBS kullanımı, doğru ve verimli bir
mekansal veritabanı oluşturulmasına katkı sağlar.
Bu çalışmada etkili ve konum hassasiyeti olan bir adreslendirme sistemi
oluşturmak için Web tabanlı veri depolama metodu önerilmektedir. Bu sayede
CBS veritabanına gerçek zamanlı veri girişi mümkün kılınır. Bu çalışma
internet sayesinde karakollardan çok katılımlı bir şekilde hızlı ve güvenilir bir
veri depolama sistemini gerçekleştirmeyi amaçlamıştır.
Anahtar Kelimeler: Suç Haritaları, Coğrafi Bilgi Sistemleri (CBS), Web Tabanlı
CBS, Adreslendirme

viii
To my father,

ix
ACKNOWLEDGEMENTS
First of all, I would thank to my thesis advisor Dr. Oğuz Işık for his
encouraging behaves to me during this long run. He is not only a solution
provider for me, but also made my motivation elevated by his understanding
personality during this thesis preparation.
I am also thankful to Dr. Düzgün for believing me that I am capable of
studying in a serious institution before I was admitted to this graduate school.
In addition, her feedbacks for my thesis study were very useful. I am thankful
to Dr. Zuhal Akyürek for her guidance in developing the initial ideas of my
thesis in Information Systems on Natural Resources Management class.
I am also grateful to Alp Yoğurtçoğlu for his technical help in programming
part of my thesis. His debugging and algorithm guidance helped me a lot to
finish the overwhelming system development part. In addition, I am thankful to
Matt Walker who gave me the brilliant ideas in Web development of my
thesis.
My mother and sister’s understanding and also their patience and support
were invaluable for me to finish this thesis. Also my cousins Ali and Alp were
my great enthusiasts when I felt lost in preparation of this study. There is no
doubt my elder cousin Önder Çelik was a great supporter for me.
Finally, I would thank to my friends Ulaş, Fatih, Hande, Sedef, Özge and Yeliz
for cheering me up when I need their existence during thesis preparation.

x
TABLE OF CONTENTS
ABSTRACT.....................................................................................................iv
ÖZ...................................................................................................................vi
ACKNOWLEDGEMENTS ...............................................................................ix
LIST OF FIGURES ........................................................................................xii
LIST OF TABLES..........................................................................................xiv
CHAPTERS
1. INTRODUCTION..................................................................................... 1
1.1 Overview of the Study........................................................................ 1
1.2 Purpose and Declarations.................................................................. 3
1.3 Organization of the Study .................................................................. 5
2. CRIME MAPPING AND WEB BASED GIS ............................................. 7
2.1. Concepts of Mapping Crime ............................................................. 8
2.2. Types of Crime Mapping and Analysis using GIS........................... 13
2.3. Theoretical and Practical View of Web Based GIS ......................... 16
2.3.1. Architectures used in Web based GIS Applications ................. 18
2.3.2. Online Spatial Database Editing Functions .............................. 24
2.3.3. Web based Crime Mapping...................................................... 26
3. SYSTEM DESIGN PROCESS .............................................................. 32
3.1. Introduction ..................................................................................... 32
3.2. Requirement Analysis ..................................................................... 34
3.3. System Development...................................................................... 45
3.3.1. System Components ................................................................ 47
3.3.2. Server Side Model.................................................................... 49
3.3.2.1. Map Server Application Development................................ 50
3.3.2.2. Client Interface................................................................... 52
3.3.3. Functions of the system ........................................................... 53
3.3.3.1. Map Generation and Display ............................................. 54
3.3.3.2. Navigation.......................................................................... 55

xi
3.3.3.3. Incident Data Input............................................................. 57
3.3.3.4. Offender and Victim Data Input.......................................... 58
4. EVALUATION PROCESS OF MULTI PARTICIPANT ONLINE
MAPPING.................................................................................................. 61
4.1. Description of the Study Area ......................................................... 62
4.2. Expanding the GIS Database ......................................................... 65
4.2.1. Performance Testing ................................................................ 66
4.2.2. Accuracy Testing...................................................................... 69
5. CONCLUSION AND RECOMMENDATIONS........................................ 74
REFERENCES ............................................................................................. 80
APPENDIX A ................................................................................................ 84
APPENDIX B ................................................................................................ 95

xii
LIST OF FIGURES
Figure:
2.1: A Pinned Map. Baltimore Country, Baltimore Maryland .............................
2.2: The Crime Analysis Process ......................................................................
2.3: Typical Web Mapping Application Model ....................................................
2.4: Client Side Web based GIS Model .............................................................
2.5: Server Side Web based GIS Model ............................................................
2.6: Medium Client/Server Side Web based GIS Model ....................................
2.7: The Map-Survey Interface of the First Project:
The 18th Street Commercial Corridor ................................................................
2.8: Animated Crime Map of Redlands, California.............................................
2.9: Online Mapping Feature of crimeBase Application ....................................
2.10: Kansas, Overland Park Online Crime Mapping ……………………………
3.1: Entity Relationship Diagram of Crime Database ........................................
3.2: System Overview ........................................................................................
3.3: MapXtreme 2004 Architecture ....................................................................
3.4: Server Side Model ......................................................................................
3.5: Web System Designed Interface ................................................................
3.6: Initial Map Display with Layer Control and Toolbar ....................................
3.7: Precincts, Neighborhood and Street Selection Tool ...................................
3.8: Crime Incident Input Screen .......................................................................
3.9: Involved People Input Screen .....................................................................
4.1: Study Area Overview ..................................................................................
4.2: Distribution of Incidents and Involved People Occurred in Some
Precincts in the First Half of 2003 Year .............................................................
4.3: Performance Testing Schema ....................................................................
4.4: Incident Accuracy Testing 1 .......................................................................
9
12
19
21
22
23
25
27
28
29
43
46
48
50
53
55
56
58
59
62
65
67
70

xiii
4.5: Incident Accuracy Testing 2 .......................................................................
4.6: Incident Accuracy Testing 3 .......................................................................
4.7: Involved Accuracy Testing 1 .......................................................................
4.8: Involved Accuracy Testing 2 .......................................................................
71
71
72
72

xiv
LIST OF TABLES
Table:
2.1: Crime Analysis Types .................................................................................
3.1: Police Precincts Attribute Database Table ................................................
3.2: Crime Incidents Attribute Database Table ..................................................
3.3: Involved People Attribute Database Table .................................................
4.1: Ankara City Police Department Districts ...................................................
14
41
41
41
63

1
CHAPTER 1
INTRODUCTION
1.1 Overview of the Study
Human cognition in navigation, location analysis and cartographic map
production has always been important for centuries. Knowing what is where
must be the primary concern of analysts and decision makers dealing with
spatial phenomena. In this frame of reference, Geographic Information
Systems (GIS) has been created and used on a variety of applications. With
the help of computer technology GIS has provided many tools enabling
decision makers and end-users to analyze and manipulate spatial data
(Campbell, 2001). As the computers and networks become widespread, GIS
is now utilized by not only decision makers but also end-users that have basic
knowledge of map interpretation. Crime mapping is one of the contemporary
easy-to-use GIS applications that enable decision makers to track crime
patterns by using these computer networks.
Every community dreams of living in a peaceful and stable environment.
However, effort is required to build up such an environment. To start up this
exertion, as a governmental level work, taking advantage of spatial
information can help law enforcement agencies to fight with crime. In this

2
context, GIS may help crime analysis in data collection and spatial
understanding of location and concentration of the incidents. This allows law
enforcement agencies to understand where the crime occurs as well as to
determine the specific patterns of crimes. Akpınar (2005) point outs that there
are several issues related to environmental criminology that identifies higher
density of crime areas to be intervened by the local police authorities. It is
obvious that the more concentrated problematic areas are the more
dangerous places, and where require greater attention. In this context, the
accuracy of a spatial database is a key factor to identify crime patterns
effectively.
Goodchild (2002) mentions location of a feature does not mean in itself, but
necessary in determining the relationship between features. The author
underlines the fact that positional errors may mislead the eventual outcomes
of GIS. At this viewpoint, decision-makers in police departments may
intervene in such districts to manipulate crime. However, the solid way that
these agencies should follow is to deem efficient and effective data
acquisition methods to pinpoint crime occurrences. Among several choices of
data collection methods, the selected system must use appropriate and
efficient data input technique to reach essential positional accuracy for
analyses. Considering time and accuracy, online mapping is one of the most
useful choices. In this framework, each type of crime can be pinpointed by the
local police officers via Internet or private intranet environment.
Recently, Web based GIS is used in publishing maps or much advanced level
as a collaborative decision making process. Functions that are implemented
in Internet mapping are numerous. Data collection and editing is one of the
functions that can be conducted through Web browsers. This crucial
advantage enables individuals to participate in the GIS platform and produce
data instead of single user data production. Therefore, in different locations of
3
a computer network, data production is possible which could truly be
achieved through Web browsers. Today Web based GIS platforms within
diverse architecture options provide point, line, and polygon-based editing
functions as well as tabular database operations that are conducted via Web
browsers. In order to gather up-to-date data for analyses, a Web based
system can answer the questions of accurate and real time data input for
crime mapping applications.
1.2 Purpose and Declarations
Emphasizing the importance of time and accuracy, it is better to put forward
the current situation of the law enforcement agencies that use GIS for crime
analysis. Ankara Police Department has been using GIS for thematic
mapping retrievals of each type of crime, ad-hoc database queries for victims
and offenders for decision making process. However, it is important to
consider the accuracy of the spatial database that is used for these types of
analyses.
Tandoğan (2005), head of crime analysis department, mentions that they
collect data via hardcopy materials including address, and associated
information of incidents and offenders (Type, Date, Names, Geocoding
information, and Persons Involved etc.). These data are then converted into
digital maps with a semi-automated geocoding interface which is operated by
the technicians in the general police department information services branch.
According to the varying type of incident information, point based crime data
are generated in the spatial database. In this system, geocoding of points,
pinpointing the crime locations with appropriate accuracy, is directly involved
with that semi-automated geocoding process success.

4
During the geocoding process, crime data are pinpointed in the center of
street lines. This might cause position errors depending on the length of these
lines, because by the time the length increases position error might be higher.
Coincidently, a crime occurrence can be pinpointed in the exact location.
However, this geocoding process is still not reliable for a city road network
with random lengths. In addition, although this semi-automated interface
allows the user to enter building numbers as attribute information of crime,
street centers may not be located in the actual building number. Obviously, to
reach building level accuracy, these located crime incidents must be checked
and edited in the digital map. This is why the system is called semi-automated
geocoding process and it costs time and workforce to produce accurate data
for GIS analysis.
Torun (2005), a technician using the system, mentions that each day
regardless of how many crime incidents have happened all of them must be
entered to the database in day time. This operator is the only responsible
person for expanding the spatial database and states that there is no other
staff for editing the crime locations for building level accuracy. In addition,
geocoding of hardcopy information could be rather daunting for a person who
does not know the exact location of crime. Instead, if the police officers are
able to pinpoint the exact locations via online, then more accurate and
efficient data production could be possible. Because in this way, police
officers who report the crime in place, can interpret data from the Web map
better than the technicians at the center of police department. Therefore,
within this approach operator(s) in the center division might only ensure that
whether spatial database is prepared for final GIS analysis.
There are two major aims of this study; the first one is to provide building level
geocoding accuracy for spatially correct and up-to-date data collection.
Second one is to achieve it by a multi-participant environment. Internet

5
mapping technology, in other words Web based GIS, can now meet this
demand to produce and manipulate spatial data online. Therefore fast and
reliable data collection can be achieved by this approach.
The system uses MapInfo MapXtreme as a Web mapping server and
windows built in IIS (Internet Information Services) as a Web server. These
two servers are in one single computer communicating each other for the
browser side person (end-user) requests. As the processing requests are
conducted in the server, the system uses a server-side GIS. In addition, to
provide multi participant editing, the system uses Microsoft Access database
to enter attribute information including geographic coordinates. In the Web
interface users have constraints such as combo boxes to enter the consistent
information. This allows both fast and reliable data production system.
1.3 Organization of the Study
This thesis is composed of five chapters. In the next chapter, literature review
is given on the subject of crime mapping and Web based GIS. Main concepts
of crime mapping and applications solutions in law enforcement agencies are
mentioned. In addition, architectures and system components used of online
and participatory mapping are described.
In the third chapter, system design process is thoroughly explained. Online
mapping components and tools used for data entry process are discussed. In
addition, interface design, functions and operations implemented via Web
browsers are presented. In order to give some idea about the background,
some essential parts of the programming development are explained.

6
In the fourth chapter, study area is explained. In addition distribution of crime
incidents and involved people in the Police districts are evaluated. Proposed
online geocoding system performance issues such as speed and positional
accuracy are compared to the current semi-automated geocoding system.
In the final chapter of this thesis; with a brief summary of the results,
conclusions and recommendations about the proposed study are given.
Satisfaction of the results and contribution to Ankara City Police department
are evaluated. Moreover, future directions and trend of Web based GIS in
crime mapping technologies are discussed.

7
CHAPTER 2
CRIME MAPPING AND WEB BASED GIS
Today, evolving GIS technologies can make the building of various spatially
associated applications possible. A wide range of applications ranging from
diverse aggregation methods of geographic data to conducting numerous
application specific analyses are now a standard GIS capability.
Improvements in GIS technology can also meet the requirements of law
enforcement agencies for crime mapping and analysis. Since the community
requires a larger extent of a nonviolent environment, fighting with crime using
GIS becomes a priority issue in both governmental and institutional level.
From this point of view, numerous researches have been carried out for
aggregation of spatial data, multi purpose publishing and statistical crime
mapping and analysis. In this framework, this chapter discusses general view
of crime mapping, and online participatory spatial data entry functions for
pinpointing crime incidents, offenders and victims. Moreover, in this chapter, a
crucial part of data acquisition process, accuracy of spatial databases within
online mapping is discussed.

8
2.1. Concepts of Mapping Crime
Crime is violation of acts that are socially accepted. Crime may cover
burglary, murder, sexual assault or any other criminal activity which are not
authorized by regulations. Where crime incident happens is a spatial
phenomenon but has diverse motives and factors in their occurrences.
Osborne and Wernicke (2003) state that among several reasons, mostly,
sociological and economic factors affect the execution of crime. More
specifically, these causes could be explained by unemployment, educational
level, race, ethnicity, and so forth. Why crime occurs and factors involved for
criminal activity are beyond the scope of this study. However, fast and reliable
aggregation of crime data is meeting point of this study.
Boba (2005) defines crime mapping as a procedure using GIS to conduct
spatial analysis of crime problems and police-related issues. The author
clarifies crime mapping as a subdiscipline of crime analysis which has three
main functions. The first one is to facilitate visual and statistical analysis to
unravel the spatial nature of crime. The second one is to provide a link to
unlike data sources on common geographic variables (e.g. demographic
information etc.). And the last one is to produce maps that help to
communicate for analysis results.
Maps are the abstraction of true reality of surface. Geographic components
and patterns may diverge on demanding mapping applications. When not
cartographically represented, crime data only contain information about
incident type, address, offender, and victim status. Generally, this information
in hardcopy materials could be inadequate and misleading without location
information. However, such data in maps can give the decision makers a
definite advantage, that is- a spatial insight. Harries (1999) states that crime

9
maps were first used as pinned maps in New York City Police Department in
the early 1900’s (Figure 2.1). It is obvious that the decision makers in law
enforcement agencies require location of the repeated crime incidents, and
as a result crime maps are generated. Tandoğan (2005) mentions that they
had encountered the same situation before the computer mapping technology
was available for Ankara Police Department. At a glance, these pinned maps
may appear functional to track crime occurrences; however, time and the
quantity of pinpointed incidents become larger and can not be consequential
when dispersed everywhere in the map.
Figure 2.1. A Pinned Map. Baltimore Country, Baltimore Maryland (Harries, 1999)

10
Effective map interpretation has always been a major aim of cartography.
This state-of-the-art map making relies on several factors for mapping the
crime data. It may not be useful when information overload maps serving
decision makers as abstraction of reality. Geographic components, interacting
with the user, must enforce the map interpreter to look for exact locations of
incidents. Eck et al (2005) state that crime is not dispersed homogenously in
the maps, but on the contrary, it piles in some areas and is not present in
others. In addition, spotting different type of incidents ultimately leads to
confusion for the map interpreter. For example, pinpointing burglary and
murder incident must be differentiated for the user navigating in the map. In
this context, decision makers must not be tackled by too much information;
instead maps must facilitate them when analyzing criminal information. In this
frame of reference, positional accuracy of point based data emerges as well,
because the relationship between point features depends on how close they
are. For this reason, realistic attention is needed when locating point based
crime incidents in maps.
Eck et al (2005) also point out that visualization of crime patterns varies long
with the underlying theories. It is quite acceptable that each type of crime
incident requires a different theory. For example place, street and area
theories of crime can be depicted by typical point, line or polygon features of
GIS. This issue puts forward cartographic mapping principles to pinpoint
numerous crime incidents types, because map interpreters must distinguish
these patterns when navigating in a map. Therefore, a crime map with a well
defined theory can help decision makers in the law enforcement agencies
effectively. Creating cartographically appealing maps also needs accurately
stored data.
In predictive and statistical level of crime mapping applications, accuracy and
data preparation issues come forward as well. Corcoran and Ware (2002)

11
state that in order to meet the initial requirements of their neural network
implementation called COPDAT, preprocessing of raw data must be accurate.
Their artificial intelligence study looks for hidden places to generate future
prediction of crime patterns. It is obvious that by using more accurate data the
system can retrieve more consequential results. Therefore, it can be declared
that not only governmental but also research levels of applications require
accurate data in crime mapping.
Since crime incidents occur depending on time and space, and are dynamic,
they should be mapped accordingly. Geographic profiling of crime incidents
requires work and cost load for governmental and institutional levels. Helms
(2002) mentions that not counting the prerequisite correctly formatted
reference map, incident locations still entail spatially correct address
matching. Moreover, producing crime maps in weekly, monthly or for a
specific period of time requires a maintainable procedure. As can be
observed, crime has a dynamic structure and requires mapping in specific
time intervals. In this way, spatial movement of crime patterns can be
correctly identified. While evaluating crime displacements in temporal
intervals, decision makers can develop a knowledge base for certain
jurisdictions.
In order to answer the mentioned statements, Boba (2005) proposes five
steps in a typical crime analysis process (Figure 2.2). These are data
collection, data collation, analysis, dissemination of results, and incorporation
of feedbacks from users. The author emphasizes that data might come from
many sources such as police officers, call-for-service dispatchers, community
service officers, census workers and geographers. For example, Ankara
Police Department, in most cases, collect their data from police officers.
Tandoğan (2005) mentions that their basic data collection is to retrieve
longhand materials which are written by clerks in each police station.

12
Inputting incidents reports directly to the computer is done by technician(s) in
the main center. In this framework Boba (2005) argues that the officers
dictating data entry procedures, as well as the care by taken individuals who
implement the procedures, are crucial to crime analysis because they affect
both the quantity and the quality of the data and subsequent analysis. In
addition to providing consistency, data must be in electronic format and
collected regularly, because paper copies are time consuming to crime
analysts and are not useful for immediate results.
Figure 2.2. The Crime Analysis Process (Boba, 2005)
Collection
Collation
Analysis
Dissemination
Feedback
Data
Modification
Subcycle

13
In the data collation process correction of inconsistent data is accomplished.
In addition, geocoding of recent incidents are combined with the actual
database. There are various statistical and visualization techniques
performed in the analysis phase of the process. After retrieving results from
analysis collation step might suggest new improvements for data collection
step. These first there steps iteratively work with each other to retrieve results
and may create new policies for crime mapping and analysis.
The fourth step dissemination is to communicate the results with various
types of audiences. These reports could be paper reports maps,
presentations, internet documents. Finally, in the feedback step the crime
analysis process retrieves response from the audience of the usefulness of
their analysis for decision making.
2.2. Types of Crime Mapping and Analysis using GIS
Geographic profiling of crime can now be accomplished with more robust
digital maps together with advanced database functions. Within GIS not only
can crime incidents, offender and victim status be digitally displayed, but also
their attribute information can be aggregated for retrieval operations. Police
departments use these features to determine the patterns of crime, analyze
historical events, produce crime atlases, and also predict feature events.
Crime mapping and analyses are distinguished as to where they are
specifically used and to whom they serve for decision making. There can be
several reasons behind this, because each law enforcement agency would
have different approaches to command, control and prevent crime. According
to Ahmadi (2003), who is inspired from Hirschfield and Bowers (2001), there
are six types of crime analysis techniques. These are tactical, strategic,
14
investigative, operations, intelligence, and academic crime analysis. Each
type has its own objectives and characteristics for crime mapping and
analysis.
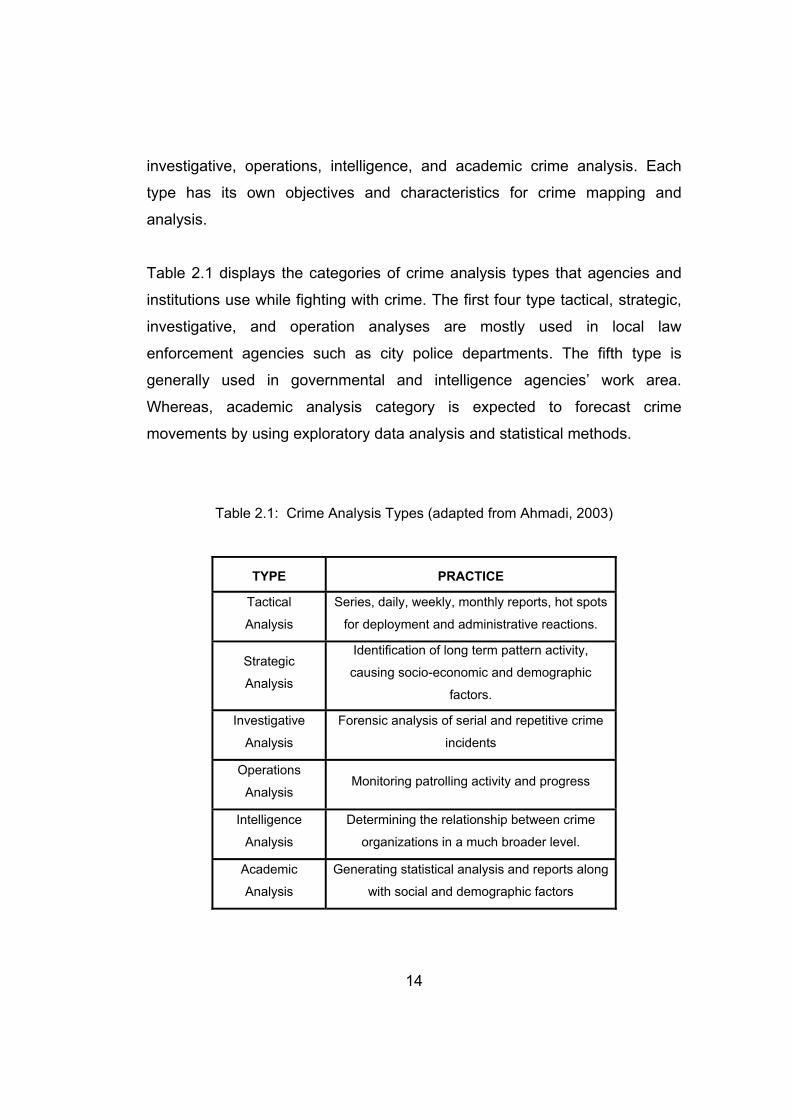
Table 2.1 displays the categories of crime analysis types that agencies and
institutions use while fighting with crime. The first four type tactical, strategic,
investigative, and operation analyses are mostly used in local law
enforcement agencies such as city police departments. The fifth type is
generally used in governmental and intelligence agencies’ work area.
Whereas, academic analysis category is expected to forecast crime
movements by using exploratory data analysis and statistical methods.
Table 2.1: Crime Analysis Types (adapted from Ahmadi, 2003)
TYPE PRACTICE
Tactical
Analysis
Series, daily, weekly, monthly reports, hot spots
for deployment and administrative reactions.
Strategic
Analysis
Identification of long term pattern activity,
causing socio-economic and demographic
factors.
Investigative
Analysis
Forensic analysis of serial and repetitive crime
incidents
Operations
Analysis Monitoring patrolling activity and progress
Intelligence
Analysis
Determining the relationship between crime
organizations in a much broader level.
Academic
Analysis
Generating statistical analysis and reports along
with social and demographic factors

15
Putting more focus to accurate data acquisition techniques, this thesis study
concentrates on improvements of tactical crime mapping and analysis. Oatley
and Ewart (2003) outline crime analysis software capabilities by stating
general demand on incident based crime maps. They point out the
importance of quantitative methods while investigating crime movements by
giving an example of vehicle theft displacements over time. In addition, the
authors emphasize the importance of statistical summaries of time while
defining the movements of crime. This example shows the basic structure of
tactical crime analysis software that law enforcement agencies use.
Instead of scrutinizing the deeper meanings of each practice, it is better to
determine the relationship between these analyses and GIS. Performing GIS
operations apparently must have spatial data, and therefore, the question
must be formulated as follows: How can crime incident data be obtained and
how is it used for analysis? GIS can collect and manipulate spatial data as
well as analyze them. From this definition, Osborne and Wernicke (2003)
state that GIS can serve crime analysis in order to collect, edit and examine
the crime information.
As GIS stores attribute data in point, line or polygon based forms, crime
incident information can be pinpointed with these types of representations.
Hirschfield and Bowers (2001) state that when it is polygon based it contains
demographic information, such as census based data and neighborhood
information in order to compare with land use, socio-demographic concerns
and environmental criminology. Whereas, line data type could be used to gain
information of distance between a specific crime incident and offenders and
victims. Point based data is most effective when it is geocoded as incident
data. In this way, they can be used for pattern analysis, hot spot and thematic
mapping. In addition, points can be used for statistical and exploratory data
analysis along with additional tools combined with GIS.

16
There are various ways in which GIS is used for data acquisition,
manipulation and retrieval operations. Within the functionality of GIS, robust
application specific platforms and interfaces can be constructed. In this way
GIS can serve as a spatial decision making tool. In addition, for effective
geocoding of incident data, web based data entry methods can be used for
crime mapping. Because mainly point based data are used in tactical crime
analysis in which dispersed incidents are displayed. In this context, both
accurate and contemporary data aggregation can be accomplished by online
mapping.
2.3. Theoretical and Practical View of Web Based GIS
Web-based GIS, in other words internet mapping, is the emerging technology
of commercial and open (non-proprietary) GIS use. Recently, web-based GIS
is applied in such issues as environmental monitoring, resource management,
land information management, utility management, mobile applications and
various Decision Support Systems (DSS) practices. As a generic approach, a
web-based GIS serves spatial data to clients within a web browser. Green
and Bossomaier (2002) point out that this data can be either static (i.e. texts,
map images retrieval system) or dynamic that allows complex geographic
analyses for decision making process. The system serves end-user requests
interactively, which are implemented by click on operations.
Yet, web-based GIS are not capable of conducting every desktop GIS
analysis; there are some basic operations that recent web technologies can
achieve. These are map-rendering functions (e.g. zooming, panning, rotating,
etc.), ad-hoc database queries (e.g. getting relevant tabular information
related to geographic features on the map, searching the database to display
a specific location, etc.), topological queries exploring which features reside

17
where, obtaining routing information by pinpointing locations, and receiving
online information for vehicles with satellite transmissions to know where they
are, called Automatic Vehicle Locator (AVL) technology. In addition to
reaching desktop GIS capabilities, a web-based GIS would allow
manipulation of data for public participation in collaborative community
planning, or environmental decision-making processes (Al-Kodmany, 2001).
Implementations of Web based GIS in crime mapping have some crucial
matters. Ratcliffe (2002) mentions ethics and mapping accuracies while
displaying crime information of victims and offenders. He states that no one
would want to know the distinctive information of a sexual offender living next
door. This point of view clearly suggests that whether crime maps should be
made available to public or not. He also points out accurate mapping of crime
incidents, and declares that dispersion of many incidents in a web map might
reflect wrong information in comparison to actual crime occurrence places.
Although Ratcliffe (2002) points out some fallacies in mapping and
distributing crime information through web, accurate geocoding of incidents
can be achieved by web-based GIS. Because, today’s online mapping
technology enables manipulating spatial data though browsers. So as to
argue this issue in geocoding, crime incidents can be pinpointed along with
users that know the exact location of crime, and accurate results can be
gathered.
Just like all information systems projects and researches, a Web based GIS
application requires a thorough requirement analysis, systems audience, and
determining the capabilities of a system. Thereby, next section tries to give
introductory information of web-based GIS architectures, techniques, and
trends.

18
2.3.1. Architectures used in Web based GIS Applications
Internet mapping development strategies differ according to application
issues, data structures, and analysis functions. Determining the system
architecture of a web-based GIS must be a preliminary step for the required
successful application. Since the user defined functions and the available
datasets are determined, a web-based GIS demands an appropriate
development platform. Peng (1998) states that there are two main
approaches applied in internet mapping, which are client side and server side
systems. Each type possesses different advantages and deficiencies.
However, within advances of technology a hybrid system called mixed server-
client side online mapping has emerged as well. Rinner (2003) states that
along with additional plug-ins in the browsers mixed server-client systems can
be proposed. Figure 2.3 illustrates a typical Web mapping application model.

19
Figure 2.3: Typical Web Mapping Application Model
(Adapted from Alesheish et. al, 2002)
In this model processing of geographic queries and serving maps are
conducted within three-tier architecture. These tiers are client, web server and
map server. The client is used to retrieve maps as image or vector file formats
through HTTP, TCP/IP requests and web server transmits client’s requests to
be processed in the map server tier. Web server mainly operates as a
mediator that sends and receives client’s requests to be processed by the
map server. At a glance, it may be perceived as mixed-client server
architecture; however, it covers all the architecture types inside. For instance,
a client can either have HTML browser or applet/plug-in installed one. To
differentiate between these three types of systems architectures, each model
is discussed below in detail.
Client Browser
Map Images
HTML,Applet, or
Other Plugins
Requests and
Retrievals via TCP/IP
HTTP
Web Server Map Server
ASP, JSP, Servlets
GIS Database

20
Takatsuka and Gahegan (2001) state that in client-side Web-based GIS,
spatial data and analysis tools are downloaded to the Web browser with plug-
ins (e.g. Applet or an ActiveX component). The plug-in, used in the browser,
enables GIS analysis in one single frame. Therefore, the application inherits
every static or dynamic function of GIS with these components. As the vector
data comes along through server, this data structure could be used in
analysis like a regular GIS functionality. This advantage allows various
geographic queries to be implemented in the component itself. Furthermore,
vector data structure allows better visualization of features, which is extremely
important to interpret digital maps with human perspective (Campbell, 2001).
In order to apply these preferences in crime mapping, a more detailed map
can be downloaded to the browser. Thereby the issue must be how effective
a crime map can serve to the clients. As the incidents are pinned to the map
as point based data in tactical crime approach, there is no need to have a
complex data structure to conduct crime mapping and analysis. Although this
capability is uniform and serves like a regular GIS application, it needs a
strong bandwidth environment as well.
In addition to this vector data download capability; Green and Bossomaier
(2002) also mention that there is no need to adhere to internet standards one
of which is the data-exchange protocol. However, it requires the client to have
a powerful computer to conduct spatial analyses. In addition to this
disadvantage, since all the spatial data and the functions are downloaded, it
would be a daunting task to acquire large amount of data in the low
bandwidth environments (Figure 2.4). Furthermore, this independent
development strategy requires a thorough software development process.
Therefore, the system usability and convenience of operability are limited to
the developer’s knowledge and experience.

21
Figure 2.4: Client Side Web based GIS Model
On the other hand, in server-side internet GIS, a web server is used to
execute all GIS analysis and map retrieval operations. Vatsavai et al. (2000)
mention that tasks can be performed on either a Web server or a GIS server.
The user executes commands with Hyper Text Markup Language (HTML)
requests while the filtered data is delivered within appropriate communication
protocols. As all the GIS analyses are conducted in the server, the system
demands a strong server to cover several end-users submits at the same
time. In addition to this disadvantage, the filtered data must be delivered as
GIF, or JPEG images, common Web graphic formats, which has rather poor
visual quality in comparison to vector file format in the client side model.
This inadequate visualization capability in the server-side model disallows
users to interpret maps effectively. To overcome this problem Zaslavsky
(2000) developed an XML-based 2D vector rendering application to address
the problem of low graphic quality. Moreover, as long as the analyses are
conducted in the server, each request must hold Internet standards (Figure
2.5), which is an important problem for data interoperability among different
data formats (ESRI, 2002). However, there is no need to have a powerful
client machine, because the client is only for displaying retrieved maps and
have click on functions. In addition to this advantage, this rather simple client
does not need extensive development strategy at the Web browser, which
Robust
Client
Web Server &
Map Server
Requires Strong
Bandwidth Data
Download
22
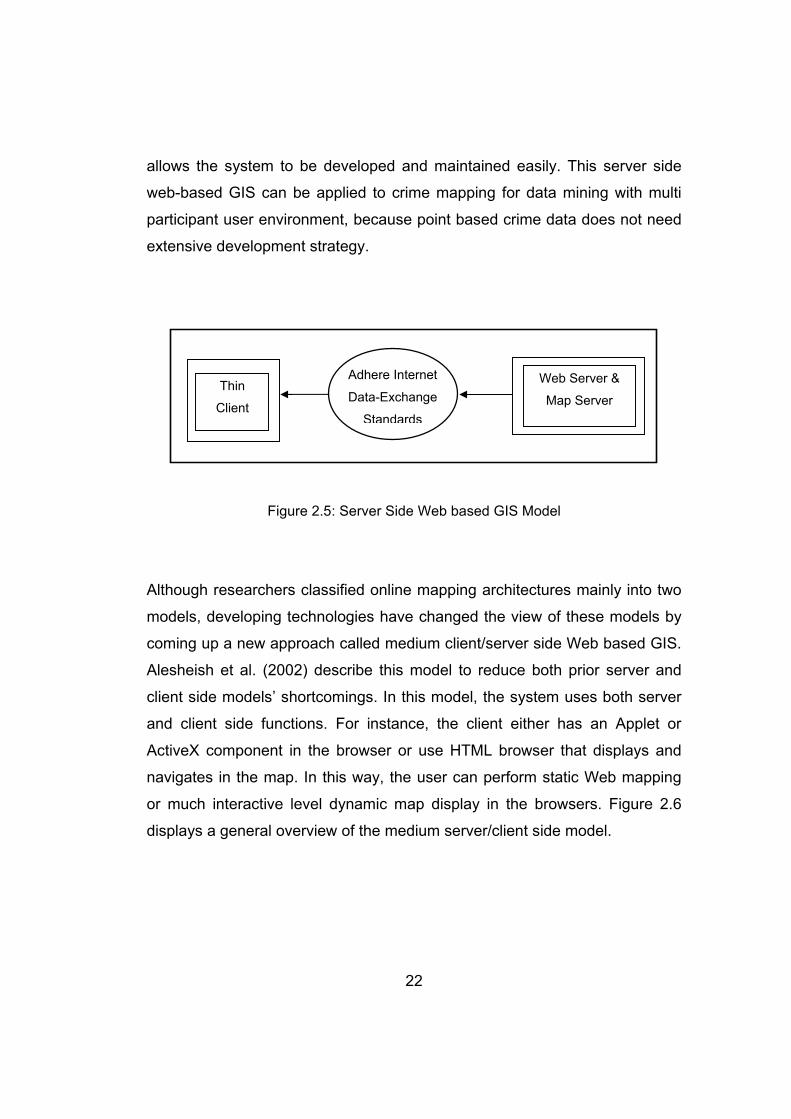
allows the system to be developed and maintained easily. This server side
web-based GIS can be applied to crime mapping for data mining with multi
participant user environment, because point based crime data does not need
extensive development strategy.
Figure 2.5: Server Side Web based GIS Model
Although researchers classified online mapping architectures mainly into two
models, developing technologies have changed the view of these models by
coming up a new approach called medium client/server side Web based GIS.
Alesheish et al. (2002) describe this model to reduce both prior server and
client side models’ shortcomings. In this model, the system uses both server
and client side functions. For instance, the client either has an Applet or
ActiveX component in the browser or use HTML browser that displays and
navigates in the map. In this way, the user can perform static Web mapping
or much interactive level dynamic map display in the browsers. Figure 2.6
displays a general overview of the medium server/client side model.
Thin
Client
Adhere Internet
Data-Exchange
Standards
Web Server &
Map Server

23
Figure 2.6: Medium Client/Server Side Web based GIS Model
In fact recent commercial Web based GIS vendors are now using this
medium client/server side processing in their applications. For instance,
MapXtreme Windows and Java allow the developers to build applications
either HTML or applet form in the browser. Whereas, ESRI’s ArcIMS
application gives the programmer the chance to choose for specific types of
developments as well. Among diverse application development environments,
one issue must be concerned as a top priority. That is determination of the
problem and systems audience and the final goal of the application. Although
authors like Ratcliffe (2002), argues that whether or not crime information
must be displayed and distributed to public, this study indicates how effective
crime can be pinpointed by the police in their private intranet platform.
Summarizing the issues and models for a Web based GIS application, it can
be argued that there are various Internet map servers operating for
displaying, manipulating and retrieving information. Since the development
platforms diverge, both open and proprietary platforms can be used to
Thin/Thick
Client
Requires Strong
Bandwidth Data
Download
and / or
Adhere Internet
Data-Exchange
Standards
Web Server &
Map Server

24
establish an online GIS. However; the application developer must choose
systems audience, required analysis, development cost and maintenance in
order to develop a maintainable Web based GIS.
In order to scrutinize typical Web based GIS capabilities in participatory
mapping, the spatial data editing functions that Web GIS should have must
be discussed. The next section discusses potentials of interactive online
mapping when serve as a crime mapping.
2.3.2. Online Spatial Database Editing Functions
Since one of the aims this study is to develop an online multi participant
application, it is better to put forward the capabilities of online mapping. It was
explained previously that if a web browser has a more complicated interface
embedded with additional plug-ins, it is a client side or client/server (medium)
side Web mapping. In these types, either vector or raster (actually vector data
in the GIS database but displayed as raster in the browsers) data can be
represented through browsers.
Point, line and polygon based editing can be functioned within online
mapping. Tabular GIS database along with the digital maps can be
manipulated as well. Researches indicated public participation could be
implemented for numerous cases in Web based GIS. Kingston et al. (2000)
compare traditional online mapping with participatory version. They state that
if public joins in the planning process, it is much more applicable and effective
for community planning. Instead of using server side environment, their
approach is implemented using Java Applets and a set of Java bean tools
called GeoTools for GIS based functions and internet mapping. While
navigating in the map, text input can be done for the selected area. This

25
approach could be used in crime mapping as well, and when a user pins the
digital map, a text input screen might come out in order to lead the user to
enter crime incident information.
Because online mapping requires participation, and thus users employ editing
functions, it would be better to give another subsequent example of public
participation using the Web. Al-Kodmany (2001) proposes a participatory
planning application in order to improve public attendance. In his research,
the system expects community to participate as sharing ideas, comments and
complaints. Figure 2.7 illustrates an example of public participation in which
people use a web browser and enters text information for geographic
components in the map. In this approach gathered data are used for analysis
in the planning process. Just like this prototype, it could be implemented in
other applications like entering point based information of crime incidents and
their tabular attribute information.
Figure 2.7: The Map-Survey Interface of the First Project: The 18th Street
Commercial Corridor, (Al-Kodmany, 2001)

26
As can be observed in Figure 2.7, users are expected to click on the specific
geographic areas and to enter comments about the place. The system uses
Oracle as a database and implements a client side online mapping using
Java Applets. At the end of the study, Al-Kodmany (2001) states the survey
results and information about the industrial area. As a result of that study,
some improvements are achieved for community planning in controlling and
regulations establishment. In contrast to that study, recent server side
interactive online mapping applications allow the developers to build such an
application as well. It is applicable for inputting text information for selected
raster images with recent server side GIS development platforms.
To sum up the spatial database editing functions within the internet, it can be
declared that maps in the browsers can be used for editing by point, line,
polygon based data structures in GIS. In addition, by entering text data,
attribute database can be expanded click on operations. Therefore,
fundamental GIS database operations can be implemented in multi
participant environment.
2.3.3. Web based Crime Mapping
Boba (2005) defines interactive crime mapping as a simplification of basic
GIS capabilities that can be accessible for novice users over the Internet. This
enables the users to facilitate a Web based GIS without having a spatial
knowledgebase. The author mentions that many police departments have
interactive Web sites where citizens or police officers can conduct basic crime
mapping for themselves. These applications basically are not flexible or
complicated enough for crime analysis, but rather useful for disseminating
crime information via Web.
27
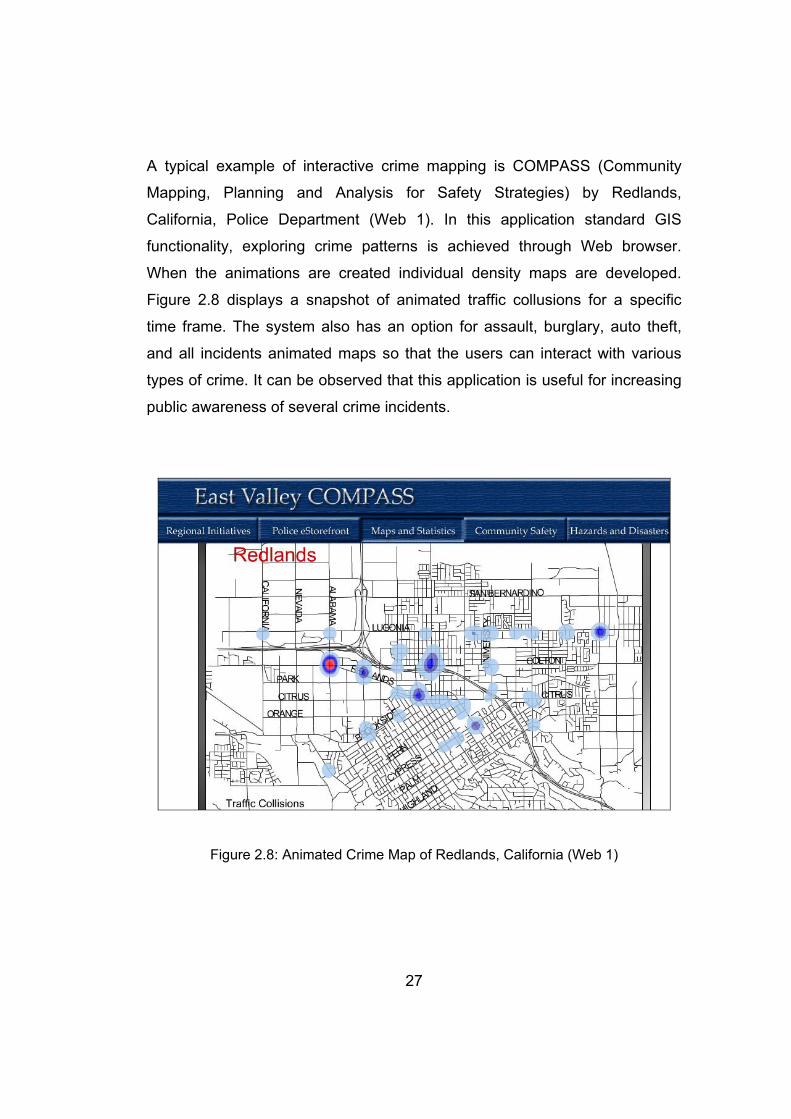
A typical example of interactive crime mapping is COMPASS (Community
Mapping, Planning and Analysis for Safety Strategies) by Redlands,
California, Police Department (Web 1). In this application standard GIS
functionality, exploring crime patterns is achieved through Web browser.
When the animations are created individual density maps are developed.
Figure 2.8 displays a snapshot of animated traffic collusions for a specific
time frame. The system also has an option for assault, burglary, auto theft,
and all incidents animated maps so that the users can interact with various
types of crime. It can be observed that this application is useful for increasing
public awareness of several crime incidents.
Figure 2.8: Animated Crime Map of Redlands, California (Web 1)

28
Another example of interactive crime mapping application is applied by
Philadelphia Police Department (Web 2). Their system crimeBase is based on
distributing meaningful information to the local community engaged in
planning, public safety and polices. This online mapping application allows
users to create maps, tables, charts, summary statistics, trends and crime
movements. The application has remarkable features one of which is to
provide creating user defined maps with color types, legends and statistical
output. Figure 2.9 illustrates an example of a user defined quantile map of
burglaries with 2000 census data. Such an application could be useful to local
community for planning and strategy development. Although, this application
provides geographic data analysis, it does not have data input capability.
Figure 2.9: Online Mapping Feature of crimeBase Application (Web 2)

29
Examples can be expanded by pointing local authorities’ works on Web
based crime mapping. Kansas City, Overland Park neighborhood is one of
such local communities that perform online mapping (Web4). Their approach
is firstly giving some background information for interpreting crime maps over
the Internet. Afterwards, their online system displays crime statistics and
distribution of certain crimes which can be accessible to interested residents.
Figure 2.10: Kansas, Overland Park Online Crime Mapping (Web 3)
Ratcliffe (2002), in his article, tries to clarify the common problem of online
mapping with a metaphor by saying “damned if you don’t and damned if you
do” in the title of his paper. This argument has a crucial importance because
it questions whether or not public has the right to be aware of what is going

30
on in the neighborhood. This study, however aims to construct a system that
provides interactive mapping benefits to only law enforcement agencies
themselves.
Unlike common public participatory methods, if crime incidents information is
published, it could affect location choices of living. This revealing information
might be useful when it is applied in community planning or site selection
together with society. However, it would be unwise when individuals of society
recognize a murder incident two blocks away from home. In the same way
Ashby (2005) indicates several arguments affect crime when concerning
population, demographics, urban-rural distribution, lifestyle of people,
socioeconomic status. In research and security based applications, this
information could reflect several useful feedbacks to prevent crime. However,
it may not be meaningful when this information is distributed to public.
In order to construct a participatory crime mapping application for police
departments, the applicability of spatial data editing functions must be taken
into consideration. Instead of publishing crime maps to public, it would be
better to distribute information throughout the agency itself. This can be
accomplished by constructing a multi participant online mapping in a private
intranet/internet platform. In this way, local police officers in Police stations
can pinpoint crime occurrences and expand the database. (Web 4) gives a
considerable example for online data entry of crime information. In this
commercialized application, interactive system allows inputting customized
Microsoft Excel and Access spreadsheets. However, this system is not
involved with geographic profiling but a regular database entry application
because there are no geographic components of this application for entering
location information.

31
Ratcliffe (2004) points out the accuracy of spatial databases by putting
forward the geocoding success of crime incidents. As the author defines
geocoding is converting location information into grid coordinates, he argues
the optimum hit rate of crime position accuracies. From this perspective of
view, it can be declared that geocoding is excessively important for crime
analysis. Instead of entering crime point information along with hardcopy
materials into map by operators, pinpointing incident data with appropriate
zoom level could increase the accuracy via online mapping.
To sum up, online crime mapping can meet the requirements of producing
crime data in any time frame with appropriate accuracy. Users are able to
enter both tabular and graphic information via web-based GIS. As this study
aims to convey some improvements for accurate and real time data
production, general demands for a successful tactical crime analysis
application can be accomplished as well. Within building level accuracy and
real time data editing of incidents, decision makers can conduct immediate
and accurate crime analyses. Therefore, it could be declared that mapping
crime with Web based approach could be time saving and cost effective in
comparison to traditional methods.

32
CHAPTER 3
SYSTEM DESIGN PROCESS
In this chapter system designed process is evaluated. This study has two
major phases to bear out online multi participant GIS and accurate geocoding
of crime incidents, offenders and victims. These phases are (1) designing of
an interactive Web based mapping system; and (2) evaluation of crime
incidents, offenders and victims data entry. The Web application provides
point based data entry along with tabular information. In this way, a single
record of crime data with location and attribute information is added to the
spatial database through a Web session. In this frame of reference, sections
in this chapter revolve around discussing major development steps and
database design and optimization of online mapping.
3.1. Introduction
Web application evaluates geocoding of crime incidents within interactive
map navigation and data entry. Users are expected to attach point based
graphic and tabular attribute information through Web browsers. These users
are required to be police officers working as clerks in the local stations.
Additionally, police officers working in the local police stations are more aware
of incident locations than the operators in the Ankara City Police Department

33
information systems division. GIS technicians in this center division certainly
can not be expected to be familiar with each street including precincts and
neighborhoods. However, police officers in the local stations might be more
responsive to these places, for the reason of being familiar with routine
working area. Therefore, they are likely to enter crime information via Web
much accurately.
Identical to most Internet mapping applications, the system also provides map
navigation and display functions including zoom leveling, pan,
selecting/deselecting the geographic components, information tool,
measuring the distance between features and layer control options.
Moreover, as a remarkable distinction of this study, the system includes point
based incidents and involved people (victims and offenders) data entry.
As mentioned above the interactive online system provides dynamic map
navigation and display. Users are either anticipated to select occurred
incident streets by a drop down menu or by simple navigation tools zooming
preferred street level. There are three sets of choices in this menu to zoom
selected street level, which are police precincts, neighborhoods, and streets.
After choosing the precinct, all related neighborhoods is appeared in the
below list box menu. Respectively, streets belonging to the neighborhood are
displayed as a final step to zoom into the crime incident place.
Major advantage of this selection method is providing dynamic segmentation
of streets. As this road network may be very long in length in some places,
the system zooms to covering neighborhood’s streets. In this way, users can
locate the crime incidents in a very short time. In addition, after selecting the
required street, surrounding buildings appear with labeled numbers in the
map. Therefore, users can easily reach the building level accuracy at the end
of this map navigation process.

34
The system also provides incidents and involved people (offenders and
victims) tabular database entry. After pinpointing the exact location of crime,
an input screen appears in the Web page. This input panel contains text and
combo boxes to enter the fields of the tabular data. The panel is also
designed to be flexible and considered to enter accurate and non-redundant
information entered into the spatial database.
Since the system provides some improvements for tactical crime mapping,
and the reason that time and accuracy is important, real time data editing is
one of the major achievements of this study. In addition, proposed online data
entry process provides sustainable GIS platform. In this way, spatial database
can stay up to date as long as the system is used.
3.2. Requirement Analysis
Law enforcement agencies develop similar tactics in crime mapping and
analysis. As mentioned in the previous chapter, there are several crime
analysis types that benefit from GIS. Since Ankara Police Department utilizes
GIS for tactical crime mapping and analysis, accurate and consistent spatial
database production is a vital claim in their applications. In this context, this
law enforcement agency produces data for hot spot mapping and analysis to
monitor temporal activity. Therefore, the spatial database must be carefully
evaluated and designed. In this study, current spatial database of Ankara City
Police Department is optimized for effective tactical crime mapping and
analysis. Some of the redundant fields are removed from their previously
designed system, because they are no longer needed for standard GIS
retrieval operations. Further, optimized relational database tables are
discussed for Ankara City Police Department.

35
Ankara City Police Department utilizes GIS database in 5 distinct layers.
These are:
• Point based crime incidents
• Point based involved people
• Line based road network
• Polygon based precincts
• Polygon based buildings
The GIS dataset includes these layers in MapInfo Professional format. Each
layer has distinct attribute information in which contains fields about crime
incidents within appropriate data types. In police precincts (Mıntıka) layer,
police station names are recorded as precinct names in the spatial database
(Table 3.1). This layer is utilized as a base map for navigating and pinpointing
crime incidents and involved people point based data. Whereas, in the crime
incidents and involved people layers are used to fetch new attribution
information of incident types, when it occurred, database unique identifiers
and so forth. Detailed information about containing fields of each table is
given in Table 3.1, Table 3.2 and Table 3.3.
Table 3.2 includes the following optimized fields:
1) OLAYNO (Incident Number): This column records contain unique numbers
that are automatically assigned by the developed system. Provided by this
process, consistency of the spatial database is achieved.
2) BUROKOD (Crime Branch): This field contains data about related crime
branch’s incidents. These are auto, missing, robbery, murder, morality, and
usurp branches.
3) ILCE (District): This field contains district information about where the
incident in question takes place.

36
4) KARAKOL (Police Station): This column includes one of the 47 district
names in which the crime incidents take place.
5) OLAY (Crime Incident): This field encloses crime incident information that
is related to crime branch field. Each crime branch has its own crime type
data entry. These are:
• Auto: Theft from car and car theft
• Missing: Missing person
• Robbery: robbery from spike, breach of trust, robbery from home, stealing
animal, robbery, safe breaking, robbery from coalbunker, robbery from
temple, robbery from official office and robbery from office. • Murder: Self-inflicted wound, abduction, wound, carnal abuse, murder and
suicide. • Morality: Prostitution, solicitation of chastity and gambling.
• Usurp: strike, usurp, claim of usurp, resist officer in charge, insult and threat,
harming, sabotage, kidnapping, constructive breaking into a house, auto
shooting, indecent assault, threat, claim of distorting money, raise a stink and
office shoot.
6) OLAYTAR (Incident Date): This field contains information about date of the
incident.
7) OLAYGUN (Incident Day): This field contains information about which day
the crime occurred.
8) OLAYSAAT (Incident Time): This field encloses information about when
the crime occurred in a day time.
9) OLAYMAHAL (Crime Place): This column includes information about
where the crime takes place such as construction yard, on the street, in
home, main road, public place, official institution, mall, parking space, bar,
(ATM) cash machine and club.
10) OLAYNEDEN (Crime Reason): This field includes information about the
reason of crime. These are; argue bad language, alcohol, matrimonial affairs,
pecuniary problems and enmity.

37
11) SUCYONTEM (Crime Method): This column contains information that is
related to crime incident types. In this frame of reference, crime methods are
defined as:
• Theft from car: By matching up a key to lock, from baggage, taking out
window, stealing auto tire and tire rim, breaking window, using pallet, using
screwdriver and other types. • Car theft: By matching up a key to lock, entering open door, short circuit,
breaking window and other types.
• Missing person: Male, female and teenagers.
• Robbery from spike: By matching up a key to lock and jimmying the door.
• Breach of trust: Other types.
• Robbery from home: By matching up a key to lock, breaking padlock,
entering open window, entering balcony, breaking window, ripping out the
window, jimmying, kicking and other types. • Stealing animal: Other types.
• Robbery: Matching up a key to lock, jimmying the door, from construction
yard and other types.
• Safe breaking: By jimmying and matching up a key to lock.
• Robbery from coalbunker: By jimmying and matching up a key to lock.
• Robbery from temple: By jimmying and matching up a key to lock.
• Robbery from official office: By jimmying and matching up a key to lock,
breaking padlock, entering open window, and by taking out window bar. • Robbery from office: By jimmying and matching up a key to lock, breaking
padlock, and entering open window.
• Self-inflicted wound: By using cutters.
• Abduction: Other types.
• Wound: Other types.
• Carnal abuse: By striking and other types.
• Murder: By using a firearm, cutter and other types.
• Suicide: By grafting, other types.

38
• Prostitution: By arranging and other types.
• Solicitation of chastity: By arranging and other types.
• Gambling: Other types.
• Strike: By striking and other types.
• Usurp: By threatening with a knife, by threatening with a gun, by striking and
other types.
• Claim of usurp: By using a fake gun, using spray, threatening with a gun and
other types.
• Resist officer in charge: Threatening with a gun, threatening with a knife,
striking and other types.
• Insult: Other types.
• Threat: By threatening with a gun, threatening with a knife, striking and other
types.
• Harming: By striking and other types.
• Sabotage: Other types.
• Kidnapping: Other types.
• Constructive breaking into a house: Other types.
• Auto shooting: By a pistol, and other types.
• Claim of distorting money: By threatening with a gun, threatening with a
knife, striking and other types.
• Raise a stink: Other types.
• Office shooting: By a pistol, and other types.
12) OLAYDUR (Crime Incident Situation): This field contains information of
crime incident situation where is the suspect is known or not.
13) ADRESMAH (Neighborhood Name): This field includes neighborhood
information where the occurred crime incident takes place.
14) ADRESSOK (Street Name): This field includes street information where
the occurred crime incident takes place.
15) ADRESBIN (Building Number): This field includes building information
where the occurred crime incident takes place.

39
16) ADRESDAI (Apartment Number): This field includes apartment number
information where the occurred crime incident takes place.
Table 3.3 includes the following optimized fields:
1) OLAYNO (Incident Number): Unlike crime incidents attribute database
table, OLAYNO field is not assigned as unique in involved people table. This
time crime incident number column is expected to be entered manually to the
spatial.
2) KARISANNO (Involved Number): This column records contain unique
numbers that are automatically assigned by the developed system. Provided
by this process, consistency of the spatial database is achieved for involved
people numbers.
3) SAHISNO (Person Number): This column records contain unique person
numbers that are automatically assigned by the developed system.
4) SAHISDUR (Person Status): This field gives information about whether the
involved person is offender or victim.
5) UYRUK (Nationality): This field contains the nationality information.
6) ADI (Name): This field contains the name of the involved person.
7) SOYADI (Surname): This field contains the surname of the involved
person.
8) BABAADI (Father’s Name): This field contains the father’s name of the
involved person.
9) LAKAP (Nickname): This field contains the nickname of the involved
person.
10) DOGYER (Place of Birth): This field contains the birth place of the
involved person.
11) DOGTAR (Date of Birth): This field encloses the date of birth of the
involved person.

40
12) NUFILI (City of Birth Registration): This field encloses the city of birth
registration information of the involved person.
15) NUFILCE (District of Birth Registration): This field encloses the district of
birth registration information of the involved person.
16) NUFKOY (Neighborhood of Birth Registration): This field encloses the
neighborhood of birth registration information of the involved person.
17) OGDUR (Education): This field contains the education level of the
involved person.
18) VATNO (National ID number): This field contains the national
identification number of the involved person.
19) CINSIYET (Gender): This field contains the gender of the involved
person.
20) ALISKANLIK (Habit): This field contains information on whether the
involved person has a bad habit or not.
21) SABIKA (Previous Conviction): This field contains information on whether
the involved person has previous convictions or not.
22) MESLEK (Occupation): This field contains the occupational information of
the involved person.
23) YAKTAR (Date of Arrest): This field contains date information of arrest.
24) YAKYER (Place of Arrest): This field contains place information of arrest.
25) TUTUKLAMA (Arrest): This field contains date information of arrest.
26) YAKALANMA (Capture): This field contains information of whether the
involved person is currently free or under custody.
27) ALKOLDUR (Alcohol Situation): This field contains information of whether
the involved person is drunk or not in the incident time.
28) ADRESILCE (District): This field includes district information about where
the involved person stays.
29) ADRESMAH (Neighborhood): This field includes neighborhood
information about where the involved person stays.

41
30) ADRESSOK (Street): This field includes street information about where
the involved person stays.
31) ADRESBIN (Building Number): This field includes building number of the
involved person residence.
32) ADRESDAI (Apartment Number): This field includes apartment number of
the involved person residence.
Table 3.1: Police Precincts Attribute Database Table (Mıntıka Layer)
ID KARAKOL ILCE ALAN
Table 3.2: Crime Incidents Attribute Database Table (Olay Layer)
OLAYNO BUROKOD ILCE KARAKOL
OLAY OLAYTAR OLAYGUN OLAYSAAT
OLAYMAHAL OLAYNEDEN SUCYONTEM OLAYDUR
ADRESMAH ADRESSOK ADRESBIN ADRESDAI
Table 3.3: Involved People Attribute Database Table (Karışan Layer)
OLAYNO KARISANNO SAHISNO SAHISDUR
UYRUK ADI SOYADI BABAADI
LAKAP DOGYER DOGTAR NUFILI
NUFILCE NUFKOY OGDUR VATNO
CINSIYET ALISKANLIK SABIKA MESLEK
YAKTAR YAKYER TUTUKLAMA YAKALANMA
ALKOLDUR ADRESILCE ADRESMAH ADRESSOK
ADRESBIN ADRESDAI

42
The information systems division in Police constructs database layers within a
relational database model. However, there are some problems in this model.
For instance, crime incidents and involved people tables contain redundant
fields that must be repeatedly entered into the database. In addition, choosing
some of the fields as the primary key for GIS analysis might lead to errors in
the analysis step. In their system there is no consistent entity relationship
(ER) diagram and it is the programmer’s choice when developing a crime
analysis system. Incidents and involved people tables contain several similar
fields which could lead to redundancy in the analysis.
On the contrary, this study chose some of the fields as the primary key for
relational model. Crime incidents table holds OLAYNO and KARAKOL for
creating relation between involved people and district table because of the
reason that involved people layer contains OLAYNO field in the table, whole
relations can be constructed between, districts, incidents and involved people
layers. Therefore, this system enables not only to construct a mapping
system but a crime analysis application for the further step of this study.
Figure 3.1 illustrates a consistent database entity-relationship schema for
effective database practice. In this diagram there is a one to one (1:1)
relationship between crime incidents and district layer: Because each crime
incident occurs in one district. Whereas, involved people layer contains at
least two people for each crime incident and district, who are offenders and
victims. However, it may contain more than one victim and offender as well.
Therefore, there is one to many (1:M) relationship between crime incidents
and involved people. In addition, involved people layer may contain more
than one district, because there is no relationship between offenders and
victims before the crime occurs. Thus, it can be declared that each involved
person may overlap more than one district which provides a many to many
(M:M) relationship in the entity relationship diagram.

43
Figure 3.1: Entity Relationship Diagram of Crime Database
Crime Incidents
(Olay) Layer
Involved People
(Karışan) Layer
Precincts
(Mıntıka) Layer
1
1M
1
Occur Have
MMContain
OLAYNO Other Fields
KARAKOL
Other Fields
Other Fields
OLAYNO
KARAKOL

44
Spatial database tables cover up information regarding base map, crime
incidents and involved people dataset layers. In the current system, incidents
and involved datasets are expanded by the operators within a semi-
automated geocoding interface in the center division of Ankara City Police
Department. Hardcopy files are received by the center division periodically. A
technician in that division produces this data into tables by entering each
field. This is achieved by a tabular data screen interface in which semi-
automated geocoding process is also conducted. The system pinpoints data
without a mapping screen. As was mentioned previously, this geocoding
interface inserts redundant fields because currently designed spatial
database includes unnecessary location information fields, repetitive unique
identifiers and so forth. Thus, this study eliminates this redundant information
in order to facilitate and effective spatial database for crime mapping
application.
In the current system, also geocoded data is pinned in the center of the street
lines no matter the building number indicates at the end or start of the street
line segments, because the semi-automated system cannot refer to the crime
location with building information. Eventually, this shortcoming can lead to
high positional errors for further tactical crime analysis step. However, on the
contrary, this study’s Web based data entry system locates the crime data by
pinpointing in the exact place where the crime occurred. In this context, to
evaluate this failure, accuracy testing of the geocoded data for the current
and the proposed Web based system is compared in the next chapter of this
study.

45
3.3. System Development
System development initiates with selecting appropriate hardware and
software.
Hardware:
Pentium Intel® Centrino Mobile Notebook
512 Megabytes RAM
~ 1728 MHz Speed CPU
Software:
Windows XP Professional: Operating System
Internet Information Services (5.1): Web Server
MapXtreme 2004 Version 6.0: Application (Map) Server
Microsoft Visual Studio .NET 2003: Web Development
Microsoft Access: Relational Database Development for Initial Data Input
MapInfo Professional Version 6.0: Data Preparation and Evaluation
The application employs server side architecture with a proprietary GIS
MapXtreme® 2004 as application (map) server and Microsoft® Internet
Information Services (IIS) 5.1 as Web server together performing online
mapping functions. Figure 3.2 displays organization schema of online crime
mapping that is utilized for crime analysis and spatial decision making as the
final step. Since the system provides a regular server side Internet GIS, Web
and map servers work incorporated to supply the client requests. These
requests are click on operations in the map for retrieval, ad hoc database
query and insertion functions. When the client requests a HTTP course of
action, the system first processes required task in the Web server, afterwards
transmits it to map the server to render the final map.

46
Once the user enters geographically located tabular data, the system
commits this as a new fetched record to the Microsoft Access database.
Afterwards, recently added data can be imported to MapInfo Professional GIS
database with geographic location components. This is achieved by storing X
and Y geographical coordinates as column information in Microsoft Access
Database. These coordinates are obtained from converted Web Map
coordinates in to real geographic coordinates. In this way, produced data can
be used for customized tactical crime analysis operations and spatial decision
support. This organization schema is designed to serve as a spatial decision
support for crime analysis in a law enforcement agency using GIS.
Figure 3.2: System Overview
MapXtreme
Application (Map)
Server
IIS 5.1
Web Server
Microsoft
Access
Database
Client
MapInfo
GIS
Database

47
3.3.1. System Components
MapXtreme 2004 version 6.0 as a proprietary MapInfo GIS vendor product
contains object model for client/server and Web applications. This application
development tool has core components working incorporated in Microsoft
Visual Studio.NET platform. Within this flexible and scalable development,
successful and powerful solutions can be created for visualization, mapping
and location analysis. MapXtreme is built on top of .NET architecture and
utilize the functionality of this infrastructure.
The object model contains a number of namespaces. Each namespace
includes a set of related classes. Some of the more commonly used
namespaces are (MapXtreme Developers Guide, 2004):
• MapInfo.Engine
• MapInfo.Mapping
• MapInfo.Data
• MapInfo.Geometry
• MapInfo.Styles
• Mapinfo.Tools
• MapInfo.Windows.Controls
• MapInfo.Web.Controls
Figure 3.3 illustrates the MapInfo MapXtreme 2004 architecture. The
MapInfoCoreEngine.dll and MapInfo.CoreTypes.dll contain most of the core
data visualization and access functionality. Controls and tools are built on top
of the core engine for specific types of deployments. Any application can be
created from the MapXtreme 2004 object model is built on top of the
MapInfo.Windows or MapInfo.Web namespace.

48
Figure 3.3: MapXtreme 2004 Architecture (MapXtreme Developers Guide, 2004)
The study utilizes MapInfo Web controls and components in .NET
development. The solution is created under the name of CrimeXtreme project.
It contains MapXtreme Web User Interface controls, Global ASP.NET session
protocols and Web Config references. After choosing appropriate visual
development within MapXtreme Web application, some of the files are
generated by default in the Web root folder. Some of these are system
runtime and others are design time components. In order to clarify the point
based data entry process, this chapter mentions Web form and data entry
functions.

49
3.3.2. Server Side Model
The system is designed to serve multi client network that utilizes Web
browsers with HTML requests. These thin clients conduct basic click on and
mouse over operations for interaction and data entry. In the server side
processing, GIS vector database is converted into basic raster based images
(e.g. Graphic Interchange Format) files to be displayed in the browser.
Therefore, within low bandwidth environments users can send and retrieve
maps easily. In fact, these raster based images are the representations of
vector maps displayed in the browser. Original data are always kept in
standard GIS vector format aside in the server.
The system is planned to serve multiple clients, clerks in the police stations,
to work with one single database. In order to make session management
easier, MapXtreme Web application provides several ASP.NET protocols
running concurrently with pooling process. In this way, several requests
running at the same time are controlled by MapInfo session engine instance
which actually maximizes CPU utilization by reducing thread context
switching.
Figure 3.4 illustrates a typical Web session practice during data entry
process. When the user finalizes the map manipulation and pinpoint crime
incident with tabular information, the features are inserted permanently in the
Microsoft Access database. Herein, IIS Web server functions as a mediator
between MapXtreme application server and the user’s ASP.NET requests. In
this way, MapXtreme provides the geographic components for a required
level of mapping. MapXtreme application server; indices, binds, and displays
features, and implements geographic functions as a mapping control working
at the server side.

50
Figure 3.4: Server Side Model
3.3.2.1. Map Server Application Development
In this section application specific developed codes and instances are
discussed. These are Web form and new incident tool files including
procedures and functions. Codes are developed for session management
and customization of system references for point based tabular data entry
through Web. During the ASP.NET development, some of the files are
modified and others are created for entering point based crime incidents,
involved people (offenders and victims) including tabular attribute information.
In order to give background information of map server development,
customized files are explained briefly. However, so as to put some of the
crucial file contents forward, source codes are given in appendices section.
Code contained files have several repeated lines and routines so that they
are summarized to give background information for map server application
development. Moreover, point entry development process is the same for
Client 1
ASP.NET
Requests
Client 3
Client N
MapXtreme
Map Server
IIS
Web Server
Client 2

51
incidents and involved people. Therefore, only incidents entry process related
source codes are given in the appendices section.
In the Web form (WebForm1.aspx) file, crime map constants, user interface
instances, styles, and map engine protocols are declared first (Appendix A.).
Map control, toolbar, and layer control objects are inserted in the main Web
page WebForm1.aspx file. Default zoom level and centric coordinates of
crime map are defined for map control. It is important to display the map in
predefined zoom level and coordinates to extent the entire map display in the
browser. Toolbar definitions are declared to work incorporated with map tools,
session variables, and menu items. In addition layer control functions
including layer name, visibility and selection and label names are defined.
This allows users to change the properties of the layers in the map (e.g.
whether a layer is visible, labeled, etc.). Moreover, application paths of virtual
directory and map image directory are defined within routines for tracking
error codes and descriptions.
Toolbar functions are created to perform navigation, display and mapping
operations. These tools are pan, zoom in, zoom out, add point incident, add
point involved (offender and victim), clear selection, information and
measurement tool. Each tool works in sequence with others, and therefore
functions in the map with on mouse over, on mouse up, and on mouse down
events.
New incident tool (NewOlayTool.aspx) file, commit and canceling functions of
pinpointing operation are declared first (Appendix B.). Client side methods for
mouse over operation instances are declared for user interaction. Working
incorporated with WebForm1.aspx file, all purpose generalized HTML block
structures are defined to enter both graphical and tabular information of crime

52
incidents. These procedures are created for offenders and victims with the
same application development methods as incidents data entry file.
Designed application allows multi participant data editing for Ankara City
Police Department intranet called POLNET. The system’s concurrent access
capability is limited with Microsoft Access and MapXtreme database
management protocols. In this context, other database management systems
can be used to constructs a multi participant platform.
3.3.2.2. Client Interface
Client interface is designed for interactive Web based map navigation and
data entry through browsers. Like all HTML applications this interface
executes user commands to perform online mapping. Figure 3.5 illustrates
initial map interface of the application. This interface is developed to be
utilized as a regular desktop GIS functionality for mapping point features. The
initial mapping screen shows a tool bar for navigation, information gathering
and pinpointing crime incidents and involved people buttons. This client
interface is designed by considering human computer interaction
shortcomings which are false data entry, lack of focus on the map and so
forth. As the system proposes consistent and accurate data production, this
Web interface has restrictions with combo and list boxes that provide precinct,
neighborhood and street selection tools as well. Moreover, there is a layer
control panel for layer visibility and user defined zoom level options.

53
Figure: 3.5 Web System Designed Interface
3.3.3. Functions of the system
WebForm1.aspx operates main display page and all the operations are
carried out through this file. There is a map control for displaying and
providing mouse over interactivity. In addition, a drop down menu tool is near
the map control on the condition of user to navigate in the map and locate the
point data. Moreover, there is a layer control panel which allows users to
display selected layers of crime incidents, involved people, districts, precincts,
neighborhoods and roads selection to locate the exact position in the street.
In order to constitute a flexible user interface, some constraints are provided
to minimize the user’s possible mistakes in graphical and tabular data

54
entrance. In this framework, users are restricted to enter accurate spatial data
by locating the selected streets. In addition, the tabular data entry screen has
some limitations to input consistent information. This is achieved by automatic
numbering of incident numbers, and combo box constraints. Moreover, the
location column names are generated from the pinned point location
automatically. This process enables a time saving process to enter the
location information to the spatial database.
Operations including map generation, display, navigation, and pinpointing
incidents and involved people are discussed in the following sub-sections of
this chapter. Provided with the illustrative figures of graphical user interface,
general outlook of developed application is given for interactive online crime
mapping.
3.3.3.1. Map Generation and Display
Human computer interaction initiates when the digital map first appears in the
browser. In this frame of reference, it is important to consider user
requirements during map generation and display. The initial interface is
shown in Figure 3.6 in which users are allowed to interact with the
components of the system. When the Web page initializes, complete map of
the study area is displayed first. Users are expected to locate crime data with
interactive tools provided by the system. This online crime mapping
application is intended to be utilized by the officers working in the local police
stations of Ankara. Thereby, it is designed to be user friendly and flexible
while performing mapping operations.

55
Figure: 3.6 Initial Map Display with Layer Control and Toolbar
3.3.3.2. Navigation
The drop down menu near the map control includes police precincts,
neighborhoods and streets selection options that users locate to the required
zoom level and pinpoint the crime data. Figure 3.7 illustrates precinct,
neighborhood and street selection click on operation in which user is
redirected to desired zoom level of streets. The advantage of dynamic
segmentation process enables users to zoom into preferred streets in the
covering neighborhood. In this way, users might not mix up different
segments of the streets. Moreover, as the user zoom into desired street,
buildings layer is appeared with labeling their number information.

56
In addition to this selection, users may pan, zoom in and out and re-center
the map for required locations on the map. There is a measurement tool that
provides point to point distance calculation as well. This tool might be useful
while pinpointing crime incidents, because the user would want to pinpoint
crime data from a specific location or a landmark. Moreover, it might be
needed to locate a point in a place that the spatial database does not have
building number information. Therefore, the system allows maximizing the
location accuracy of pinpointed incidents.
Figure: 3.7 Precincts, Neighborhood and Street Selection Tool

57
3.3.3.3. Incident Data Input
Main aim of the Web application is to enter crime information through multi
participant user environment. As an alternative to the existing data production
of Ankara City police department, it is intended for police officers using the
Web and input crime information via browsers. Data entry process is
conducted by using MapXtreme and Microsoft Access database connection.
Points are inserted to the Microsoft Access with geographical coordinates.
These are converted screen coordinates with Latitude and Longitude
information. In this context, newly created points are added to the spatial
database. In addition, they can be used in analysis by the time they are
inserted. Therefore, real time data production is established within this
application.
There are incident and offender-victim input buttons that a user clicks after
pinning the point based crime data. After pinning operation, a tabular
information entry screen appears including text, date and combo boxes for
input process. In addition, it also has canceling and save options to finalize
the entry. Some repetitive fields are saved as null while entered in the
database. In order to improve flexibility and to enter crucial information for
spatial decision making, this study uses limited number of data for entry.
Figure 3.8 displays tabular input panel for point incidents. As can be observed
from the illustration some of the fields are generated automatically and others
are entered iteratively from combo boxes. Fixed with selection of crime
incidents, related crime methods appear in the following combo box. In
addition, some spatial fields are generated automatically such as district,
precinct and neighborhood. Since the user is redirected to the located crime
incident, pinpointed data inherits spatial information from geographical
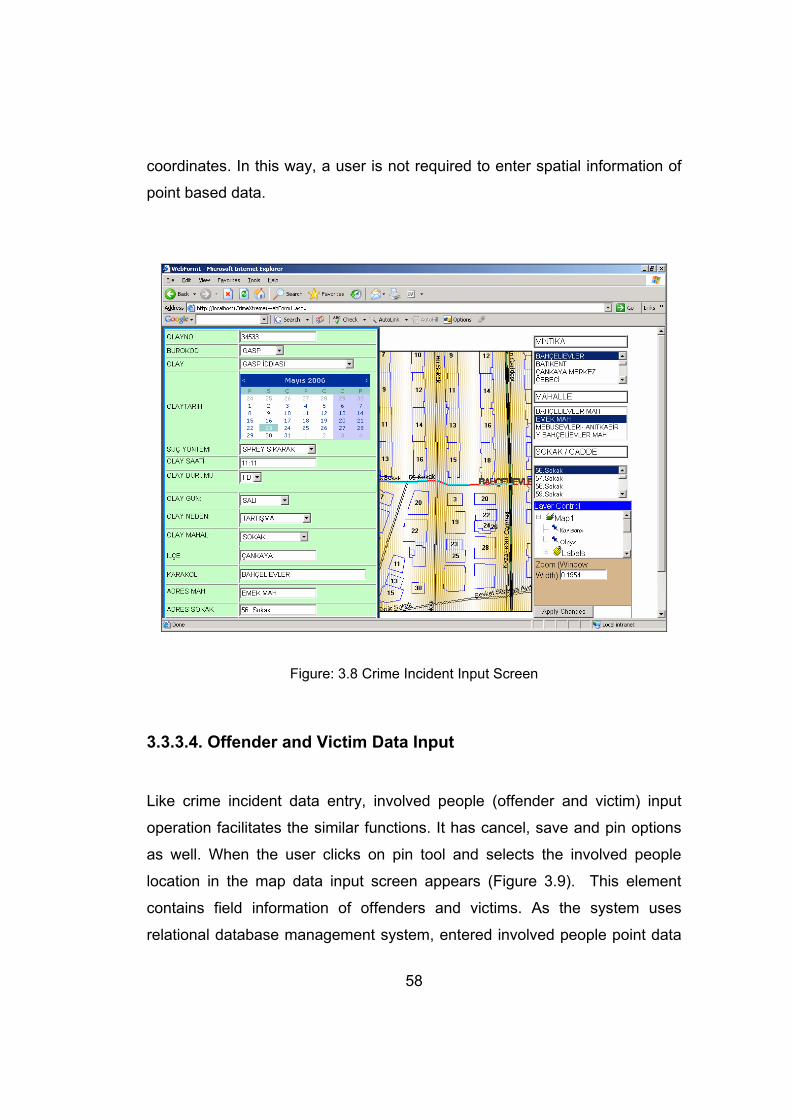
58
coordinates. In this way, a user is not required to enter spatial information of
point based data.
Figure: 3.8 Crime Incident Input Screen
3.3.3.4. Offender and Victim Data Input
Like crime incident data entry, involved people (offender and victim) input
operation facilitates the similar functions. It has cancel, save and pin options
as well. When the user clicks on pin tool and selects the involved people
location in the map data input screen appears (Figure 3.9). This element
contains field information of offenders and victims. As the system uses
relational database management system, entered involved people point data

59
is related with the preceding incident input. Therefore some of the fields are
generated automatically. Other ones are entered with text and combo boxes.
Figure: 3.9 Involved People Input Screen
In this chapter system design process and functions of online mapping are
discussed. As can be observed from the mainframe, a point based crime data
can be inserted into the system to be used for crime analysis. This reflects
the ability of real time data production along with online crime mapping. In this
frame of reference, both crime incidents and involved people (offenders and
victims) data can be entered into the server side system.

60
This chapter claims that the system design process brings solutions for
establishment of a tactical crime analysis environment. In the next chapter,
this system’s capabilities are evaluated by giving examples on accuracy and
performance testing of crime data input. Therefore, shortcomings and
strengths of the system are discussed with comparing different situations of
online crime mapping application.

61
CHAPTER 4
EVALUATION PROCESS OF MULTI PARTICIPANT ONLINE MAPPING
In this chapter firstly description of the case study area is given. In this
framework, introductory view of defined police districts is discussed. Since the
police district areas vary on size and covering neighborhood borders and
Web system provides spatial data entry for each precinct, it is better to give
some background information of the study area.
In addition to general view of Ankara City Police department borders, sections
of this chapter include evaluation process of Web based geocoding process
of crime incidents and involved people. Since this online system allows entry
of point based features within user defined zoom level, accuracy testing of
inserted data is also evaluated. In this context, comparison of actual data
input methodology of Police and proposed study is conducted. In addition,
performance issues are evaluated during point data entry session. Finally,
online mapping capabilities are evaluated.
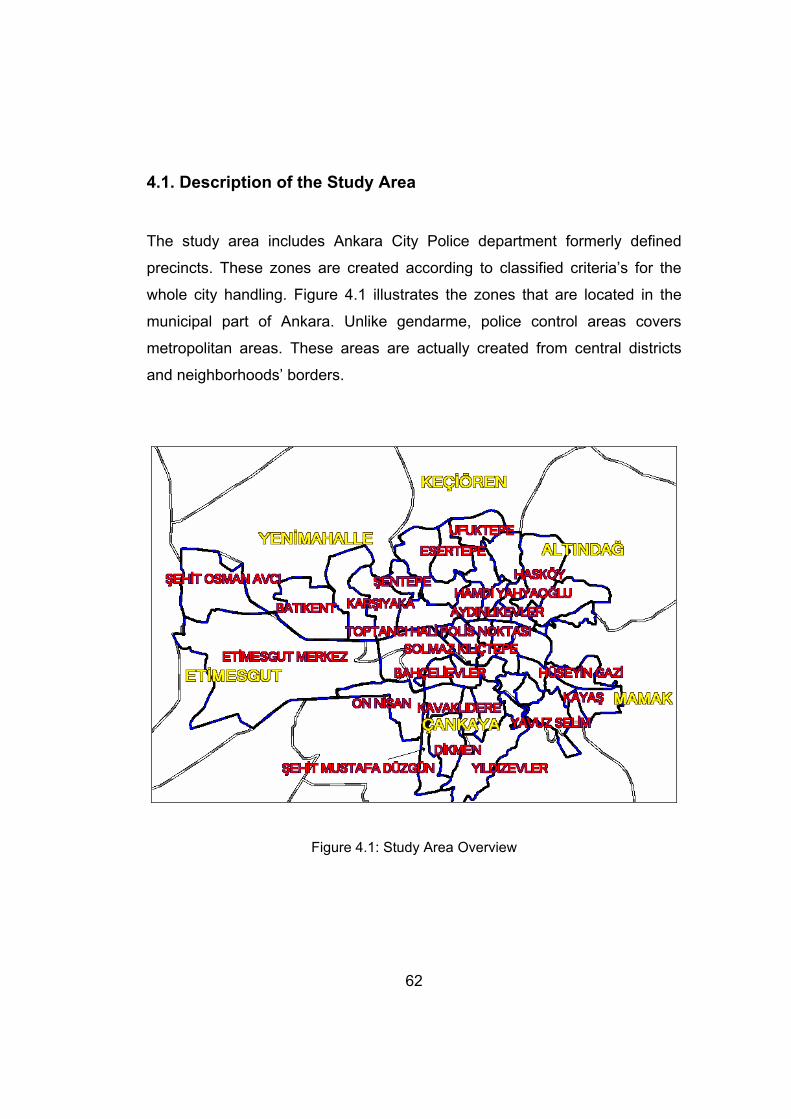
62
4.1. Description of the Study Area
The study area includes Ankara City Police department formerly defined
precincts. These zones are created according to classified criteria’s for the
whole city handling. Figure 4.1 illustrates the zones that are located in the
municipal part of Ankara. Unlike gendarme, police control areas covers
metropolitan areas. These areas are actually created from central districts
and neighborhoods’ borders.
Figure 4.1: Study Area Overview

63
There are 47 precincts in Ankara City Police Department’s jurisdiction area
with an approximately total of 396 square kilometers. Table 4.1 indicates
precincts including their area information. For the reason that, each precinct’s
area differs in extent, crime concentrations must be monitored in an
appropriate zoom level. In addition, as the study underlines accurate mapping
of point based data, building level accuracy is a demand to pinpoint crime
data.
Table 4.1 Ankara City Police Department Districts
No Name of the Precinct Km² No Name of the Precinct Km² 1 KAVAKLIDERE 4 25 ŞEHİT KADİR ÖZCAN 15 2 ELLİNCİ YIL 6 26 BATIKENT 18 3 ŞEHİT MUSTAFA DÜZGÜN 7 27 ŞEHİT İDRİS AYDIN 3 4 ON NİSAN 12 28 MAMAK MERKEZ 6 5 DİKMEN 9 29 HÜSEYİN GAZİ 6 6 YILDIZEVLER 19 30 KAYAŞ 9 7 ESAT 7 31 YAVUZ SELİM 8 8 CEBECİ 5 32 AKDERE 3 9 BAHÇELİEVLER 4 33 OTUZ AĞUSTOS 3 10 ÇANKAYA MERKEZ 4 34 TUZLUÇAYIR 3 11 SOLMAZ KILIÇTEPE 3 35 DEMİRLİBAHÇE 2 12 ANAFARTALAR 3 36 ETLİK 15 13 DEMİRFIRKA 2 37 ESERTEPE 9 14 ALTINDAĞ MERKEZ 2 38 KEÇİÖREN MERKEZ 5 15 SEĞMENLER 3 39 UFUKTEPE 8 16 AYDINLIKEVLER 2 40 AKTEPE 8 17 SİTELER 2 41 YÜZÜNCÜ YIL 5 18 SELAHATTİN DOĞAN 11 42 KAVACIK 3 19 HAMDİ YAHYAOĞLU 3 43 TERMİNAL 1 20 HASKÖY 14 44 ÇİFTLİK 16 21 ETİMESGUT MERKEZ 79 45 ŞEHİT OSMAN AVCI 22 22 YENİMAHALLE MERKEZ 8 46 TOPTANCI HALİ NOKTASI 1 23 KARŞIYAKA 12 47 ADLİYE POLİS KARAKOLU 1 24 ŞENTEPE 5

64
Data used for the study are compiled from Ankara City Police Department’s
2003 statistics containing from the beginning of February to the end of April.
Due to classified information regulations, this study includes crucial
components of database production. In this frame of reference, this study
concentrates on crime incidents’, victims and offender’s visualization and
mapping.
Figure 4.2 displays the distribution of crime incidents and involved people
(offenders and victims) covering some precincts of Ankara Police
Department. Red points indicate crime incidents, whereas blue spots are
involved people. Whole data covering all the precincts contain totally 790
incidents and 1054 involved people in digital format. In addition to crime data,
road network, neighborhood, districts and building layers of Ankara are used
for Web based geocoding process of this study.
In Ankara Police Department, point based data are produced by a semi-
automated geocoding interface. However, there are some question marks
regarding the data accuracy while these point based data are located. It can
be observed from the Figure 4.2 that the illustration contains overlapping
features of incidents and involved people. Unlike this display, points should
be rather dense when displayed in the map. The following sections discuss
data accuracy with comparing the current status of data production
techniques. In this context, location accuracies are evaluated by examining
the pinpointed data and its real tabular geographic informative location.
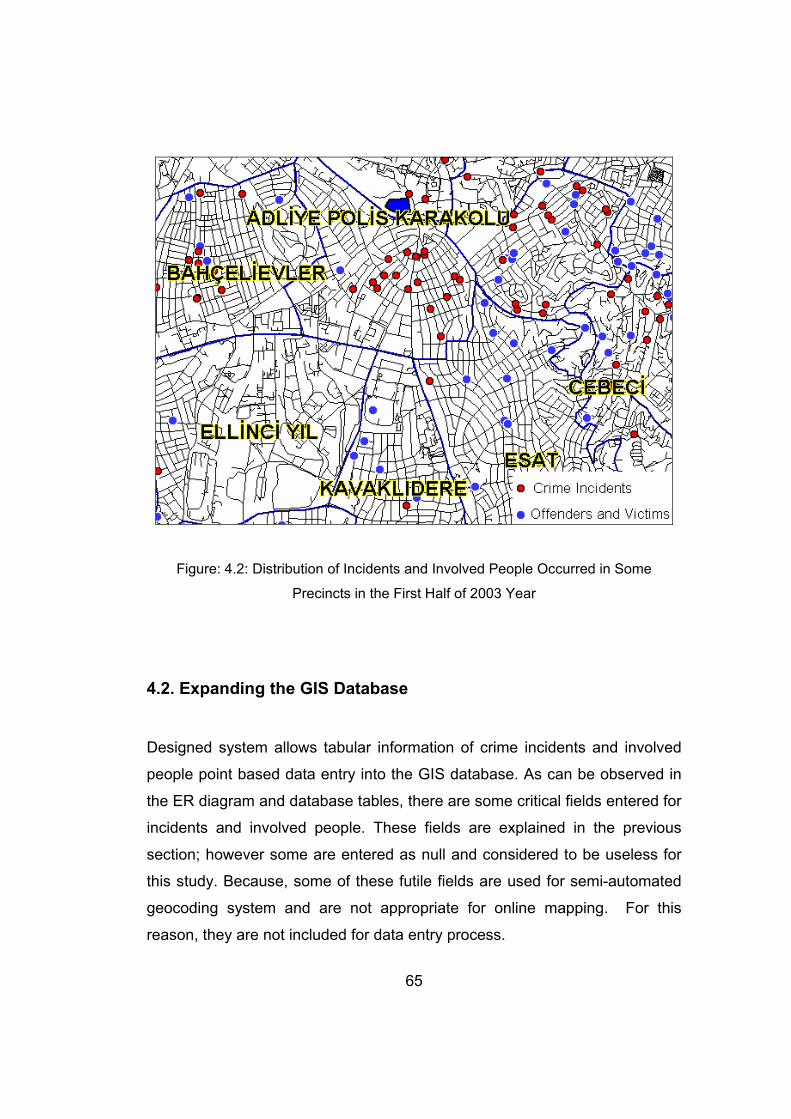
65
Figure: 4.2: Distribution of Incidents and Involved People Occurred in Some
Precincts in the First Half of 2003 Year
4.2. Expanding the GIS Database
Designed system allows tabular information of crime incidents and involved
people point based data entry into the GIS database. As can be observed in
the ER diagram and database tables, there are some critical fields entered for
incidents and involved people. These fields are explained in the previous
section; however some are entered as null and considered to be useless for
this study. Because, some of these futile fields are used for semi-automated
geocoding system and are not appropriate for online mapping. For this
reason, they are not included for data entry process.

66
As mentioned in the system design process, incident and involved people
data entry is conducted by combo and text boxes. After navigating and
pinning the incident or involved data, user is expected to enter tabular
information. During crime data input, primary key field OLAYNO is generated
automatically for incident entry. On the other hand primary fields
KARISANNO and SAHISNO are generated automatically for involved people
table too. Although this online crime mapping system constructs this
relational database that is not used directly, the spatial database can be used
for further crime analysis applications.
Since the study put forwards a Web based data entry system, accuracy and
performance testing are performed to validate this application’s capability.
Test sections evaluate proposed system’s shortcomings and strengths in the
following sections.
4.2.1. Performance Testing
Online system provides multi participant access to the spatial database in the
main server. As mentioned earlier, the system use Microsoft Access for
holding incidents and involved layers including X and Y fields of geographic
information. Therefore, after the entry process, data can be imported for any
kind of integrated mapping crime analysis or spatial decision support
application.
Performance testing process is conducted in the Middle East Technical
University, Geodetic and Geographic Information Technologies lab. Since the
proposed system can be used as a prototype for 47 stations of Ankara Police
Department, and theoretically not all of them penetrate the Web server at the
same time, this test is conducted with three user access for performance

67
evaluation. Therefore, multi participant platform is assumed to be created
within these three clients. The users are decided as research assistants
working in the department. In this state users are entering point based crime
incidents and involved people data through Web.
In the testing process users are required to enter two crime incident and one
involved people respectively. In addition, it is expected from the users that
involved people OLAYNO is same with the first incident entry. In the scenario
one incident has one involved people to be entered for the first crime incident.
Since the system use relational model, it is expected from users to enter one
related data on the map. Each user has different location to navigate and
pinpoint the crime data. In this way, system’s multi user server map rendering
capability is also evaluated in the online mapping process.
Figure 4.3: Performance Testing Schema
Web Server &
MapXtreme Server
Laptop
User 1
Incident 1: 3 min
Incident 2: 2 min
User 2
Incident 1: 4 min
Incident 2: 2 min
User 3
Incident 1: 2 min
Incident 2: 2 min

68
Figure 4.3 illustrates the users and performance results during online data
entry process. This schema includes users’ data entry timing of incidents and
involved people. Timing process is comprised of navigating and locating the
point data and input the field information. Users are expected to enter two
different crime incident and one involved people data. Survey results show
that users enter crime incident data faster then involved people layer. For the
reason that involved people input screen has more database fields, and has
less number of combo boxes, it takes more time to enter involved people
data.
Timings are approximate rounded values that are gathered from users’ forms.
Forms also include user comments in which over all satisfaction of the system
is evaluated. Users’ common comment is that the system is satisfactory;
however, they also underline that during the entry process, automatically
generated fields may mislead the user. Because when a user commits a point
to the database, other users OLAYNO field change instantly. Theoretically,
this response of the server is necessary, because the database keeps this
field as a primary key to provide the consistency. However, users may miss
the OLAYNO number after they pinpoint the data. Same situation happens in
the involved people entry for KARISANNO and SAHISNO fields, because
they are generated automatically as well.
To sum up, in the performance testing step multi users online access process
is performed. Since the system is proposed to 47 stations of Ankara City
Police Department, three users access can be good practice for it. The
system facilitates a 1.7 MHz. laptop computer in the server side. Apparently,
the better CPU and ram means the faster processing speed.

69
4.2.2. Accuracy Testing
The system proposes accurate geocoding of crime incidents and involved
people into the spatial database. Unlike Ankara City Police Department’s
semi-automated geocoding interface, this Web based application is a
mapping system. Users witness the actual crime place in the map, so that
accuracy is achieved by pinpointing the crime information in building zoom
level.
Accuracy testing section evaluates some sample incidents and involved
people location information. Sample data are compared with Police’s semi-
automated geocoding interface and online mapping system. In fact, it is
assumed that points are always entered in building zoom level in the online
mapping approach. However to put forward the geocoding problems of semi-
automated system, original data accuracy is evaluated with building number
information.
Points are selected randomly from the spatial database and they are
considered to reflect semi-automated system’s accuracy success. Three
different incidents and two involved people locations are selected for position
assessment. They are evaluated with building number information and actual
place of the pinpointed data. MapInfo Professional calculates the distance
between located data and the real building with a measurement tool. The
following representations illustrate pinned data with including building and
street layers. Three of the following figures show incidents’ and the rest two
display involved people’s positional accuracy in different level of map scales.
Figure 4.4 displays the first crime incident example occurred in Cebeci
district. As can be observed from the illustration, there is 178 meters of

70
positional accuracy error. Although the Police semi-automated geocoding
system enters the tabular information of building number as 5, it pinpoints
data next to the building number 26. Figure 4.5 shows the same situation for
the second crime incident example occurred in Altındağ. This time actual
crime takes place in the building number 42 but pinpointed next to the
building number 25, and there is a 95 meters of positional error. The next
sample illustrates a 181 meters error in figure 4.6.
As the Police system utilizes the same method to geocode involved people
layer, identical to crime incidents layer positional errors happen here as well.
Figure 4.7 displays 204 meters error pinpointed in Aktepe neighborhood and
finally Figure 4.8 illustrates 198 meters of positional error in Siteler
neighborhood.
Figure 4.4: Incident Accuracy Testing 1

71
Figure 4.5: Incident Accuracy Testing 2
Figure 4.6: Incident Accuracy Testing 3

72
Figure 4.7: Involved Accuracy Testing 1
Figure 4.8: Involved Accuracy Testing 2

73
Unlike Police’s geocoding system the Web based mapping application
locates the incidents and involved people data to the actual place of
buildings. Basic advantage of the system is to provide this geocoding process
by navigating in the map. Therefore, users can aware of located points and
finally appropriate positional accuracy level is achieved within this study’s
online mapping approach.
In this chapter, online system’s capabilities are evaluated. In this context,
performance and positional accuracy are considered as key factors in order to
bring solutions for tactical crime mapping. It can be claimed that, when a user
pinpoints crime data by utilizing a defined zoom level base map, convenient
results can be achieved with this online mapping system. In addition,
considering the importance of time to conduct up-to-date tactical crime
analysis, this Web system enables real time data production.

74
CHAPTER 5
CONCLUSION AND RECOMMENDATIONS
This thesis is designed to build a crime mapping system in order to produce
data along with a Web based data entry methodology. The main emphasis in
this study is to convey some new improvements for effective and accurate
geocoding of point based crime incidents, offenders and victims’ data. In this
thesis, general requirements of Ankara City Police Department are examined
for building a typical tactical crime mapping application. In this context, to
accomplish an up-to-date and proper positional accuracy of these point based
features, a Web based multi participant platform is constructed. Police
stations of Ankara are considered as participants working interactively with
the center division to enter crime data.
This study establishes a server side Web architecture that provides map
visualization and point based data input to the current spatial database
through Web browsers. Major advantage of this server side system is that the
clients using the browsers do not need to install any additional plug in to
conduct online mapping. Typical HTML operations in the browser such as
clicking, selecting and typing text data are performed at some stage in this
online crime mapping application. For this reason, user friendly map
navigation and display functions are included to the client interface.

75
Online mapping has two distinct advantages including multi user access to
the spatial database and accurate geocoding of point based geographic
features. In this context, proposed system can be a good suggestion to the
current database production of Ankara Police Department. Moreover, this
system is able to produce data faster than the recent one, because it can be
facilitated among the network of computers. Obviously, real time data input
approach is faster than currently used semi-automated geocoding interface of
the Ankara Police Department. Unlike their input process, there is no need to
send hardcopy information from each station to the center division.
The fact that crime occurs heterogeneously, this proposed online system can
work effectively for inserting new points into the spatial database. For the
reason that users render the digital map in precinct, neighborhood, and street
level; it is quite applicable to reach building level accuracy. In addition Web
mapping application allows entering tabular attribute data of point features of
crime incidents and involved people. In this context, the server side
MapXtreme working together with IIS Web Server meets the data entry
requirements.
Both incidents and involved people data contain several fields of tabular
attribute information. The online mapping system facilitates some of these
fields that are crucial for a tactical crime analysis or spatial decision support
application. In this context, current relational database model is improved with
automatic generation of primary fields of involved people and crime incidents
layers. However, to keep up the actual database production of Ankara Police
Department, other fields are input as null during the Web entry. Due to
practiced redundant information in the actual spatial database of Police, the
system must be rebuilt with consistent entity relationship diagram. Therefore,
more efficient tabular database could be used for tactical crime analysis as a
further step.

76
Layers including buildings, streets, neighborhoods and precincts are
displayed within predefined zoom level intervals. In order to reduce server
side processing tasks, this layer visibility range method assists for fast
rendering of digital maps in the browsers. Since the system can be used at
maximum of 47 users from each police station at the same time, this layer
visibility option is necessary for performance considerations.
MapXtreme application server facilitates Microsoft Access database for crime
incidents and involved people layer. The system stores the data in the
Microsoft Access database including geographic location information. The
reason of choosing an additional database management system is to provide
multi user and session management. Moreover, Microsoft Access database is
rather fast and simple compared to many advanced databases such as
Oracle, SQL Server etc. Because advanced database management systems
use more physical recourses, and therefore a high speed computer must be
used at the server side.
Web based crime mapping application is proposed to Ankara City Police
Department to be implemented in their private intranet platform called
POLNET. They have 10 Mbit intranet bandwidth speed which means that
they can easily establish such a platform to be used by 47 Police stations at
the same time. In this context, as long as the server at the center division has
more physical memory and CPU, the system performance can further be
improved.
It is observed that crime incidents and involved people layers of containing
year 2003, 3 months data have several positional errors. The semi-automated
system used by the Ankara Police Department locates point based data every
time in the same place of a street. Depending on the street lengths, their
application always pins the data in the center of the roads and eventually this

77
misleading process may cause high positional errors. In addition, points are
located each time in the same place of a street line segment, which grounds
overlapping features in the map. On the contrary, online entry system enables
navigating in the entire streets without considering the lengths. Because the
system zooms into the containing precinct and neighborhood and point based
data always entered into the right place. This is achieved by dynamic
segmentation method and the users can easily switch to street segments for
covering neighborhoods.
The system can be used by the officers working as clerks in each police
station. As they write down crime information to the hardcopy papers as a
regular working activity, they can use Web browsers to enter the same
criminal activity. In order to make the tabular data input process easier for
police officers, iteratively working combo boxes are used in this online
mapping application. In this frame of reference consistent attribute
information input is provided as well.
The entire system facilitates MapInfo Professional components and Microsoft
Access as a relational database. The availability of recently inserted data
usage provides a compact mapping application. Produced data with Access
database can be imported to MapInfo Professional platform. Therefore, this
crime mapping application can be also used for any type of customized crime
analysis application for spatial decision support. Since a successful Spatial
Decision Support system necessitates data production and analysis in one
single frame, this proposed online application seems to fit well as a crime
mapping part of any advanced system.
As long as this prototype facilitates the base map with unified building, street,
neighborhood and district layers, this online crime mapping application can be
used in other cities of Turkey. Because the system filters the database
78
dynamically, it can be used in other Police departments. More specifically, it
depends on the spatial database used as base up for pinpointing crime data.
Therefore, it can be claimed that as long as an up-to-date and reliable base
map the city has, an online crime mapping application can be constructed for
that city as well.
As for future work, users tracking capability can be included to this online
mapping system. Users may have predefined username and passwords
before they login to the system. This login information of users can be kept in
any database management system as well. Therefore, in the session
management users can also be monitored in cases about who entered which
crime incident or involved people point data. Considering any data verification
process, this method may enable communicating with the user who locates
the data for verification.
In addition, considering the recent telecommunications network and satellite
systems, GPS enabled palm computers could be a better practice for crime
database production. These computers can transmit data to the center
division by using this satellite networks. Thus, police officers may enter crime
in their actual location with geographical coordinates and tabular attribute
information. This implementation is obviously the most accurate positioning of
crime data. However, it is required to put effort with a larger software
development team. Because designing such a system could be practical but
not easily developed.
In order to develop a Web based multi participant mapping application, an
advanced level of software development experience is required. General
requirements and system’s audience must be identified clearly for such kind
of applications. Mostly, these participatory systems can be used in AM/FM
(Automated Mapping and Facilities Management), community planning and

79
so forth. However, for instance this online crime mapping application
produces only point based features including their tabular attribute
information. Therefore, it can be claimed that the more complicated features
like line and polygon based data must be carefully designed and developed
with choosing appropriate Web architecture and map server components.
As long as tactical crime analysis needs daily, weekly, monthly reports, and
hot spot mapping for administrative reactions, this prototype of online
mapping application seem to fit very well of these requirements. Because
accurate data means efficient hot spot mapping and real time date entry
signifies monitoring temporal activity whenever the analysts want. To sum
up, this study can be a prototype for online crime mapping in tactical crime
analysis. In addition, in this thesis a real time GIS data production is
established which enables dynamic crime mapping. Considering the
outcomes of this study, it can be claimed that fast and reliable data
production is constructed within an online multi participant platform.

80
REFERENCES
Ahmadi, M. (2003) “Crime Mapping and Spatial Analysis”, M.Sc. Thesis,
International Institute for Geo-Information Science and Earth Observation
Enschede, The Netherlands
Akpınar, E. (2005) ”Using Geographic Information Systems in Analyzing the
Pattern of Crime Incidents and the Relationship between Landuse and
Incidents”, M.Sc. Thesis, Middle East Technical University, Department of
Geodetic and Geographic Information Technologies, Ankara, Turkey
Al-Kodmany, K. (2001) “Online Tools for Public Participation”, Government
Information Quarterly 18, 329-341.
Alesheish A. Helali, H. Behroz, H (2002) “Web GIS: Technologies and Its
Applications”, Symposium on Geospatial Theory Processing and Applications,
Ottawa
Ashby, R. (2005) “Policing Neighbourhoods: Exploring the Geographies of
Crime”, Policing and Performance Assessment, Policing and Society, 15,
413-447
Boba, R (2005) “Role of GIS in the Institutionalization of Analysis in Police
Departments”, Corrections Technology Center Rocky Mountain Division Pre-
Conference Workshops
Campbell, J. (2001) “Map use & Analysis”, Fourth Edition. New York:
McGraw-Hill.

81
Corcoran, J. & Ware, J.A. (2002) “Data Clustering using ANNs as a Precursor
to Crime HotSpot Prediction” School of Computing, University of Glamorgan,
Pontypridd, Wales, UK
Eck, J. Chainey, S. Cameron, J. Leitner, M. & Wilson, R. (2005) “Mapping
Crime: Understanding Hot Spots”, U.S. Department of Justice, Washington
DC.
ESRI, (2002) “Geographic Information Systems for the Java™”, An ESRI ®
White Paper.
Goodchild, M. (2002) “GIS Finding the Mainstream”, University of California,
Santa Barbara, USA
Green, D. & Bossomaier, T. (2002) “Online GIS and Spatial Metadata”,
London: Taylor & Francis
Harries, K. (1999) “Mapping Crime: Principle and Practice”, U.S. Department
of Justice, Research Report, Washington DC.
Helms, D. (2005) “Police Geocoding: A Dot in a House of Cards”, Corrections
Technology Center Rocky Mountain Division Pre-Conference Workshops
Hirschfield, A. Bowers, K. (2001) “Mapping and Analyzing Crime Data,”
London, Taylor and Francis.
Kingston, R. Carver, S. Evans, A. Turton, I. (2000) “Web based public
Participation geographical information systems: an aid to local environmental
decision-making”, Computer, Environment and Urban Systems 24, 109-125
82
MapXtreme Developers Guide (2004), MapInfo Corporation® ,NY, USA
Oatley, G. & Ewart, B. (2003) “Crime Analysis Software: ‘pins in maps’,
Clustering and Bayes Net Prediction”, Expert Systems with Applications, 25,
569-588
Osborne, D. Wernicke, S (2003) “Introduction to Crime Analysis: Basic
Resources for Criminal Justice Practice”, Haworth Press
Peng, Z. R. and Beimborn, E. (1998) “Internet GIS and Its Applications in
Transportation”, TR News, vol. March-April, No. 195, pp. 22-26.
Ratcliffe, J. (2002) “Damned If You don’t, Damned If You Do: Crime Mapping
and Its Implications in the Real World”, Policing and Society, 12, 211-225
Ratcliffe, J. (2004) “Crime Mapping and the Training Needs of Law
Enforcement” European Journal on Criminal Policy and Research 10, 65–83
Rinner, C. (2003) “Sharing Web-based Spatial Decision Support: Status and
Research Directions”, Journal of Geographic Information and Decision
Analysis 7, 14-31
Takatsuka, M. Gahegan, M. (2001) “Sharing Exploratory Geospatial Analysis
and Decision Making using GeoVISTA Studio: From a Desktop to the Web”,
Journal of Geographic Information and Decision Analysis 5, 129-139.
Tandoğan, H. (2006), Personal Interview with Chief Officer, Ankara City
Police Department, Crime Analysis Branch, Turkey

83
Torun, İ. (2006), Personal Interview with Geocoding Technician, Ankara City
Police Department, Crime Analysis Branch, Turkey
Vatsavai, R.R. Burk, T. E. Wilson, B. T. Shekhar, B. (2000) “A Web based
Browsing and Spatial Analysis System for Regional Natural Resource
Analysis and Mapping”, Proceedings of the 8th ACM International Symposium
on Advances in Geographic Information Systems, 95-101.
Web 1, The East Valley Community Mapping, Planning and Analysis for
Safety Strategies, http://www.eastvalleycompass.org/, Last accessed date
December, 2005
Web 2, Philadelphia Neighborhood Information System,
http://www.cml.upenn.edu/crimebase/, Last accessed date December, 2005
Web 3, Overland Park, Kansas
http://gis.opkansas.org/website/pub_crime/pub_crime.asp?ms=pub_crime,
Last accessed date May, 2006
Web 4, Crime Analysis Associates,
http://www.crimeanalysis.net/old/Services/index.htm, Last accessed date
December, 2005
Zaslavsky, I. (2000) “A New Technology for Interactive Online Mapping with
Vector Markup and XML”, The Journal of the North American Cartographic
Information Society: Cartographic Perspectives 37, 12-24.

84
APPENDIX A
WebForm1.aspx File using System; using System.Collections; using System.ComponentModel; using System.Data; using System.Drawing; using System.Web; using System.Web.SessionState; using System.Web.UI; using System.Web.UI.WebControls; using System.Web.UI.HtmlControls; using MapInfo.Data; using MapInfo.Styles; using MapInfo.Engine; using MapInfo.Mapping; using System.Data.OleDb; namespace crimeXtreme { public class WebForm1 : System.Web.UI.Page { protected MapInfo.Web.UI.WebControls.ZoomInToolControl ZoomInToolControl1; protected MapInfo.Web.UI.WebControls.ZoomOutToolControl ZoomOutToolControl1; protected MapInfo.Web.UI.WebControls.PanToolControl PanToolControl1; protected MapInfo.Web.UI.WebControls.CenterToolControl CenterToolControl1; protected MapInfo.Web.UI.WebControls.DistanceToolControl DistanceToolControl1; protected MapInfo.Web.UI.WebControls.ToolbarControl ToolbarControl1; protected MapInfo.Web.UI.WebControls.InfoToolControl InfoToolControl1; protected MapInfo.Web.UI.WebControls.DistanceToolControl DistanceToolControl2; protected MapInfo.Web.UI.WebControls.MapControl MapControl1; protected System.Web.UI.WebControls.ListBox ListMintika; protected System.Web.UI.WebControls.ListBox ListMahalle; protected System.Web.UI.WebControls.ListBox ListSokak; protected System.Web.UI.WebControls.Label Label1; protected System.Web.UI.WebControls.Label Label2; protected System.Web.UI.WebControls.Label Label3; protected MapInfo.Web.UI.WebControls.LayerControl LayerControl1; protected System.Web.UI.WebControls.Button Button1; protected System.Web.UI.WebControls.Panel Panel1; protected System.Web.UI.WebControls.Label Label4; protected System.Web.UI.HtmlControls.HtmlGenericControl P1; protected System.Web.UI.WebControls.Table Table1;

85
protected System.Web.UI.WebControls.Calendar Calendar1; protected System.Web.UI.WebControls.DropDownList cmbburokod; protected System.Web.UI.WebControls.DropDownList cmbolay; protected System.Web.UI.WebControls.TextBox txtilce; protected System.Web.UI.WebControls.TextBox txtkarakol; protected System.Web.UI.WebControls.DropDownList cmbsuc; protected System.Web.UI.WebControls.TextBox txtsaat; protected System.Web.UI.WebControls.DropDownList cmbolaydur; protected System.Web.UI.WebControls.TextBox txtadresmah; protected System.Web.UI.WebControls.DropDownList cmbned; protected System.Web.UI.WebControls.DropDownList cmbolaygun; protected System.Web.UI.WebControls.TextBox txtadresdaire; protected System.Web.UI.WebControls.TextBox txtolayno; protected System.Web.UI.WebControls.Button butkaydet; protected MapInfo.Web.UI.WebControls.PointSelectionToolControl PointSelectionToolControl1; private void Page_Load(object sender, System.EventArgs e) { MapControl1.MapTools.Add(new newOlayTool(Page.Session,this)); if (!Page.IsPostBack) { Catalog cg=MapInfo.Engine.Session.Current.Catalog; SearchInfo si=MapInfo.Data.SearchInfoFactory.SearchAll(); si.QueryDefinition.Columns=null; IDynamicFeatureCollection fc=cg.Search("mintika",si); for (int i=0;i<fc.Count;i++) { ListMintika.Items.Add(fc[i]["KARAKOL"].ToString()); } OleDbConnection conn; OleDbCommand comm; conn = new OleDbConnection("Provider = Microsoft.Jet.OLEDB.4.0; Data Source =D:\\Inetpub\\wwwroot\\crimextreme\\Olayx.mdb"); comm = new OleDbCommand("Select * from Olayx",conn); conn.Open(); OleDbDataAdapter dadap = new OleDbDataAdapter(comm); DataTable dt=new DataTable(); dadap.Fill(dt); comm.Dispose(); conn.Close(); TableInfoAdoNet ti = new TableInfoAdoNet("Olayx", dt); ti.CacheSettings=new CacheParameters(CacheOption.Off); SpatialSchemaXY xy = new SpatialSchemaXY(); xy.XColumn = "X"; xy.YColumn = "Y"; xy.NullPoint = "0.0, 0.0"; BitmapPointStyle olaystil = new BitmapPointStyle("PIN232.BMP",BitmapStyles.None,Color.Red,24); xy.DefaultStyle = olaystil;

86
xy.CoordSys = MapInfo.Engine.Session.Current.CoordSysFactory.CreateFromMapBasicString ("Earth Projection 1,28"); ti.SpatialSchema = xy; // try { MapInfo.Data.Table t= MapInfo.Engine.Session.Current.Catalog.OpenTable(ti); FeatureLayer fl=new FeatureLayer(t); MapControl1.Map.Layers.Insert(0,fl); } catch(Exception ex) { System.Diagnostics.Debug.WriteLine(ex.Message); } InitializeComponent(); base.OnInit(e); } private void InitializeComponent() { this.Button1.Click += new System.EventHandler(this.Button1_Click); this.ListMintika.SelectedIndexChanged += newSystem.EventHandler(this.ListMintika_SelectedIndexChanged); this.ListMahalle.SelectedIndexChanged += new System.EventHandler(this.ListMahalle_SelectedIndexChanged); this.ListSokak.SelectedIndexChanged += new System.EventHandler(this.ListSokak_SelectedIndexChanged); this.cmbburokod.SelectedIndexChanged += new System.EventHandler(this.cmbburokod_SelectedIndexChanged); this.cmbolay.SelectedIndexChanged += new System.EventHandler(this.cmbolay_SelectedIndexChanged); this.butkaydet.Click += new System.EventHandler(this.butkaydet_Click); this.Load += new System.EventHandler(this.Page_Load); } #endregion private void InfoToolControl1_InfoRetrieved(object sender, MapInfo.Web.UI.WebControls.InfoToolEventArgs e) { Feature f=e.Features[0][0]; System.Diagnostics.Debug.WriteLine(f[0]); } public System.Web.UI.WebControls.Panel getolaypanel() { return this.Panel1; } private void ListMintika_SelectedIndexChanged(object sender, System.EventArgs e) { System.Diagnostics.Debug.WriteLine(ListMintika.Items[ListMintika.SelectedIndex].ToString()); String ss=ListMintika.Items[ListMintika.SelectedIndex].ToString();

87
SearchInfoimintika=MapInfo.Data.SearchInfoFactory.SearchWhere("KARAKOL='"+ss+"'"); simintika.QueryDefinition.Columns=null; MapInfo.Engine.Session.Current.Catalog.SearchForFeature("mintika",simintika); MapControl1.Map.SetView(f); MIConnection miconn=new MIConnection(); miconn.Open(); MICommand cmd=miconn.CreateCommand(); cmd.CommandText="select * from mahalle where KARAKOL='"+ss+"' order by mahalle_adi"; cmd.Prepare(); IDynamicFeatureCollection fcmah=cmd.ExecuteFeatureCollection(); cmd.Dispose(); miconn.Close(); ListMahalle.Items.Clear(); ListSokak.Items.Clear(); for (int i =0;i<fcmah.Count;i++) { ListMahalle.Items.Add(fcmah[i]["mahalle_adi"].ToString()); } ListMahalle.Visible=true; } private void ListMahalle_SelectedIndexChanged(object sender, System.EventArgs) { System.Diagnostics.Debug.WriteLine(ListMahalle.Items[ListMahalle.SelectedIndex].ToString()); String ss=ListMahalle.Items[ListMahalle.SelectedIndex].ToString(); SearchInfo simintika=MapInfo.Data.SearchInfoFactory.SearchWhere("mahalle_adi='"+ss+"'"); simintika.QueryDefinition.Columns=null; MapInfo.Engine.Session.Current.Catalog.SearchForFeature("mahalle",simintika); MapControl1.Map.SetView(f); MIConnection miconn=new MIConnection(); miconn.Open(); MICommand cmd=miconn.CreateCommand(); cmd.CommandText="select ADI from yol where MAHALLE='"+ss+"' and (ADI<>'') group by ADI order by ADI"; cmd.Prepare(); ListSokak.Items.Clear(); MIDataReader dr=cmd.ExecuteReader(); while (dr.Read()) { Feature ff=dr.Current; ListSokak.Items.Add(ff["ADI"].ToString()); } ListSokak.Visible=true; dr.Dispose(); cmd.Dispose(); miconn.Close();

88
} private void ListSokak_SelectedIndexChanged(object sender, System.EventArgs e) { String ss=ListMahalle.Items[ListMahalle.SelectedIndex].ToString(); String yolstr=ListSokak.Items[ListSokak.SelectedIndex].ToString(); MIConnection miconn=new MIConnection(); miconn.Open(); MICommand cmd=miconn.CreateCommand(); cmd.CommandText="select * from yol where MAHALLE='"+ss+"' and ADI='"+yolstr+"'"; cmd.Prepare(); IResultSetFeatureCollection fcyollar=cmd.ExecuteFeatureCollection(); cmd.Dispose(); miconn.Close(); MapControl1.Map.SetView(fcyollar); MapInfo.Engine.Session.Current.Selections.DefaultSelection.Clear(); MapInfo.Engine.Session.Current.Selections.DefaultSelection.Add(fcyollar); } private void Button1_Click(object sender, System.EventArgs e) { MapControl1.MapTools.CurrentTool =newOlayTool.Toolname; } private void cmbburokod_SelectedIndexChanged(object sender, System.EventArgs) { cmbolay.Items.Clear(); switch (cmbburokod.SelectedIndex) { case 0: cmbolay.Items.Add("OTO HIRSIZLIĞI"); cmbolay.Items.Add("OTODAN HIRSIZLIK"); break; case 1: cmbolay.Items.Add("KAYIP ŞAHIS"); break; case 2: cmbolay.Items.Add("AÇIKTAN HIRSIZLIK"); cmbolay.Items.Add("DEPODAN HIRSIZLIK"); cmbolay.Items.Add("EMNİYETİ SUİSTİMAL"); cmbolay.Items.Add("EVDEN HIRSIZLIK"); cmbolay.Items.Add("HAYVAN HIRSIZLIĞI"); cmbolay.Items.Add("HIRSIZLIK"); cmbolay.Items.Add("KASA HIRSIZLIĞI"); cmbolay.Items.Add("KÖMÜRLÜKTEN HIRSIZLIK"); cmbolay.Items.Add("MABETTEN HIRSIZLIK"); cmbolay.Items.Add("NİTELİKLİ HIRSIZLIK"); cmbolay.Items.Add("RESMİ DAİREDEN HIRSIZLIK"); cmbolay.Items.Add("İŞ YERİNDEN HIRSIZLIK"); break; case 3:

89
cmbolay.Items.Add("4230 S.K.M."); cmbolay.Items.Add("DİĞER SUÇLAR"); cmbolay.Items.Add("KENDİ KENDİNİ YARALAMA"); cmbolay.Items.Add("KIZ KADIN KAÇIRMA"); cmbolay.Items.Add("YARALAMA"); cmbolay.Items.Add("ZORLA IRZA GEÇME TASSADİ"); cmbolay.Items.Add("ÖLDÜRME"); cmbolay.Items.Add("İNTİHAR"); break; case 4: cmbolay.Items.Add("FUHUŞ"); cmbolay.Items.Add("FUHUŞA ARACILIK"); cmbolay.Items.Add("FUHUŞA ARACILIK VE FUHUŞ"); cmbolay.Items.Add("KUMAR"); break; case 5: cmbolay.Items.Add("6136 S.K.M."); cmbolay.Items.Add("DARP"); cmbolay.Items.Add("DİĞER SUÇLAR"); cmbolay.Items.Add("GASP"); cmbolay.Items.Add("GASP İDDİASI"); cmbolay.Items.Add("GÖREVLİ MEMURA MUKAVEMET"); cmbolay.Items.Add("HAKARET VE TEHDİT"); cmbolay.Items.Add("IZRAR"); cmbolay.Items.Add("KUNDAKLAMA"); cmbolay.Items.Add("KÜÇÜK YAŞTA KIZ KAÇIRMA"); cmbolay.Items.Add("MEMURİYET ÜNV.GASPI"); cmbolay.Items.Add("MESKEN MASUNİYETİNİ İHLAL"); cmbolay.Items.Add("OTO KURSUNLAMA"); cmbolay.Items.Add("POLİS SÜSÜ VERMEK"); cmbolay.Items.Add("SARKINTILIK"); cmbolay.Items.Add("TEHDİT"); cmbolay.Items.Add("ZORLA PARA ALMA İDDİASI"); cmbolay.Items.Add("İCRAİ REZALET ÇIKARMAK"); cmbolay.Items.Add("İŞYERİ KURŞUNLAMA"); break; } } private void cmbolay_SelectedIndexChanged(object sender, System.EventArgs e) { cmbsuc.Items.Clear(); switch (cmbolay.SelectedValue) { case "4320 S.K.M.": cmbsuc.Items.Add("DARP ETMEK SURETİYLE"); cmbsuc.Items.Add("DİĞERLERİ"); break; case "6136 S.K.M.": cmbsuc.Items.Add("ATEŞLİ SİLAHLA");

90
cmbsuc.Items.Add("BEYLİK TABANCASI İLE"); cmbsuc.Items.Add("DARP EDEREK"); cmbsuc.Items.Add("DİĞERLERİ"); cmbsuc.Items.Add("KURU SIKI TABANCA"); cmbsuc.Items.Add("UZUN NAMLULU SİLAH"); break; case "AÇIKTAN HIRSIZLIK": cmbsuc.Items.Add("İNŞAATTAN HIRSIZLIK"); cmbsuc.Items.Add("KALDIRIMCILIK SURETİYLE"); cmbsuc.Items.Add("DİĞERLERİ"); break; case "DARP": cmbsuc.Items.Add("DARP EDEREK"); cmbsuc.Items.Add("DİĞERLERİ"); break; case "DEPODAN HIRSIZLIK": cmbsuc.Items.Add("ANAHTAR UYDURARAK"); cmbsuc.Items.Add("KAPI ZORLAYARAK"); break; case "DOLANDIRICILIK": cmbsuc.Items.Add("ÜÇKAĞITÇILIK"); cmbsuc.Items.Add("JOPÇULUK"); break; case "DİĞER SUÇLAR": cmbsuc.Items.Add("BANKA SOYGUNU"); cmbsuc.Items.Add("DARP ETMEK SURETİYLE"); cmbsuc.Items.Add("DİĞERLERİ"); break; case "EMNİYETİ SUİSTİMAL": cmbsuc.Items.Add("AÇKAPACILIK"); cmbsuc.Items.Add("DİĞERLERİ"); break; case "EVDEN HIRSIZLIK": cmbsuc.Items.Add("ANAHTAR UYDURARAK"); cmbsuc.Items.Add("ASMA KİLİT KIRARAK"); cmbsuc.Items.Add("AÇIK CAMDAN GİREREK"); cmbsuc.Items.Add("BALKONCU"); cmbsuc.Items.Add("CAM KIRMAK SURETİYLE"); cmbsuc.Items.Add("CAM SÖKEREK"); cmbsuc.Items.Add("ELİYLE ZORLAYARAK AÇMAK"); cmbsuc.Items.Add("KAPI ZORLAYARAK"); cmbsuc.Items.Add("SERT BİR CİSİM İLE YÜKLENEREK"); cmbsuc.Items.Add("TEKME İLE KIRARAK"); cmbsuc.Items.Add("DİĞERLERİ"); break; case "FUHUŞ": cmbsuc.Items.Add("ANLAŞMA USULÜ"); break; case "FUHUŞA ARACILIK":

91
cmbsuc.Items.Add("ANLAŞMA USULÜ"); break; case "FUHUŞA ARACILIK VE FUHUŞ": cmbsuc.Items.Add("ANLAŞMA USULÜ"); break; case "GASP": cmbsuc.Items.Add("BIÇAK TEHDİDİ İLE"); cmbsuc.Items.Add("DARP EDEREK"); cmbsuc.Items.Add("SİLAH TEHDİDİ İLE"); cmbsuc.Items.Add("ŞAHISTAN GASP"); cmbsuc.Items.Add("DİĞERLERİ"); break; case "GASP İDDİASI": cmbsuc.Items.Add("KURU SIKI TABANCA"); cmbsuc.Items.Add("SPREY SIKARAK"); cmbsuc.Items.Add("SİLAH TEHDİDİ İLE"); cmbsuc.Items.Add("DİĞERLERİ"); break; case "GÖREVLİ MEMURA MUKAVEMET": cmbsuc.Items.Add("BIÇAK TEHDİDİ İLE"); cmbsuc.Items.Add("DARP EDEREK"); cmbsuc.Items.Add("DİĞERLERİ"); break; case "HAKARET VE TEHDİT": cmbsuc.Items.Add("BIÇAK TEHDİDİ İLE"); cmbsuc.Items.Add("DARP EDEREK"); break; case "HAYVAN HIRSIZLIĞI": cmbsuc.Items.Add("DİĞERLERİ"); break; case "HIRSIZLIK": cmbsuc.Items.Add("ANAHTAR UYDURARAK"); cmbsuc.Items.Add("KALDIRIMCILIK SURETİYLE"); cmbsuc.Items.Add("KAPI ZORLAYARAK"); cmbsuc.Items.Add("İNŞAATTAN HIRSIZLIKSIZLIK"); cmbsuc.Items.Add("DİĞERLERİ"); break; case "IZRAR": cmbsuc.Items.Add("DARP EDEREK"); cmbsuc.Items.Add("DİĞERLERİ"); break; case "KALDIRIMCILIK": cmbsuc.Items.Add("ÇANTACILIK"); cmbsuc.Items.Add("DİĞERLERİ"); break; case "KAPKAÇCILIK": cmbsuc.Items.Add("AÇKAPACILIK"); cmbsuc.Items.Add("ÇANTACILIK"); cmbsuc.Items.Add("DİĞERLERİ");

92
break; case "KASA HIRSIZLIĞI": cmbsuc.Items.Add("İNŞAATTAN HIRSIZLIK"); cmbsuc.Items.Add("DİĞERLERİ"); break; case "KAYIP ŞAHIS": cmbsuc.Items.Add("ERKEK"); cmbsuc.Items.Add("KADIN"); cmbsuc.Items.Add("ERKEK ÇOCUĞU"); cmbsuc.Items.Add("KIZ ÇOCUĞU"); break; case "KENDİ KENDİNİ YARALAMA": cmbsuc.Items.Add("KESİCİ DELİCİ ALETLE"); break; case "KIZ KADIN KAÇIRMA": cmbsuc.Items.Add("DİĞERLERİ"); break; case "KUMAR": cmbsuc.Items.Add("ANLAŞMA USULÜ"); break; case "KUNDAKLAMA": cmbsuc.Items.Add("DİĞERLERİ"); break; case "KÖMÜRLÜKTEN HIRSIZLIK": cmbsuc.Items.Add("ASMA KİLİT KIRARAK"); break; case "KÜÇÜK YAŞTA KIZ KAÇIRMAK": cmbsuc.Items.Add("DİĞERLERİ"); break; case "MABETTEN HIRSIZLIK": cmbsuc.Items.Add("ANAHTAR UYDURARAK"); break; case "MEMURİYET ÜNV.GASPI": cmbsuc.Items.Add("DİĞERLERİ"); break; case "MESKEN MASUNİYETİNİ İHLAL": cmbsuc.Items.Add("DARP EDEREK"); cmbsuc.Items.Add("DİĞERLERİ"); break; case "NİTELİKLİ HIRSIZLIK": cmbsuc.Items.Add("DİĞERLERİ"); break; case "OTO HIRSIZLIĞI": cmbsuc.Items.Add("ANAHTAR UYDURARAK"); cmbsuc.Items.Add("AÇIK KAPIDAN GİREREK"); cmbsuc.Items.Add("DÜZ KONTAK YAPARAK"); cmbsuc.Items.Add("OTO CAMINI KIRARAK"); cmbsuc.Items.Add("DİĞERLERİ"); break;

93
case "OTO KURSUNLAMA": cmbsuc.Items.Add("BEYLİK TABANCASI İLE"); break; case "OTODAN HIRSIZLIK": cmbsuc.Items.Add("ANAHTAR UYDURARAK"); cmbsuc.Items.Add("BAGAJDAN HIRSIZLIKSIZLIK"); cmbsuc.Items.Add("CAM FİTİLİNİ SÖKEREK"); cmbsuc.Items.Add("LASTİK VE CANT ÇALARAK"); cmbsuc.Items.Add("OTO CAMINI KIRARAK"); cmbsuc.Items.Add("SPATULA KULLANARAK"); cmbsuc.Items.Add("TORNAVİDA KULLANARAK"); cmbsuc.Items.Add("DİĞERLERİ"); break; case "POLİS SÜSÜ VERMEK": cmbsuc.Items.Add("POLİS SÜSÜ VERMEK"); break; case "RESMİ DAİREDEN HIRSIZLIK": cmbsuc.Items.Add("AÇIK CAMDAN GİREREK"); cmbsuc.Items.Add("AÇIK KAPIDAN"); cmbsuc.Items.Add("DİĞERLERİ"); cmbsuc.Items.Add("PENCERE DEMİRİNİ SÖKEREK"); cmbsuc.Items.Add("TEKME İLE KIRARAK"); break; case "SAHTECİLİK": cmbsuc.Items.Add("DİĞERLERİ"); break; case "SARKINTILIK": cmbsuc.Items.Add("DİĞERLERİ"); break; case "TEHDİT": cmbsuc.Items.Add("BIÇAK TEHDİDİ İLE"); cmbsuc.Items.Add("SİLAH TEHDİDİ İLE"); cmbsuc.Items.Add("DİĞERLERİ"); break; case "YANKESİCİLİK": cmbsuc.Items.Add("CEPÇİLİK"); cmbsuc.Items.Add("MUSLUKÇULUK"); cmbsuc.Items.Add("DİĞERLERİ"); break; case "YARALAMA": cmbsuc.Items.Add("ATEŞLİ SİLAHLA"); cmbsuc.Items.Add("DARP ETMEK SURETİYLE"); cmbsuc.Items.Add("KESİCİ DELİCİ ALETLE"); cmbsuc.Items.Add("KÜT CİSİMLE VURARAK"); break; case "ZORLA IRZA GEÇME TASADDİ": cmbsuc.Items.Add("DARP ETMEK SURETİYLE"); cmbsuc.Items.Add("DİĞERLERİ"); break;

94
case "ZORLA PARA ALMA İDDİASI": cmbsuc.Items.Add("BIÇAK TEHDİDİ İLE"); cmbsuc.Items.Add("SİLAH TEHDİDİ İLE"); cmbsuc.Items.Add("DARP EDEREK"); cmbsuc.Items.Add("DİĞERLERİ"); break; case "ÖLDÜRME": cmbsuc.Items.Add("ATEŞLİ SİLAHLA"); cmbsuc.Items.Add("KESİCİ DELİCİ ALETLE"); cmbsuc.Items.Add("DİĞERLERİ"); break; case "İCRAİ REZALET ÇIKARMAK": cmbsuc.Items.Add("DİĞERLERİ"); break; case "İNTİHAR": cmbsuc.Items.Add("ASI SURETİYLE"); cmbsuc.Items.Add("DİĞERLERİ"); break; case "İŞ YERİNDEN HIRSIZLIK": cmbsuc.Items.Add("ANAHTAR UYDURARAK"); cmbsuc.Items.Add("ASMA KİLİT KIRARAK"); cmbsuc.Items.Add("AÇIK KAPIDAN"); cmbsuc.Items.Add("CAM KIRMAK SURETİYLE"); cmbsuc.Items.Add("CAM SÖKEREK"); cmbsuc.Items.Add("HAVALANDIRMA BOŞ. GİREREK"); cmbsuc.Items.Add("KALDIRIMCILIK SURETİYLE"); cmbsuc.Items.Add("KAPI ZORLAYARAK"); cmbsuc.Items.Add("PENCERE DEMİRİNİ SÖKEREK"); cmbsuc.Items.Add("SERT BİR CİSİM İLE YÜKLENEREK"); cmbsuc.Items.Add("TEKME İLE KIRARAK"); break; case "İŞYERİ KURŞUNLAMA": cmbsuc.Items.Add("BEYLİK TABANCASI İLE"); cmbsuc.Items.Add("DİĞERLERİ"); break; }

95
APPENDIX B
NewOlayTool.aspx File: using System; using System.Web; using MapInfo.Engine; using MapInfo.Data; using System.Data.OleDb; using MapInfo.Mapping; using MapInfo.Web.UI.WebControls; using MapInfo.Geometry; using System.Web.SessionState; namespace crimeXtreme { /// Summary description for newOlayTool. public class newOlayTool:MapTool { private string _clientStartMethod; private string _clientStopMethod; private string _clientCodeSource = null; private string _name; public static readonly string Toolname = "newOlayTool"; public HttpSessionState sess; private WebForm1 parentfrm; public newOlayTool(HttpSessionState hsess,WebForm1 wf ) { sess=hsess; parentfrm=wf; ClientStartMethod = "MapInfoWebRectangleStart"; ClientStopMethod = "MapInfoWebRectangleStop"; } { get { return _name; } set { _name = value; } } // Name of the client side method to set up mouse event handlers for drawing { get { return _clientStartMethod; } set { _clientStartMethod = value; } } // Name of the client side method to cancel the mouse event handlers public override string ClientStopMethod { get { return _clientStopMethod; } set { _clientStopMethod = value; } }

96
public override string ClientCodeSource { get { return _clientCodeSource; } set { _clientCodeSource = value; } } // Url of the cursor image when this tool is active public override string CursorUrl { get {return ""; } set {; } } // This method sets the zoom value public override void Execute(string dataString, System.Collections.ArrayList arrayList, MapInfo.Mapping.Map map) { // Extract points from the string System.Drawing.Point [] points = base.ExtractPoints(dataString); MapInfo.Geometry.DPoint from; map.DisplayTransform.FromDisplay(points[0], out from); CoordinateTransform ctrans=new CoordinateTransform(map.GetDisplayCoordSys(),MapInfo.Engine.Session.Current.CoordSysFactory.CreateFromMapBasicString("Earth Projection 1,28")); MapInfo.Geometry.DPoint to=ctrans.CoordSys1ToCoordSys2(from); System.Diagnostics.Debug.WriteLine(to.x+":"+to.y); sess.Add("olaykoor",to); parentfrm.getmc().Map.Invalidate(); OleDbConnection conn; OleDbCommand comm; conn = new OleDbConnection("Provider = Microsoft.Jet.OLEDB.4.0; Data Source = C:\\Inetpub\\wwwroot\\crimextreme\\Olayx.mdb"); comm = new OleDbCommand("insert into olayx (x,y) values ("+to.x.ToString().Replace(",",".")+","+to.y.ToString().Replace(",",".")+")",conn); conn.Open(); comm.ExecuteNonQuery(); comm.Dispose(); conn.Close(); } } }


![[Date] [Participant Name Participant Address1 …Date] [Participant Name Participant Address1 Participant City ST Zip] Dear Participant: RE: Request for Hardship Distribution under](https://img.pdfslide.net/doc/110x75/5b002b357f8b9af1148c48bc/date-participant-name-participant-address1-date-participant-name-participant.jpg)