Embed Size (px)
Citation preview
Web Chapter 20
A Brief Look at Some OtherElectroanalytical Methods
1
The potentiometric methods described in Chapter 13 involved potential
measurements under conditions in which no current was present in the
cell, and there was thus no net cell reaction. In contrast, the methods
discussed in this chapter are electrolytic methods in which there is a net current
and a net cell reaction.1 Electrogravimetry and coulometry are two related meth-
ods based on an electrolysis that is carried out for a sufficient length of time to
ensure complete oxidation or reduction of the analyte to a product of known
composition. In electrogravimetry, the product is weighed as a deposit on one of
the electrodes. In coulometric procedures, the quantity of electrical charge
needed to complete the electrolysis is measured. On the other hand, voltammetric
techniques measure the current in an electrochemical cell as a function of applied
voltage and use a working microelectrode under conditions in which minimal
consumption of the analyte occurs.
Electrogravimetry and coulometry are moderately sensitive and among the
most accurate and precise techniques available to the chemist. Like gravimetry,
these methods require no preliminary calibration against standards because the
functional relationship between the quantity measured and the analyte concentra-
tion can be derived from theory and atomic-mass data.
Voltammetry is not only of analytical utility, but it is also widely used by inor-
ganic, physical, and biochemists for fundamental studies of oxidation and reduc-
tion processes in various media, adsorption processes on surfaces, and electron
transfer mechanisms at chemically modified electrode surfaces.
1For further information concerning the methods in this chapter, see J. A. Dean, Analytical ChemistryHandbook (New York: McGraw-Hill, 1995), Section 14, pp. 14.57–14.118.
André Marie Ampère (1775–1836), Frenchmathematician and physicist, was the firstto apply mathematics to the study of electri-cal current. Consistent with BenjaminFranklin’s definitions of positive andnegative charge, Ampère defined a positivecurrent to be the direction of flow ofpositive charge. Although we now knowthat negative electrons carry current inmetals, Ampère’s definition has survived tothe pres-ent. The unit of current, theampere, is named in his honor.
Electrogravimetry and coulometry often
have relative errors of a few parts per
thousand.
72795_03_ch20_p01-34.qxp 3/23/11 11:43 AM Page 1
Web Chapter 20 A Brief Look at Some Other Electroanalytical Methods2
20A HOW DOES CURRENT AFFECT THE POTENTIALOF ELECTROCHEMICAL CELLS?
When a current develops in an electrochemical cell, the measured potentialacross the two electrodes is no longer simply the difference between the twoelectrode potentials (the thermodynamic cell potential). Two additional phenom-ena, IR drop and polarization, require application of potentials greater than thethermodynamic potential to operate an electrolytic cell and result in the develop-ment of potentials smaller than theoretical in a galvanic cell. Before proceeding,we will examine these two phenomena in detail. To do so, we will employ as anexample an electrolytic cell that has found application in determining such metalions as copper(II), cadmium(II), and zinc(II) in hydrochloric acid solutions ofthe metals by electrogravimetry and coulometry. A typical cell for the determina-tion of cadmium ion takes the following form:
Here, the right-hand electrode is a metal electrode that has been coated with alayer of cadmium. Because this is the electrode at which the reduction of Cd2�
ions occurs, it is called the working electrode. The left-hand electrode is a sil-ver/silver chloride electrode whose electrode potential remains more or less con-stant during the analysis. The left-hand electrode is thus the reference electrode.Note that this is an example of a cell without liquid junction. As shown inExample 20-1, this cell, as written, has a thermodynamic potential of � 0.734 V.Here, the negative sign for the cell potential indicates that the spontaneous reac-tion is not the reduction of Cd2� on the right and the oxidation of Ag on the left.To reduce Cd2� to Cd, we must construct an electrolytic cell and apply a voltagesomewhat more negative than � 0.734 V in order to make the cadmium elec-trode electron-rich enough to reduce Cd2� to Cd. Such a cell is shown in Figure20-1a. With this cell, we force the Cd electrode to become the cathode so that wecause the net reaction shown in Equation 20-1 to occur.
(20-1)
Note that the cell being considered is reversible so that in the absence of theexternal voltage source shown in the figure, the spontaneous cell reaction is thereverse of Equation 20-1. If the spontaneous reaction is allowed to occur bydischarging the galvanic cell, the Cd electrode is the anode.
20A-1 Ohmic Potential; IR Drop
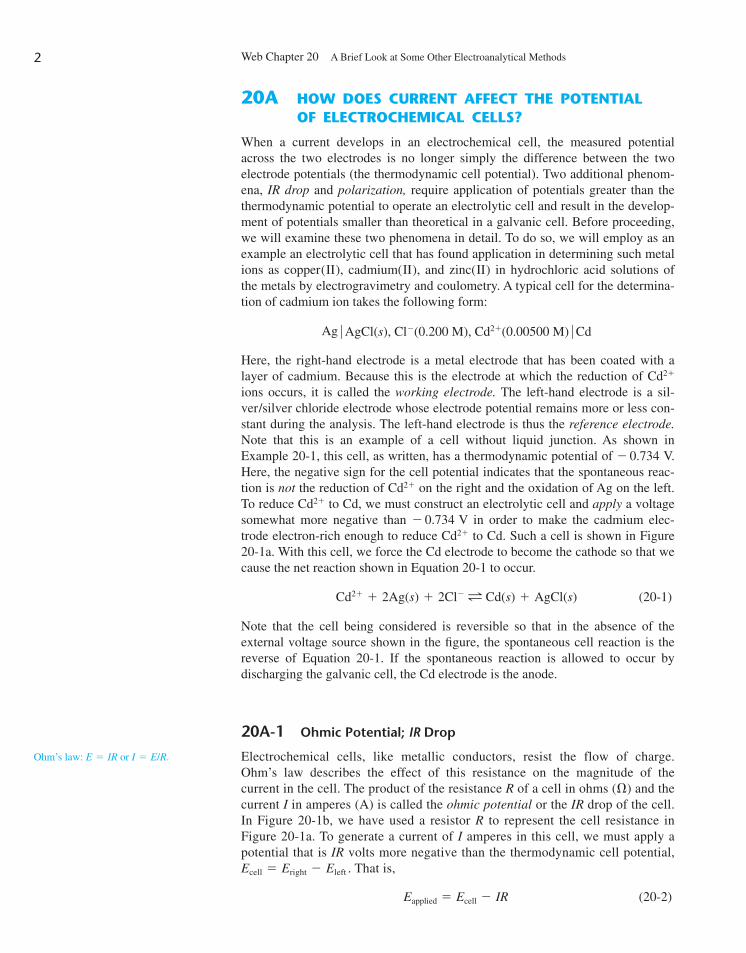
Electrochemical cells, like metallic conductors, resist the flow of charge.Ohm’s law describes the effect of this resistance on the magnitude of thecurrent in the cell. The product of the resistance R of a cell in ohms (�) and thecurrent I in amperes (A) is called the ohmic potential or the IR drop of the cell.In Figure 20-1b, we have used a resistor R to represent the cell resistance inFigure 20-1a. To generate a current of I amperes in this cell, we must apply apotential that is IR volts more negative than the thermodynamic cell potential,Ecell � Eright � Eleft . That is,
(20-2)Eapplied � Ecell � IR
Cd2� � 2Ag(s) � 2Cl� L Cd(s) � AgCl(s)
Ag � AgCl(s), Cl�(0.200 M), Cd2�(0.00500 M) � Cd
Ohm’s law: E � IR or I � E/R.
72795_03_ch20_p01-34.qxp 3/23/11 11:43 AM Page 2
Usually, we try to minimize the IR drop in the cell by having a very small cellresistance (high ionic strength) or by using a special three-electrode cell (seeSection 20C-2) in which the current passes between the working electrode and anauxiliary (or counter) electrode. With this arrangement, only a very small currentpasses between the working electrode and the reference electrode, which mini-mizes the IR drop.
Example 20-1
The following cell has been used for the determination of cadmium in the pres-ence of chloride ions by both electrogravimetry and coulometry.
Calculate the potential that (a) must be applied to prevent a current fromdeveloping in the cell when the two electrodes are connected and (b) must beapplied to cause an electrolytic current of 2.00 mA to develop. Assume that theinternal resistance of the cell is 15.0 �.
(a) In Appendix 4, we find that
AgCl(s) � e� L Ag(s) � Cl� E0 � 0.222 V
Cd2� � 2e� L Cd(s) E0 � �0.403 V
Ag � AgCl(s), Cl�(0.200 M), Cd2�(0.00500 M) � Cd
20A How Does Current Affect the Potential of Electrochemical Cells? 3
–
Ag Cd
Ag
R = 15.0 Ω
Cd
Anode: Ag(s) + Cl– AgCl(s) + e–
e–
Cathode: Cd2+ + 2e– Cd(s)
(a)
[Cd2+] = 0.00500 M[Cl–] = 0.200 MExcess AgCl(s)
Eappl
Eappl
–+
(b)
+
Figure 20-1 An electrolytic cell for determining Cd2�. (a) Current � 0.00 mA. (b) Schematic of cell in(a) with the internal resistance of the cell represented by a 15.0-� resistor and Eapplied increased to give acurrent of 2.00 mA.
72795_03_ch20_p01-34.qxp 3/23/11 11:43 AM Page 3
Web Chapter 20 A Brief Look at Some Other Electroanalytical Methods4
The potential of the cadmium electrode is
and that of the silver electrode is
Since the current is to be 0.00 mA, we find, from Equations 20-2 and 13-1 that
Hence, to prevent the passage of current in this cell, we would need to apply avoltage of � 0.734 V as shown in Figure 20-1a. Note that to obtain a current of0.00 mA, the applied voltage must exactly match the galvanic cell potential.This match is the basis for a very precise null comparison measurement of thegalvanic cell potential. We use a variable, standard voltage source as the ap-plied voltage and adjust its output until a current of 0.00 mA is obtained as in-dicated by a very sensitive current meter. At this null point, the standard voltageis read on a voltmeter to obtain the value of Ecell . Since there is no current atthe null point, this type of voltage measurement prevents the loading error men-tioned in Section 13E.
(b) To calculate the applied potential needed to develop a current of 2.00 mA, or 2.00 � 10�3 A, we substitute into Equation 20-2 to obtain
Thus, to obtain a 2.00-mA current as shown in Figure 20-1b, an applied poten-tial of � 0.764 V would be required.
20A-2 Polarization Effects
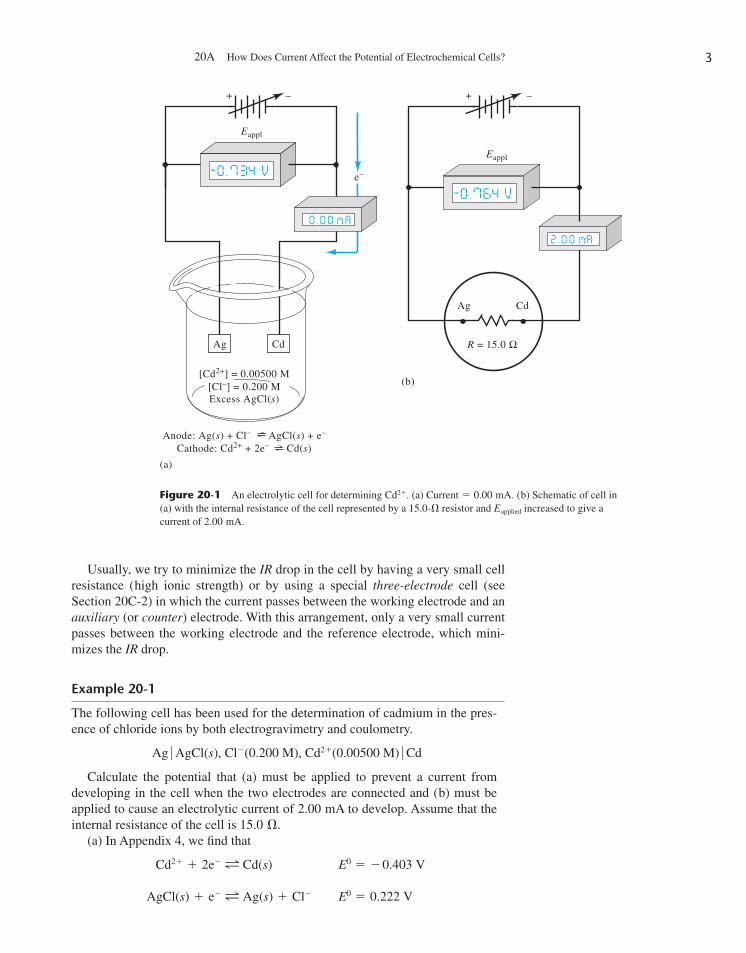
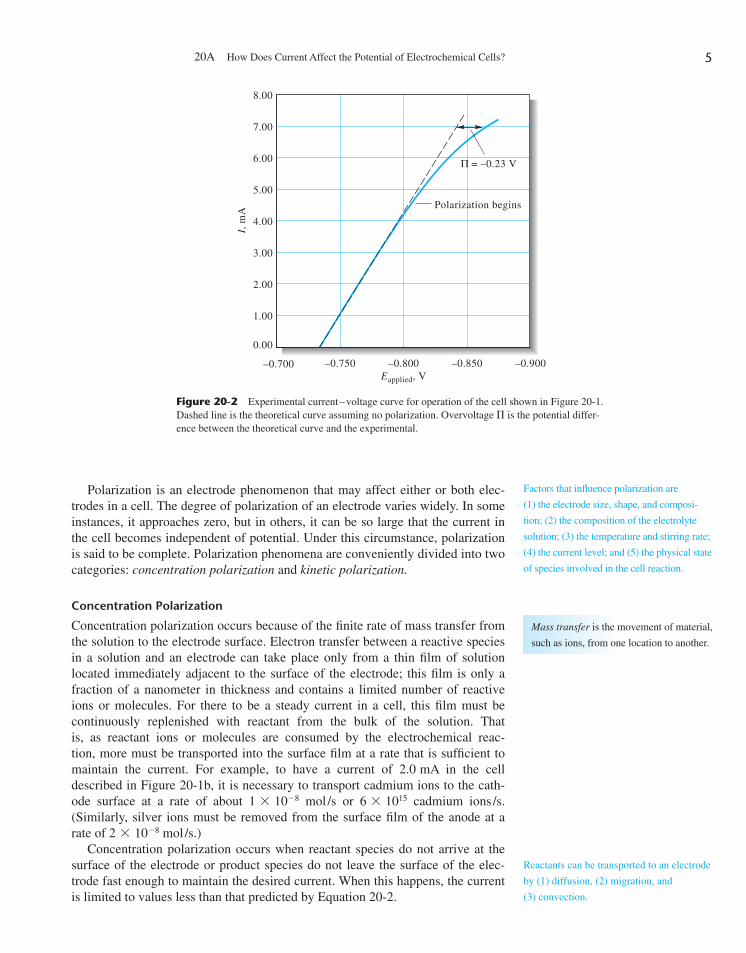
According to Equation 20-2, a plot of current in an electrolytic cell as a functionof applied potential should be a straight line with a slope equal to the negativereciprocal of the resistance. As shown in Figure 20-2, the plot is indeed linearwith small currents. (In this experiment, the measurements were made in a briefenough time so that neither electrode potential is changed significantly as a con-sequence of the electrolytic reaction.) As the applied voltage increases, the cur-rent ultimately begins to deviate from linearity.
Cells that exhibit nonlinear behavior at higher currents are said to be polar-ized, and the degree of polarization is given by an overvoltage, or overpotential,symbolized by � in Figure 20-2. Note that polarization requires the applicationof a potential greater than the theoretical value to give a current of the expectedmagnitude. Thus, the overpotential required to achieve a current of 7.00 mA inthe electrolytic cell in Figure 20-2 is about � 0.23 V. For an electrolytic cellaffected by overvoltage, Equation 20-2 then becomes
(20-3)Eapplied � Ecell � IR � �
� �0.734 � 0.030 � �0.764 V
� �0.734 � 2.00 � 10�3 A � 15 �
Eapplied � Ecell � IR
� �0.471 � 0.263 � �0.734 V
Eapplied � Ecell � Eright � Eleft
Eleft � 0.222 � 0.0592 log (0.200) � 0.263 V
Eright � �0.403 �0.0592
2 log
1
0.00500� �0.471 V
Overvoltage is the potential difference
between the theoretical cell potential
from Equation 20-2 and the actual cell
potential at a given level of current.
72795_03_ch20_p01-34.qxp 3/23/11 11:43 AM Page 4
20A How Does Current Affect the Potential of Electrochemical Cells? 5
Polarization is an electrode phenomenon that may affect either or both elec-trodes in a cell. The degree of polarization of an electrode varies widely. In someinstances, it approaches zero, but in others, it can be so large that the current inthe cell becomes independent of potential. Under this circumstance, polarizationis said to be complete. Polarization phenomena are conveniently divided into twocategories: concentration polarization and kinetic polarization.
Concentration Polarization
Concentration polarization occurs because of the finite rate of mass transfer fromthe solution to the electrode surface. Electron transfer between a reactive speciesin a solution and an electrode can take place only from a thin film of solutionlocated immediately adjacent to the surface of the electrode; this film is only afraction of a nanometer in thickness and contains a limited number of reactiveions or molecules. For there to be a steady current in a cell, this film must becontinuously replenished with reactant from the bulk of the solution. That is, as reactant ions or molecules are consumed by the electrochemical reac-tion, more must be transported into the surface film at a rate that is sufficient tomaintain the current. For example, to have a current of 2.0 mA in the celldescribed in Figure 20-1b, it is necessary to transport cadmium ions to the cath-ode surface at a rate of about 1 � 10�8 mol/s or 6 � 1015 cadmium ions/s.(Similarly, silver ions must be removed from the surface film of the anode at arate of 2 � 10�8 mol/s.)
Concentration polarization occurs when reactant species do not arrive at thesurface of the electrode or product species do not leave the surface of the elec-trode fast enough to maintain the desired current. When this happens, the currentis limited to values less than that predicted by Equation 20-2.
8.00
7.00
6.00
5.00
4.00
3.00
2.00
1.00
0.00
–0.700 –0.750 –0.800Eapplied, V
–0.850 –0.900
I, m
A
Polarization begins
= –0.23 VΠ
Figure 20-2 Experimental current–voltage curve for operation of the cell shown in Figure 20-1.Dashed line is the theoretical curve assuming no polarization. Overvoltage � is the potential differ-ence between the theoretical curve and the experimental.
Factors that influence polarization are
(1) the electrode size, shape, and composi-
tion; (2) the composition of the electrolyte
solution; (3) the temperature and stirring rate;
(4) the current level; and (5) the physical state
of species involved in the cell reaction.
Mass transfer is the movement of material,
such as ions, from one location to another.
Reactants can be transported to an electrode
by (1) diffusion, (2) migration, and
(3) convection.
72795_03_ch20_p01-34.qxp 3/23/11 11:43 AM Page 5

Web Chapter 20 A Brief Look at Some Other Electroanalytical Methods6
Reactants are transported to the surface of an electrode by three mechanisms:(1) diffusion, (2) migration, and (3) convection. Products are removed from elec-trode surfaces in the same ways. We will focus on mass-transport processes tothe cathode, but our discussion applies equally to anodes.
Diffusion. When there is a concentration difference between two regions of asolution, ions or molecules move from the more concentrated region to the moredilute. This process, called diffusion, ultimately leads to a disappearance of theconcentration difference. The rate of diffusion is directly proportional to the con-centration difference. For example, when cadmium ions are deposited at acathode by a current as illustrated in Figure 20-3, the concentration of Cd2� atthe electrode surface [Cd2�]0 becomes lower than the bulk concentration. Thedifference between the concentration at the surface and the concentration in thebulk solution [Cd2�] creates a concentration gradient that causes cadmium ionsto diffuse from the bulk of the solution to the surface film. The rate of diffusionis given by
(20-4)
where [Cd2�] is the reactant concentration in the bulk of the solution, [Cd2�]0 isits equilibrium concentration at the surface of the cathode, and k� is a proportion-ality constant. The value of [Cd2�]0 at any instant is fixed by the potential of theelectrode and can be calculated from the Nernst equation. In the present example,we find the surface cadmium ion concentration from the relationship
where Ecathode is the potential applied to the cathode. As the applied potentialbecomes more and more negative, [Cd2�]0 becomes smaller and smaller. Theresult is that the rate of diffusion and the current become correspondingly largeruntil the surface concentration falls to zero, and the maximum or limiting currentis reached.
Migration. The process by which ions move under the influence of an electricfield is called migration. This process, shown schematically in Figure 20-4, is theprimary cause of mass transfer in the bulk of the solution in a cell. The rate atwhich ions migrate to or away from an electrode surface generally increases asthe electrode potential increases. This charge movement constitutes a current,which also increases with potential. Migration of analyte species is undesirablein most types of electrochemistry, and migration can be minimized by having ahigh concentration of an inert electrolyte, called a supporting electrolyte, presentin the cell. The current in the cell is then primarily due to charges carried by ionsfrom the supporting electrolyte. The supporting electrolyte also serves to reducethe resistance of the cell, which decreases the IR drop.
Convection. Reactants can also be transferred to or from an electrode bymechanical means. Forced convection, such as stirring or agitation, will tend todecrease the thickness of the diffusion layer at the surface of an electrode andthus decrease concentration polarization. Natural convection resulting fromtemperature or density differences also contributes to the transport of moleculesto and from an electrode.
Ecathode � E0Cd2�/Cd �
0.0592
2 log
1
[Cd2�]0
rate of diffusion to cathode surface � k�([Cd2�] � [Cd2�]0)
–
–
–
+ + +
++ +
++ +
+ ++
+ +
+++ +
+++
+ ++
+
+
+
+
+
+
+
+
–
–
–
–
–
–
Å
104–107
Electrons
Freshly deposited Cd atoms
Cd ions
Electrode Bulk solutionDiffusionlayer
Figure 20-3 Concentration changes atthe surface of a cadmium cathode. As Cd2�
ions are reduced to Cd atoms at the elec-trode surface, the concentration of Cd2� atthe surface becomes smaller than the bulkconcentration. Ions then diffuse from thebulk of the solution to the surface as a resultof the concentration gradient. The higherthe current, the larger the concentration gra-dient until the surface concentration falls tozero, its lowest possible value. At this point,the maximum possible current, called thelimiting current, is obtained.
Diffusion is the movement of a species
under the influence of a concentration
gradient. It is the process that causes ions
or molecules to move from a more
concentrated part of a solution to a
more dilute.
Migration involves the movement of ions
through a solution as a result of electro-
static attraction between the ions and the
electrodes.
Convection is the transport of ions or
molecules through a solution as a result of
stirring, vibration, or temperature gradients.
72795_03_ch20_p01-34.qxp 3/23/11 11:43 AM Page 6
20A How Does Current Affect the Potential of Electrochemical Cells? 7
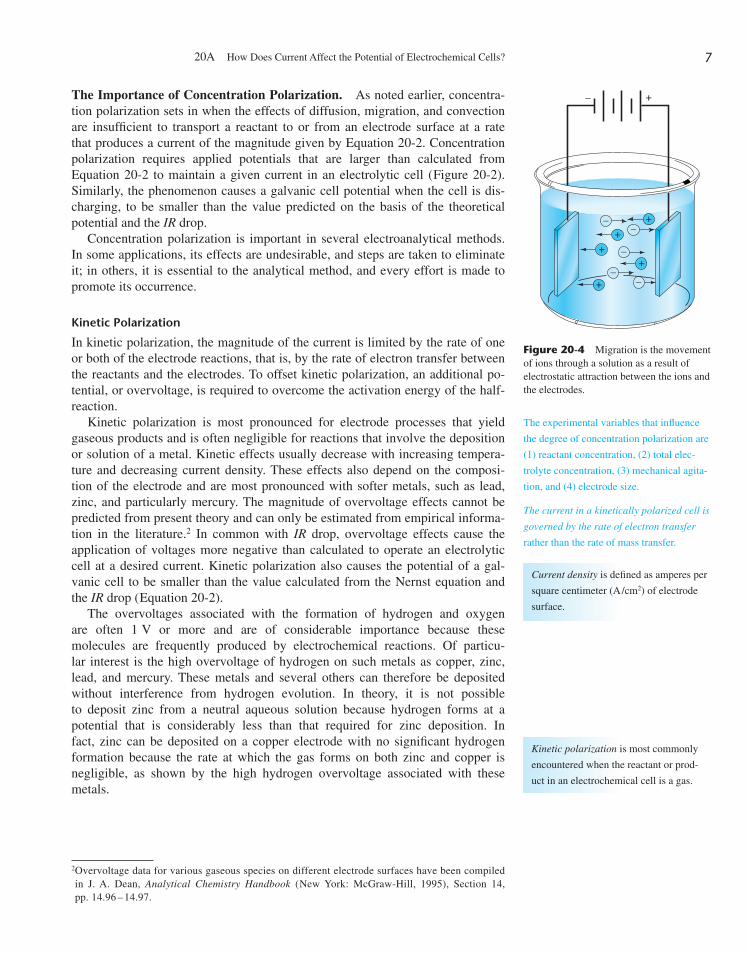
The Importance of Concentration Polarization. As noted earlier, concentra-tion polarization sets in when the effects of diffusion, migration, and convectionare insufficient to transport a reactant to or from an electrode surface at a ratethat produces a current of the magnitude given by Equation 20-2. Concentrationpolarization requires applied potentials that are larger than calculated fromEquation 20-2 to maintain a given current in an electrolytic cell (Figure 20-2).Similarly, the phenomenon causes a galvanic cell potential when the cell is dis-charging, to be smaller than the value predicted on the basis of the theoreticalpotential and the IR drop.
Concentration polarization is important in several electroanalytical methods.In some applications, its effects are undesirable, and steps are taken to eliminateit; in others, it is essential to the analytical method, and every effort is made topromote its occurrence.
Kinetic Polarization
In kinetic polarization, the magnitude of the current is limited by the rate of oneor both of the electrode reactions, that is, by the rate of electron transfer betweenthe reactants and the electrodes. To offset kinetic polarization, an additional po-tential, or overvoltage, is required to overcome the activation energy of the half-reaction.
Kinetic polarization is most pronounced for electrode processes that yieldgaseous products and is often negligible for reactions that involve the depositionor solution of a metal. Kinetic effects usually decrease with increasing tempera-ture and decreasing current density. These effects also depend on the composi-tion of the electrode and are most pronounced with softer metals, such as lead,zinc, and particularly mercury. The magnitude of overvoltage effects cannot bepredicted from present theory and can only be estimated from empirical informa-tion in the literature.2 In common with IR drop, overvoltage effects cause theapplication of voltages more negative than calculated to operate an electrolyticcell at a desired current. Kinetic polarization also causes the potential of a gal-vanic cell to be smaller than the value calculated from the Nernst equation andthe IR drop (Equation 20-2).
The overvoltages associated with the formation of hydrogen and oxygen are often 1 V or more and are of considerable importance because these molecules are frequently produced by electrochemical reactions. Of particu-lar interest is the high overvoltage of hydrogen on such metals as copper, zinc,lead, and mercury. These metals and several others can therefore be depositedwithout interference from hydrogen evolution. In theory, it is not possible to deposit zinc from a neutral aqueous solution because hydrogen forms at a potential that is considerably less than that required for zinc deposition. In fact, zinc can be deposited on a copper electrode with no significant hydrogenformation because the rate at which the gas forms on both zinc and copper isnegligible, as shown by the high hydrogen overvoltage associated with thesemetals.
– +
+––
–
––
+
++
+
Figure 20-4 Migration is the movementof ions through a solution as a result ofelectrostatic attraction between the ions andthe electrodes.
The experimental variables that influence
the degree of concentration polarization are
(1) reactant concentration, (2) total elec-
trolyte concentration, (3) mechanical agita-
tion, and (4) electrode size.
The current in a kinetically polarized cell is
governed by the rate of electron transfer
rather than the rate of mass transfer.
Current density is defined as amperes per
square centimeter (A/cm2) of electrode
surface.
Kinetic polarization is most commonly
encountered when the reactant or prod-
uct in an electrochemical cell is a gas.
2Overvoltage data for various gaseous species on different electrode surfaces have been compiledin J. A. Dean, Analytical Chemistry Handbook (New York: McGraw-Hill, 1995), Section 14,pp. 14.96 – 14.97.
72795_03_ch20_p01-34.qxp 3/23/11 11:43 AM Page 7
Web Chapter 20 A Brief Look at Some Other Electroanalytical Methods8
20B ARE ELECTROLYTIC METHODS SELECTIVE?
In principle, electrolytic methods offer a reasonably selective means for separat-ing and determining a number of ions. The feasibility of and theoretical conditionsfor accomplishing a given separation can be readily derived from the standardelectrode potentials of the species of interest as illustrated in Example 20-2.
Example 20-2
Is a quantitative separation of Cu2� and Pb2� by electrolytic deposition feasiblein principle? If so, what range of cathode potentials (versus SCE) can be used?Assume that the sample solution is initially 0.1000 M in each ion and thatquantitative removal of an ion is realized when only 1 part in 10,000 remainsundeposited.
In Appendix 4, we find that
Pb2� � 2e� L Pb(s) E0 � �0.126 V
Cu2� � 2e� L Cu(s) E0 � 0.337 V
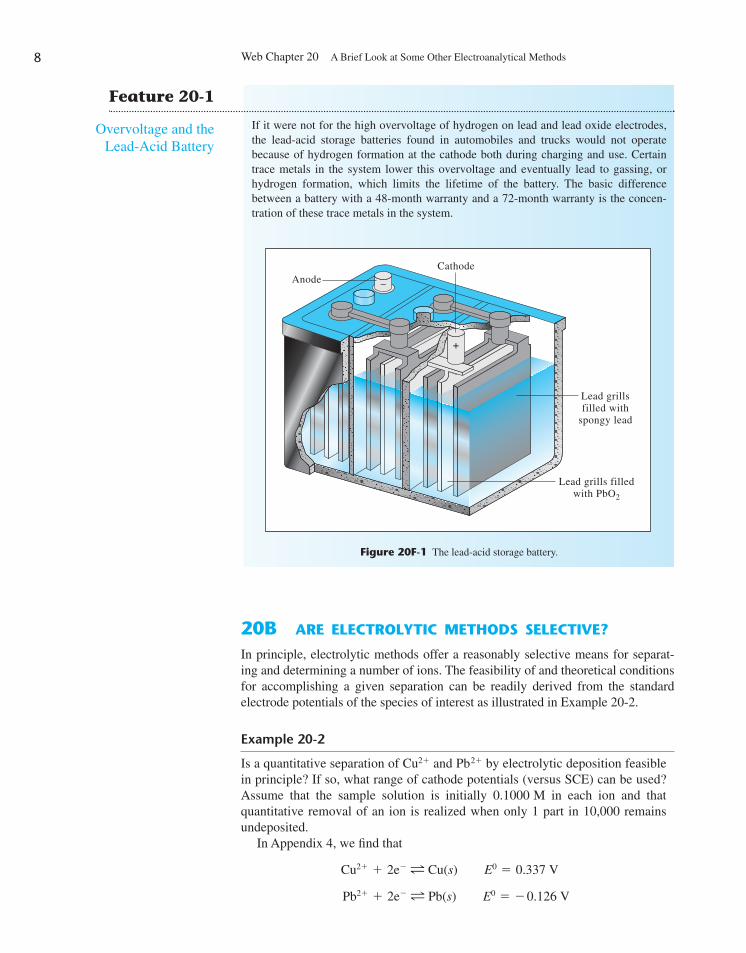
If it were not for the high overvoltage of hydrogen on lead and lead oxide electrodes,the lead-acid storage batteries found in automobiles and trucks would not operatebecause of hydrogen formation at the cathode both during charging and use. Certaintrace metals in the system lower this overvoltage and eventually lead to gassing, orhydrogen formation, which limits the lifetime of the battery. The basic differencebetween a battery with a 48-month warranty and a 72-month warranty is the concen-tration of these trace metals in the system.
Feature 20-1
Overvoltage and the Lead-Acid Battery
AnodeCathode
–
+
Lead grillsfilled with
spongy lead
Lead grills filledwith PbO2
Figure 20F-1 The lead-acid storage battery.
72795_03_ch20_p01-34.qxp 3/23/11 11:43 AM Page 8

20C Electrogravimetric Methods: Weighing the Deposit 9
It is apparent that copper will begin to deposit before lead. Let us first calculatethe potential required to decrease the Cu2� concentration to 10�4 of its originalconcentration (that is, to 1.00 � 10�5 M). Substituting into the Nernst equa-tion, we obtain
Similarly, we can derive the potential at which lead begins to deposit:
Therefore, if the cathode potential is maintained between 0.189 V and � 0.156 V(versus SHE), a quantitative separation should in theory occur. To convert thesepotentials to potentials relative to a saturated calomel electrode, we must subtractthe reference electrode potential and write
and
Therefore, the cathode potential should be kept between � 0.055 and � 0.400 Vversus the SCE to deposit Cu without depositing Pb.
Calculations such as those in Example 20-2 make it possible to computethe differences in standard electrode potentials theoretically needed to deter-mine one ion without interference from another; these differences range fromabout 0.04 V for triply charged ions to approximately 0.24 V for singlycharged species.
These theoretical separation limits can be approached only by maintainingthe potential of the working electrode (usually the cathode, at which a metaldeposits) at the level required. The potential of this electrode can be con-trolled only by variation of the potential applied to the cell, however. FromEquation 20-3, it is evident that variations in Eapplied affect not only the cath-ode potential but also the anode potential, the IR drop, and the overpotential.As a consequence, the only practical way of achieving separation of specieswhose electrode potentials differ by a few tenths of a volt is to monitor thecathode potential continuously against a reference electrode whose potential isknown; the applied cell potential can then be adjusted to maintain the cathodepotential at the desired level. An analysis performed in this way is called acontrolled-potential electrolysis or a potentiostatic electrolysis. Controlled-potential methods are discussed in Sections 20C-2 and 20D-4.
20C ELECTROGRAVIMETRIC METHODS:WEIGHING THE DEPOSIT
Electrolytic precipitation has been used since the late nineteenth century for thegravimetric determination of metals. In most applications, the metal is depositedon a weighed platinum cathode, and the increase in mass is determined.
Ecell � Ecathode � ESCE � �0.156 � 0.244 � �0.400 V for depositing Pb
Ecell � Ecathode � ESCE � 0.189 � 0.244 � �0.055 V for depositing Cu
E � �0.126 �0.0592
2 log
1
0.1000� �0.156 V
E � 0.337 �0.0592
2 log
1
1.00 � 10�5� 0.189 V
72795_03_ch20_p01-34.qxp 3/23/11 11:43 AM Page 9
Web Chapter 20 A Brief Look at Some Other Electroanalytical Methods10
Important exceptions to this procedure include the anodic deposition of lead aslead dioxide on platinum and of chloride as silver chloride on silver.
There are two general types of electrogravimetric methods. In one, no con-trol of the potential of the working electrode is exercised and the applied cellpotential is held at a more or less constant level that provides a large enoughcurrent to complete the electrolysis in a reasonable length of time. The secondtype of electrogravimetric method is the controlled-potential or potentiostaticmethod.
20C-1 Electrogravimetry without Potential Control
Electrolytic procedures in which no effort is made to control the potential of theworking electrode make use of simple and inexpensive equipment and requirelittle operator attention. In these procedures, the potential applied across the cellis maintained at a more or less constant level throughout the electrolysis.
Instrumentation
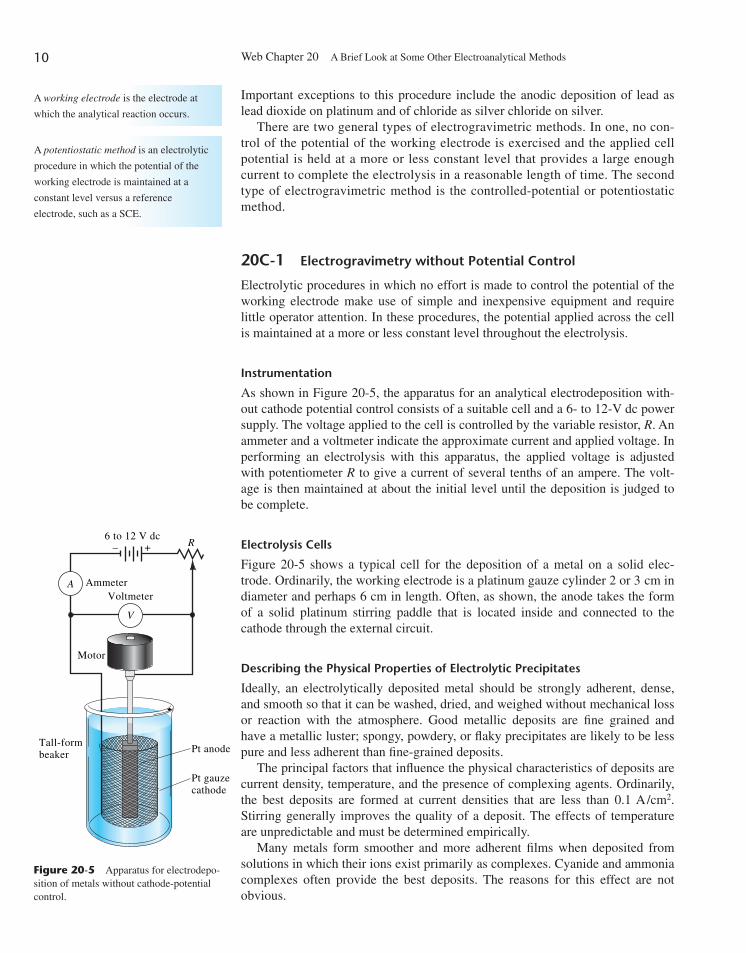
As shown in Figure 20-5, the apparatus for an analytical electrodeposition with-out cathode potential control consists of a suitable cell and a 6- to 12-V dc powersupply. The voltage applied to the cell is controlled by the variable resistor, R. Anammeter and a voltmeter indicate the approximate current and applied voltage. Inperforming an electrolysis with this apparatus, the applied voltage is adjustedwith potentiometer R to give a current of several tenths of an ampere. The volt-age is then maintained at about the initial level until the deposition is judged tobe complete.
Electrolysis Cells
Figure 20-5 shows a typical cell for the deposition of a metal on a solid elec-trode. Ordinarily, the working electrode is a platinum gauze cylinder 2 or 3 cm indiameter and perhaps 6 cm in length. Often, as shown, the anode takes the formof a solid platinum stirring paddle that is located inside and connected to thecathode through the external circuit.
Describing the Physical Properties of Electrolytic Precipitates
Ideally, an electrolytically deposited metal should be strongly adherent, dense,and smooth so that it can be washed, dried, and weighed without mechanical lossor reaction with the atmosphere. Good metallic deposits are fine grained andhave a metallic luster; spongy, powdery, or flaky precipitates are likely to be lesspure and less adherent than fine-grained deposits.
The principal factors that influence the physical characteristics of deposits arecurrent density, temperature, and the presence of complexing agents. Ordinarily,the best deposits are formed at current densities that are less than 0.1 A/cm2.Stirring generally improves the quality of a deposit. The effects of temperatureare unpredictable and must be determined empirically.
Many metals form smoother and more adherent films when deposited fromsolutions in which their ions exist primarily as complexes. Cyanide and ammoniacomplexes often provide the best deposits. The reasons for this effect are notobvious.
A working electrode is the electrode at
which the analytical reaction occurs.
A potentiostatic method is an electrolytic
procedure in which the potential of the
working electrode is maintained at a
constant level versus a reference
electrode, such as a SCE.
6 to 12 V dc– +
AmmeterVoltmeter
Motor
Tall-formbeaker Pt anode
Pt gauzecathode
R
A
V
Figure 20-5 Apparatus for electrodepo-sition of metals without cathode-potentialcontrol.
72795_03_ch20_p01-34.qxp 3/23/11 11:43 AM Page 10
20C Electrogravimetric Methods: Weighing the Deposit 11
Applying Electrogravimetric Methods
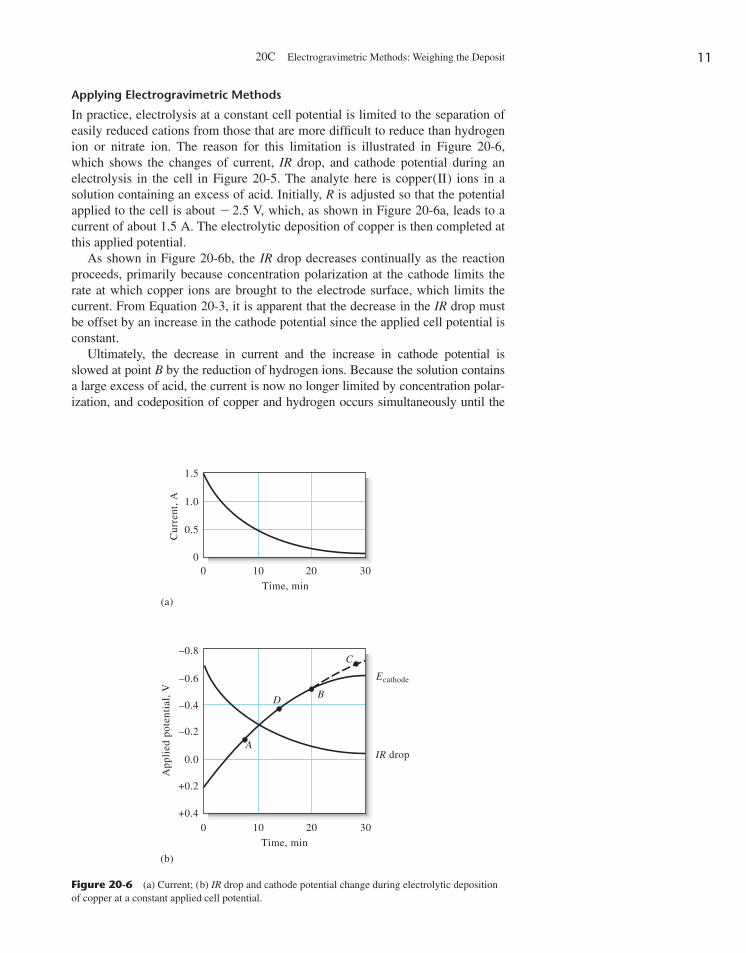
In practice, electrolysis at a constant cell potential is limited to the separation ofeasily reduced cations from those that are more difficult to reduce than hydrogenion or nitrate ion. The reason for this limitation is illustrated in Figure 20-6,which shows the changes of current, IR drop, and cathode potential during anelectrolysis in the cell in Figure 20-5. The analyte here is copper(II) ions in asolution containing an excess of acid. Initially, R is adjusted so that the potentialapplied to the cell is about � 2.5 V, which, as shown in Figure 20-6a, leads to acurrent of about 1.5 A. The electrolytic deposition of copper is then completed atthis applied potential.
As shown in Figure 20-6b, the IR drop decreases continually as the reactionproceeds, primarily because concentration polarization at the cathode limits therate at which copper ions are brought to the electrode surface, which limits thecurrent. From Equation 20-3, it is apparent that the decrease in the IR drop mustbe offset by an increase in the cathode potential since the applied cell potential isconstant.
Ultimately, the decrease in current and the increase in cathode potential isslowed at point B by the reduction of hydrogen ions. Because the solution containsa large excess of acid, the current is now no longer limited by concentration polar-ization, and codeposition of copper and hydrogen occurs simultaneously until the
1.5
1.0
0.5
–0.8
–0.4
–0.6
–0.2
+0.2
+0.40 10
Time, min
20 30
0.0
00
(a)
(b)
Cur
rent
, AA
ppli
ed p
oten
tial
, V
10
Time, min
20 30
A
D B
C
Ecathode
IR drop
Figure 20-6 (a) Current; (b) IR drop and cathode potential change during electrolytic depositionof copper at a constant applied cell potential.
72795_03_ch20_p01-34.qxp 3/23/11 11:43 AM Page 11
Web Chapter 20 A Brief Look at Some Other Electroanalytical Methods12
remainder of the copper ions is deposited. Under these conditions, the cathode issaid to be depolarized by hydrogen ions.
Consider now the fate of some metal ion, such as lead(II), which begins todeposit at point A on the cathode potential curve. Clearly, it would codeposit wellbefore copper deposition was complete, and an interference would result. Incontrast, a metal ion, such as cobalt(II), which reacts at a cathode potential cor-responding to point C on the curve, would not interfere because depolarizationby hydrogen gas formation prevents the cathode from reaching this potential.
Codeposition of hydrogen during electrolysis often leads to formation of non-adherent deposits, which are unsatisfactory for analytical purposes. This problemcan be resolved by introducing another species that is reduced at a less negativepotential than hydrogen ion and that does not adversely affect the physical prop-erties of the deposit. One such cathode depolarizer is nitrate ion.
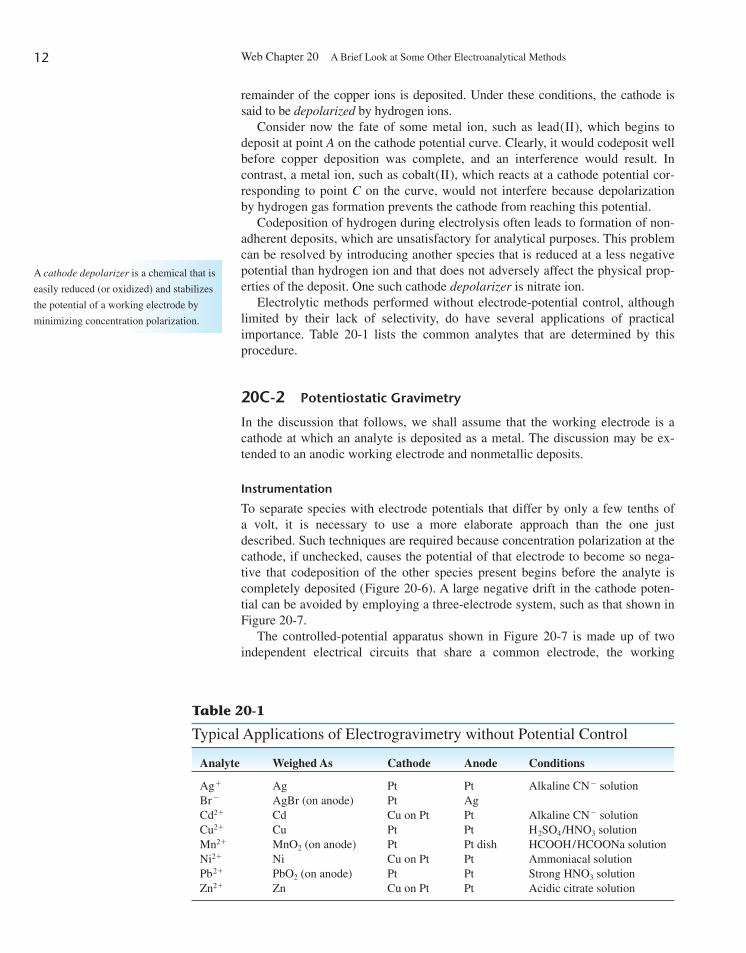
Electrolytic methods performed without electrode-potential control, althoughlimited by their lack of selectivity, do have several applications of practicalimportance. Table 20-1 lists the common analytes that are determined by this procedure.
20C-2 Potentiostatic Gravimetry
In the discussion that follows, we shall assume that the working electrode is acathode at which an analyte is deposited as a metal. The discussion may be ex-tended to an anodic working electrode and nonmetallic deposits.
Instrumentation
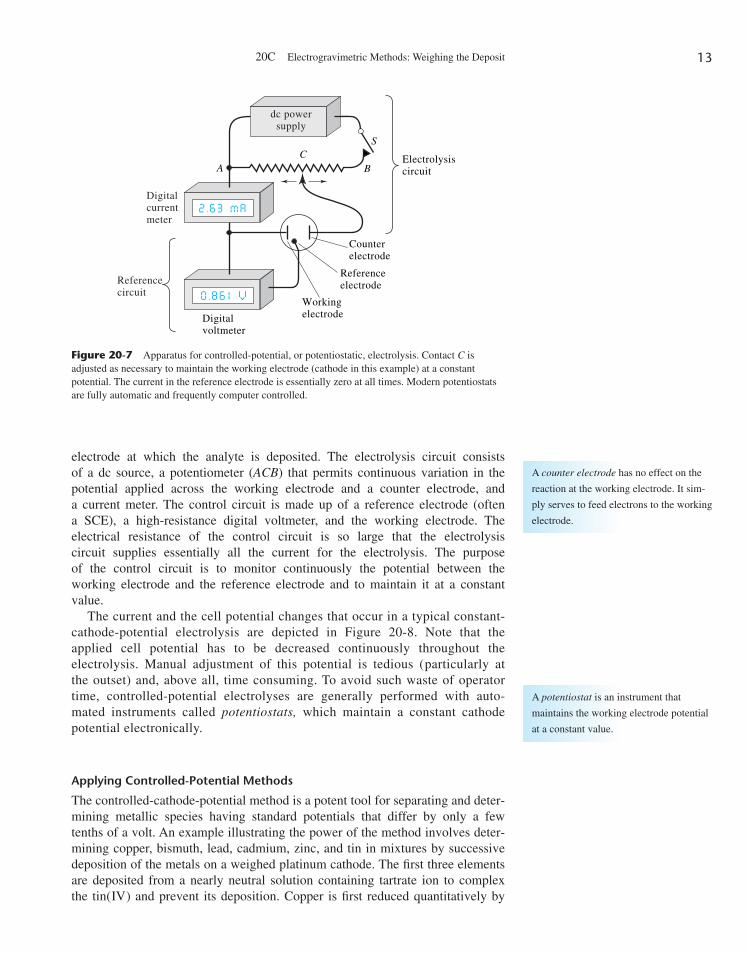
To separate species with electrode potentials that differ by only a few tenths of a volt, it is necessary to use a more elaborate approach than the one justdescribed. Such techniques are required because concentration polarization at thecathode, if unchecked, causes the potential of that electrode to become so nega-tive that codeposition of the other species present begins before the analyte iscompletely deposited (Figure 20-6). A large negative drift in the cathode poten-tial can be avoided by employing a three-electrode system, such as that shown inFigure 20-7.
The controlled-potential apparatus shown in Figure 20-7 is made up of twoindependent electrical circuits that share a common electrode, the working
Table 20-1
Typical Applications of Electrogravimetry without Potential Control
Analyte Weighed As Cathode Anode Conditions
Ag� Ag Pt Pt Alkaline CN� solutionBr� AgBr (on anode) Pt AgCd2� Cd Cu on Pt Pt Alkaline CN� solutionCu2� Cu Pt Pt H2SO4/HNO3 solutionMn2� MnO2 (on anode) Pt Pt dish HCOOH/HCOONa solutionNi2� Ni Cu on Pt Pt Ammoniacal solutionPb2� PbO2 (on anode) Pt Pt Strong HNO3 solutionZn2� Zn Cu on Pt Pt Acidic citrate solution
A cathode depolarizer is a chemical that is
easily reduced (or oxidized) and stabilizes
the potential of a working electrode by
minimizing concentration polarization.
72795_03_ch20_p01-34.qxp 3/23/11 11:43 AM Page 12
20C Electrogravimetric Methods: Weighing the Deposit 13
electrode at which the analyte is deposited. The electrolysis circuit consists of a dc source, a potentiometer (ACB) that permits continuous variation in thepotential applied across the working electrode and a counter electrode, and a current meter. The control circuit is made up of a reference electrode (often a SCE), a high-resistance digital voltmeter, and the working electrode. The electrical resistance of the control circuit is so large that the electrolysis circuit supplies essentially all the current for the electrolysis. The purpose of the control circuit is to monitor continuously the potential between the working electrode and the reference electrode and to maintain it at a constantvalue.
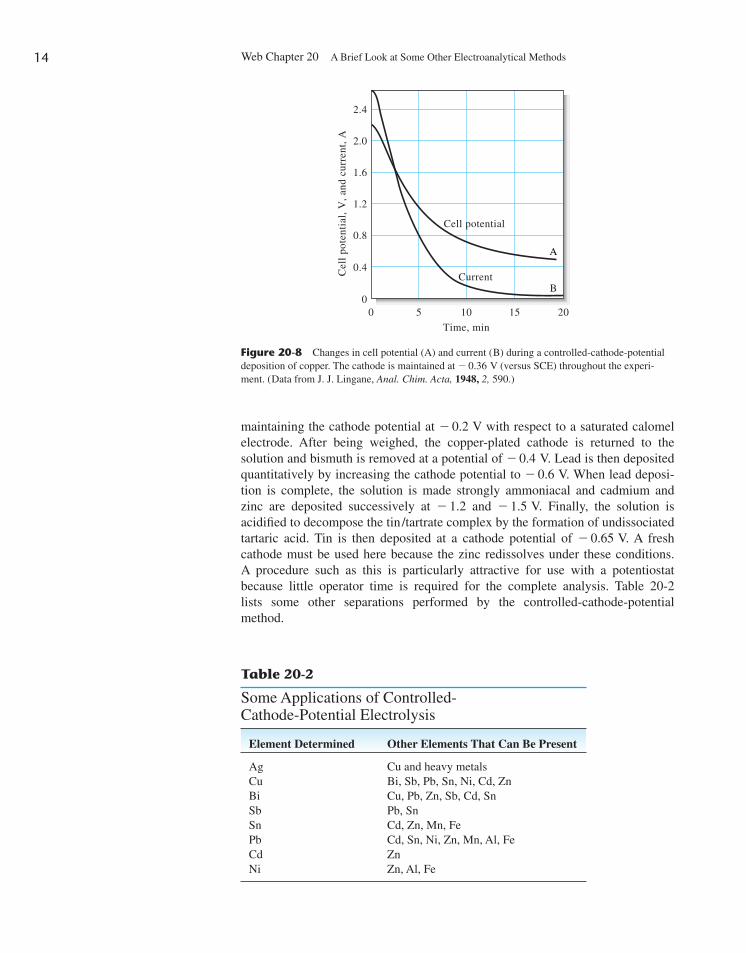
The current and the cell potential changes that occur in a typical constant-cathode-potential electrolysis are depicted in Figure 20-8. Note that theapplied cell potential has to be decreased continuously throughout theelectrolysis. Manual adjustment of this potential is tedious (particularly atthe outset) and, above all, time consuming. To avoid such waste of operatortime, controlled-potential electrolyses are generally performed with auto-mated instruments called potentiostats, which maintain a constant cathodepotential electronically.
Applying Controlled-Potential Methods
The controlled-cathode-potential method is a potent tool for separating and deter-mining metallic species having standard potentials that differ by only a fewtenths of a volt. An example illustrating the power of the method involves deter-mining copper, bismuth, lead, cadmium, zinc, and tin in mixtures by successivedeposition of the metals on a weighed platinum cathode. The first three elementsare deposited from a nearly neutral solution containing tartrate ion to complexthe tin(IV) and prevent its deposition. Copper is first reduced quantitatively by
dc powersupply
Digitalcurrentmeter
Referencecircuit
S
BC
A
Digitalvoltmeter
Workingelectrode
Referenceelectrode
Counterelectrode
Electrolysiscircuit
Figure 20-7 Apparatus for controlled-potential, or potentiostatic, electrolysis. Contact C isadjusted as necessary to maintain the working electrode (cathode in this example) at a constantpotential. The current in the reference electrode is essentially zero at all times. Modern potentiostatsare fully automatic and frequently computer controlled.
A counter electrode has no effect on the
reaction at the working electrode. It sim-
ply serves to feed electrons to the working
electrode.
A potentiostat is an instrument that
maintains the working electrode potential
at a constant value.
72795_03_ch20_p01-34.qxp 3/23/11 11:43 AM Page 13
Web Chapter 20 A Brief Look at Some Other Electroanalytical Methods14
maintaining the cathode potential at � 0.2 V with respect to a saturated calomelelectrode. After being weighed, the copper-plated cathode is returned to thesolution and bismuth is removed at a potential of � 0.4 V. Lead is then depositedquantitatively by increasing the cathode potential to � 0.6 V. When lead deposi-tion is complete, the solution is made strongly ammoniacal and cadmium andzinc are deposited successively at � 1.2 and � 1.5 V. Finally, the solution isacidified to decompose the tin/tartrate complex by the formation of undissociatedtartaric acid. Tin is then deposited at a cathode potential of � 0.65 V. A freshcathode must be used here because the zinc redissolves under these conditions.A procedure such as this is particularly attractive for use with a potentiostatbecause little operator time is required for the complete analysis. Table 20-2lists some other separations performed by the controlled-cathode-potentialmethod.
2.4
2.0
1.6
1.2
0.8
0.4
00 5 10
Time, min
15 20
Cel
l po
tent
ial,
V, a
nd c
urre
nt, A
Cell potential
Current
A
B
Figure 20-8 Changes in cell potential (A) and current (B) during a controlled-cathode-potentialdeposition of copper. The cathode is maintained at � 0.36 V (versus SCE) throughout the experi-ment. (Data from J. J. Lingane, Anal. Chim. Acta, 1948, 2, 590.)
Table 20-2
Some Applications of Controlled-Cathode-Potential Electrolysis
Element Determined Other Elements That Can Be Present
Ag Cu and heavy metalsCu Bi, Sb, Pb, Sn, Ni, Cd, ZnBi Cu, Pb, Zn, Sb, Cd, SnSb Pb, SnSn Cd, Zn, Mn, FePb Cd, Sn, Ni, Zn, Mn, Al, FeCd ZnNi Zn, Al, Fe
72795_03_ch20_p01-34.qxp 3/23/11 11:43 AM Page 14
1520D Coulometric Methods of Analysis
20D COULOMETRIC METHODS OF ANALYSIS
Coulometric methods are performed by measuring the quantity of electricalcharge (electrons) required to convert a sample of an analyte quantitatively to adifferent oxidation state. Coulometric and gravimetric methods share the com-mon advantage that the proportionality constant between the quantity measuredand the analyte mass is derived from accurately known physical constants, thuseliminating the need for calibration standards. In contrast to gravimetric meth-ods, coulometric procedures are usually rapid and do not require that the productof the electrochemical reaction be a weighable solid. Coulometric methods are asaccurate as conventional gravimetric and volumetric procedures; in addition,they are readily automated.3
20D-1 Determining the Quantity of Electrical Charge
Units for the quantity of charge include the coulomb (C) and the faraday (F). Thecoulomb is the quantity of electrical charge transported by a constant current ofone ampere in one second. Thus, the number of coulombs (Q) resulting from aconstant current of I amperes operated for t seconds is
(20-5)
For a variable current i, the number of coulombs is given by the integral
(20-6)
The faraday is the quantity of charge that corresponds to one mole or 6.022 � 1023 electrons. The faraday also equals 96,485 C. As shown in Example20-3, we can use these definitions to calculate the mass of a chemical species thatis formed at an electrode by a current of known magnitude.
Example 20-3
A constant current of 0.800 A is used to deposit copper at the cathode and oxy-gen at the anode of an electrolytic cell. Calculate the number of grams of eachproduct formed in 15.2 min, assuming no other redox reaction.
The two half-reactions are
Cu2� � 2e�: Cu(s)
Q � �t
0idt
Q � It
3For additional information about coulometric methods, see J. A. Dean, Analytical ChemistryHandbook (New York: McGraw-Hill, 1995), Section 14, pp. 14.118–14.133; D. J. Curran, inLaboratory Techniques in Electroanalytical Chemistry, P. T. Kissinger and W. R. Heineman, Eds.,(New York: Marcel Dekker, 1984), pp. 539–568; J. A. Plambeck, Electroanalytical Chemistry (NewYork: Wiley, 1982), Chapter 12.
1 coulomb � 1 ampere second � 1 A s
A faraday of charge is equivalent to one
mole of electrons or 6.022 � 1023
electrons.
72795_03_ch20_p01-34.qxp 3/23/11 11:43 AM Page 15
Web Chapter 20 A Brief Look at Some Other Electroanalytical Methods16
Thus 1 mol of copper is equivalent to 2 mol of electrons, and 1 mol of oxygencorresponds to 4 mol of electrons.
Substituting into Equation 20-5 yields
The masses of Cu and O2 are given by
20D-2 Characterizing Coulometric Methods
Two methods have been developed that are based on measuring the quantity ofcharge: potentiostatic coulometry and amperostatic coulometry, or coulometrictitrimetry. Potentiostatic methods are performed in much the same way as con-trolled-potential gravimetric methods, with the potential of the working electrodebeing maintained at a constant level relative to a reference electrode throughoutthe electrolysis. Here, however, the electrolysis current is recorded as a functionof time to give a curve similar to curve B in Figure 20-8. The analysis is thencompleted by integrating the current-time curve to obtain the number ofcoulombs and thus the number of faradays of charge consumed or produced bythe analyte.
Coulometric titrations are similar to other titrimetric methods in that analysesare based on measuring the combining capacity of the analyte with a standardreagent. In a coulometric procedure, the “reagent” is composed of electrons, andthe “standard solution” is a constant current of known magnitude. Electrons areadded to the analyte (via the direct current) or to some species that immediatelyreacts with the analyte until the point of chemical equivalence is indicated. Atthat point, the electrolysis is discontinued. The amount of analyte is determinedfrom the magnitude of the current and the time required to complete the titration.The magnitude of the current in amperes is analogous to the molarity of a stan-dard solution, and the time measurement is analogous to the volume measure-ment in conventional titrimetry.
20D-3 Current-Efficiency Requirements
A fundamental requirement for all coulometric methods is 100% current effi-ciency; that is, each faraday of electricity must bring about one equivalent ofchemical change in the analyte. Note that 100% current efficiency can be
mass O2 � 7.56 � 10�3 mol e� �1 mol O2
4 mol e��
32.00 g O2
1 mol O2� 0.0605 g O2
mass Cu � 7.56 � 10�3 mol e� �1 mol Cu
2 mol e��
63.55 g Cu
1 mol Cu� 0.240 g Cu
no. F �729.6 C
96,485 C/F� 7.56 � 10�3 F � 7.56 � 10�3 mol of electrons
Q � 0.800 A � 15.2 min � 60 s/min � 729.6 As � 729.6 C
2H2O : 4e� � O2(g) � 4H�
Michael Faraday (1791–1867) was one ofthe foremost chemists and physicists of histime. Among his most important discoverieswere Faraday’s laws of electrolysis. Faraday,a simple man who lacked mathematical so-phistication, was a superb experimentalistand an inspiring teacher and lecturer. Thequantity of charge equal to a mole of elec-trons is named in his honor.
Amperostatic coulometry is also called
coulometric titrimetry.
Electrons are the reagent in a coulometric
titration.
72795_03_ch20_p01-34.qxp 3/23/11 11:43 AM Page 16
20D Coulometric Methods of Analysis 17
achieved without direct participation of the analyte in electron transfer at anelectrode. For example, chloride ions are readily determined by potentiostaticcoulometry or by coulometric titrations by generating silver ions at a silver anode. These ions then react with the analyte to form a precipitate or deposit ofsilver chloride. The quantity of electricity required to complete the silver chlo-ride formation serves as the analytical parameter. In this instance, 100% cur-rent efficiency is realized because the number of moles of electrons is exactlyequal to the number of moles of chloride ion in the sample, even though theseions do not react directly at the electrode surface.
20D-4 Controlled-Potential Coulometry
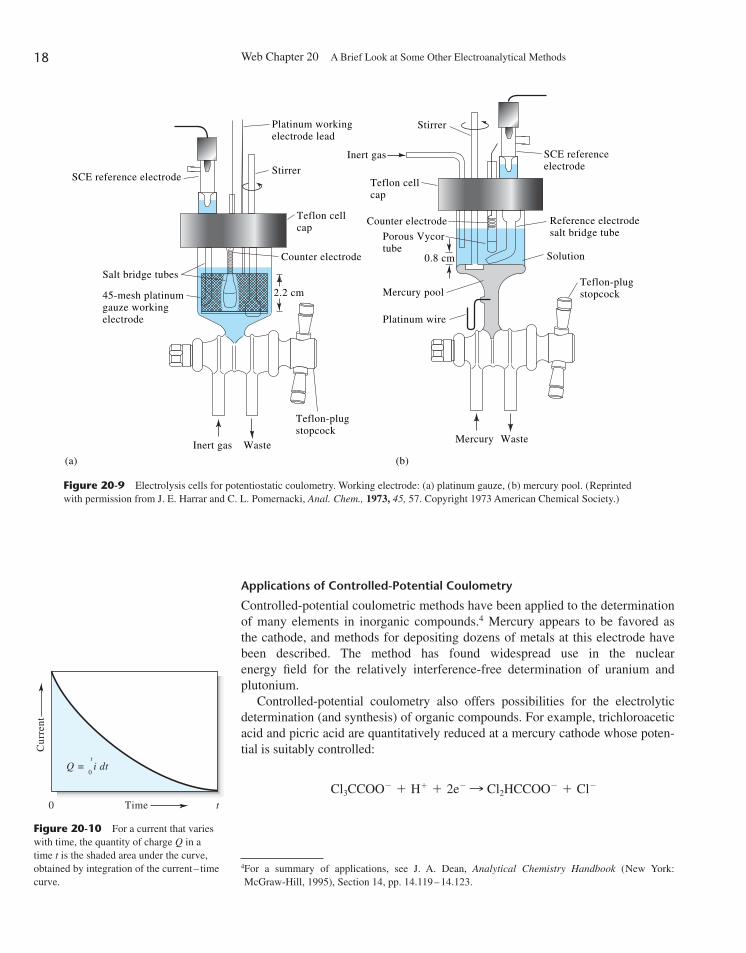
In controlled-potential coulometry, the potential of the working electrode ismaintained at a constant level such that only the analyte is responsible for theconduction of charge across the electrode-solution interface. The number ofcoulombs required to convert the analyte to its reaction product is thendetermined by recording and integrating the current-versus-time curve for theelectrolysis.
Instrumentation
The instrumentation for potentiostatic coulometry consists of an electrolysis cell,a potentiostat, and a device for determining the number of coulombs consumedby the analyte.
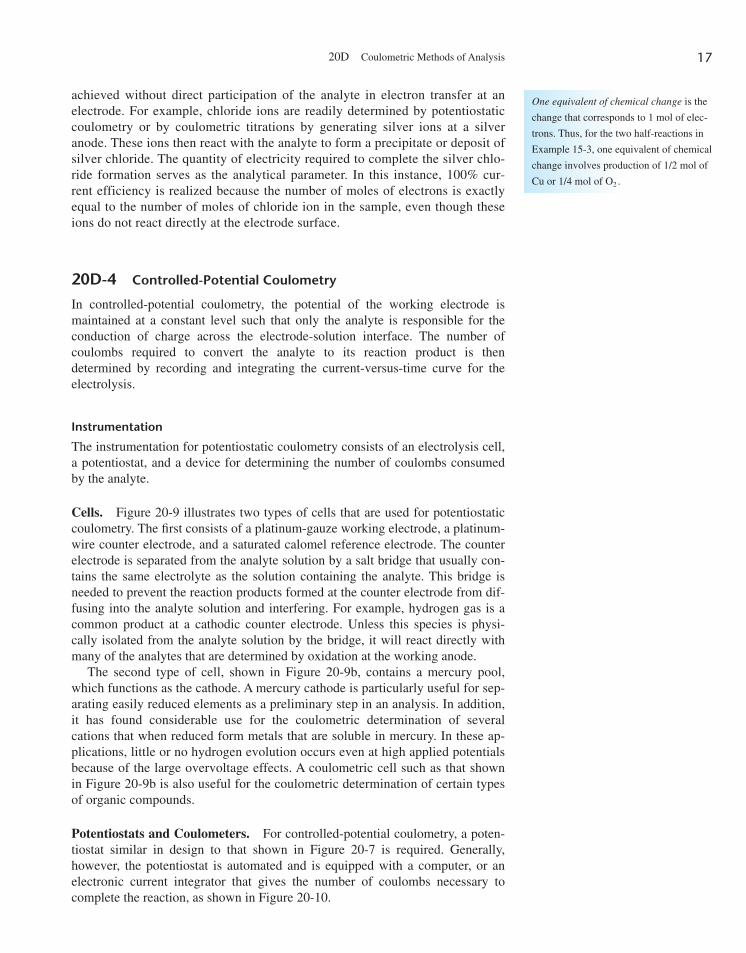
Cells. Figure 20-9 illustrates two types of cells that are used for potentiostaticcoulometry. The first consists of a platinum-gauze working electrode, a platinum-wire counter electrode, and a saturated calomel reference electrode. The counterelectrode is separated from the analyte solution by a salt bridge that usually con-tains the same electrolyte as the solution containing the analyte. This bridge isneeded to prevent the reaction products formed at the counter electrode from dif-fusing into the analyte solution and interfering. For example, hydrogen gas is acommon product at a cathodic counter electrode. Unless this species is physi-cally isolated from the analyte solution by the bridge, it will react directly withmany of the analytes that are determined by oxidation at the working anode.
The second type of cell, shown in Figure 20-9b, contains a mercury pool,which functions as the cathode. A mercury cathode is particularly useful for sep-arating easily reduced elements as a preliminary step in an analysis. In addition,it has found considerable use for the coulometric determination of severalcations that when reduced form metals that are soluble in mercury. In these ap-plications, little or no hydrogen evolution occurs even at high applied potentialsbecause of the large overvoltage effects. A coulometric cell such as that shownin Figure 20-9b is also useful for the coulometric determination of certain typesof organic compounds.
Potentiostats and Coulometers. For controlled-potential coulometry, a poten-tiostat similar in design to that shown in Figure 20-7 is required. Generally,however, the potentiostat is automated and is equipped with a computer, or anelectronic current integrator that gives the number of coulombs necessary tocomplete the reaction, as shown in Figure 20-10.
One equivalent of chemical change is the
change that corresponds to 1 mol of elec-
trons. Thus, for the two half-reactions in
Example 15-3, one equivalent of chemical
change involves production of 1/2 mol of
Cu or 1/4 mol of O2 .
72795_03_ch20_p01-34.qxp 3/23/11 11:43 AM Page 17
Web Chapter 20 A Brief Look at Some Other Electroanalytical Methods18
Applications of Controlled-Potential Coulometry
Controlled-potential coulometric methods have been applied to the determinationof many elements in inorganic compounds.4 Mercury appears to be favored asthe cathode, and methods for depositing dozens of metals at this electrode havebeen described. The method has found widespread use in the nuclear energy field for the relatively interference-free determination of uranium andplutonium.
Controlled-potential coulometry also offers possibilities for the electrolyticdetermination (and synthesis) of organic compounds. For example, trichloroaceticacid and picric acid are quantitatively reduced at a mercury cathode whose poten-tial is suitably controlled:
Cl3CCOO� � H� � 2e� : Cl2HCCOO� � Cl�
SCE reference electrode
Salt bridge tubes
45-mesh platinumgauze workingelectrode
Inert gas
(a) (b)
WasteWasteMercury
Platinum wire
Mercury pool
Counter electrode
Porous Vycortube
Platinum workingelectrode lead
Stirrer
Counter electrode
Teflon cellcap
2.2 cm
0.8 cm Solution
Teflon-plugstopcock
Teflon-plugstopcock
Teflon cellcap
Inert gas
Stirrer
SCE referenceelectrode
Reference electrodesalt bridge tube
Figure 20-9 Electrolysis cells for potentiostatic coulometry. Working electrode: (a) platinum gauze, (b) mercury pool. (Reprintedwith permission from J. E. Harrar and C. L. Pomernacki, Anal. Chem., 1973, 45, 57. Copyright 1973 American Chemical Society.)
Cur
rent
0
0
Time t
tQ = i dt
Figure 20-10 For a current that varieswith time, the quantity of charge Q in atime t is the shaded area under the curve,obtained by integration of the current– timecurve.
4For a summary of applications, see J. A. Dean, Analytical Chemistry Handbook (New York:McGraw-Hill, 1995), Section 14, pp. 14.119–14.123.
72795_03_ch20_p01-34.qxp 3/23/11 11:43 AM Page 18
20D Coulometric Methods of Analysis 19
Coulometric measurements permit the determination of these compounds with arelative error of a few tenths of a percent.
20D-5 Coulometric Titrations5
Coulometric titrations are carried out with a constant-current source called anamperostat, which senses decreases in current in a cell and responds by increas-ing the potential applied to the cell until the current is restored to its originallevel. Because of the effects of concentration polarization, 100% current effi-ciency with respect to the analyte can be maintained only by having a largeexcess of an auxiliary reagent that is oxidized or reduced at the electrode to givea product that in turn reacts with the analyte. As an example, consider the coulo-metric titration of iron(II) at a platinum anode. At the beginning of the titration,the primary anodic reaction is
As the concentration of iron(II) decreases, however, the requirement of a con-stant current results in an increase in the applied cell potential. Because ofconcentration polarization, this increase in potential causes the anode potential to
Fe2� : Fe3� � e�
� 18H� � 18e�O2N NO2
OH
NO2
� 6H2OH2N NH2
OH
NH2
Constant current generators are called
amperostats or galvanostats.
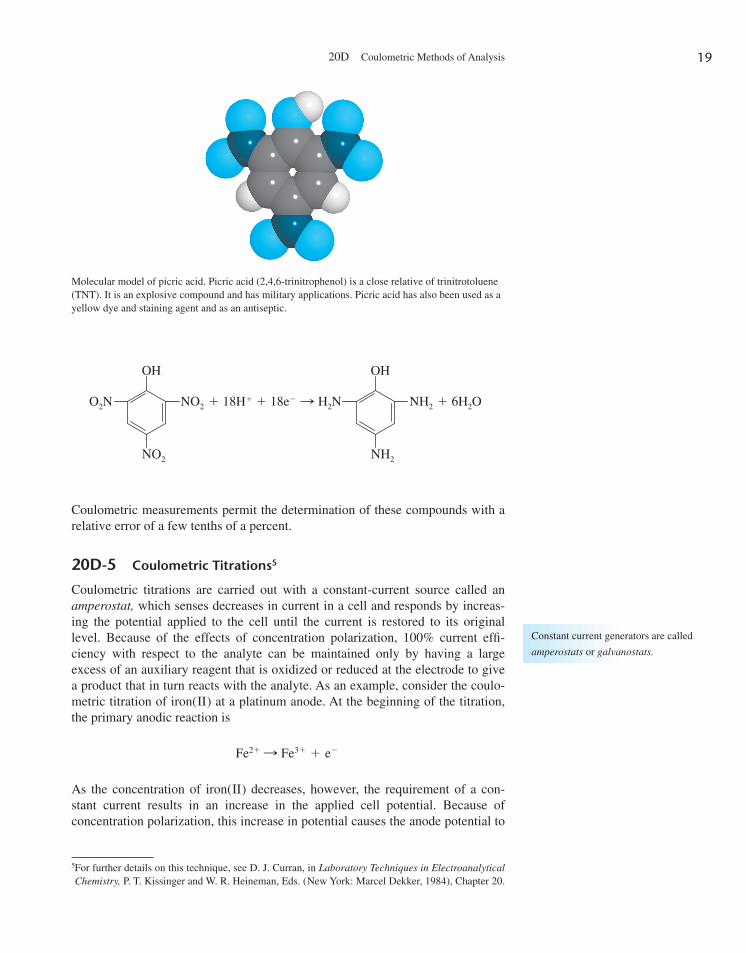
Molecular model of picric acid. Picric acid (2,4,6-trinitrophenol) is a close relative of trinitrotoluene(TNT). It is an explosive compound and has military applications. Picric acid has also been used as ayellow dye and staining agent and as an antiseptic.
5For further details on this technique, see D. J. Curran, in Laboratory Techniques in ElectroanalyticalChemistry, P. T. Kissinger and W. R. Heineman, Eds. (New York: Marcel Dekker, 1984), Chapter 20.
72795_03_ch20_p01-34.qxp 3/23/11 11:43 AM Page 19
Web Chapter 20 A Brief Look at Some Other Electroanalytical Methods20
increase to the point where the decomposition of water becomes a competingprocess:
The quantity of electricity required to complete the oxidation of iron(II) thenexceeds that demanded by theory, and the current efficiency is less than 100%.The lowered current efficiency is prevented, however, by introducing at the out-set an unmeasured excess of cerium(III), which is oxidized at a lower potentialthan is water:
With stirring, the cerium(IV) produced is rapidly transported from the surface ofthe electrode to the bulk of the solution, where it oxidizes an equivalent amountof iron(II):
The net effect is an electrochemical oxidation of iron(II) with 100% current effi-ciency, even though only a fraction of that species is directly oxidized at the elec-trode surface.
Detecting the End Point in a Coulometric Titration
Coulometric titrations, like their volumetric counterparts, require a means fordetermining when the reaction between analyte and reagent is complete.Generally, the end point detection techniques described in Chapters 6–10 andChapters 8 and 9 on volumetric methods are applicable to coulometric titrationsas well. Thus, for the titration of iron(II) just described, an oxidation/reductionindicator, such as 1,10-phenanthroline, can be used; as an alternative, the endpoint can be determined potentiometrically. Some coulometric titrations use aphotometric end point (see Section 5A-2).
Instrumentation
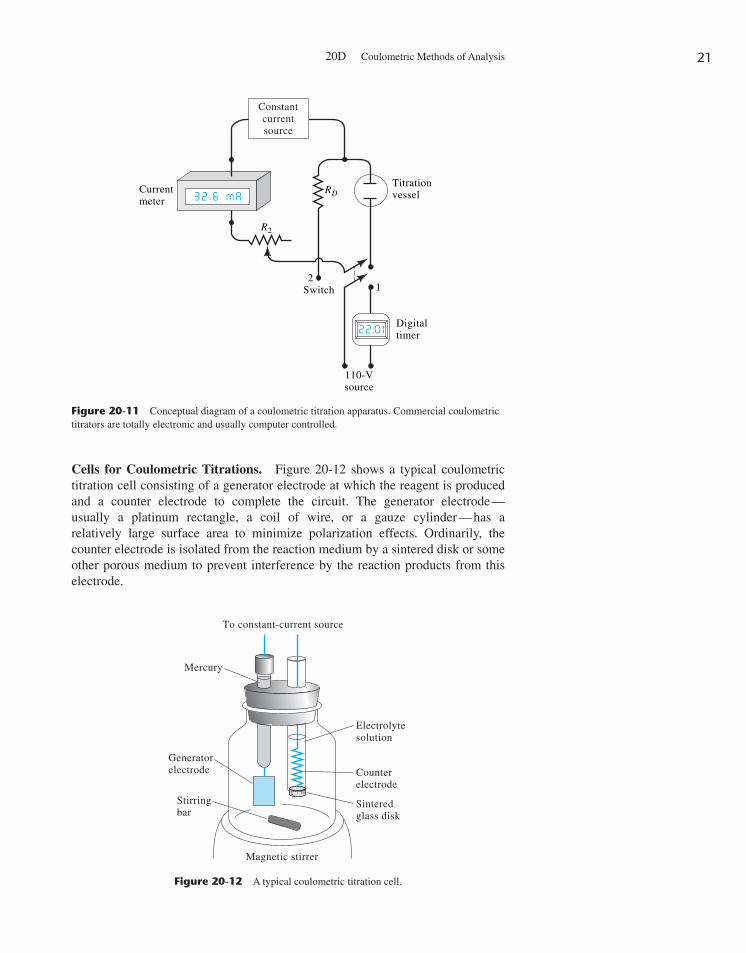
As shown in Figure 20-11, the equipment required for a coulometric titrationincludes a source of constant current that provides one to several hundredmilliamperes, a titration vessel, a switch, a timer, and a device for monitoringcurrent. Movement of the switch to position 1 simultaneously starts the timer andinitiates a current in the titration cell. When the switch is moved to position 2,the electrolysis and the timing are discontinued. With the switch in this position,however, electricity continues to be drawn from the source and passes through adummy resistor RD that has about the same electrical resistance as the cell. Thisarrangement ensures continuous operation of the source, which aids in maintain-ing the current at a constant level.
The constant-current source for a coulometric titration is often an amperostat,an electronic device capable of maintaining a current of 210 mA or more that isconstant to a few hundredths percent. Amperostats are available from severalinstrument manufacturers. The electrolysis time can be measured very accuratelywith a digital timer or a computer-based timing system.
Ce4� � Fe2� : Ce3� � Fe3�
Ce3� : Ce4� � e�
2H2O : O2(g) � 4H� � 4e�
Auxiliary reagents are essential in coulo-
metric titrations.
72795_03_ch20_p01-34.qxp 3/23/11 11:43 AM Page 20
2120D Coulometric Methods of Analysis
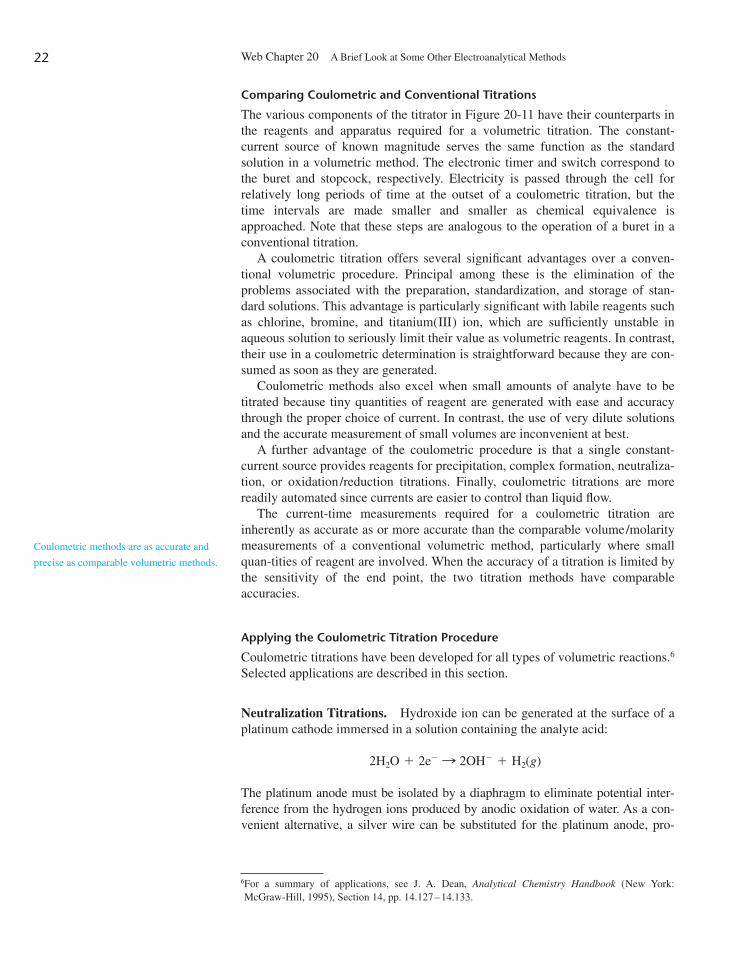
Cells for Coulometric Titrations. Figure 20-12 shows a typical coulometrictitration cell consisting of a generator electrode at which the reagent is producedand a counter electrode to complete the circuit. The generator electrode—usually a platinum rectangle, a coil of wire, or a gauze cylinder—has a relatively large surface area to minimize polarization effects. Ordinarily, thecounter electrode is isolated from the reaction medium by a sintered disk or someother porous medium to prevent interference by the reaction products from thiselectrode.
Currentmeter
Constantcurrentsource
Titrationvessel
Digitaltimer
12
Switch
110-Vsource
RD
R2
Figure 20-11 Conceptual diagram of a coulometric titration apparatus. Commercial coulometrictitrators are totally electronic and usually computer controlled.
To constant-current source
Mercury
Generatorelectrode
Stirringbar
Electrolytesolution
Counterelectrode
Sinteredglass disk
Magnetic stirrer
Figure 20-12 A typical coulometric titration cell.
72795_03_ch20_p01-34.qxp 3/23/11 11:43 AM Page 21
Web Chapter 20 A Brief Look at Some Other Electroanalytical Methods22
Comparing Coulometric and Conventional Titrations
The various components of the titrator in Figure 20-11 have their counterparts inthe reagents and apparatus required for a volumetric titration. The constant-current source of known magnitude serves the same function as the standardsolution in a volumetric method. The electronic timer and switch correspond tothe buret and stopcock, respectively. Electricity is passed through the cell forrelatively long periods of time at the outset of a coulometric titration, but thetime intervals are made smaller and smaller as chemical equivalence isapproached. Note that these steps are analogous to the operation of a buret in aconventional titration.
A coulometric titration offers several significant advantages over a conven-tional volumetric procedure. Principal among these is the elimination of theproblems associated with the preparation, standardization, and storage of stan-dard solutions. This advantage is particularly significant with labile reagents suchas chlorine, bromine, and titanium(III) ion, which are sufficiently unstable inaqueous solution to seriously limit their value as volumetric reagents. In contrast,their use in a coulometric determination is straightforward because they are con-sumed as soon as they are generated.
Coulometric methods also excel when small amounts of analyte have to betitrated because tiny quantities of reagent are generated with ease and accuracythrough the proper choice of current. In contrast, the use of very dilute solutionsand the accurate measurement of small volumes are inconvenient at best.
A further advantage of the coulometric procedure is that a single constant-current source provides reagents for precipitation, complex formation, neutraliza-tion, or oxidation/reduction titrations. Finally, coulometric titrations are morereadily automated since currents are easier to control than liquid flow.
The current-time measurements required for a coulometric titration areinherently as accurate as or more accurate than the comparable volume/molaritymeasurements of a conventional volumetric method, particularly where smallquan-tities of reagent are involved. When the accuracy of a titration is limited by the sensitivity of the end point, the two titration methods have comparable accuracies.
Applying the Coulometric Titration Procedure
Coulometric titrations have been developed for all types of volumetric reactions.6
Selected applications are described in this section.
Neutralization Titrations. Hydroxide ion can be generated at the surface of aplatinum cathode immersed in a solution containing the analyte acid:
The platinum anode must be isolated by a diaphragm to eliminate potential inter-ference from the hydrogen ions produced by anodic oxidation of water. As a con-venient alternative, a silver wire can be substituted for the platinum anode, pro-
2H2O � 2e� : 2OH� � H2(g)
6For a summary of applications, see J. A. Dean, Analytical Chemistry Handbook (New York:McGraw-Hill, 1995), Section 14, pp. 14.127–14.133.
Coulometric methods are as accurate and
precise as comparable volumetric methods.
72795_03_ch20_p01-34.qxp 3/23/11 11:43 AM Page 22
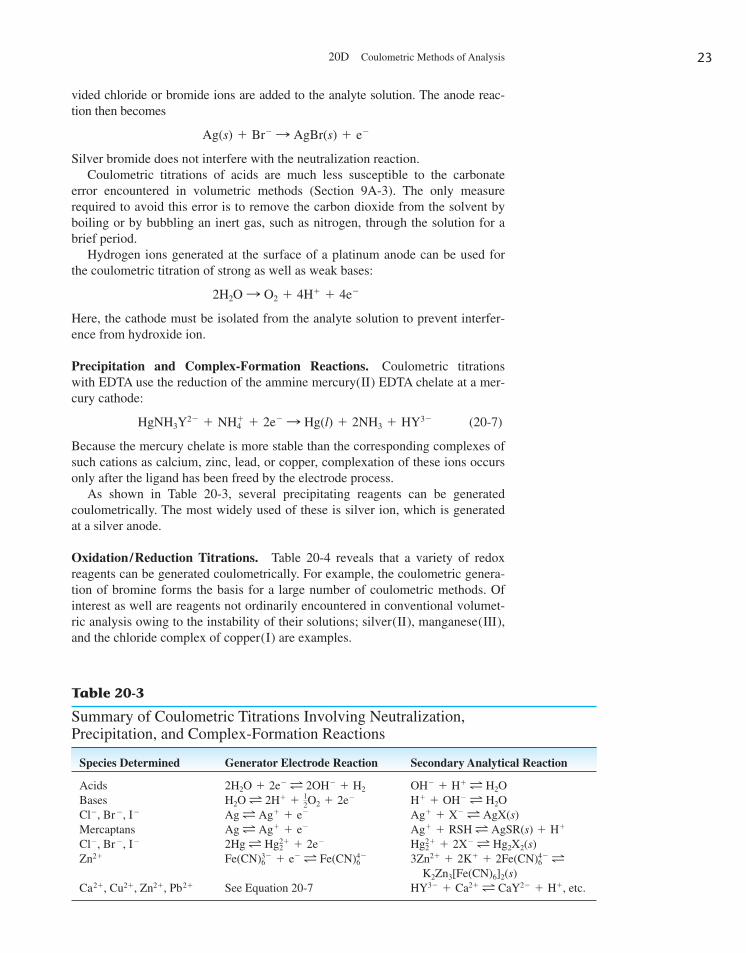
20D Coulometric Methods of Analysis 23
vided chloride or bromide ions are added to the analyte solution. The anode reac-tion then becomes
Silver bromide does not interfere with the neutralization reaction.Coulometric titrations of acids are much less susceptible to the carbonate
error encountered in volumetric methods (Section 9A-3). The only measurerequired to avoid this error is to remove the carbon dioxide from the solvent byboiling or by bubbling an inert gas, such as nitrogen, through the solution for abrief period.
Hydrogen ions generated at the surface of a platinum anode can be used forthe coulometric titration of strong as well as weak bases:
Here, the cathode must be isolated from the analyte solution to prevent interfer-ence from hydroxide ion.
Precipitation and Complex-Formation Reactions. Coulometric titrationswith EDTA use the reduction of the ammine mercury(II) EDTA chelate at a mer-cury cathode:
(20-7)
Because the mercury chelate is more stable than the corresponding complexes ofsuch cations as calcium, zinc, lead, or copper, complexation of these ions occursonly after the ligand has been freed by the electrode process.
As shown in Table 20-3, several precipitating reagents can be generatedcoulometrically. The most widely used of these is silver ion, which is generatedat a silver anode.
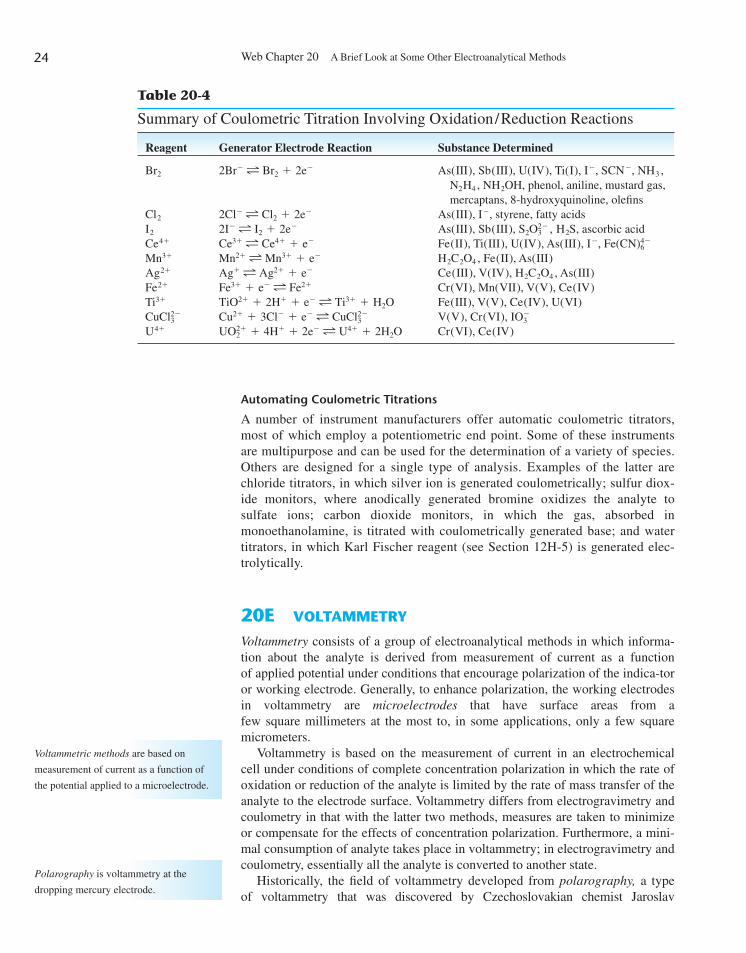
Oxidation/Reduction Titrations. Table 20-4 reveals that a variety of redoxreagents can be generated coulometrically. For example, the coulometric genera-tion of bromine forms the basis for a large number of coulometric methods. Ofinterest as well are reagents not ordinarily encountered in conventional volumet-ric analysis owing to the instability of their solutions; silver(II), manganese(III),and the chloride complex of copper(I) are examples.
HgNH3Y2� � NH�4 � 2e� : Hg(l) � 2NH3 � HY3�
2H2O : O2 � 4H� � 4e�
Ag(s) � Br� : AgBr(s) � e�
Table 20-3
Summary of Coulometric Titrations Involving Neutralization, Precipitation, and Complex-Formation Reactions
Species Determined Generator Electrode Reaction Secondary Analytical Reaction
AcidsBasesCl�, Br�, I�
MercaptansCl�, Br�, I�
Zn2�
Ca2�, Cu2�, Zn2�, Pb2� See Equation 20-7 HY3� � Ca2� L CaY2� � H�, etc.K2Zn3[Fe(CN)6]2(s)
3Zn2� � 2K� � 2Fe(CN)4�6 LFe(CN)3�
6 � e� L Fe(CN)4�6
Hg2�2 � 2X� L Hg2X2(s)2Hg L Hg2�
2 � 2e�
Ag� � RSH L AgSR(s) � H�Ag L Ag� � e�
Ag� � X� L AgX(s)Ag L Ag� � e�
H� � OH� L H2OH2O L 2H� � 12O2 � 2e�
OH� � H� L H2O2H2O � 2e� L 2OH� � H2
72795_03_ch20_p01-34.qxp 3/23/11 11:43 AM Page 23
Web Chapter 20 A Brief Look at Some Other Electroanalytical Methods24
Automating Coulometric Titrations
A number of instrument manufacturers offer automatic coulometric titrators,most of which employ a potentiometric end point. Some of these instruments are multipurpose and can be used for the determination of a variety of species.Others are designed for a single type of analysis. Examples of the latter arechloride titrators, in which silver ion is generated coulometrically; sulfur diox-ide monitors, where anodically generated bromine oxidizes the analyte to sulfate ions; carbon dioxide monitors, in which the gas, absorbed inmonoethanolamine, is titrated with coulometrically generated base; and water titrators, in which Karl Fischer reagent (see Section 12H-5) is generated elec-trolytically.
20E VOLTAMMETRY
Voltammetry consists of a group of electroanalytical methods in which informa-tion about the analyte is derived from measurement of current as a function of applied potential under conditions that encourage polarization of the indica-toror working electrode. Generally, to enhance polarization, the working electrodesin voltammetry are microelectrodes that have surface areas from a few square millimeters at the most to, in some applications, only a few squaremicrometers.
Voltammetry is based on the measurement of current in an electrochemicalcell under conditions of complete concentration polarization in which the rate ofoxidation or reduction of the analyte is limited by the rate of mass transfer of theanalyte to the electrode surface. Voltammetry differs from electrogravimetry andcoulometry in that with the latter two methods, measures are taken to minimizeor compensate for the effects of concentration polarization. Furthermore, a mini-mal consumption of analyte takes place in voltammetry; in electrogravimetry andcoulometry, essentially all the analyte is converted to another state.
Historically, the field of voltammetry developed from polarography, a typeof voltammetry that was discovered by Czechoslovakian chemist Jaroslav
Table 20-4
Summary of Coulometric Titration Involving Oxidation/Reduction Reactions
Reagent Generator Electrode Reaction Substance Determined
Br2 As(III), Sb(III), U(IV), Ti(I), I�, SCN�, NH3 , N2H4 , NH2OH, phenol, aniline, mustard gas, mercaptans, 8-hydroxyquinoline, olefins
Cl2 As(III), I�, styrene, fatty acidsI2 As(III), Sb(III), H2S, ascorbic acidCe4� Fe(II), Ti(III), U(IV), As(III), I�, Mn3� H2C2O4 , Fe(II), As(III)Ag2� Ce(III), V(IV), H2C2O4 , As(III)Fe2� Cr(VI), Mn(VII), V(V), Ce(IV)Ti3� Fe(III), V(V), Ce(IV), U(VI)
V(V), Cr(VI), U4� Cr(VI), Ce(IV)UO2�
2 � 4H� � 2e� L U4� � 2H2OIO�
3Cu2� � 3Cl� � e� L CuCl2�3CuCl2�
3
TiO2� � 2H� � e� L Ti3� � H2OFe3� � e� L Fe2�
Ag� L Ag2� � e�
Mn2� L Mn3� � e�
Fe(CN)4�6Ce3� L Ce4� � e�
S2O2�3 ,2I� L I2 � 2e�
2Cl� L Cl2 � 2e�
2Br� L Br2 � 2e�
Voltammetric methods are based on
measurement of current as a function of
the potential applied to a microelectrode.
Polarography is voltammetry at the
dropping mercury electrode.
72795_03_ch20_p01-34.qxp 3/23/11 11:43 AM Page 24
20E Voltammetry 25
Heyrovsky in the early 1920s.7 Polarography, which is still an important branch ofvoltammetry, differs from other types of voltammetry in that a dropping mercuryelectrode (DME) is used as the working microelectrode.
In voltammetry,8 the voltage of the working microelectrode is varied whilethe current response is measured. Several different voltage -time functions can beapplied to the electrode. The simplest of these is a linear scan in which thepotential of the working electrode is changed linearly with time. Typically,the potential of the working electrode is varied over a 1- or 2-V range. The cur-rent in the cell is then measured as a function of the applied potential. Pulsedwaveforms and triangular waveforms can also be applied. We will consider hereonly linear-scan voltammetry.
20E-1 Linear-Scan Voltammetry
In the earliest and simplest voltammetric methods, the potential of the workingelectrode is increased or decreased at a typical rate of 2 to 5 mV/s. The current,usually in microamperes, is then recorded to give a voltammogram, which is aplot of current as a function of applied potential. Linear-scan voltammetry is oftwo types: hydrodynamic voltammetry and polarography.
Voltammetric Instrumentation
Typically, a three-electrode potentiostat, an all-electronic version of the oneshown in Figure 20-7, is employed in linear-scan voltammetry. The potentialsweep is provided by an electronic linear-sweep generator or, in modern instru-ments, a computer. The cell is made up of the three electrodes immersed in asolution containing the analyte and an excess of a supporting electrolyte. Thepotential of the microelectrode or working electrode is varied linearly with time.The second electrode is a reference electrode whose potential remains invariantthroughout the experiment. The third electrode is the auxiliary or counter elec-trode, which is often a coil of platinum wire or a pool of mercury that simplyserves to conduct electricity from the source through the solution to the micro-electrode. The electrical resistance in the circuit containing the referenceelectrode is so large ( 1011 �) that essentially no current is present in it. Thus,the entire current from the source is carried from the counter electrode to themicroelectrode.
What Microelectrodes Are Used?
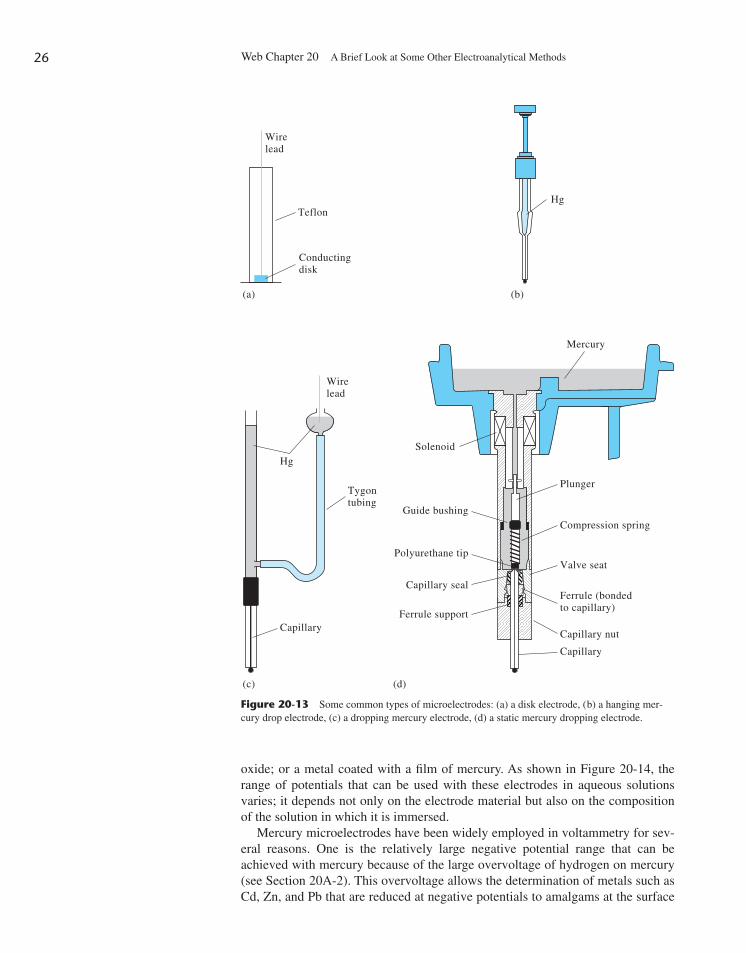
The microelectrodes used in voltammetry take a variety of shapes and forms.Often, they are small, flat disks of a conductor that are press-fitted into a rod ofan inert material, such as Teflon or Kel-F, that has a wire contact imbedded in it(see Figure 20-13a). The conductor may be an inert metal, such as platinum orgold; pyrolytic graphite or glassy carbon; a semiconductor, such as tin or indium
Jaroslav Heyrovsky was awarded the 1959
Nobel Prize in chemistry for his discovery
and development of polarography.
7J. Heyrovsky, Chem. Listy, 1922, 16, 256.8For further information on voltammetric methods, see J. A. Dean, Analytical Chemistry Handbook(New York: McGraw-Hill, 1995), Section 14, pp. 14.57–14.93; M. R. Smyth and F. G. Vos, Eds.,Analytical Voltammetry (New York: Elsevier, 1992); A. J. Bard and L. R. Faulkner, ElectrochemicalMethods (New York: Wiley, 1980).
72795_03_ch20_p01-34.qxp 3/23/11 11:43 AM Page 25
Web Chapter 20 A Brief Look at Some Other Electroanalytical Methods26
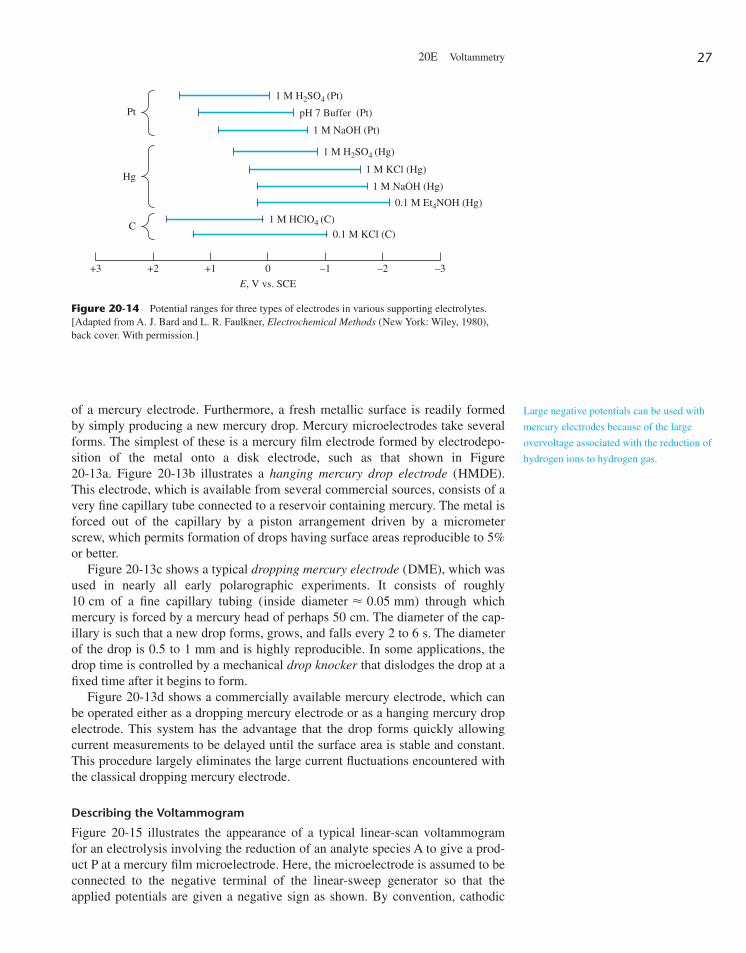
oxide; or a metal coated with a film of mercury. As shown in Figure 20-14, therange of potentials that can be used with these electrodes in aqueous solutionsvaries; it depends not only on the electrode material but also on the compositionof the solution in which it is immersed.
Mercury microelectrodes have been widely employed in voltammetry for sev-eral reasons. One is the relatively large negative potential range that can beachieved with mercury because of the large overvoltage of hydrogen on mercury(see Section 20A-2). This overvoltage allows the determination of metals such asCd, Zn, and Pb that are reduced at negative potentials to amalgams at the surface
Wirelead
Wirelead
Teflon
Conductingdisk
(a) (b)
(c) (d)
Hg
Hg
Tygontubing
Capillary
Mercury
Plunger
Solenoid
Guide bushing
Polyurethane tip
Capillary seal
Ferrule support
Compression spring
Valve seat
Ferrule (bondedto capillary)
Capillary nut
Capillary
Figure 20-13 Some common types of microelectrodes: (a) a disk electrode, (b) a hanging mer-cury drop electrode, (c) a dropping mercury electrode, (d) a static mercury dropping electrode.
72795_03_ch20_p01-34.qxp 3/23/11 11:43 AM Page 26
20E Voltammetry 27
of a mercury electrode. Furthermore, a fresh metallic surface is readily formedby simply producing a new mercury drop. Mercury microelectrodes take severalforms. The simplest of these is a mercury film electrode formed by electrodepo-sition of the metal onto a disk electrode, such as that shown in Figure 20-13a. Figure 20-13b illustrates a hanging mercury drop electrode (HMDE).This electrode, which is available from several commercial sources, consists of avery fine capillary tube connected to a reservoir containing mercury. The metal isforced out of the capillary by a piston arrangement driven by a micrometerscrew, which permits formation of drops having surface areas reproducible to 5%or better.
Figure 20-13c shows a typical dropping mercury electrode (DME), which wasused in nearly all early polarographic experiments. It consists of roughly 10 cm of a fine capillary tubing (inside diameter � 0.05 mm) through whichmercury is forced by a mercury head of perhaps 50 cm. The diameter of the cap-illary is such that a new drop forms, grows, and falls every 2 to 6 s. The diameterof the drop is 0.5 to 1 mm and is highly reproducible. In some applications, thedrop time is controlled by a mechanical drop knocker that dislodges the drop at afixed time after it begins to form.
Figure 20-13d shows a commercially available mercury electrode, which canbe operated either as a dropping mercury electrode or as a hanging mercury dropelectrode. This system has the advantage that the drop forms quickly allowingcurrent measurements to be delayed until the surface area is stable and constant.This procedure largely eliminates the large current fluctuations encountered withthe classical dropping mercury electrode.
Describing the Voltammogram
Figure 20-15 illustrates the appearance of a typical linear-scan voltammogramfor an electrolysis involving the reduction of an analyte species A to give a prod-uct P at a mercury film microelectrode. Here, the microelectrode is assumed to beconnected to the negative terminal of the linear-sweep generator so that theapplied potentials are given a negative sign as shown. By convention, cathodic
Pt
1 M H2SO4 (Pt)
pH 7 Buffer (Pt)
1 M NaOH (Pt)
1 M NaOH (Hg)
0.1 M Et4NOH (Hg)
0.1 M KCl (C)
1 M HClO4 (C)
+3 +2 +1 0
E, V vs. SCE
–1 –2 –3
1 M H2SO4 (Hg)
1 M KCl (Hg)Hg
C
Figure 20-14 Potential ranges for three types of electrodes in various supporting electrolytes.[Adapted from A. J. Bard and L. R. Faulkner, Electrochemical Methods (New York: Wiley, 1980),back cover. With permission.]
Large negative potentials can be used with
mercury electrodes because of the large
overvoltage associated with the reduction of
hydrogen ions to hydrogen gas.
72795_03_ch20_p01-34.qxp 3/23/11 11:43 AM Page 27
Web Chapter 20 A Brief Look at Some Other Electroanalytical Methods28
(reduction) currents are treated as being positive, whereas anodic currents aregiven a negative sign.
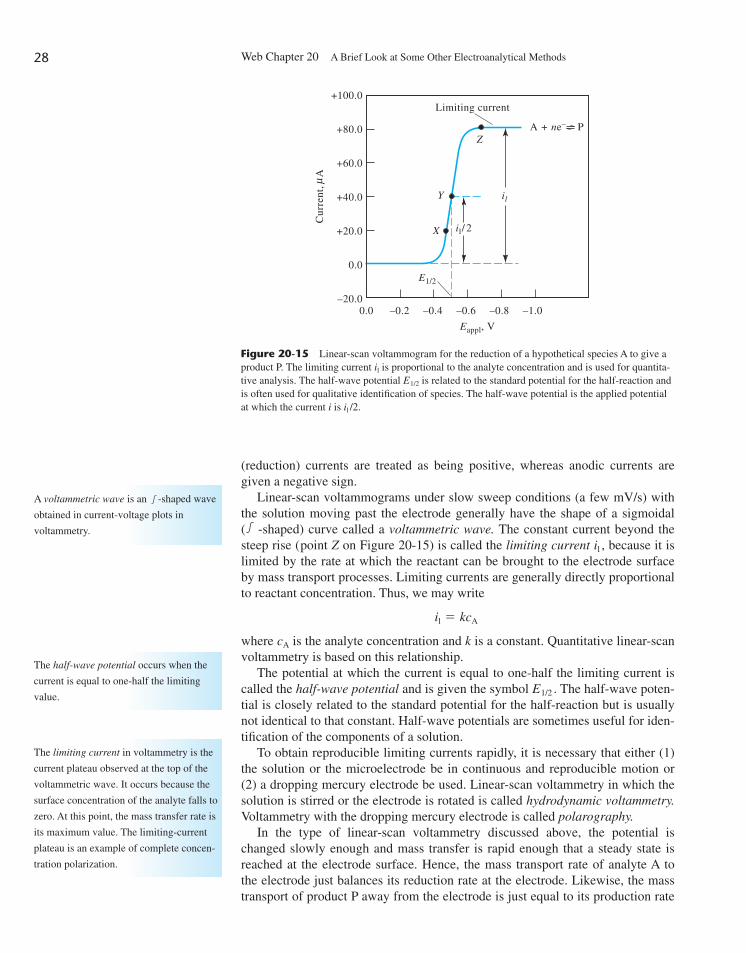
Linear-scan voltammograms under slow sweep conditions (a few mV/s) withthe solution moving past the electrode generally have the shape of a sigmoidal ( -shaped) curve called a voltammetric wave. The constant current beyond thesteep rise (point Z on Figure 20-15) is called the limiting current il , because it islimited by the rate at which the reactant can be brought to the electrode surfaceby mass transport processes. Limiting currents are generally directly proportionalto reactant concentration. Thus, we may write
where cA is the analyte concentration and k is a constant. Quantitative linear-scanvoltammetry is based on this relationship.
The potential at which the current is equal to one-half the limiting current iscalled the half-wave potential and is given the symbol E1/2 . The half-wave poten-tial is closely related to the standard potential for the half-reaction but is usuallynot identical to that constant. Half-wave potentials are sometimes useful for iden-tification of the components of a solution.
To obtain reproducible limiting currents rapidly, it is necessary that either (1)the solution or the microelectrode be in continuous and reproducible motion or(2) a dropping mercury electrode be used. Linear-scan voltammetry in which thesolution is stirred or the electrode is rotated is called hydrodynamic voltammetry.Voltammetry with the dropping mercury electrode is called polarography.
In the type of linear-scan voltammetry discussed above, the potential ischanged slowly enough and mass transfer is rapid enough that a steady state isreached at the electrode surface. Hence, the mass transport rate of analyte A tothe electrode just balances its reduction rate at the electrode. Likewise, the masstransport of product P away from the electrode is just equal to its production rate
il � kcA
+100.0
+80.0
+60.0
+40.0
+20.0
0.0
–20.00.0 –0.2
Limiting current
–0.4 –0.6 –0.8 –1.0
Y
X il/ 2
il
E1/2
ZA + ne– P
Cur
rent
, Aμ
Eappl, V
Figure 20-15 Linear-scan voltammogram for the reduction of a hypothetical species A to give aproduct P. The limiting current il is proportional to the analyte concentration and is used for quantita-tive analysis. The half-wave potential E1/2 is related to the standard potential for the half-reaction andis often used for qualitative identification of species. The half-wave potential is the applied potentialat which the current i is il /2.
A voltammetric wave is an -shaped wave
obtained in current-voltage plots in
voltammetry.
The half-wave potential occurs when the
current is equal to one-half the limiting
value.
The limiting current in voltammetry is the
current plateau observed at the top of the
voltammetric wave. It occurs because the
surface concentration of the analyte falls to
zero. At this point, the mass transfer rate is
its maximum value. The limiting-current
plateau is an example of complete concen-
tration polarization.
72795_03_ch20_p01-34.qxp 3/23/11 11:43 AM Page 28
20E Voltammetry 29
at the electrode surface. There is another type of linear-sweep voltammetry inwhich fast scan rates (1 V/s or greater) are used with unstirred solutions. In thistype of voltammetry, a peak-shaped current-time signal is obtained because ofdepletion of the analyte in the solution near the electrode. Cyclic voltammetry isan example in which forward and reverse linear scans are applied. With cyclicvoltammetry, products formed on the forward scan can be detected on the reversescan if they have not moved away from the electrode or have not been altered bya chemical reaction.
20E-2 Applying Voltammetric Methods
Currently, the most important uses of voltammetry include (1) detection anddetermination of chemical species as they exit from chromatographic columns ora continuous-flow apparatus; (2) routine determination of oxygen and certainspecies of biochemical interest, such as glucose, lactate, and sucrose; (3) detec-tion of end points in coulometric and volumetric titrations; and (4) determinationof metals (polarography).
Voltammetric Detectors
Voltammetric detectors are widely used for detection and determination ofoxidizable or reducible compounds or ions in flowing streams. Compounds thathave been separated by liquid chromatography (see Chapter 17) or are present inflow injection analyzers are typical examples. The manner in which most voltam-metric detectors are used is to apply a constant potential between the workingelectrode and a reference electrode; the potential corresponds to the limiting cur-rent region for the analyte of interest. Because the potential is maintained at aconstant value and the current is measured, the technique is sometimes calledamperometry. In these applications, a thin-layer cell is used with a volume that is typically 0.1 to 1.0 mL. Detection limits as low as 10�9 to 10�10 M of analyte can be obtained.
Voltammetric Sensors
A number of voltammetric systems are produced commercially for the deter-mination of specific species that are of interest in industry and research. Thesedevices are sometimes called electrodes but are, in fact, complete voltam-metric cells that are better referred to as sensors. Two of these devices aredescribed here.
The determination of dissolved oxygen in a variety of aqueous environments,such as seawater, blood, sewage, effluents from chemical plants, and soils, is oftremendous importance. One of the most common and convenient methods formaking such measurements is with the Clark oxygen sensor, which was patentedby L. C. Clark, Jr., in 1956.9 A schematic of the Clark oxygen sensor is shown inFigure 20-16. The cell consists of a cathodic platinum disk working electrodeimbedded in a centrally located cylindrical insulator. Surrounding the lower endof this insulator is a ring-shaped silver anode. The tubular insulator and elec-trodes are mounted inside a second cylinder that contains a buffered solution of
The Clark oxygen sensor is widely used in
clinical laboratories for the determination of
dissolved O2 in blood and other body fluids
9For a detailed discussion of the Clark oxygen sensor, see M. L. Hitchman, Measurement ofDissolved Oxygen (New York: Wiley, 1978), Chapters 3–5.
72795_03_ch20_p01-34.qxp 3/23/11 11:43 AM Page 29
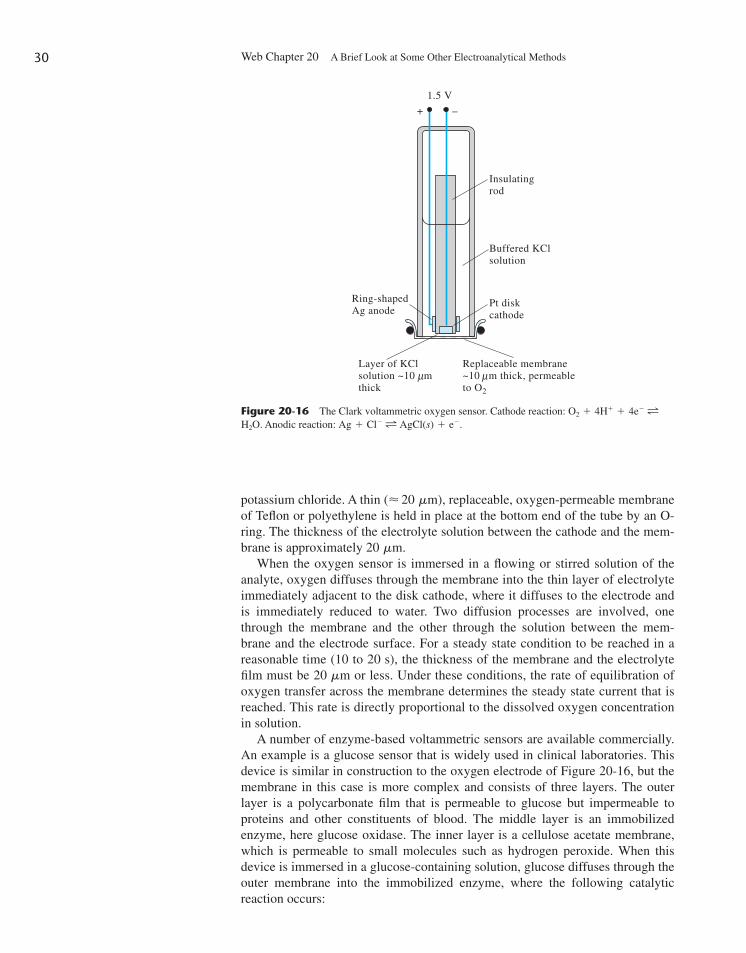
Web Chapter 20 A Brief Look at Some Other Electroanalytical Methods30
potassium chloride. A thin (� 20 mm), replaceable, oxygen-permeable membraneof Teflon or polyethylene is held in place at the bottom end of the tube by an O-ring. The thickness of the electrolyte solution between the cathode and the mem-brane is approximately 20 mm.
When the oxygen sensor is immersed in a flowing or stirred solution of theanalyte, oxygen diffuses through the membrane into the thin layer of electrolyteimmediately adjacent to the disk cathode, where it diffuses to the electrode andis immediately reduced to water. Two diffusion processes are involved, onethrough the membrane and the other through the solution between the mem-brane and the electrode surface. For a steady state condition to be reached in areasonable time (10 to 20 s), the thickness of the membrane and the electrolytefilm must be 20 mm or less. Under these conditions, the rate of equilibration ofoxygen transfer across the membrane determines the steady state current that isreached. This rate is directly proportional to the dissolved oxygen concentrationin solution.
A number of enzyme-based voltammetric sensors are available commercially.An example is a glucose sensor that is widely used in clinical laboratories. Thisdevice is similar in construction to the oxygen electrode of Figure 20-16, but themembrane in this case is more complex and consists of three layers. The outerlayer is a polycarbonate film that is permeable to glucose but impermeable toproteins and other constituents of blood. The middle layer is an immobilizedenzyme, here glucose oxidase. The inner layer is a cellulose acetate membrane,which is permeable to small molecules such as hydrogen peroxide. When thisdevice is immersed in a glucose-containing solution, glucose diffuses through theouter membrane into the immobilized enzyme, where the following catalyticreaction occurs:
Insulatingrod
1.5 V
–+
Buffered KClsolution
Pt diskcathode
Ring-shapedAg anode
Layer of KClsolution ~10 mthick
μReplaceable membrane~10 m thick, permeableto O2
μ
Figure 20-16 The Clark voltammetric oxygen sensor. Cathode reaction: Anodic reaction: Ag � Cl� L AgCl(s) � e�.H2O.
O2 � 4H� � 4e� L
72795_03_ch20_p01-34.qxp 3/23/11 11:43 AM Page 30
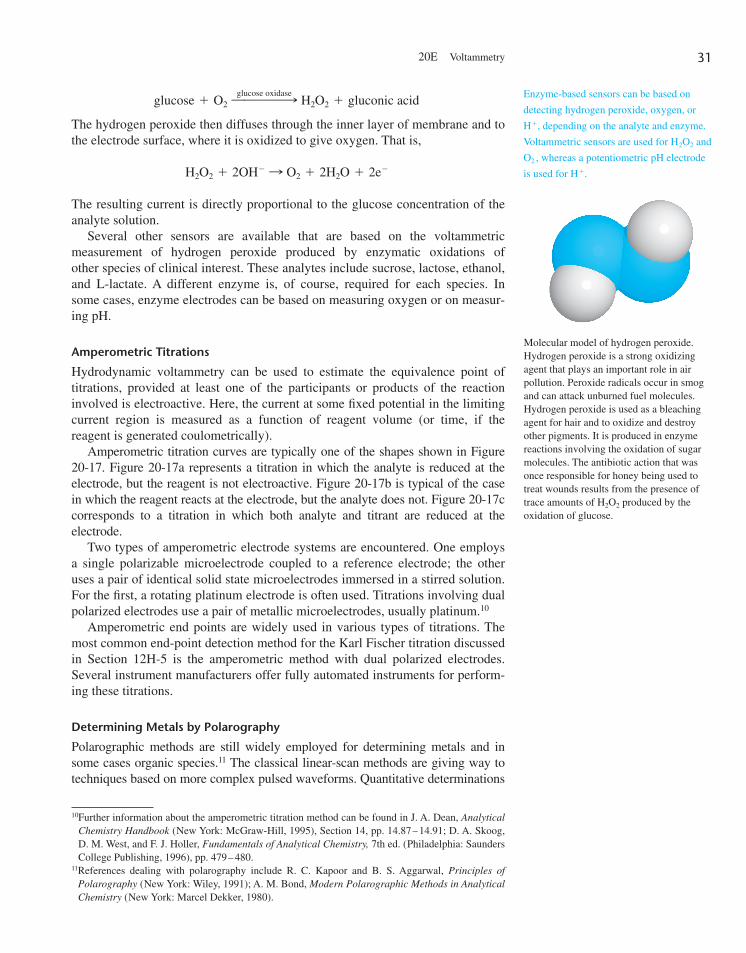
20E Voltammetry 31
The hydrogen peroxide then diffuses through the inner layer of membrane and tothe electrode surface, where it is oxidized to give oxygen. That is,
The resulting current is directly proportional to the glucose concentration of theanalyte solution.
Several other sensors are available that are based on the voltammetric measurement of hydrogen peroxide produced by enzymatic oxidations of other species of clinical interest. These analytes include sucrose, lactose, ethanol,and L-lactate. A different enzyme is, of course, required for each species. Insome cases, enzyme electrodes can be based on measuring oxygen or on measur-ing pH.
Amperometric Titrations
Hydrodynamic voltammetry can be used to estimate the equivalence point oftitrations, provided at least one of the participants or products of the reactioninvolved is electroactive. Here, the current at some fixed potential in the limitingcurrent region is measured as a function of reagent volume (or time, if thereagent is generated coulometrically).
Amperometric titration curves are typically one of the shapes shown in Figure20-17. Figure 20-17a represents a titration in which the analyte is reduced at theelectrode, but the reagent is not electroactive. Figure 20-17b is typical of the casein which the reagent reacts at the electrode, but the analyte does not. Figure 20-17ccorresponds to a titration in which both analyte and titrant are reduced at theelectrode.
Two types of amperometric electrode systems are encountered. One employsa single polarizable microelectrode coupled to a reference electrode; the otheruses a pair of identical solid state microelectrodes immersed in a stirred solution.For the first, a rotating platinum electrode is often used. Titrations involving dualpolarized electrodes use a pair of metallic microelectrodes, usually platinum.10
Amperometric end points are widely used in various types of titrations. Themost common end-point detection method for the Karl Fischer titration discussedin Section 12H-5 is the amperometric method with dual polarized electrodes.Several instrument manufacturers offer fully automated instruments for perform-ing these titrations.
Determining Metals by Polarography
Polarographic methods are still widely employed for determining metals and insome cases organic species.11 The classical linear-scan methods are giving way totechniques based on more complex pulsed waveforms. Quantitative determinations
H2O2 � 2OH� : O2 � 2H2O � 2e�
glucose � O2 9glucose oxidase
99999: H2O2 � gluconic acid Enzyme-based sensors can be based on
detecting hydrogen peroxide, oxygen, or
H�, depending on the analyte and enzyme.
Voltammetric sensors are used for H2O2 and
O2 , whereas a potentiometric pH electrode
is used for H�.
Molecular model of hydrogen peroxide.Hydrogen peroxide is a strong oxidizingagent that plays an important role in airpollution. Peroxide radicals occur in smogand can attack unburned fuel molecules.Hydrogen peroxide is used as a bleachingagent for hair and to oxidize and destroyother pigments. It is produced in enzymereactions involving the oxidation of sugarmolecules. The antibiotic action that wasonce responsible for honey being used totreat wounds results from the presence oftrace amounts of H2O2 produced by theoxidation of glucose.
10Further information about the amperometric titration method can be found in J. A. Dean, AnalyticalChemistry Handbook (New York: McGraw-Hill, 1995), Section 14, pp. 14.87–14.91; D. A. Skoog,D. M. West, and F. J. Holler, Fundamentals of Analytical Chemistry, 7th ed. (Philadelphia: SaundersCollege Publishing, 1996), pp. 479–480.
11References dealing with polarography include R. C. Kapoor and B. S. Aggarwal, Principles ofPolarography (New York: Wiley, 1991); A. M. Bond, Modern Polarographic Methods in AnalyticalChemistry (New York: Marcel Dekker, 1980).
72795_03_ch20_p01-34.qxp 3/23/11 11:43 AM Page 31
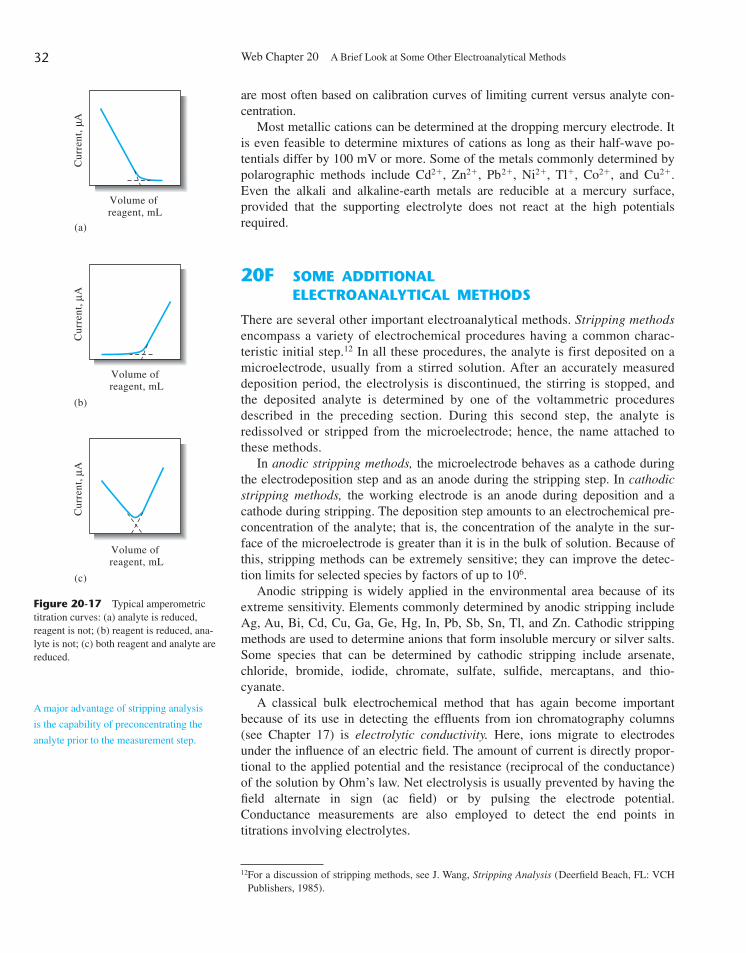
Web Chapter 20 A Brief Look at Some Other Electroanalytical Methods32
are most often based on calibration curves of limiting current versus analyte con-centration.
Most metallic cations can be determined at the dropping mercury electrode. Itis even feasible to determine mixtures of cations as long as their half-wave po-tentials differ by 100 mV or more. Some of the metals commonly determined bypolarographic methods include Cd2�, Zn2�, Pb2�, Ni2�, Tl�, Co2�, and Cu2�.Even the alkali and alkaline-earth metals are reducible at a mercury surface, provided that the supporting electrolyte does not react at the high potentials required.
20F SOME ADDITIONALELECTROANALYTICAL METHODS
There are several other important electroanalytical methods. Stripping methodsencompass a variety of electrochemical procedures having a common charac-teristic initial step.12 In all these procedures, the analyte is first deposited on amicroelectrode, usually from a stirred solution. After an accurately measureddeposition period, the electrolysis is discontinued, the stirring is stopped, andthe deposited analyte is determined by one of the voltammetric proceduresdescribed in the preceding section. During this second step, the analyte isredissolved or stripped from the microelectrode; hence, the name attached tothese methods.
In anodic stripping methods, the microelectrode behaves as a cathode duringthe electrodeposition step and as an anode during the stripping step. In cathodicstripping methods, the working electrode is an anode during deposition and acathode during stripping. The deposition step amounts to an electrochemical pre-concentration of the analyte; that is, the concentration of the analyte in the sur-face of the microelectrode is greater than it is in the bulk of solution. Because ofthis, stripping methods can be extremely sensitive; they can improve the detec-tion limits for selected species by factors of up to 106.
Anodic stripping is widely applied in the environmental area because of itsextreme sensitivity. Elements commonly determined by anodic stripping includeAg, Au, Bi, Cd, Cu, Ga, Ge, Hg, In, Pb, Sb, Sn, Tl, and Zn. Cathodic strippingmethods are used to determine anions that form insoluble mercury or silver salts.Some species that can be determined by cathodic stripping include arsenate,chloride, bromide, iodide, chromate, sulfate, sulfide, mercaptans, and thio-cyanate.
A classical bulk electrochemical method that has again become importantbecause of its use in detecting the effluents from ion chromatography columns(see Chapter 17) is electrolytic conductivity. Here, ions migrate to electrodesunder the influence of an electric field. The amount of current is directly propor-tional to the applied potential and the resistance (reciprocal of the conductance)of the solution by Ohm’s law. Net electrolysis is usually prevented by having thefield alternate in sign (ac field) or by pulsing the electrode potential.Conductance measurements are also employed to detect the end points intitrations involving electrolytes.
Cur
rent
, A
Cur
rent
, A
Cur
rent
, A
μμ
μ
(a)
(b)
Volume of reagent, mL
Volume of reagent, mL
Volume of reagent, mL
(c)
Figure 20-17 Typical amperometrictitration curves: (a) analyte is reduced,reagent is not; (b) reagent is reduced, ana-lyte is not; (c) both reagent and analyte arereduced.
12For a discussion of stripping methods, see J. Wang, Stripping Analysis (Deerfield Beach, FL: VCHPublishers, 1985).
A major advantage of stripping analysis
is the capability of preconcentrating the
analyte prior to the measurement step.
72795_03_ch20_p01-34.qxp 3/23/11 11:43 AM Page 32
20G Questions and Problems 33
WEB WORKS
Set your browser to http://www.basinc.com/about/index.html and investigate theelectrochemical instruments produced by one instrument company. In addition,determine if this company makes amperometric detectors for liquid chromatogra-phy and voltammetric sensors for other applications.
20-1. Briefly distinguish between(a) concentration polarization and kinetic
polarization.(b) an amperostat and a potentiostat.(c) a coulomb and a faraday.(d) a working electrode and a counter electrode.(e) the electrolysis circuit and the control cir-
cuit for controlled-potential methods.20-2. Briefly define
(a) current density.(b) ohmic potential.(c) coulometric titration.(d) controlled-potential electrolysis.(e) current efficiency.(f ) an electrochemical equivalent.
20-3. Describe three mechanisms responsible for thetransport of dissolved species to and from anelectrode surface.
20-4. How does the current in an electrochemical cellaffect its potential?
20-5. How do concentration polarization and kineticpolarization resemble one another? How do theydiffer?
20-6. What experimental variables affect concentra-tion polarization in an electrochemical cell?
20-7. Describe conditions that favor kinetic polariza-tion in an electrochemical cell.
20-8. How do electrogravimetric and coulometricmethods differ from potentiometric methods?
20-9. Identify three factors that influence the physicalcharacteristics of an electrolytic deposit.
20-10. What is the purpose of a cathode depolarizer?20-11. What is the function of
(a) an amperostat?(b) a potentiostat?
20-12. Differentiate between amperostatic coulometryand potentiostatic coulometry.
20-13. Why is it ordinarily necessary to isolate theworking electrode from the counter electrode ina controlled-potential coulometric analysis?
20-14. Why is an auxiliary reagent always required in acoulometric titration?
20-15. Distinguish between(a) voltammetry and polarography.(b) linear-scan and pulse voltammetry.
(c) a hanging mercury drop electrode and adropping mercury electrode.
(d) the standard electrode potential and thehalf-wave potential for a reversible coupleat a microelectrode.
20-16. Define(a) voltammogram.(b) hydrodynamic voltammetry.(c) limiting current.(d) mercury film electrode.(e) half-wave potential.
20-17. List the advantages and limitations of the drop-ping mercury electrode compared with platinumor carbon microelectrodes.
20-18. Calculate the theoretical potential needed to ini-tiate the deposition of(a) copper from a solution that is 0.150 M in
Cu2� and buffered to a pH of 3.00. Oxygenis evolved at the anode at 1.00 atm.
(b) silver bromide on a silver anode from a-solution that is 0.0864 M in Br� andbuffered to a pH of 3.40. Hydrogen isevolved at the cathode at 765 torr.
20-19. Calculate the initial potential needed for acurrent of 0.078 A in the cell
if this cell has a resistance of 5.00 �.20-20. The cell
has a resistance of 3.95 �. Calculate the initialpotential that will be needed for a current of0.072 A in this cell.
20-21. Silver is to be deposited from a solution that is0.150 M in 0.320 M in KCN, andbuffered to a pH of 10.00. Oxygen is evolved atthe anode at a partial pressure of 1.00 atm. Thecell has a resistance of 2.90 �; the temperatureis 25°C. Calculate(a) the theoretical potential needed to initiate
the deposition of silver from this solution.
Ag(CN)�2 ,
Cd2�(7.50 � 10�2 M) � Cd
Sn � Sn2�(8.22 � 10�4 M'
Zn2�(3.75 � 10�3 M) � Zn
Co � Co2�(6.40 � 10�3 M)'
20G QUESTIONS AND PROBLEMS
Note: Numerical data are molar analytical concentrations where the full formula of a species is provided. Molar equilibrium concen-trations are supplied for species displayed as ions.
72795_03_ch20_p01-34.qxp 3/23/11 11:43 AM Page 33
Web Chapter 20 A Brief Look at Some Other Electroanalytical Methods34
in 5 min and 24 s by a constant current of0.401 A. Calculate the equivalent weight ofthe acid.
20-28. An excess of HgNH3Y2� was introduced to25.00 mL of well water. Express the hardnessof the water in terms of ppm CaCO3 if theEDTA needed for the titration was generatedat a mercury cathode (Equation 20-7) in 2.02min by a constant current of 31.6 mA.
20-29. The nitrobenzene in 210 mg of an organicmixture was reduced to phenylhydroxy-lamine at a constant potential of � 0.96 V(versus SCE) applied to a mercury cathode:
The sample was dissolved in 100 mL ofmethanol; after electrolysis for 30 min, thereaction was judged complete. An electroniccoulometer in series with the cell indicatedthat the reduction required 26.74 C. Calculatethe percentage of C6H5NO2 in the sample.
20-30. At a potential of � 1.0 V (versus SCE), CCl4
in methanol is reduced to CHCl3 at a mer-cury cathode:
At � 1.80 V, the CHCl3 further reacts to giveCH4 :
A 0.750-g sample containing CCl4 , CHCl3 ,and inert organic species was dissolved inmethanol and electrolyzed at � 1.0 V untilthe current approached zero. A coulometerindicated that 11.63 C were required to com-plete the reaction. The potential of the cath-ode was adjusted to � 1.8 V. Completion ofthe titration at this potential required an addi-tional 68.6 C. Calculate the percentage ofCCl4 and CHCl3 in the mixture.
20-31. The voltammogram for 20.00 mL of solutionthat was 3.65 � 10�3 M in Cd2� gave a wavefor that ion with a limiting current of 31.3mA. Calculate the percentage change inconcentration of the solution if the current inthe limiting current region were allowed tocontinue for(a) 5 min.(b) 10 min.(c) 30 min.
20-32. Why are stripping methods more sensitivethan other voltammetric procedures?
2CH4 � 3Hg2Cl2(s)
2CHCl3 � 6H� � 6e� � 6Hg(l) :
2CHCl3 � Hg2Cl2(s)
2CCl4 � 2H� � 2e� � 2Hg(l) :
C6H5NHOH � H2OC6H5NO2 � 4H� � 4e� :
(b) the IR drop associated with a current of0.12 A in this cell.
(c) the initial applied potential, given that the O2
overvoltage is 0.80 V under these conditions.(d) the applied potential when is
1.00 � 10�5 M, assuming no changes inIR drop and O2 overvoltage.
20-22. A solution is 0.150 M in Co2� and 0.0750 M inCd2�. Calculate(a) the Co2� concentration in the solution as
the first cadmium starts to deposit.(b) the cathode potential needed to lower the
Co2� concentration to 1.00 � 10�5 M.20-23. Halide ions can be deposited on a silver anode
via the reaction
(a) If 1.00 � 10�5 M is used as the criterionfor quantitative removal, is it theoreticallyfeasible to separate Br� from I� throughcontrol of the anode potential in a solutionthat is initially 0.250 M in each ion?
(b) Is a separation of Cl� and I� theoreticallyfeasible in a solution that is initially 0.250M in each ion?
(c) If a separation is feasible in either part (a)or part (b), what range of anode potential(versus SCE) should be used?
20-24. A solution is 0.100 M in each of two reduciblecations, A and B. Removal of the more re-ducible species A is deemed complete when [A]has been decreased to 1.00 � 10�5 M. Whatminimum difference in standard electrodepotentials will permit the isolation of A withoutinterference from B when
A is B is
(a) univalent univalent(b) trivalent univalent(c) divalent divalent(d) univalent trivalent(e) trivalent trivalent
20-25. Calculate the time needed for a constant currentof 0.961 A to deposit 0.500 g of Co(II) as(a) elemental cobalt on the surface of a cathode.(b) Co3O4 on an anode.
20-26. Calculate the time needed for a constant currentof 1.20 A to deposit 0.500 g of (a) Tl(III) as the element on a cathode.(b) Tl(I) as Tl2O3 on an anode.(c) Tl(I) as the element on a cathode.
20-27. A 0.1516-g sample of a purified organic acidwas neutralized by the hydroxide ion produced
Ag(s) � X� : AgX(s) � e�
[Ag(CN)�2 ]
72795_03_ch20_p01-34.qxp 3/23/11 11:43 AM Page 34