Embed Size (px)
Citation preview
Web Characterization
Week 11
LBSC 690
Information Technology
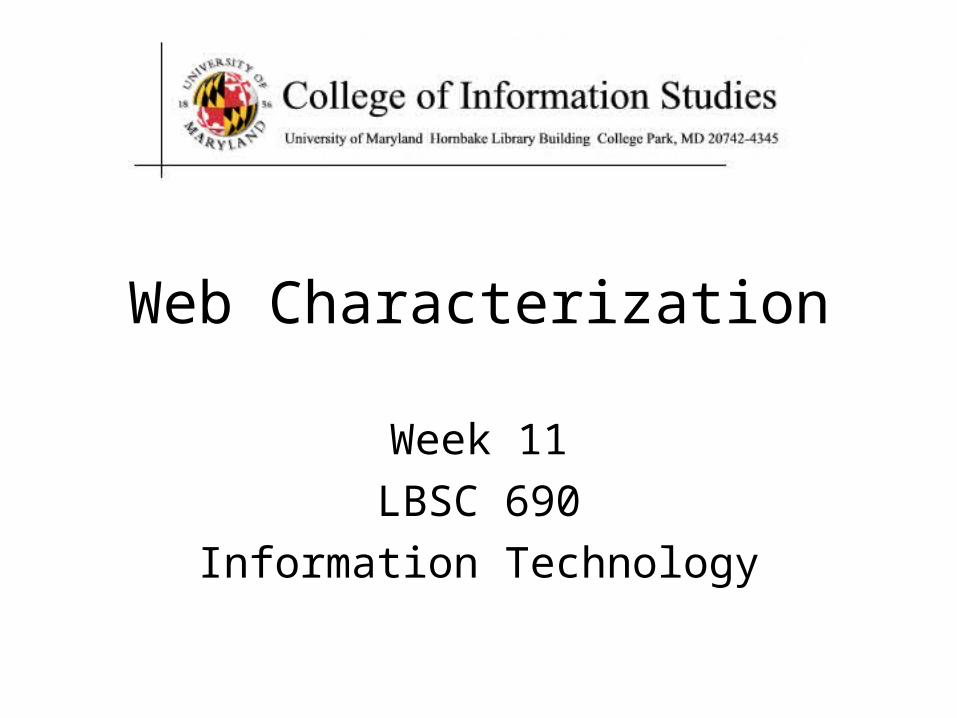
The Why of the Web (in 1995)
• Affordable storage– 300,000 words/$
• Adequate backbone capacity– 25,000 simultaneous transfers
• Adequate “last mile” bandwidth– 1 second/screen
• Display capability– 10% of US population
• Effective search capabilities– Lycos, Yahoo
Defining the Web
• HTTP, HTML, or URL?
• Static, dynamic or streaming?
• Public, protected, or internal?
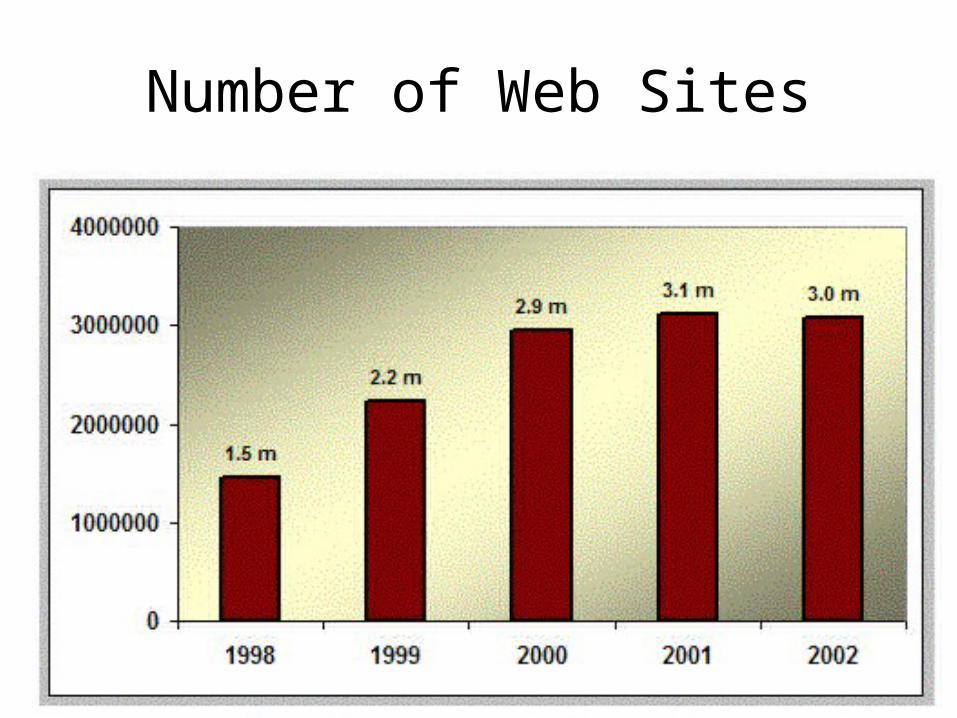
Number of Web Sites
Discussion Topic:What’s a Web “Site”?
• OCLC counted any server at port 80– Misses many servers at other ports
• Some servers host unrelated content– Geocities
• Some content requires specialized servers– rtsp

Crawling the Web
Web Crawl Challenges• Discovering “islands” and “peninsulas”
• Duplicate and near-duplicate content– 30-40% of total content
• Server and network loads
• Dynamic content generation
• Link rot– Changes at 1% per week
• Temporary server interruptions
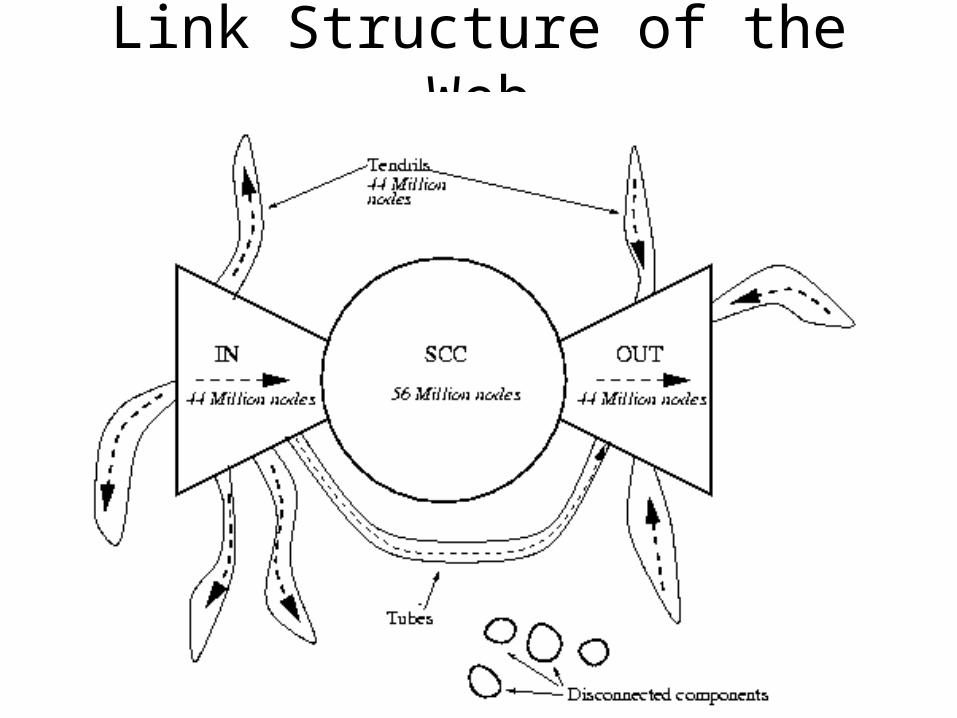
Link Structure of the Web
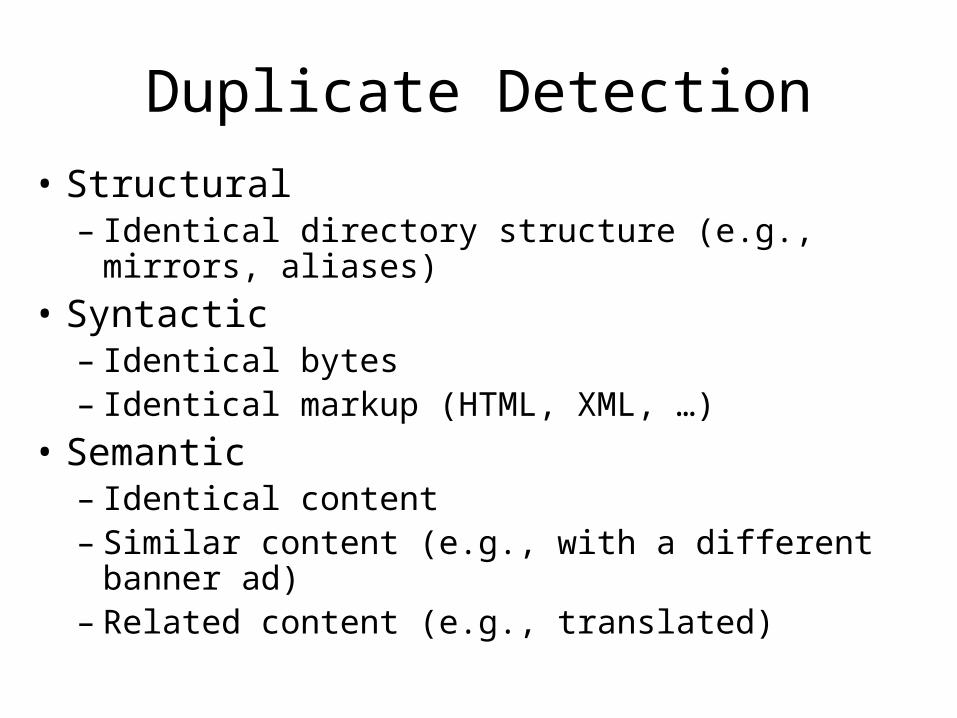
Duplicate Detection
• Structural– Identical directory structure (e.g., mirrors, aliases)
• Syntactic– Identical bytes– Identical markup (HTML, XML, …)
• Semantic– Identical content– Similar content (e.g., with a different banner ad)– Related content (e.g., translated)
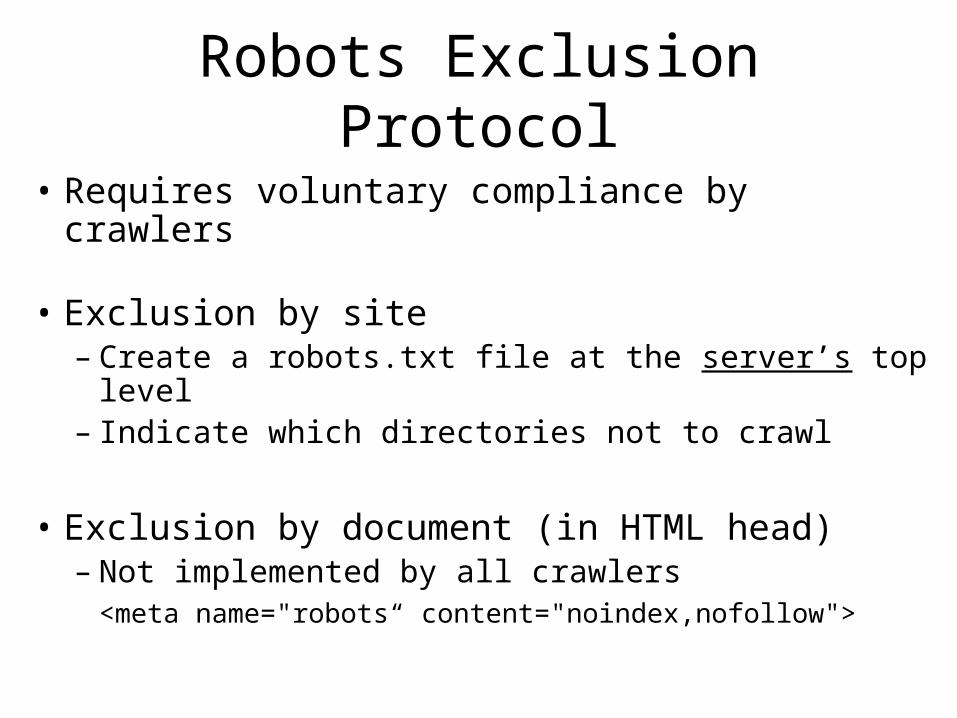
Robots Exclusion Protocol
• Requires voluntary compliance by crawlers
• Exclusion by site– Create a robots.txt file at the server’s top level– Indicate which directories not to crawl
• Exclusion by document (in HTML head)– Not implemented by all crawlers
<meta name="robots“ content="noindex,nofollow">

Hands on:The Internet Archive
• alexa.com Web crawls since 1997– http://archive.org
• Check out Maryland’s Web site in 1997
• Check out the history of your favorite site
Discussion Point
• Can we save everything?
• Should we?
• Do people have a right to remove things?
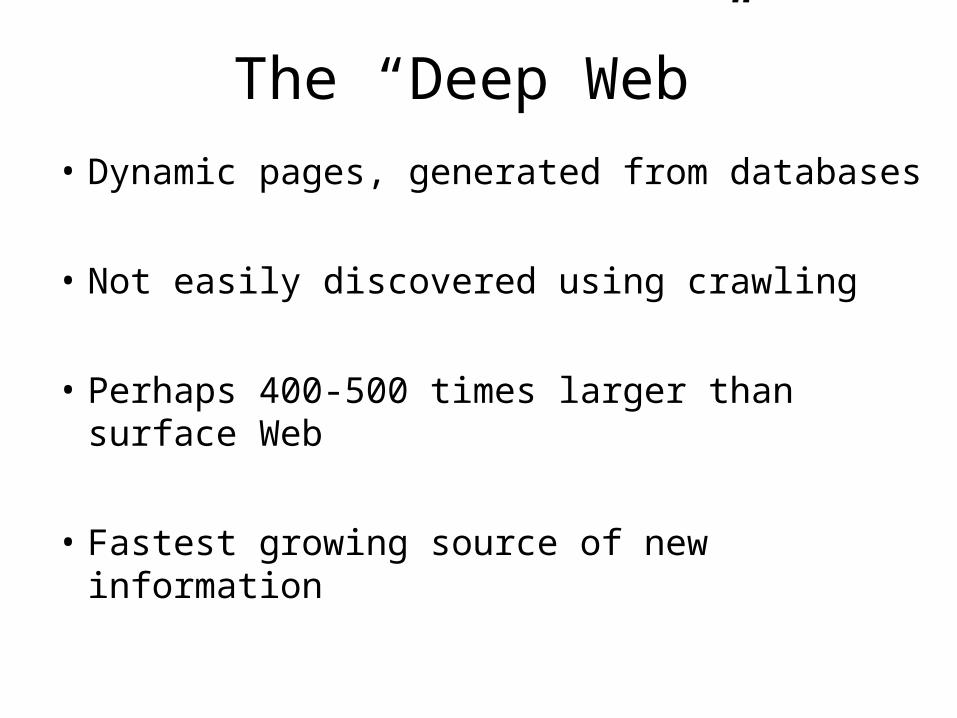
The “Deep Web”
• Dynamic pages, generated from databases
• Not easily discovered using crawling
• Perhaps 400-500 times larger than surface Web
• Fastest growing source of new information
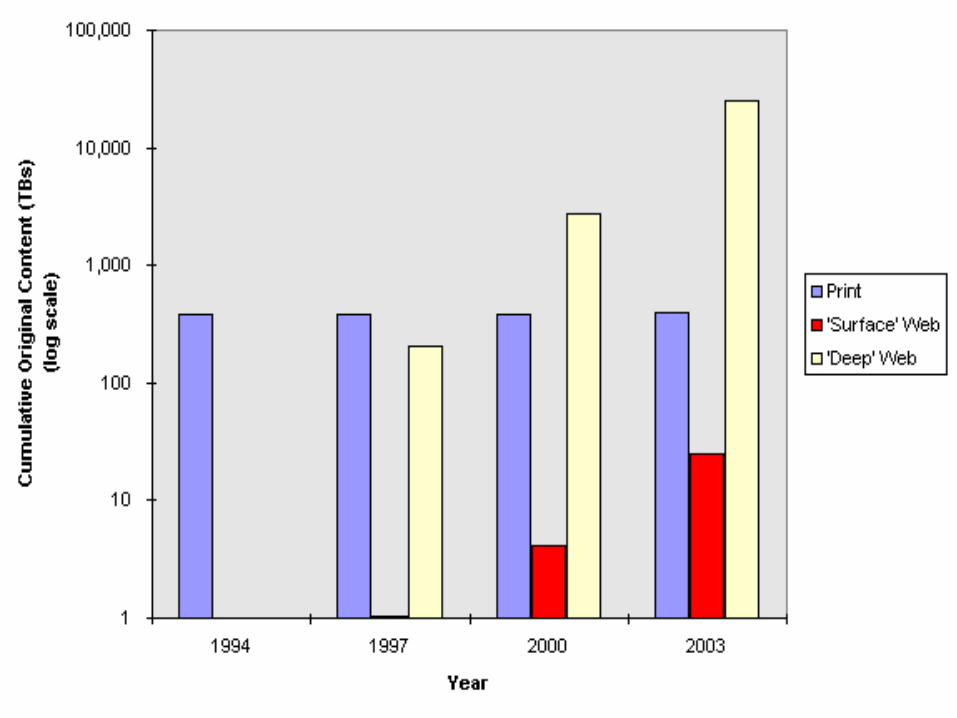

Content of the Deep Web

Deep Web• 60 Deep Sites Exceed Surface Web by 40 Times
NameType URL
Web Size
(GBs)
National Climatic Data Center (NOAA)
Public http://www.ncdc.noaa.gov/ol/satellite/satelliteresources.html
366,000
NASA EOSDIS Public http://harp.gsfc.nasa.gov/~imswww/pub/imswelcome/plain.html
219,600
National Oceanographic (combined with Geophysical) Data Center (NOAA)
Public/Fee http://www.nodc.noaa.gov/, http://www.ngdc.noaa.gov/
32,940
Alexa Public (partial)
http://www.alexa.com/ 15,860
Right-to-Know Network (RTK Net) Public http://www.rtk.net/ 14,640
MP3.com Public http://www.mp3.com/
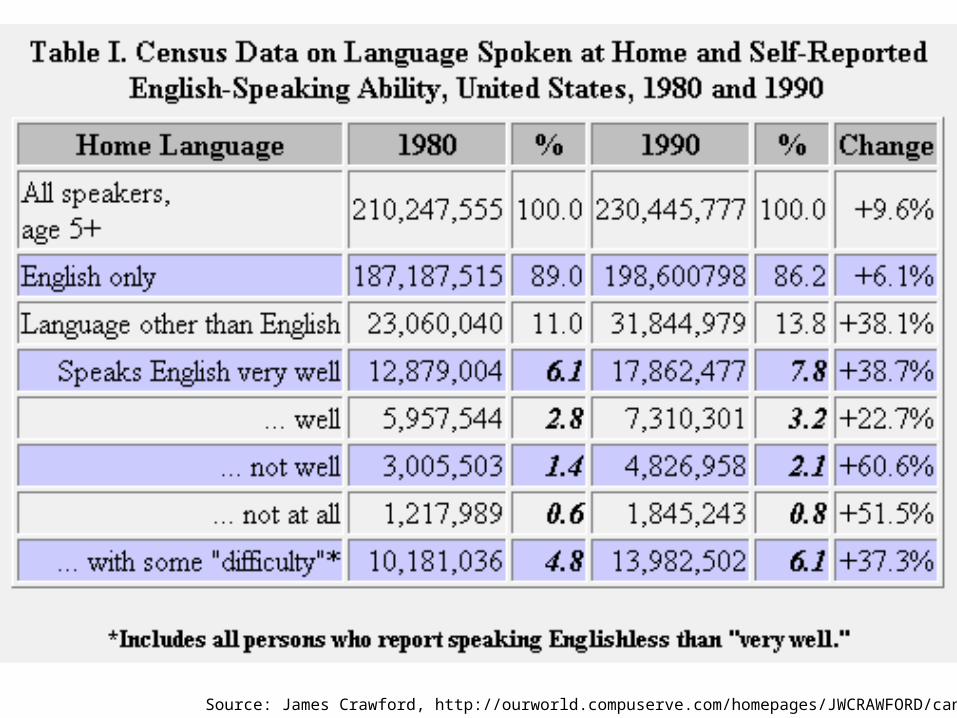
Source: James Crawford, http://ourworld.compuserve.com/homepages/JWCRAWFORD/can-pop.htm
31%
18%
9%
7%
7%
5%
4%
3%
3%
2%
11%
English
Chinese
Japanese
Spanish
German
Korean
French
Portuguese
Italian
Russian
Other
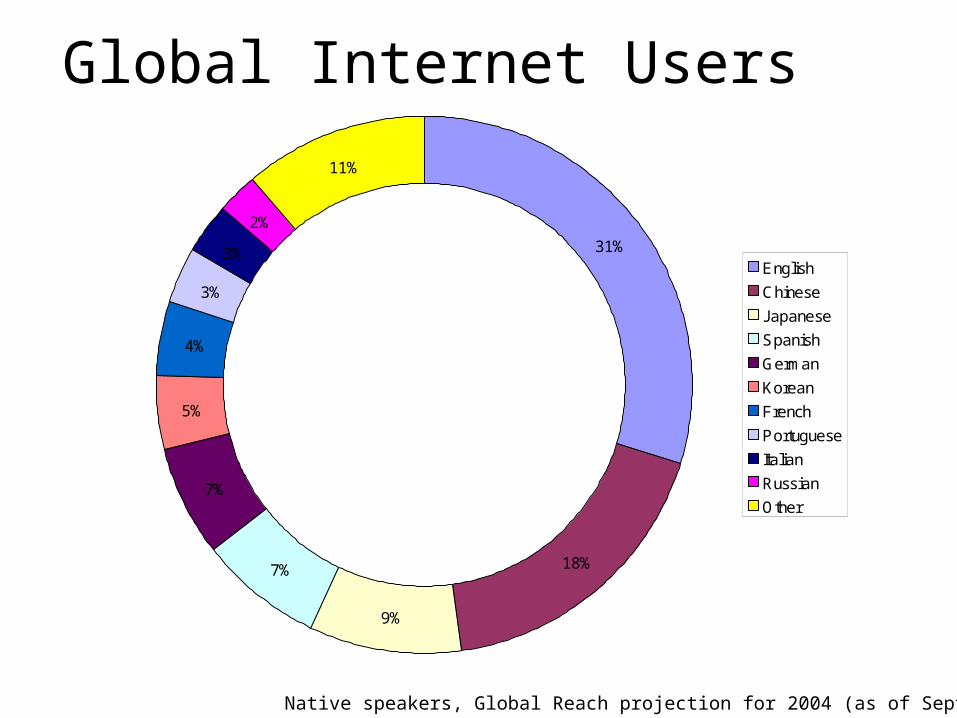
Native speakers, Global Reach projection for 2004 (as of Sept, 2003)
Global Internet Users
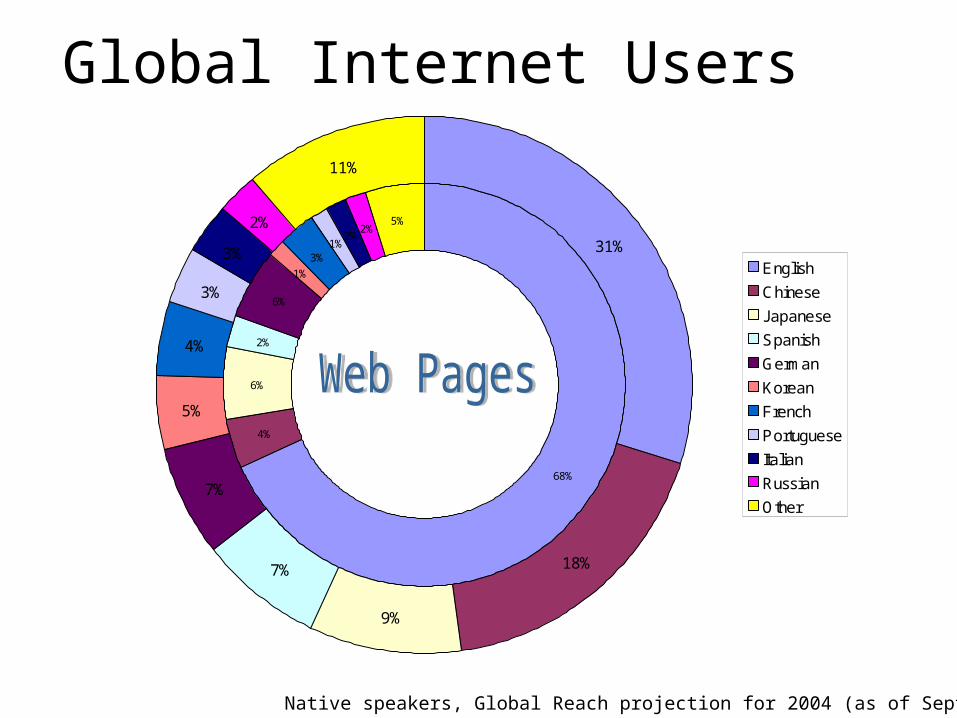
68%
4%
6%
2%
6%
1%
3%1%
2%2%
5%
31%
18%
9%
7%
7%
5%
4%
3%
3%
2%
11%
English
Chinese
Japanese
Spanish
German
Korean
French
Portuguese
Italian
Russian
Other
Native speakers, Global Reach projection for 2004 (as of Sept, 2003)
Global Internet Users
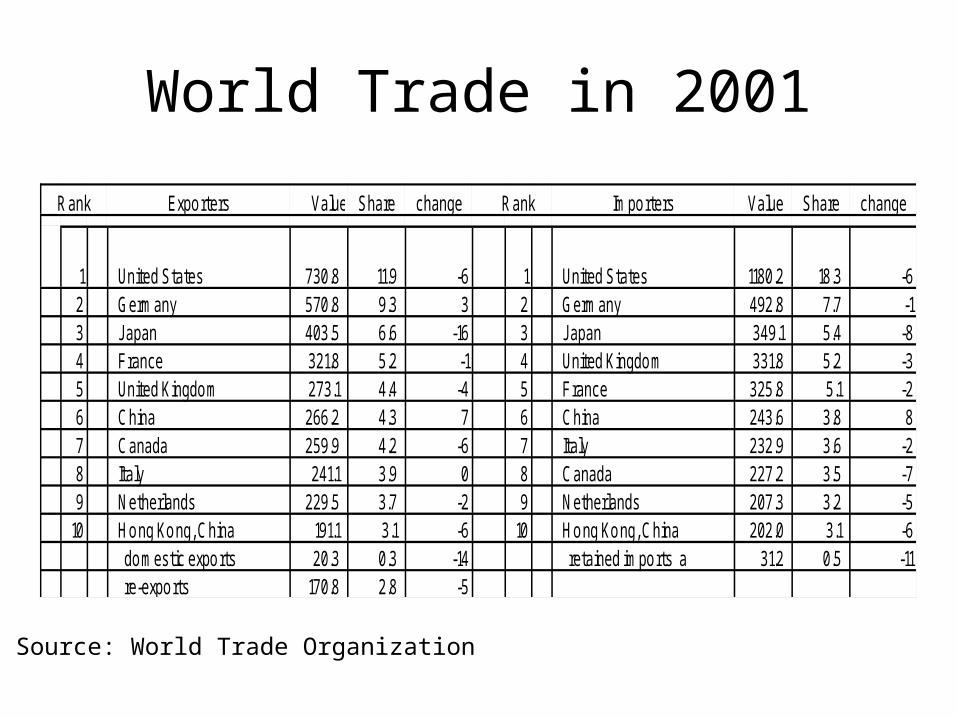
World Trade in 2001
Rank Exporters Value Share change Rank Importers Value Share change
1 United States 730.8 11.9 -6 1 United States 1180.2 18.3 -62 Germany 570.8 9.3 3 2 Germany 492.8 7.7 -13 J apan 403.5 6.6 -16 3 J apan 349.1 5.4 -84 F rance 321.8 5.2 -1 4 United Kingdom 331.8 5.2 -35 United Kingdom 273.1 4.4 -4 5 F rance 325.8 5.1 -26 China 266.2 4.3 7 6 China 243.6 3.8 87 Canada 259.9 4.2 -6 7 Italy 232.9 3.6 -28 Italy 241.1 3.9 0 8 Canada 227.2 3.5 -79 Netherlands 229.5 3.7 -2 9 Netherlands 207.3 3.2 -5
10 Hong Kong, China 191.1 3.1 -6 10 Hong Kong, China 202.0 3.1 -6 domestic exports 20.3 0.3 -14 retained imports a 31.2 0.5 -11 re-exports 170.8 2.8 -5
Source: World Trade Organization

European Web Content
Source: European Commission, Evolution of the Internet and the World Wide Web in Europe, 1997
0
2,000,000
4,000,000
6,000,000
8,000,000
10,000,000
12,000,000
14,000,000
16,000,000
18,000,000
20,000,000
Mar
-03
Apr-0
3
May
-03
Jun-
03
Jul-0
3
Aug-
03
Sep-
03
Oct-0
3
Nov-0
3
Dec-0
3
Jan-
04
Feb-
04
Mar
-04
Apr-0
4
May
-04
Jun-
04
Jul-0
4
Aug-
04
Sep-
04
Oct-0
4
Nov-0
4
Dec-0
4
Jan-
05
Feb-
05
Mar
-05
Apr-0
5
May
-05
Jun-
05
Jul-0
5
Aug-
05
Sep-
05
Oct-0
5
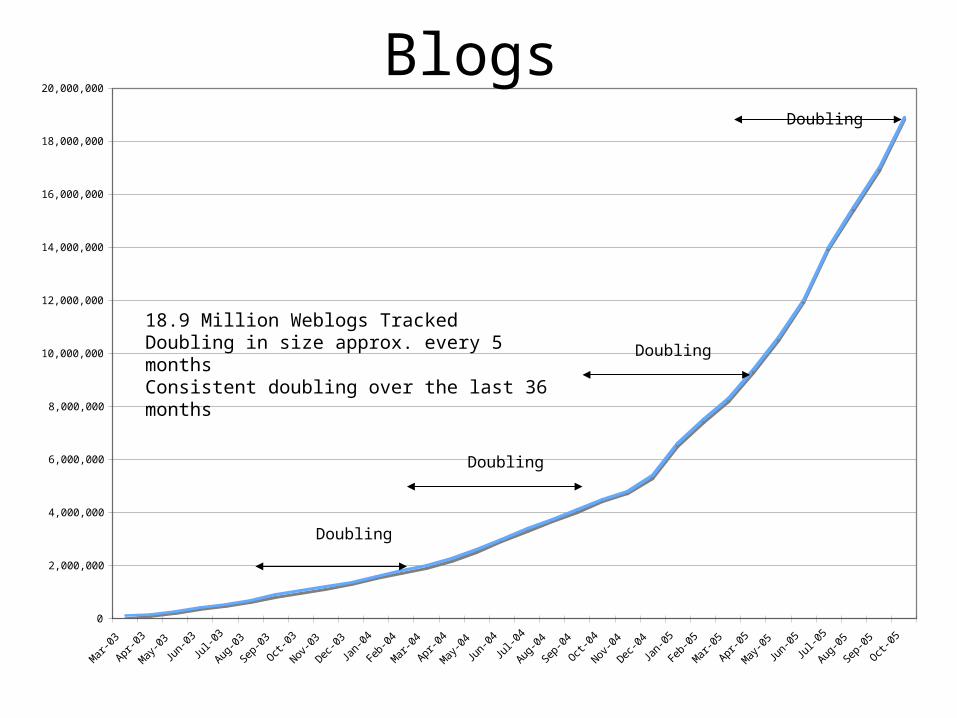
Doubling
Doubling
Doubling
18.9 Million Weblogs TrackedDoubling in size approx. every 5 monthsConsistent doubling over the last 36 months
BlogsDoubling
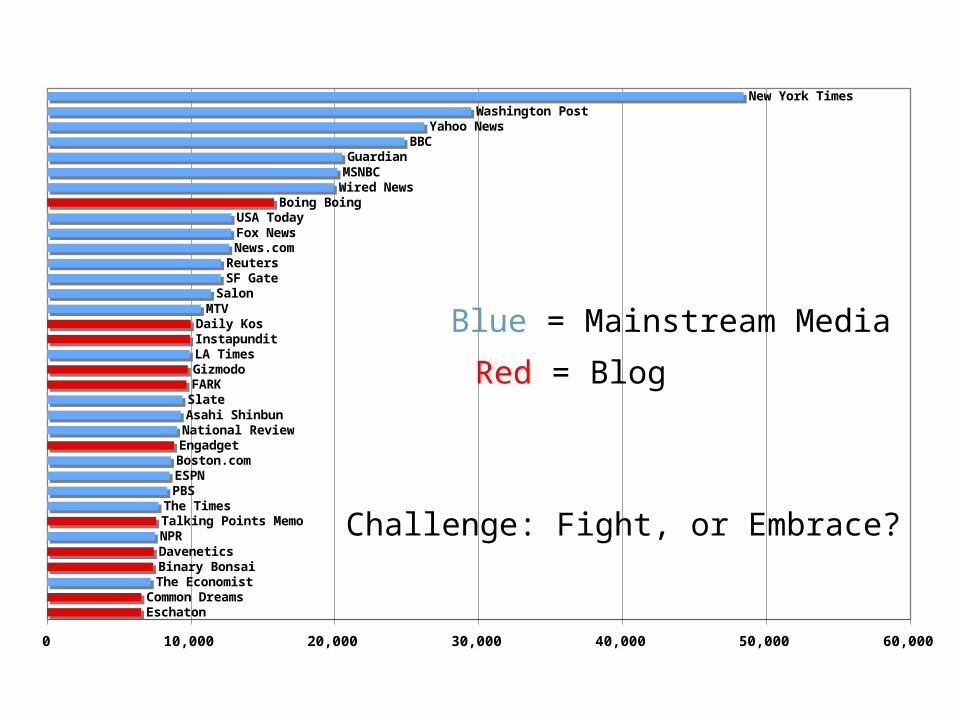
EschatonCommon Dreams
The EconomistBinary BonsaiDaveneticsNPRTalking Points MemoThe TimesPBSESPNBoston.comEngadgetNational ReviewAsahi ShinbunSlateFARKGizmodoLA TimesInstapunditDaily Kos
MTVSalon
SF GateReutersNews.comFox NewsUSA Today
Boing BoingWired NewsMSNBCGuardian
BBCYahoo News
Washington PostNew York Times
0 10,000 20,000 30,000 40,000 50,000 60,000
Blue = Mainstream Media
Red = Blog
Challenge: Fight, or Embrace?
0
200000
400000
600000
800000
1000000
1200000
1400000
9/1/
04
9/15
/04
9/29
/04
10/1
3/04
10/2
7/04
11/1
0/04
11/2
4/04
12/8
/04
12/2
2/04
1/5/
05
1/19
/05
2/2/
05
2/16
/05
3/2/
05
3/16
/05
3/30
/05
4/13
/05
4/27
/05
5/11
/05
5/25
/05
6/8/
05
6/22
/05
7/6/
05
7/20
/05
8/3/
05
8/17
/05
8/31
/05
9/14
/05
9/28
/05
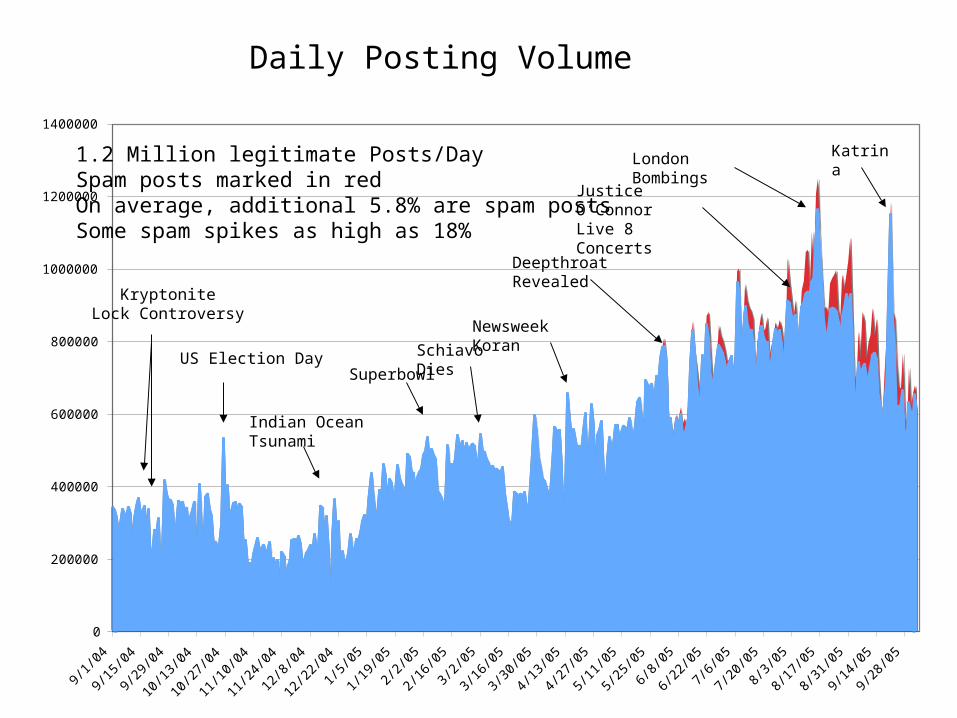
KryptoniteLock Controversy
US Election Day
Indian Ocean Tsunami
Superbowl
Schiavo Dies
Newsweek Koran
Deepthroat Revealed
Justice O’ConnorLive 8 Concerts
London Bombings Katrina
Daily Posting Volume
1.2 Million legitimate Posts/DaySpam posts marked in redOn average, additional 5.8% are spam posts Some spam spikes as high as 18%
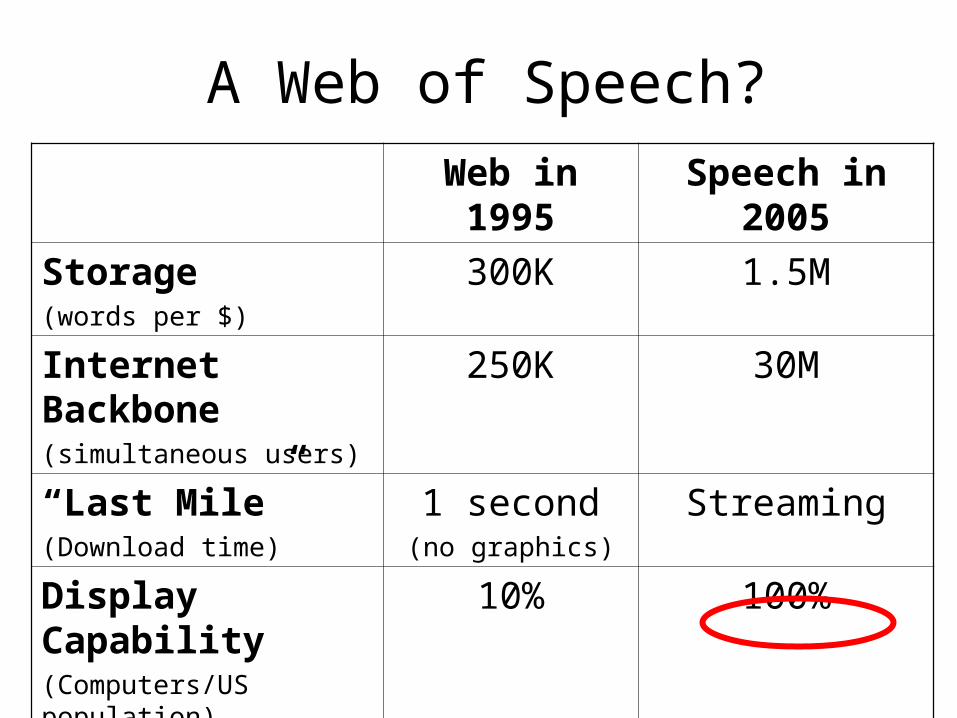
A Web of Speech?
Web in 1995 Speech in 2005
Storage(words per $)
300K 1.5M
Internet Backbone(simultaneous users)
250K 30M
“Last Mile”(Download time)
1 second(no graphics)
Streaming
Display Capability(Computers/US population)
10% 100%
Search Systems Lycos
Yahoo
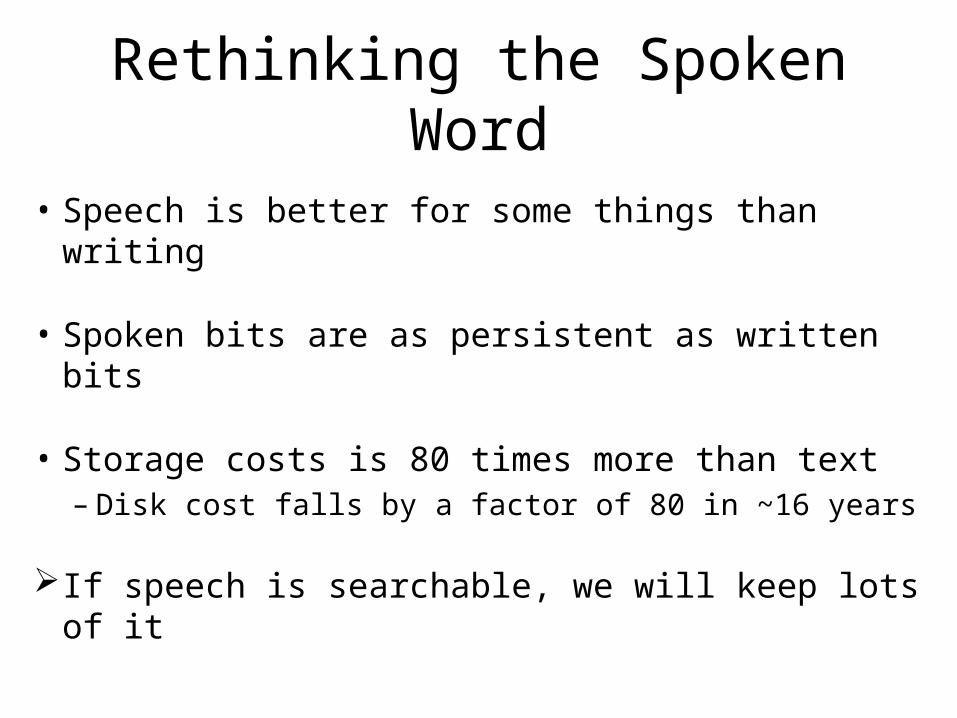
Rethinking the Spoken Word
• Speech is better for some things than writing
• Spoken bits are as persistent as written bits
• Storage costs is 80 times more than text – Disk cost falls by a factor of 80 in ~16 years
If speech is searchable, we will keep lots of it
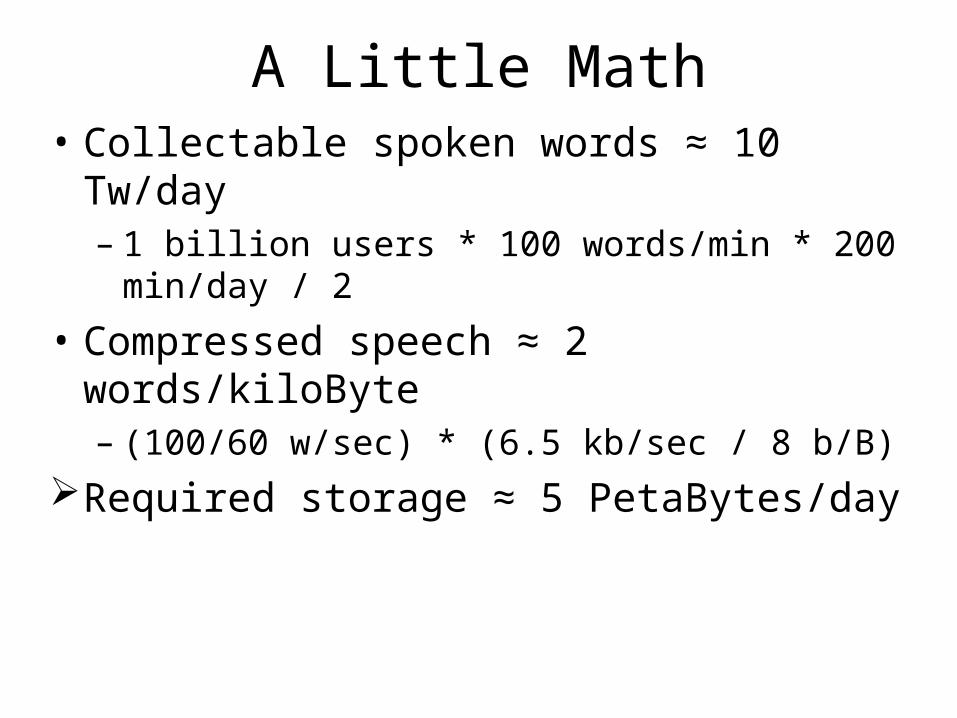
A Little Math• Collectable spoken words ≈ 10 Tw/day
– 1 billion users * 100 words/min * 200 min/day / 2
• Compressed speech ≈ 2 words/kiloByte– (100/60 w/sec) * (6.5 kb/sec / 8 b/B)
Required storage ≈ 5 PetaBytes/day
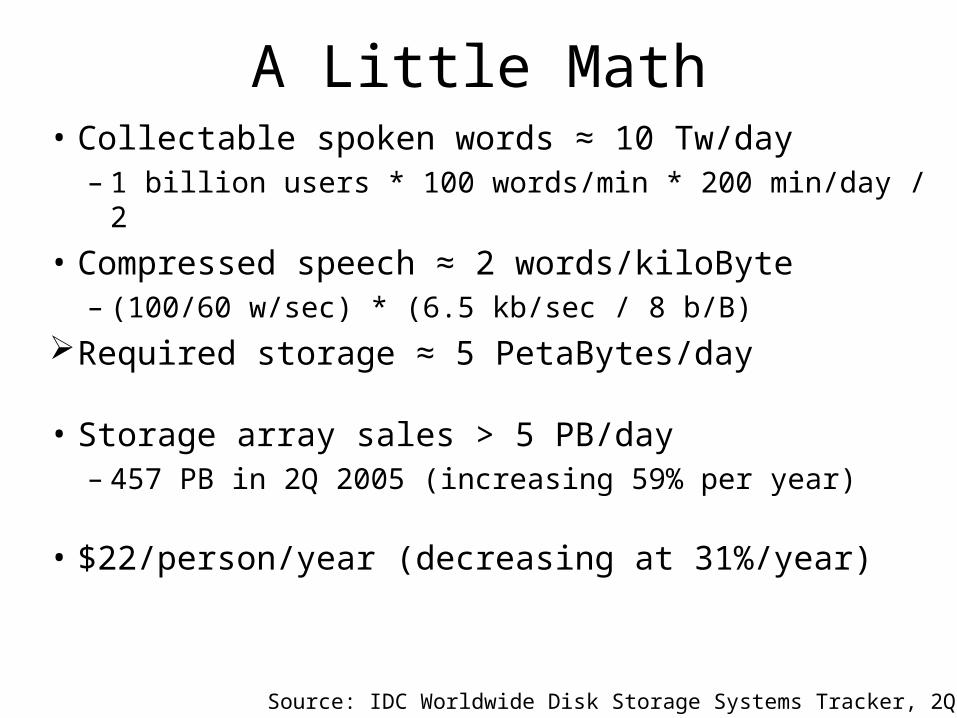
A Little Math• Collectable spoken words ≈ 10 Tw/day
– 1 billion users * 100 words/min * 200 min/day / 2
• Compressed speech ≈ 2 words/kiloByte– (100/60 w/sec) * (6.5 kb/sec / 8 b/B)
Required storage ≈ 5 PetaBytes/day
• Storage array sales > 5 PB/day– 457 PB in 2Q 2005 (increasing 59% per year)
• $22/person/year (decreasing at 31%/year)
Source: IDC Worldwide Disk Storage Systems Tracker, 2Q 2005
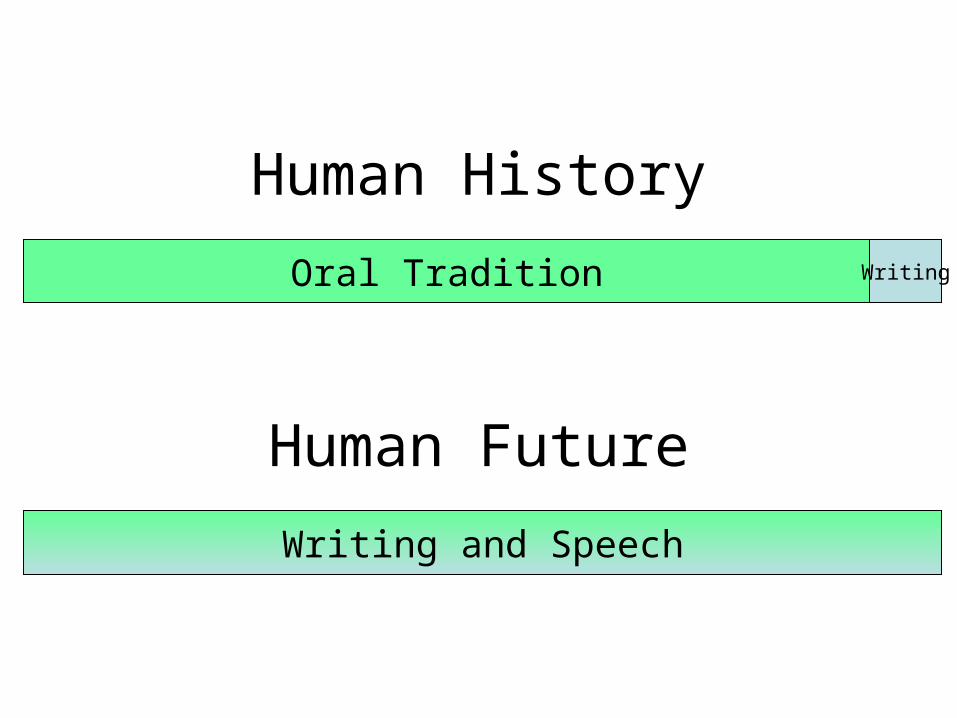
Human History
Oral Tradition Writing
Human Future
Writing and Speech
Hands On: Speech on the Web
• singingfish.com
• blinkx.com
• ocw.mit.edu
• podcasts.yahoo.com