Embed Size (px)
Citation preview
1
RTI International is a trade name of Research Triangle Institute
Web Questionnaire Usage in an Establishment Survey
Sarah Harris, Susan McRitchie, Michael Penne, Paul Biemer(RTI International)
May 14, 2010
2
Outline of Discussion
O*NET Data Collection Program
Review of the Literature
Hypothesis
Web Option Users
Data Quality
Implications
Future Directions
3
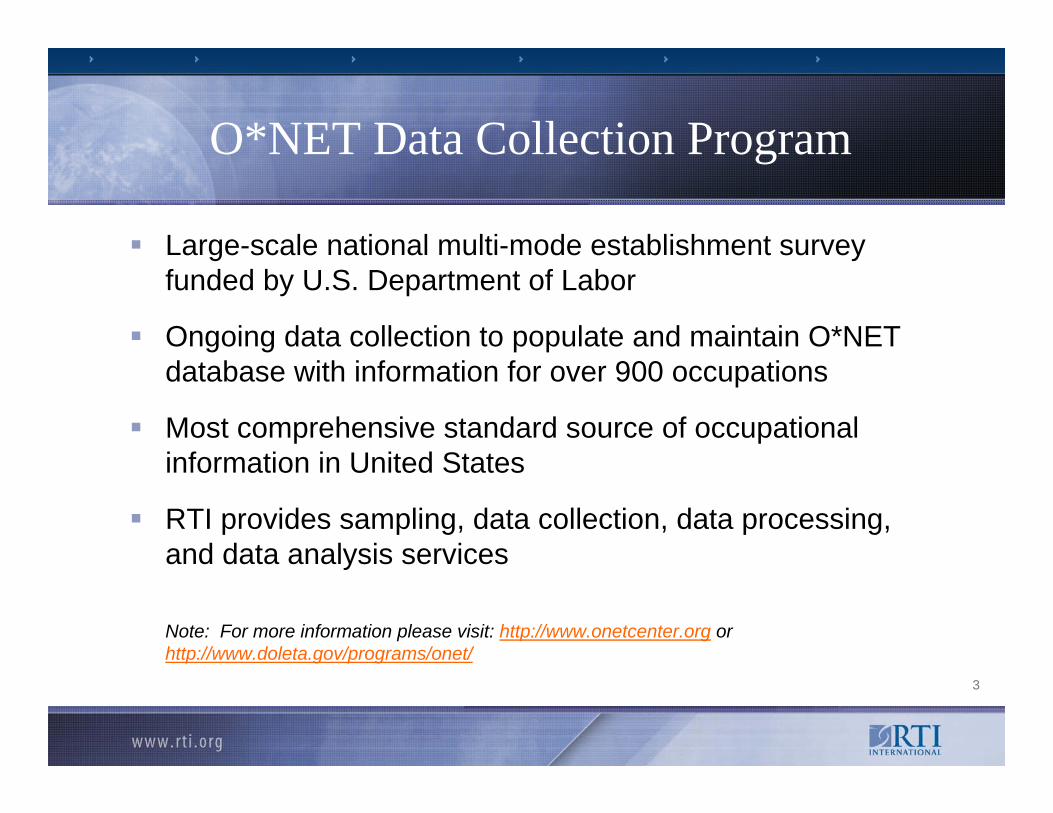
O*NET Data Collection Program
Large-scale national multi-mode establishment survey funded by U.S. Department of Labor
Ongoing data collection to populate and maintain O*NET database with information for over 900 occupations
Most comprehensive standard source of occupational information in United States
RTI provides sampling, data collection, data processing, and data analysis services
Note: For more information please visit: http://www.onetcenter.org or http://www.doleta.gov/programs/onet/
4
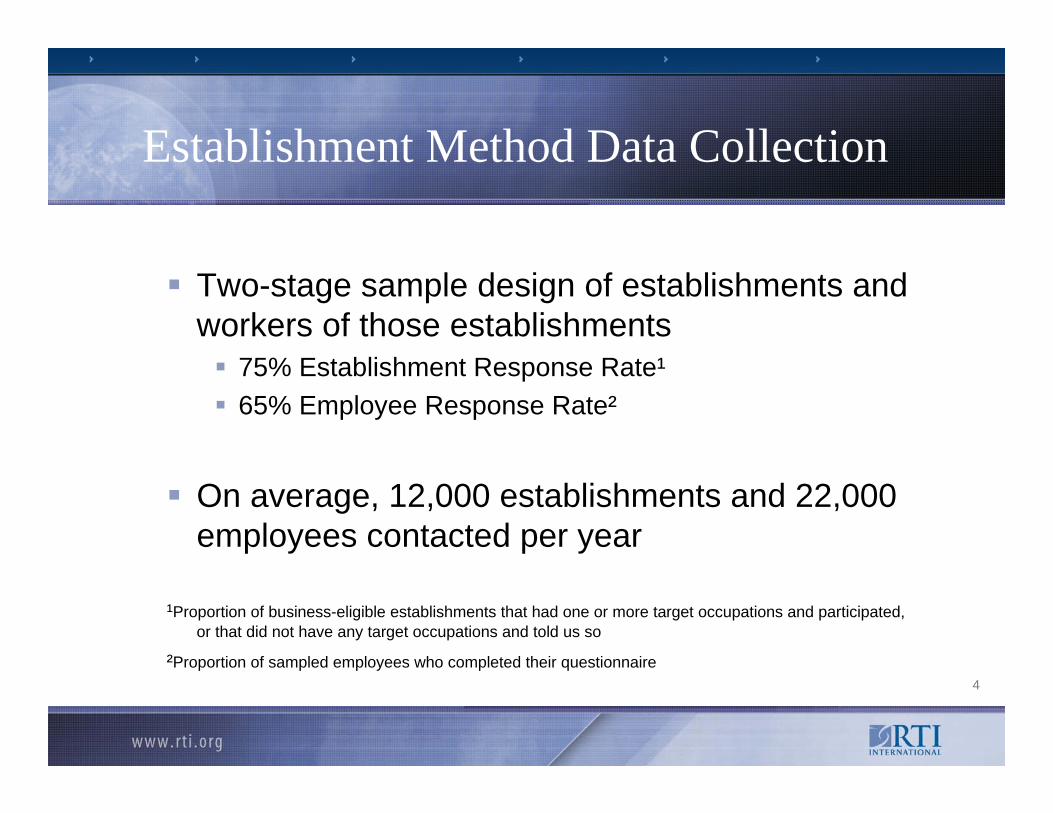
Establishment Method Data Collection
Two-stage sample design of establishments and workers of those establishments
75% Establishment Response Rate¹65% Employee Response Rate²
On average, 12,000 establishments and 22,000 employees contacted per year
¹Proportion of business-eligible establishments that had one or more target occupations and participated, or that did not have any target occupations and told us so
²Proportion of sampled employees who completed their questionnaire
5
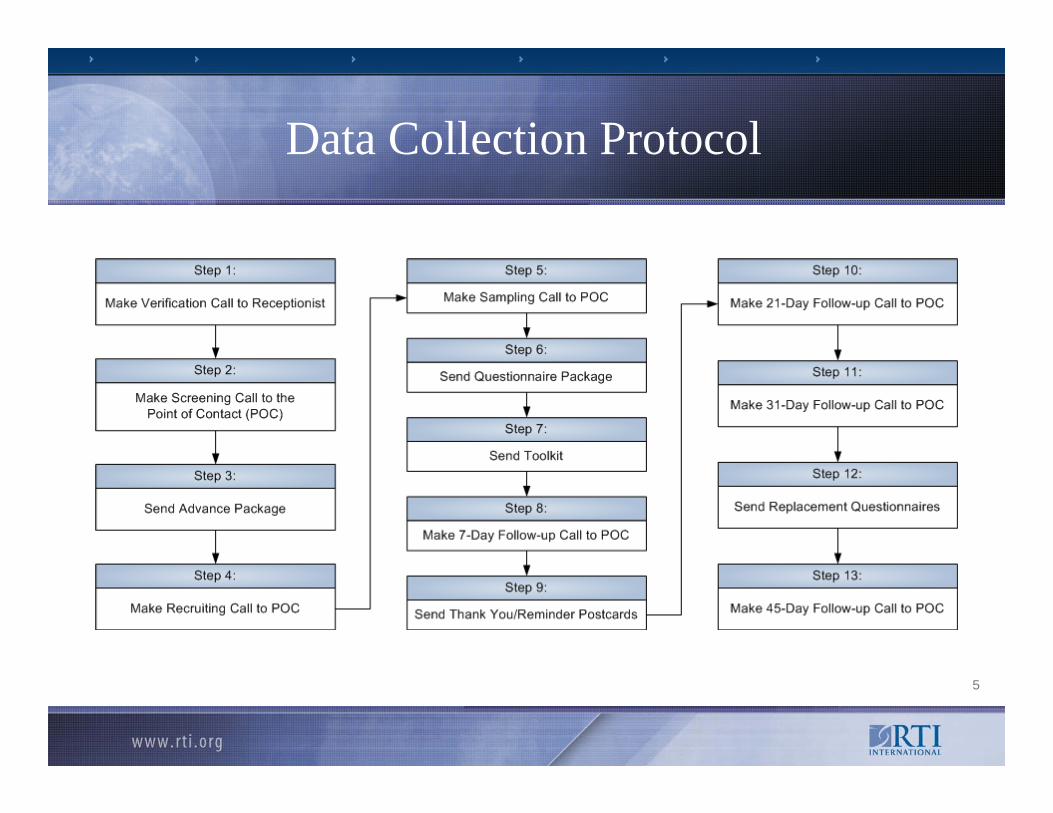
Data Collection Protocol
6
Review of the Literature
Web surveys are:more standardized, consistent, and confidential than paper and pencil methods (Fox et al., 2003).allow data collectors to save on costs typically expended on travel for in-person interviews or shipping/postage for hardcopy mail surveys (Schmidt, 1997). restricted to populations who have access to the Internet and may limit the sensitivity of data being collected due to concerns with data security (Schmidt, 1997)
7
Review of the Literature
Web surveys may not appeal universally:
Web surveys were preferred to paper and pencil surveys by students (Miller et al., 2002).
In a survey of physicians, one group being offered a Web survey and one group being offered the same survey using paper and pencil, the overall response rates were higher for those physicians receiving the paper and pencil version (Leece et al., 2004).
In a comparison of identical (content) Web and paper and pencil versions of a survey, researchers found fewer missing values in the returned Web data (Stanton, 1998).
8
Unanswered Questions
If the literature shows distinct cost and data quality advantages to providing respondents with a web survey, is this an effective approach to take for all establishment surveys?
To determine this, we first need to know:
Who uses the Web option?
Is the data that is returned via Web of a higher quality than data that is returned via a traditional paper and pencil method?

9
Hypothesis
We expect to find statistically significant differences in the propensity for the following people to use the Web:
evenly distributed by region
high tech occupations over non high-tech occupations
white collar industries over blue collar industries
We expect that data returned via the Web is more complete (fewer missing values and no bad data) and is returned at a faster rate than its paper counterpart.
10
Overall Usage of the Web Option
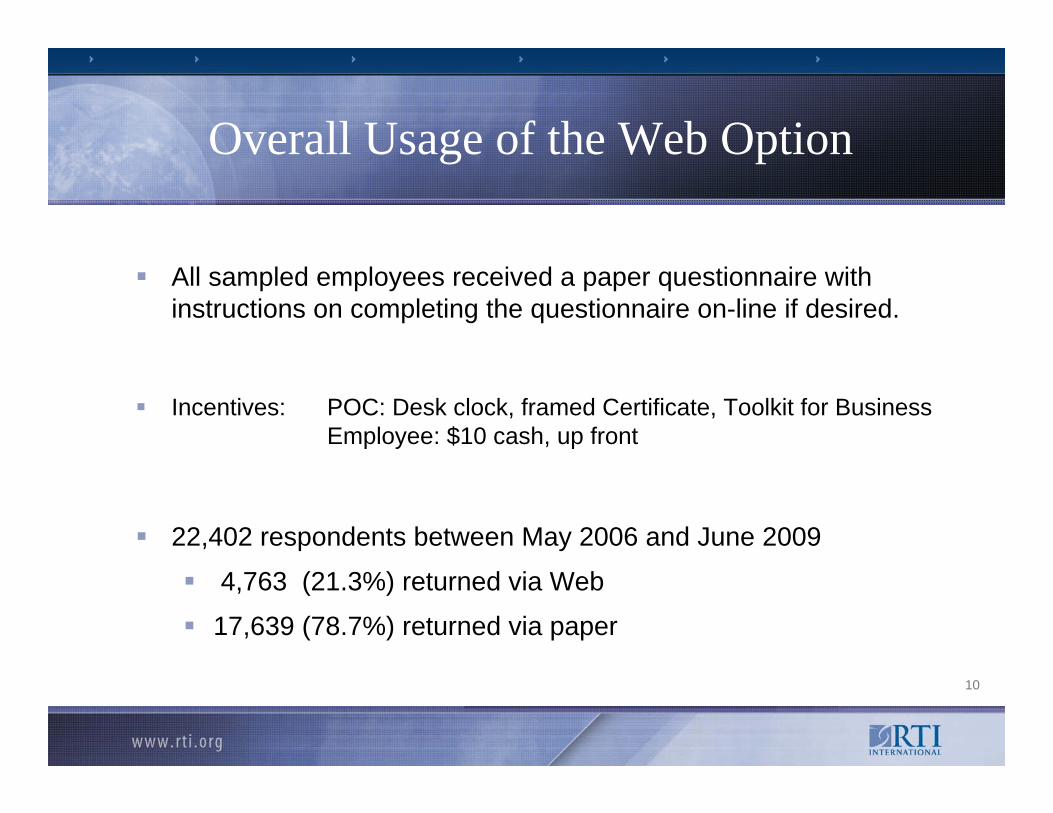
All sampled employees received a paper questionnaire with instructions on completing the questionnaire on-line if desired.
Incentives: POC: Desk clock, framed Certificate, Toolkit for BusinessEmployee: $10 cash, up front
22,402 respondents between May 2006 and June 2009
4,763 (21.3%) returned via Web
17,639 (78.7%) returned via paper
11
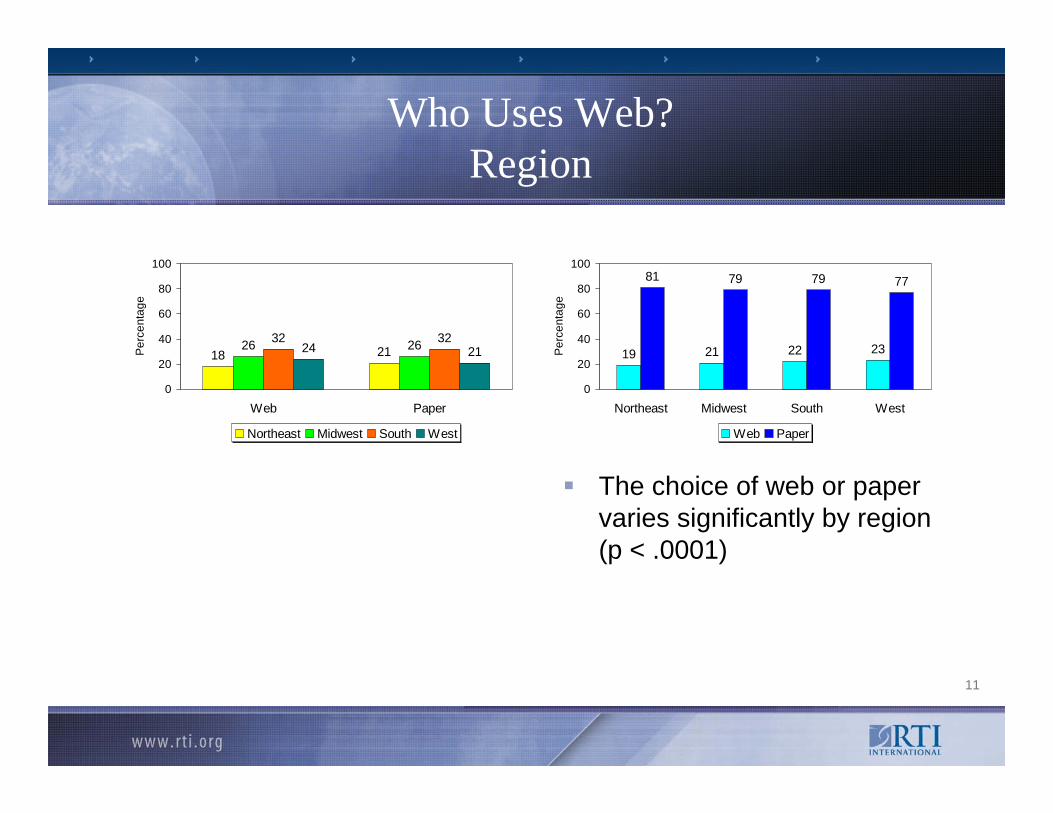
Who Uses Web?Region
18 2126 2632 3224 21
0
20
40
60
80
100
Web Paper
Perc
enta
ge
Northeast Midwest South West
19 21 22 23
81 79 79 77
0
20
40
60
80
100
Northeast Midwest South West
Perc
enta
ge
Web Paper
The choice of web or paper varies significantly by region (p < .0001)
12
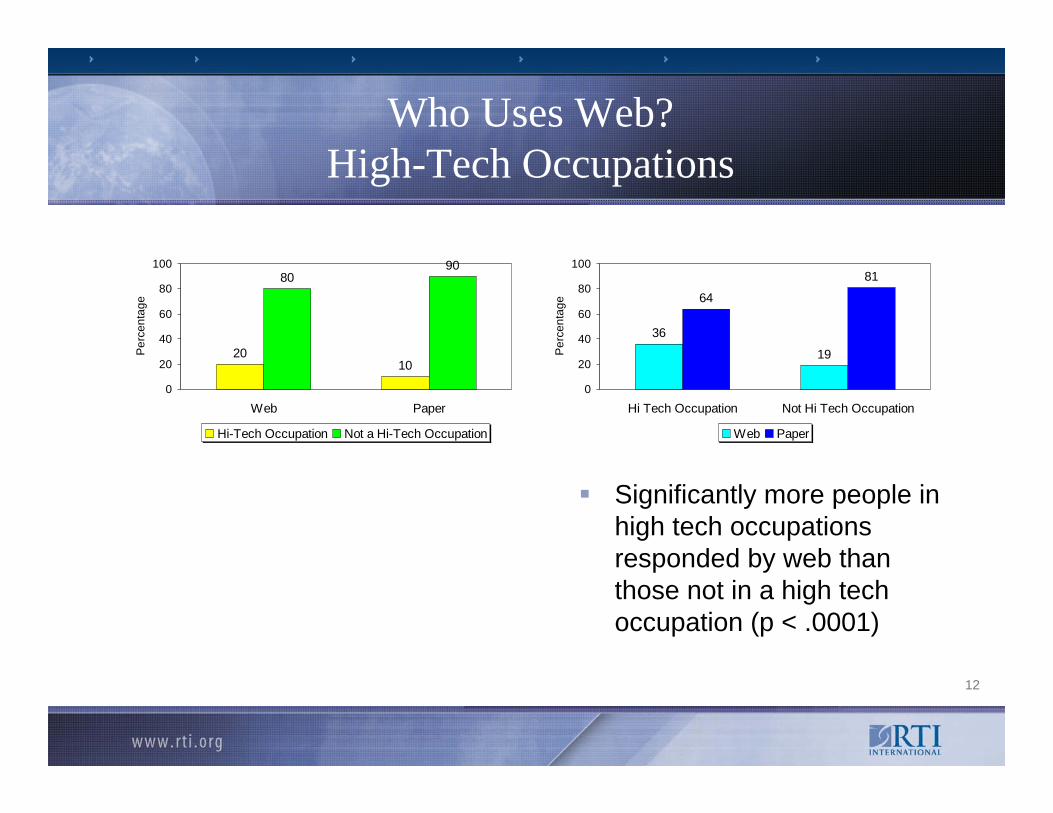
Who Uses Web?High-Tech Occupations
2010
8090
0
20
40
60
80
100
Web Paper
Per
cent
age
Hi-Tech Occupation Not a Hi-Tech Occupation
36
19
64
81
0
20
40
60
80
100
Hi Tech Occupation Not Hi Tech Occupation
Per
cent
age
Web Paper
Significantly more people in high tech occupations responded by web than those not in a high tech occupation (p < .0001)
13
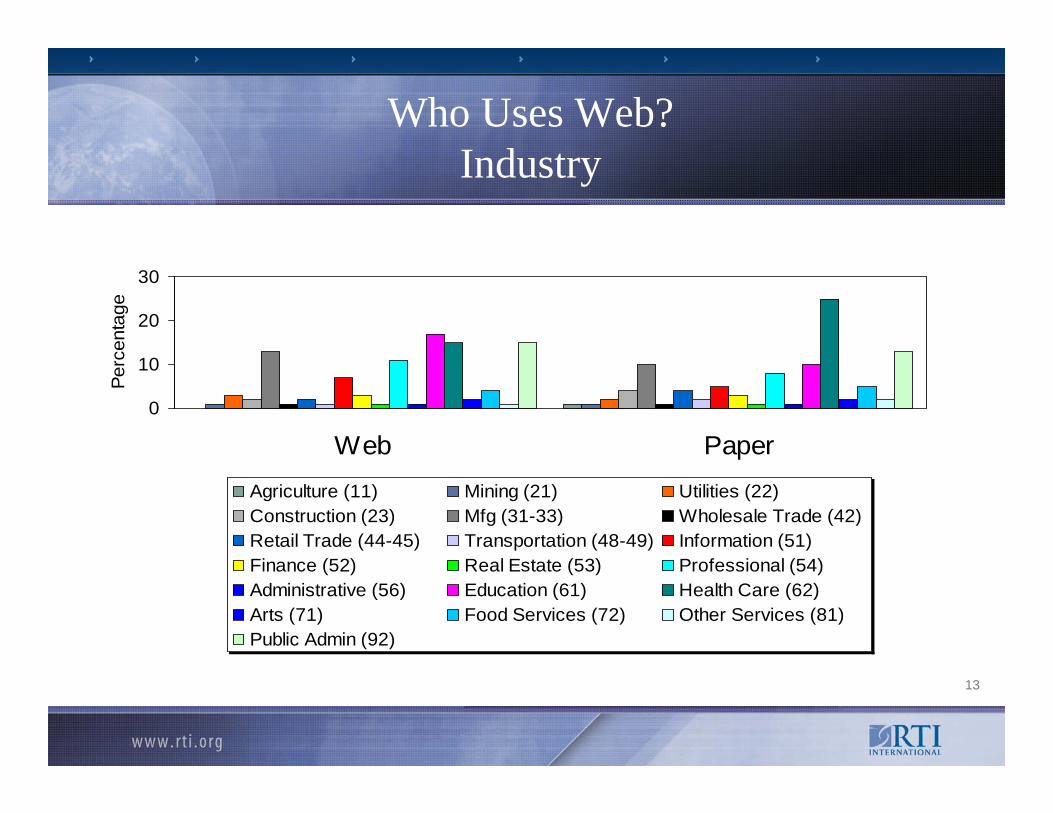
Who Uses Web?Industry
0
10
20
30
Web Paper
Perc
enta
ge
Agriculture (11) Mining (21) Utilities (22)Construction (23) Mfg (31-33) Wholesale Trade (42)Retail Trade (44-45) Transportation (48-49) Information (51)Finance (52) Real Estate (53) Professional (54)Administrative (56) Education (61) Health Care (62)Arts (71) Food Services (72) Other Services (81)Public Admin (92)
14
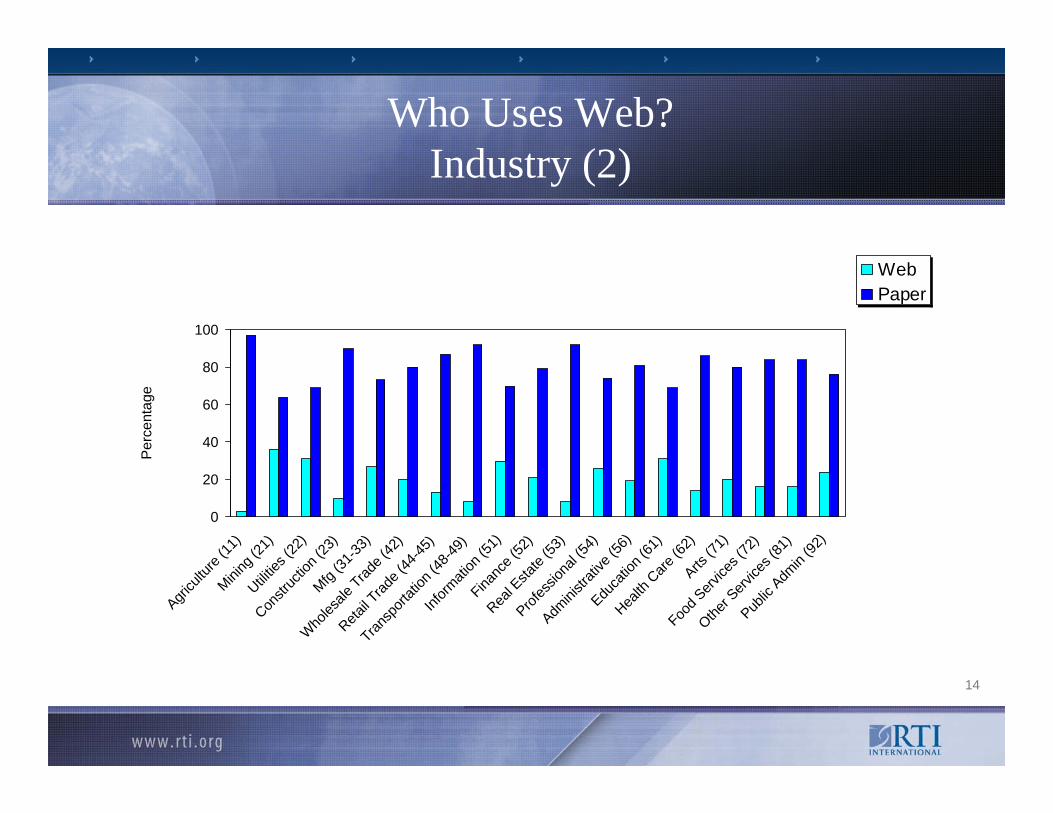
Who Uses Web?Industry (2)
0
20
40
60
80
100
Agricu
lture
(11)
Mining
(21)
Utilitie
s (22
)
Constr
uctio
n (23
)Mfg
(31-33
)
Who
lesale
Trade (
42)
Retail T
rade (
44-45
)
Transp
ortati
on (4
8-49)
Inform
ation
(51)
Financ
e (52
)
Real E
state
(53)
Profes
siona
l (54)
Admini
strati
ve (5
6)
Educa
tion (
61)
Health
Care
(62)
Arts (7
1)
Food S
ervice
s (72
)
Other S
ervice
s (81
)
Public
Adm
in (92
)
Per
cent
age
Web Paper
15
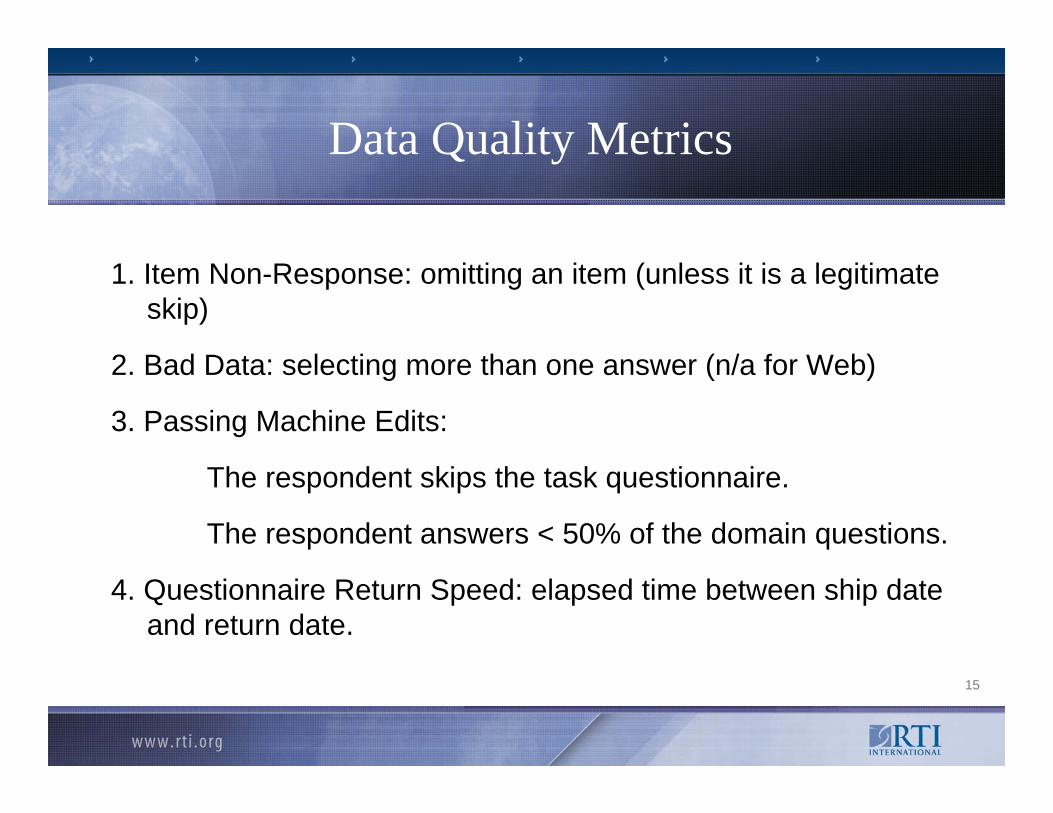
Data Quality Metrics
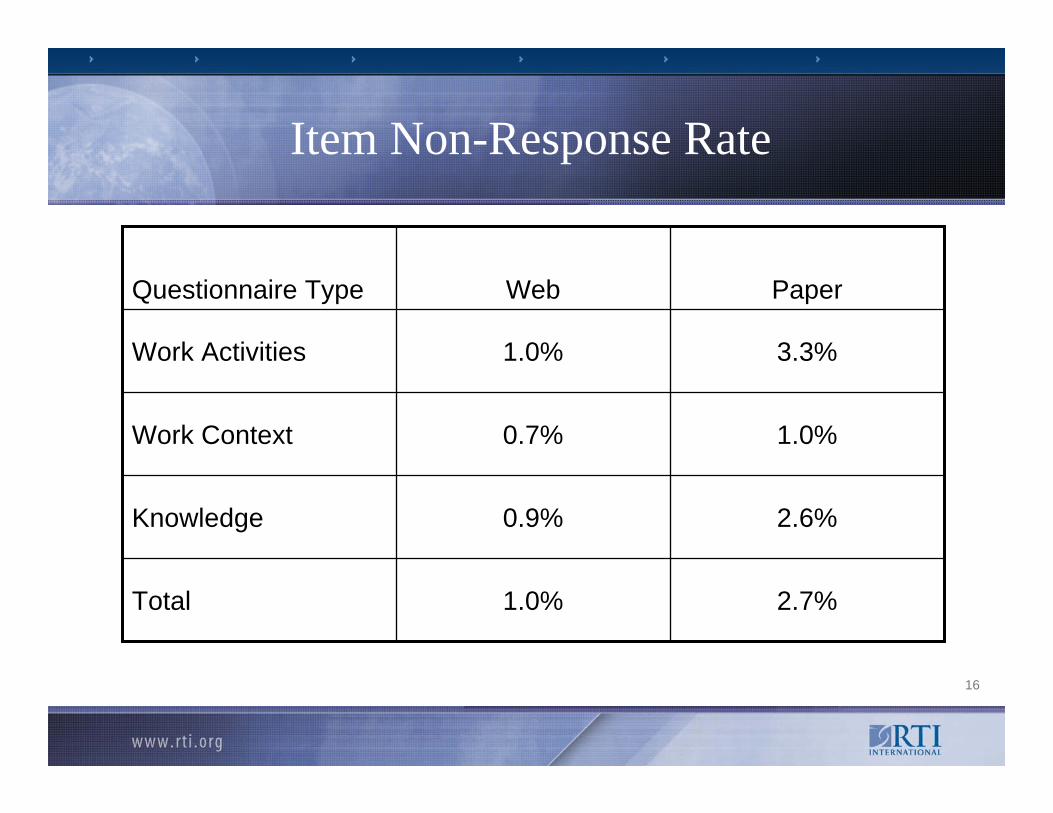
1. Item Non-Response: omitting an item (unless it is a legitimate skip)
2. Bad Data: selecting more than one answer (n/a for Web)
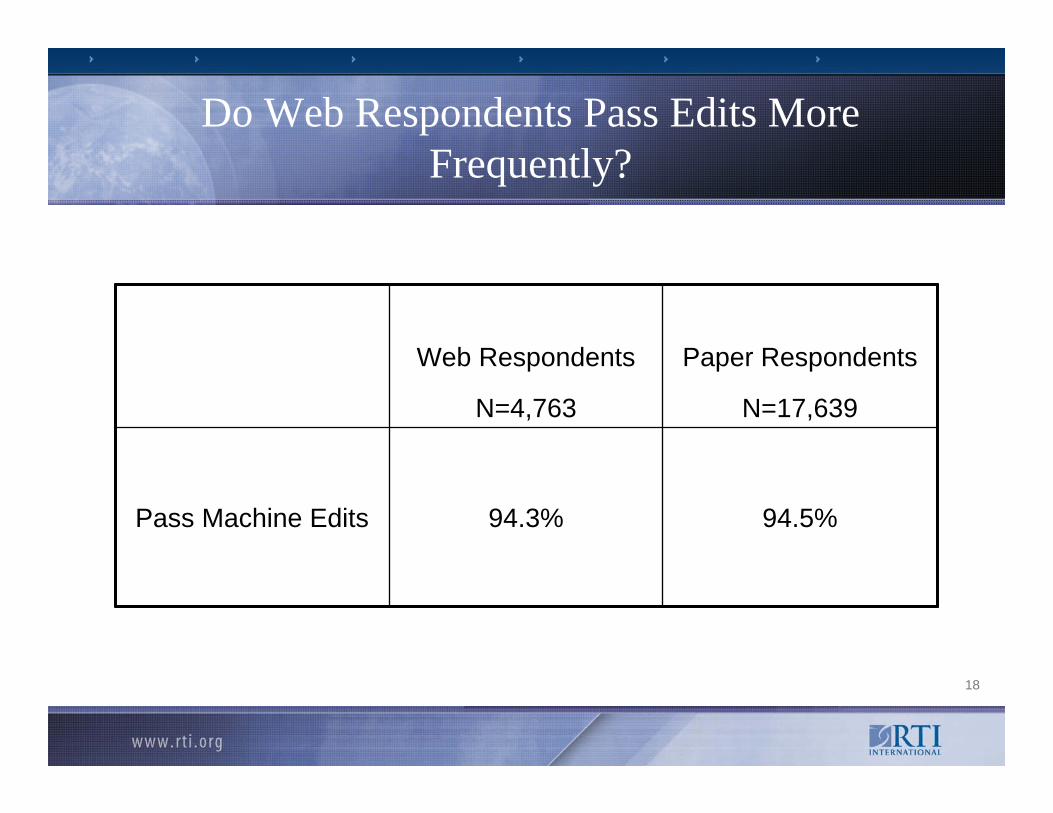
3. Passing Machine Edits:
The respondent skips the task questionnaire.
The respondent answers < 50% of the domain questions.
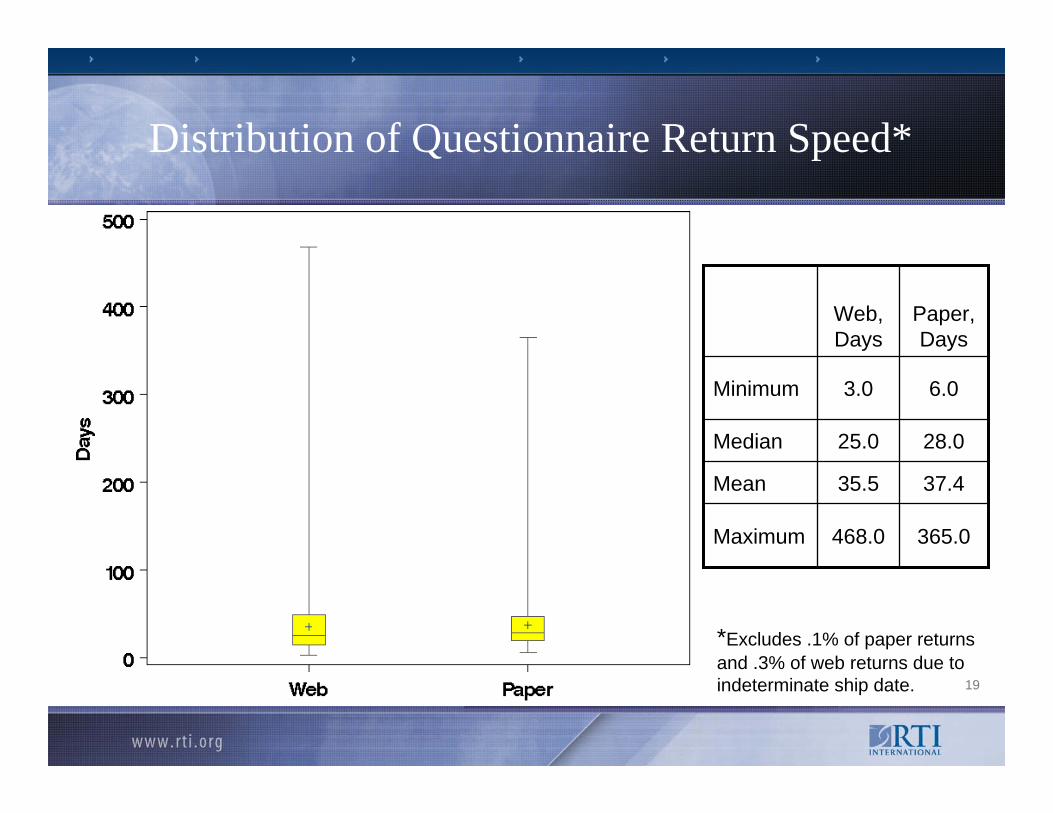
4. Questionnaire Return Speed: elapsed time between ship date and return date.
16
Item Non-Response Rate
1.0%
0.9%
0.7%
1.0%
Web
2.7%
2.6%
1.0%
3.3%
Paper
Total
Knowledge
Work Context
Work Activities
Questionnaire Type

17
Item Bad Data Rate
0%
0%
0%
0%
Web
0.07%
0.05%
0.06%
0.05%
Paper
Total
Knowledge
Work Context
Work Activities
Questionnaire Type
18
Do Web Respondents Pass Edits More Frequently?
94.5%94.3%Pass Machine Edits
Paper Respondents
N=17,639
Web Respondents
N=4,763
19
Distribution of Questionnaire Return Speed*
365.0468.0Maximum
37.435.5Mean
28.025.0Median
6.03.0Minimum
Paper, Days
Web, Days
*Excludes .1% of paper returns and .3% of web returns due to indeterminate ship date.
20
Conclusions/Implications
There is a correlation between certain populations and their propensity to respond via Web.
Data coming in from the Web option seems to be of better overall quality (fewer stand-alone incidences of missing data and no potential for bad data) than its paper counterpart. More data is needed on the impact of Web respondents skipping the Task Questionnaire.
Return speed is statistically significant, but may be not practically significant (does the cost savings on shipping & data entry outweigh the costs of programming a Web survey?).
21
Limitations
Observational study rather than experimental design
Percentages presented are unweighted, so we can make assumptions regarding our sample, but not to the general population.
Study design does not allow for contact with employees completing questionnaires.
Paper and pencil version of questionnaire is sent up front to all sampled employees.
Self addressed stamped envelope is included with the questionnaire shipment.
22
Future Directions
Experimental study: Compare response rates of three sample groups for a particular occupation:
only paperonly web instructionsBoth paper and web instructions.
Analyze trade off between cost savings of using a Web survey and potentially lower response rates
Determine feasibility of targeting a particular occupation with a specific questionnaire completion mode.
Conduct more elaborate analysis of data quality between Web and paper, including trends by occupation.
23
References
Fox, J., Mockovak, W., Fisher, S., & Rho, C. (2003). Usability Issues Associated with Converting Establishment Surveys to Web-Based Data Collection. Office of Survey Methods Research, Bureau of Labor Statistics Statistical Survey Papers.
Kilcoyne, Patrick (2001). High-Tech Occupations by Metropolitan Statistical Area.Bureau of Labor Statistics: Occupational Employment and Wages, 2001. Bulletin 2559. June 2003.
Leece, P., Bhandari, M., Sprague, S., Swiontkowski, M., Schemitsch, E., Tornetta, P., Devereaux, P., & Guyatt, G. (2004). Internet Versus Mailed Questionnaires: A Controlled Comparison. Journal of Medical Internet Research, 6 (4).
Miller, E., Neal, D., Roberts, L., Baer, J., Cressler, S., Metrik, J., & Marlatt, G. (2002). Test-Retest Reliability of Alcohol Measures: Is There a Difference Between Internet-Based Assessment and Traditional Methods? Psychology of Addictive Behaviors, 16 (1).
Schmidt, W. (1997). World-Wide Web Survey Research: Benefits, Potential Problems, and Solutions. Behavior Research Methods, Instruments and Computers, 29 (2).

24
Contact Information
Sarah J. Harris
Phone: 919-541-7486
E-Mail: [email protected]
www.rti.org/aapor


![Response to Intervention (RtI) Handbook and RtI Resources · 2016-12-09 · OASD RtI Handbook [2] Response to Intervention (RtI) Overview Core Principles of RtI RtI is grounded in](https://img.pdfslide.net/doc/110x75/5f04175d7e708231d40c46b9/response-to-intervention-rti-handbook-and-rti-resources-2016-12-09-oasd-rti.jpg)


![Establishment Section [As on 7.4.2015] Suo Motu ... Establishment Section [As on 7.4.2015] Suo Motu Disclosure under RTI Act, 2005 Ministry of Culture Item No.IV:- Allocation of work](https://img.pdfslide.net/doc/110x75/5ab9e7257f8b9ac60e8e9a80/establishment-section-as-on-742015-suo-motu-establishment-section-as-on.jpg)