Embed Size (px)
Citation preview
Name: ________________________________ Per. _______ Date: _____________________
AICE Marine – Unit 7 Test Questions/ Study Guide
1. (a) Explain how an area of low pressure develops into a tropical cyclone.________________________________________________________________________________________________________________________________________________________________________________________________________________________________________________________________________________________________________________________________________________________________________________________________________________________________________________________________________________________________________________________________________________________________________________________________________________ [5]
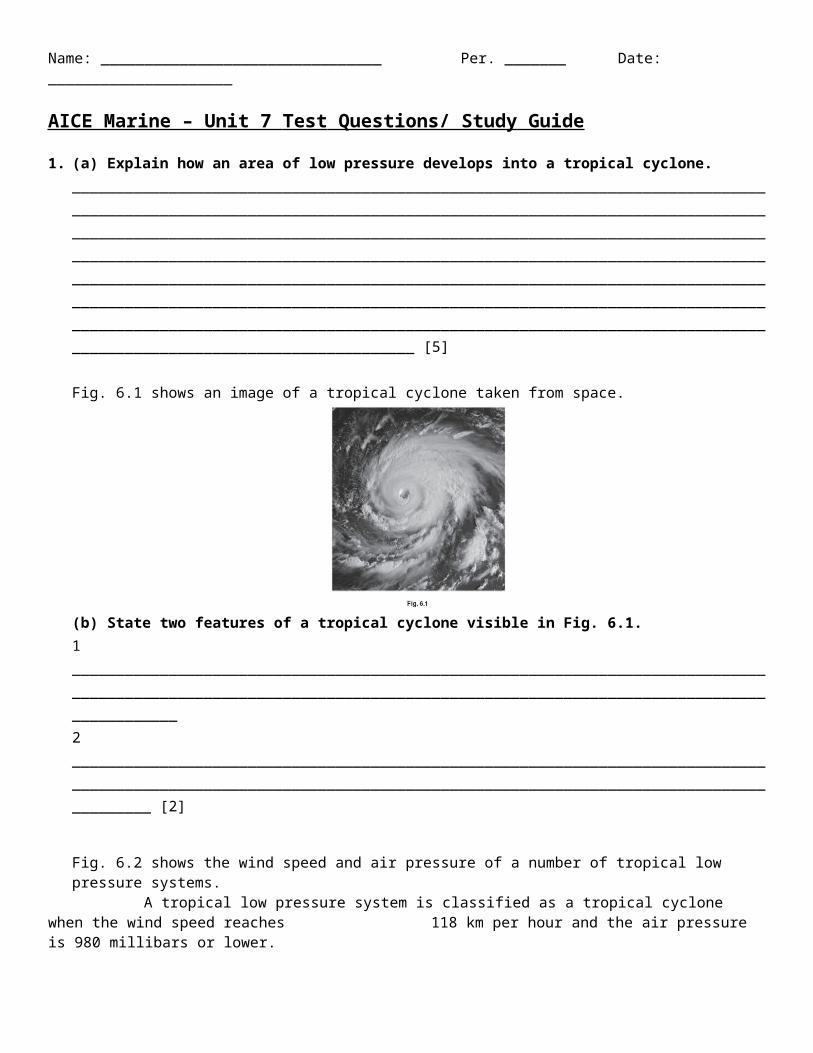
Fig. 6.1 shows an image of a tropical cyclone taken from space.
(b) State two features of a tropical cyclone visible in Fig. 6.1.1 __________________________________________________________________________________________________________________________________________________________________________2 _______________________________________________________________________________________________________________________________________________________________________ [2]
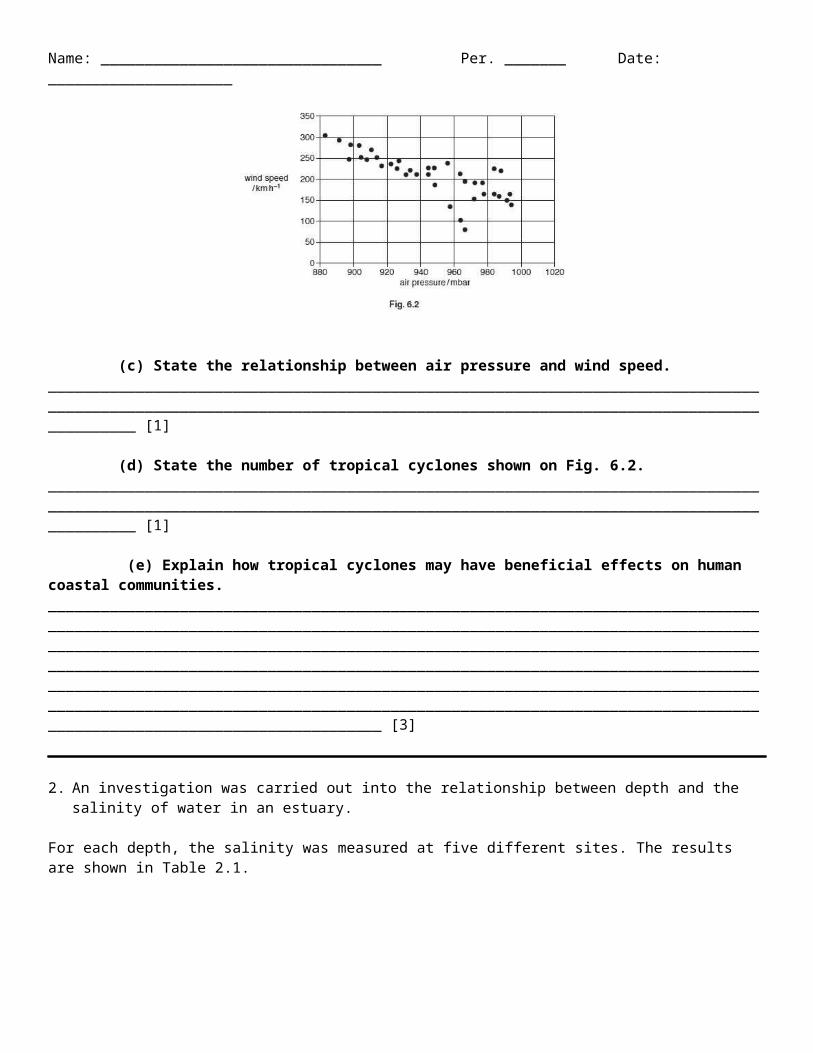
Fig. 6.2 shows the wind speed and air pressure of a number of tropical low pressure systems.A tropical low pressure system is classified as a tropical cyclone when the wind speed reaches
118 km per hour and the air pressure is 980 millibars or lower.
Name: ________________________________ Per. _______ Date: _____________________
(c) State the relationship between air pressure and wind speed.____________________________________________________________________________________________________________________________________________________________________________ [1]
(d) State the number of tropical cyclones shown on Fig. 6.2.____________________________________________________________________________________________________________________________________________________________________________ [1]
(e) Explain how tropical cyclones may have beneficial effects on human coastal communities.____________________________________________________________________________________________________________________________________________________________________________________________________________________________________________________________________________________________________________________________________________________________________________________________________________________________________________________________________________________________________________________________________________ [3]
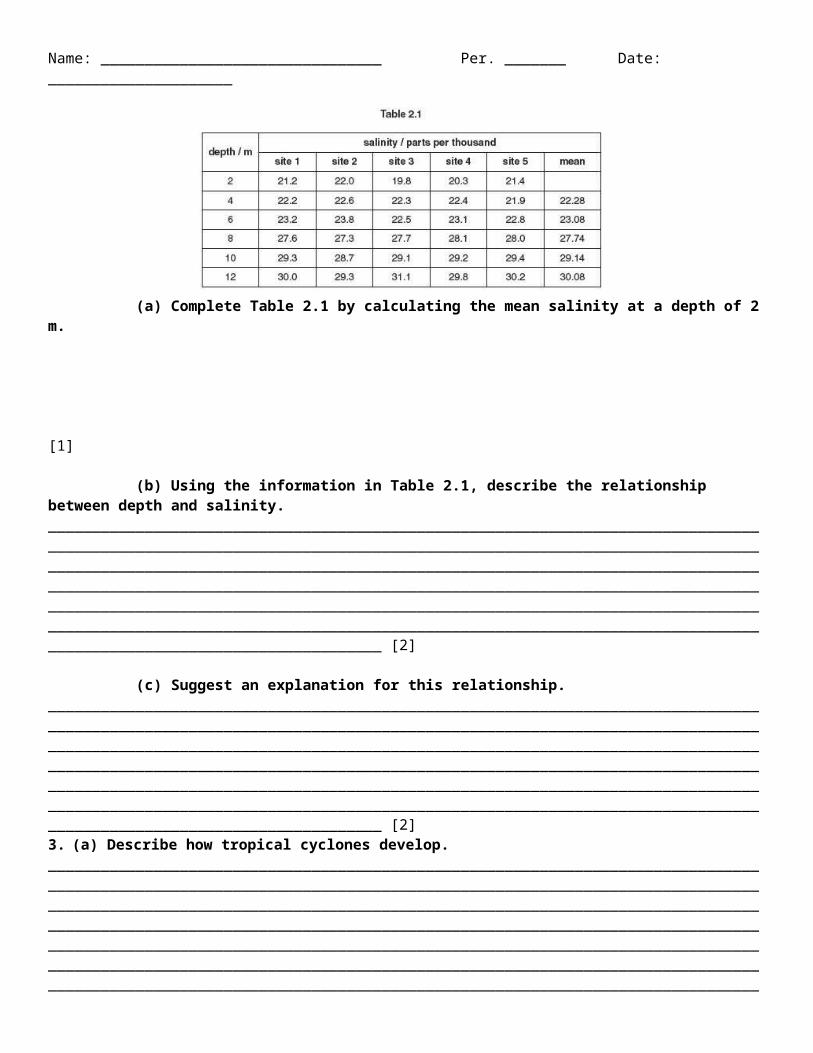
2. An investigation was carried out into the relationship between depth and the salinity of water in an estuary.
For each depth, the salinity was measured at five different sites. The results are shown in Table 2.1.
(a) Complete Table 2.1 by calculating the mean salinity at a depth of 2 m.
[1]
(b) Using the information in Table 2.1, describe the relationship between depth and salinity.____________________________________________________________________________________________________________________________________________________________________________________________________________________________________________________________________________________________________________________________________________________________________________________________________________________________________________________________________________________________________________________________________________ [2]
(c) Suggest an explanation for this relationship.____________________________________________________________________________________________________________________________________________________________________________________________________________________________________________________________________________________________________________________________________________________________________________________________________________________________________________________________________________________________________________________________________________ [2]
Name: ________________________________ Per. _______ Date: _____________________
3. (a) Describe how tropical cyclones develop._____________________________________________________________________________________________________________________________________________________________________________________________________________________________________________________________________________________________________________________________________________________________________________________________________________________________________________________________________________________________________________________________________________________________________________________________________________________________________________________________________________________________________________________________ [4]
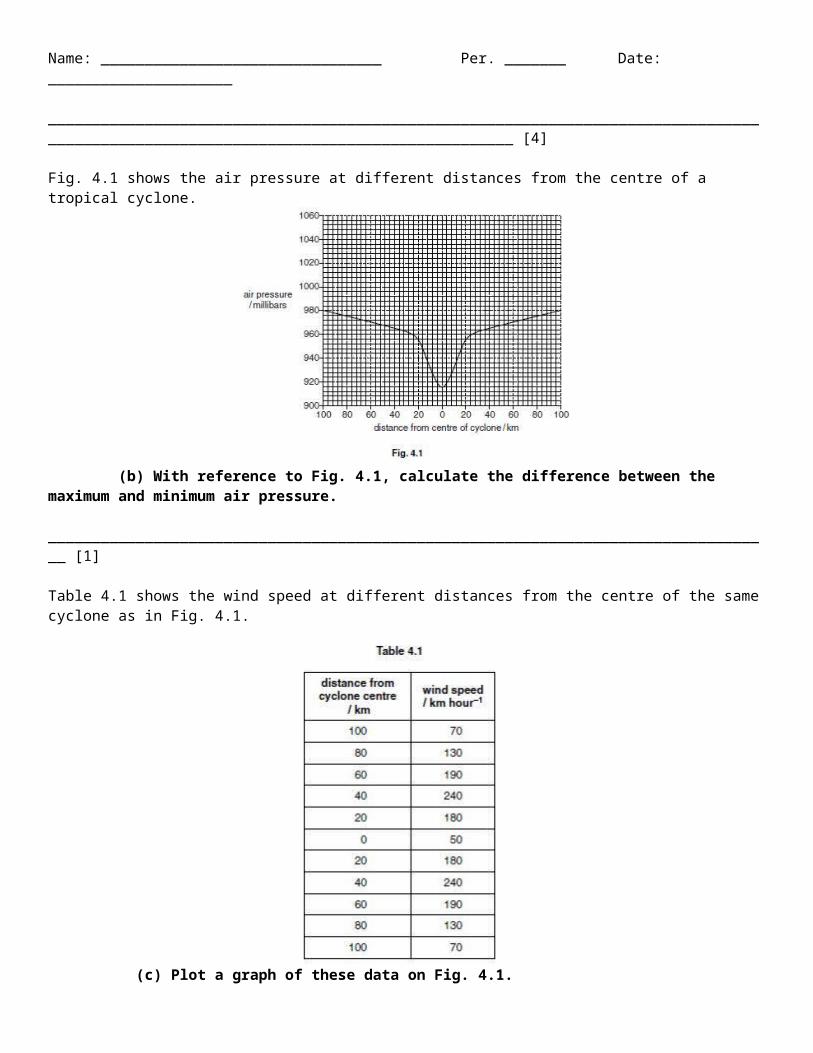
Fig. 4.1 shows the air pressure at different distances from the centre of a tropical cyclone.
(b) With reference to Fig. 4.1, calculate the difference between the maximum and minimum air pressure.
___________________________________________________________________________________ [1]
Table 4.1 shows the wind speed at different distances from the centre of the same cyclone as in Fig. 4.1.
(c) Plot a graph of these data on Fig. 4.1.Use the right-hand y-axis for your scale. [4]
Name: ________________________________ Per. _______ Date: _____________________
(d) State the relationship between wind speed and distance from the centre of a cyclone.Suggest an explanation for this relationship.
relationship ________________________________________________________________________________________________________________________________________________________________________________
explanation ____________________________________________________________________________________________________________________________________________________________________________________________________________________________________________________________________ [3]
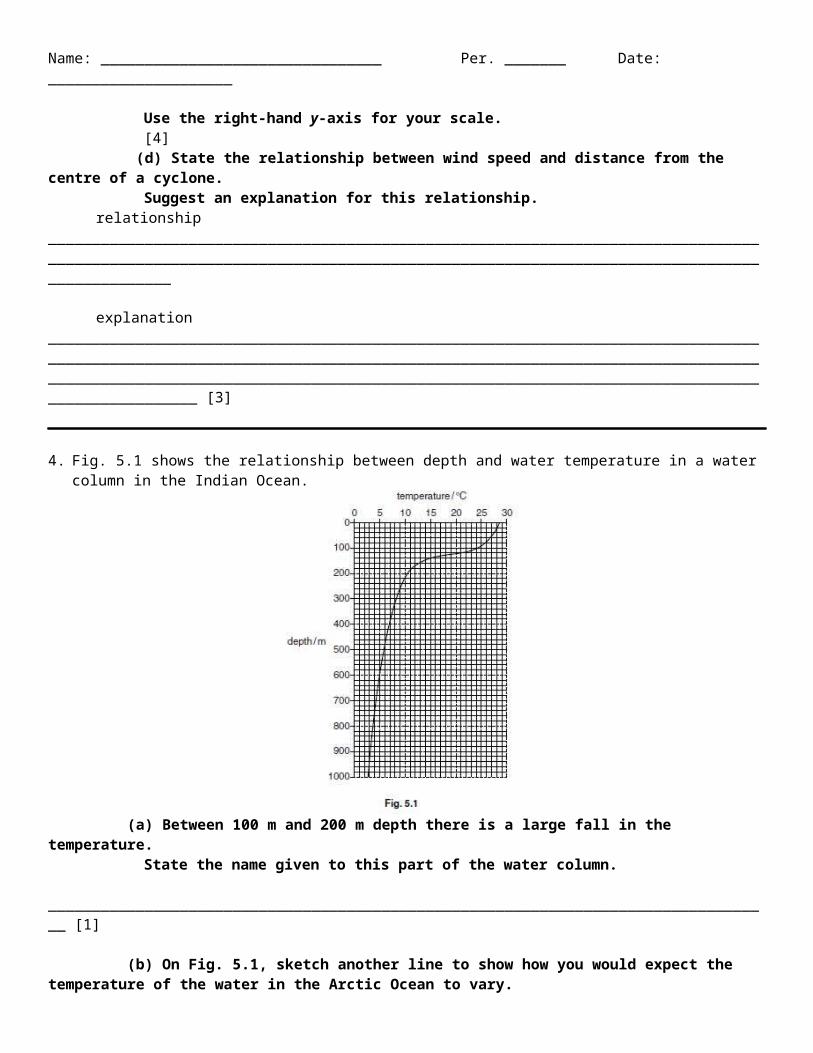
4. Fig. 5.1 shows the relationship between depth and water temperature in a water column in the Indian Ocean.
(a) Between 100 m and 200 m depth there is a large fall in the temperature.State the name given to this part of the water column.
___________________________________________________________________________________ [1]
(b) On Fig. 5.1, sketch another line to show how you would expect the temperature of the water in the Arctic Ocean to vary.
[2]
(c) The density of sea water varies with depth.On Fig. 5.1, label with a line and the letter D, the position where the sea water has the greatest
density. State a reason for your choice. ___________________________________________________________________________________________________________________________________________________________________________________________________________________________________________________________________________________________________________________________________________________________ [2]
(d) State two factors that decrease the salinity of sea water.
Name: ________________________________ Per. _______ Date: _____________________
1 __________________________________________________________________________________________________________________________________________________________________________2 _______________________________________________________________________________________________________________________________________________________________________ [2]
(e) Explain why the dissolved oxygen concentration varies in the surface waters of the oceans._____________________________________________________________________________________________________________________________________________________________________________________________________________________________________________________________________________________________________________________________________________________________________________________________________________________________________________________________________________________________________________________________________________ [3]
5. (a) Outline the effects of evaporation and precipitation on the salinity of sea water._____________________________________________________________________________________________________________________________________________________________________________________________________________________________________________________________________________________________________________________________________________________________________________________________________________________________________________________________________________________________________________________________________________ [2]
(b) Describe how salinity gradients form in water columns._____________________________________________________________________________________________________________________________________________________________________________________________________________________________________________________________________________________________________________________________________________________________________________________________________________________________________________________________________________________________________________________________________________ [3]
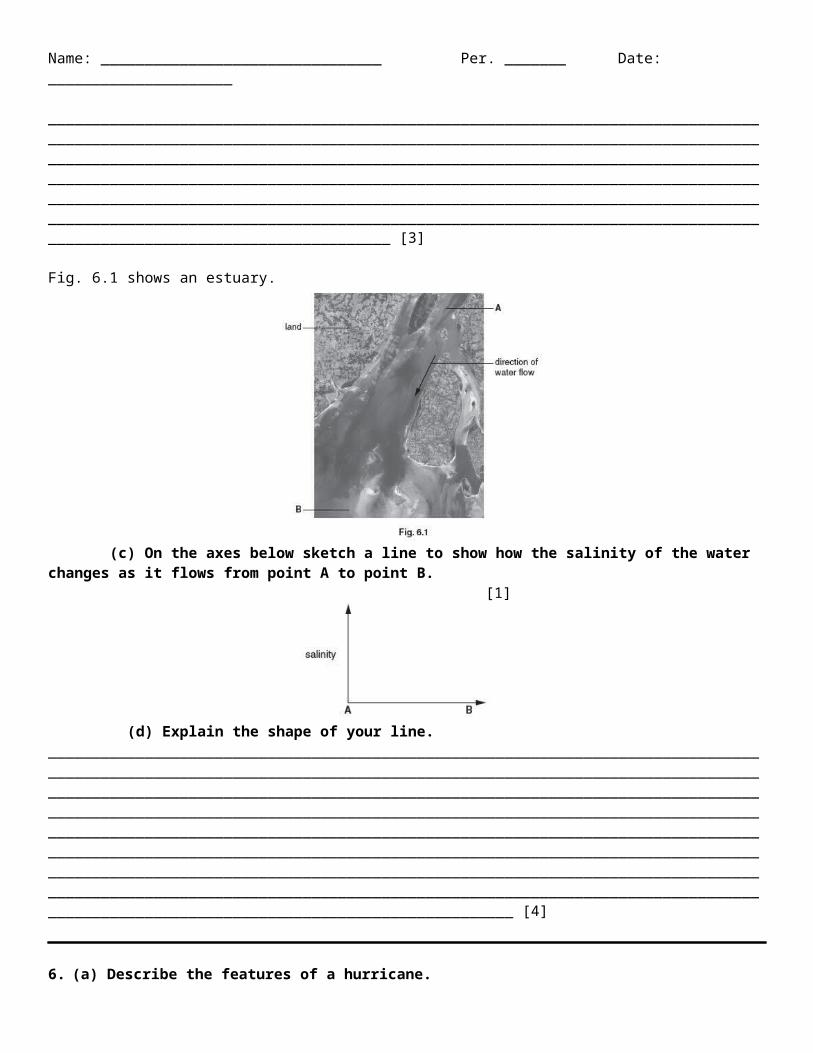
Fig. 6.1 shows an estuary.
(c) On the axes below sketch a line to show how the salinity of the water changes as it flows from point A to point B. [1]
Name: ________________________________ Per. _______ Date: _____________________
(d) Explain the shape of your line._____________________________________________________________________________________________________________________________________________________________________________________________________________________________________________________________________________________________________________________________________________________________________________________________________________________________________________________________________________________________________________________________________________________________________________________________________________________________________________________________________________________________________________________________ [4]
6. (a) Describe the features of a hurricane._____________________________________________________________________________________________________________________________________________________________________________________________________________________________________________________________________________________________________________________________________________________________________________________________________________________________________________________________________________________________________________________________________________________________________________________________________________________________________________________________________________________________________________________________ [4]
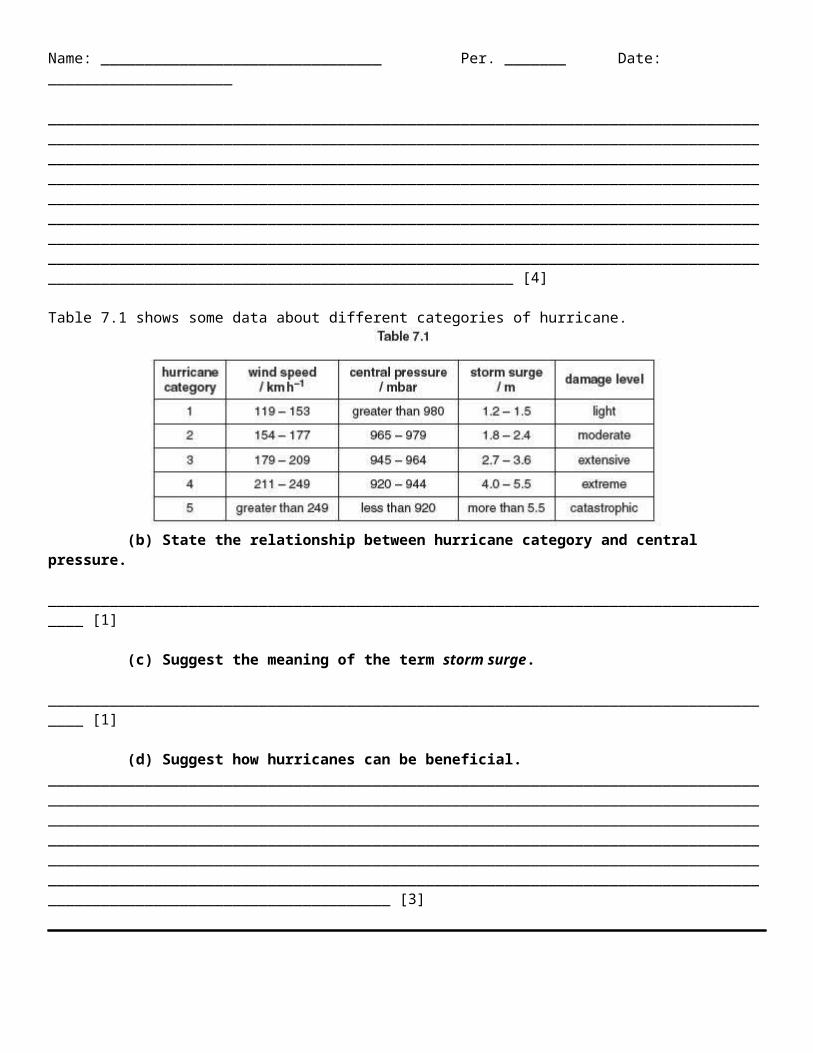
Table 7.1 shows some data about different categories of hurricane.
(b) State the relationship between hurricane category and central pressure.
_____________________________________________________________________________________ [1]
(c) Suggest the meaning of the term storm surge.
_____________________________________________________________________________________ [1]
(d) Suggest how hurricanes can be beneficial.________________________________________________________________________________________________________________________________________________________________________________________________________________________________________________________________________________________________________________________________________________________________
Name: ________________________________ Per. _______ Date: _____________________
_____________________________________________________________________________________________________________________________________________________________________________ [3]
7. (a) Describe how temperature and salinity gradients form in the oceans._____________________________________________________________________________________________________________________________________________________________________________________________________________________________________________________________________________________________________________________________________________________________________________________________________________________________________________________________________________________________________________________________________________________________________________________________________________________________________________________________________________________________________________________________________________________________________________________________________________________________________________________________________________________________________________________________________________________________________________________________________________________________________________________________________________________________ [6]
(b) The concentration of dissolved oxygen in sea water varies.Suggest and explain what effect each of the following would have on the concentration of dissolved oxygen:
an increase in wave action _____________________________________________________________________________________________________________________________________________________________________________ [2]
an increase in the temperature of water in a shallow lagoon_____________________________________________________________________________________________________________________________________________________________________________ [2]
(c) Explain why India may experience heavy rainfall during the months of June until September._____________________________________________________________________________________________________________________________________________________________________________________________________________________________________________________________________________________________________________________________________________________________________________________________________________________________________________________________________________________________________________________________________________________________________________________________________________________________________________________________________________________________________________________________________________________________________________________________________________________________________________________________________________________________________________________________________________________________________________________________________________________________________________________________________________________________ [5]
Name: ________________________________ Per. _______ Date: _____________________
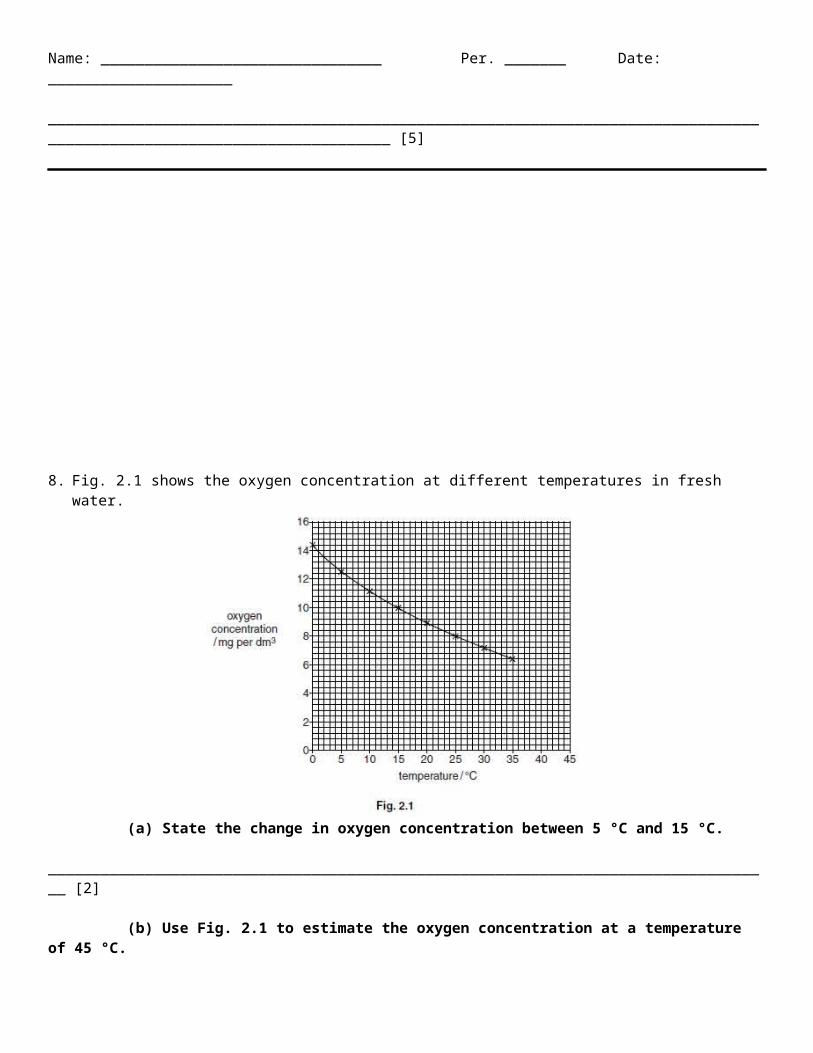
8. Fig. 2.1 shows the oxygen concentration at different temperatures in fresh water.
(a) State the change in oxygen concentration between 5 °C and 15 °C.
___________________________________________________________________________________ [2]
(b) Use Fig. 2.1 to estimate the oxygen concentration at a temperature of 45 °C.
___________________________________________________________________________________ [1]
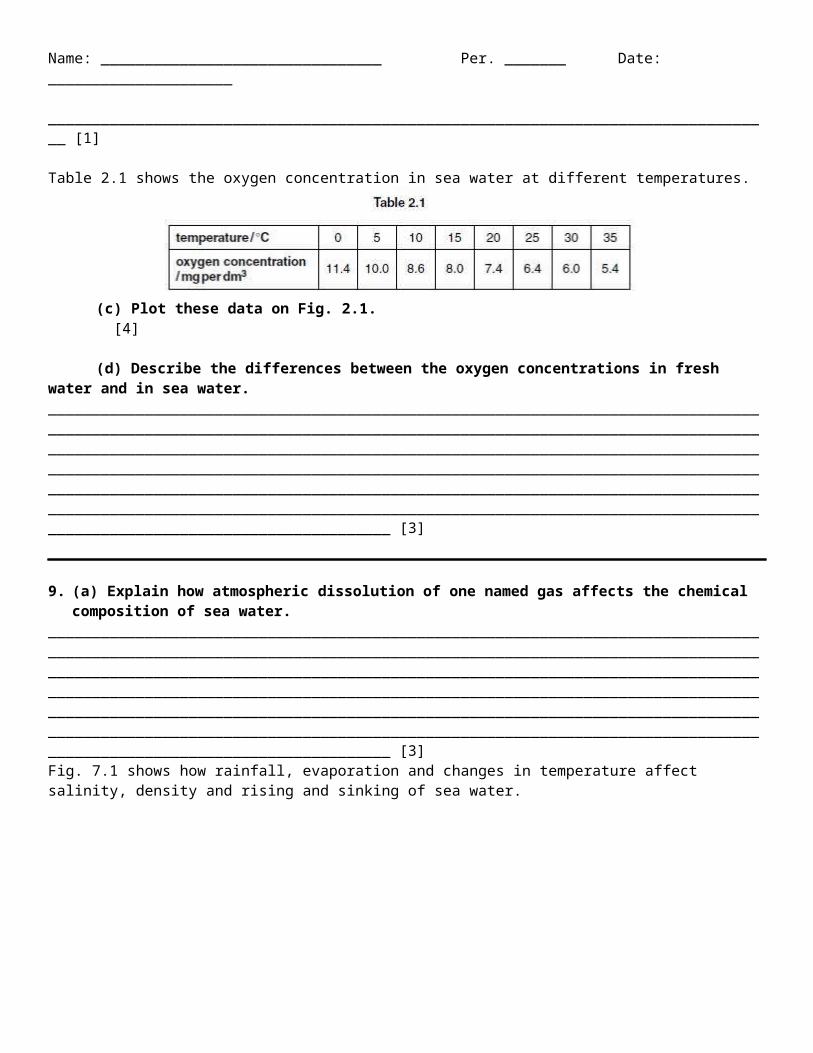
Table 2.1 shows the oxygen concentration in sea water at different temperatures.
(c) Plot these data on Fig. 2.1. [4]
(d) Describe the differences between the oxygen concentrations in fresh water and in sea water._____________________________________________________________________________________________________________________________________________________________________________________________________________________________________________________________________________________________________________________________________________________________________________________________________________________________________________________________________________________________________________________________________________ [3]
Name: ________________________________ Per. _______ Date: _____________________
9. (a) Explain how atmospheric dissolution of one named gas affects the chemical composition of sea water.
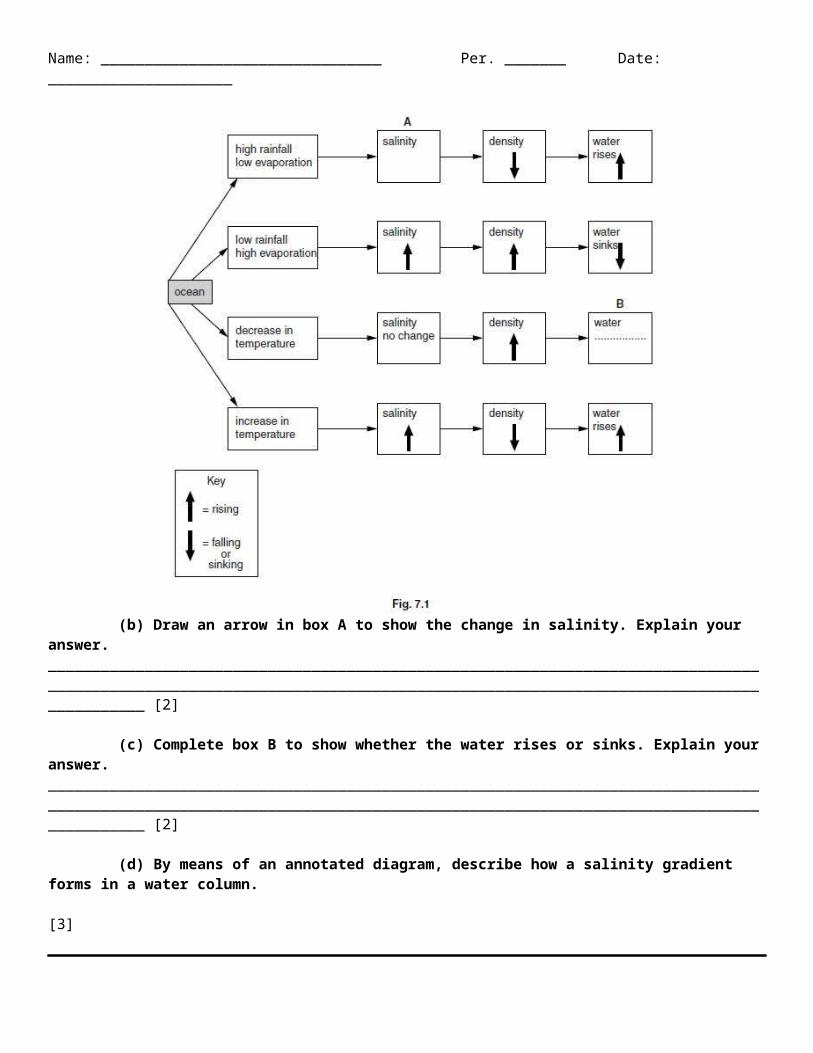
_____________________________________________________________________________________________________________________________________________________________________________________________________________________________________________________________________________________________________________________________________________________________________________________________________________________________________________________________________________________________________________________________________________ [3]Fig. 7.1 shows how rainfall, evaporation and changes in temperature affect salinity, density and rising and sinking of sea water.
(b) Draw an arrow in box A to show the change in salinity. Explain your answer._____________________________________________________________________________________________________________________________________________________________________________ [2]
(c) Complete box B to show whether the water rises or sinks. Explain your answer._____________________________________________________________________________________________________________________________________________________________________________ [2]
(d) By means of an annotated diagram, describe how a salinity gradient forms in a water column. [3]
Name: ________________________________ Per. _______ Date: _____________________
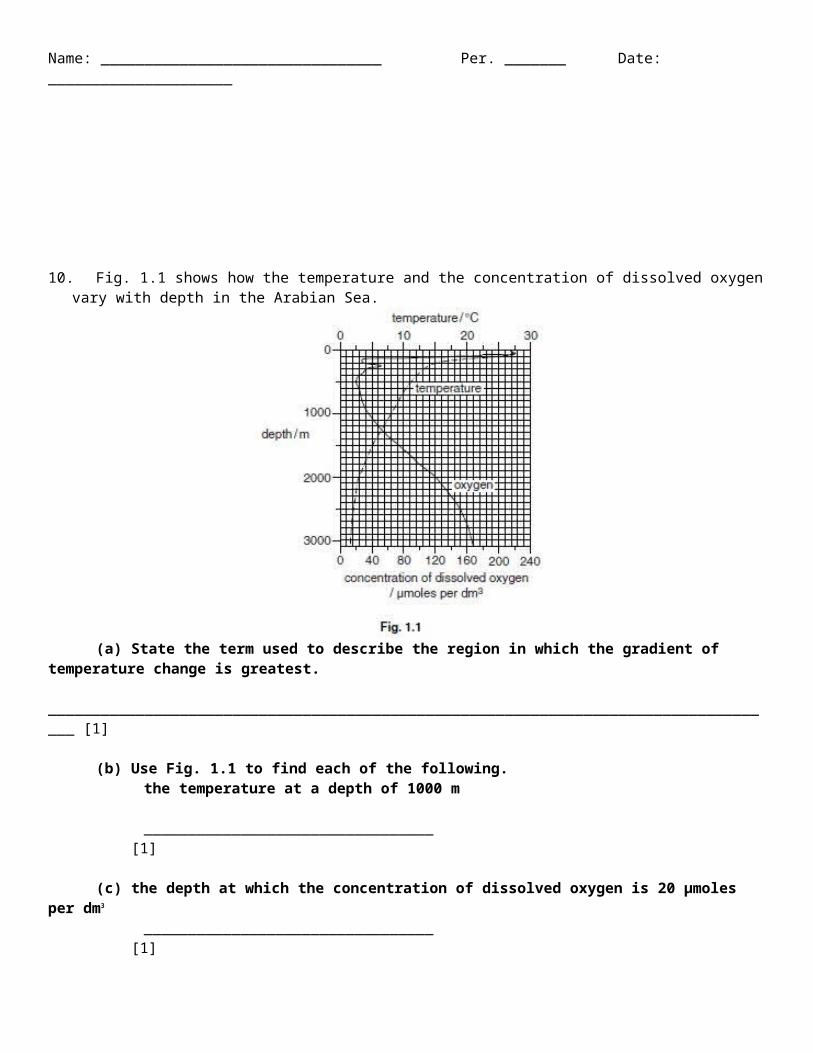
10. Fig. 1.1 shows how the temperature and the concentration of dissolved oxygen vary with depth in the Arabian Sea.
(a) State the term used to describe the region in which the gradient of temperature change is greatest.
____________________________________________________________________________________ [1]
(b) Use Fig. 1.1 to find each of the following.the temperature at a depth of 1000 m
_________________________________ [1]
(c) the depth at which the concentration of dissolved oxygen is 20 μmoles per dm3
_________________________________ [1]
(d) Describe the change in the concentration of dissolved oxygen as the depth increases from 0 m to 100 m. Suggest an explanation for this change._____________________________________________________________________________________________________________________________________________________________________________________________________________________________________________________________________________________________________________________________________________________________________________________________________________________________________________________________________________________________________________________________________________ [3]
11. (a) Explain how the alignment of the Sun and the Moon affect the tidal range.
Name: ________________________________ Per. _______ Date: _____________________
_____________________________________________________________________________________________________________________________________________________________________________________________________________________________________________________________________________________________________________________________________________________________________________________________________________________________________________________________________________________________________________________________________________________________________________________________________________________________________________________________________________________________________________________________________________________________________________________________________________________________________________________________________________________________________________________________________________________________________________________________________________________________________________________________________________________________ [7]
(b) Suggest what effect each of the following would have on the tidal range.a decrease in wind speed
_____________________________________________________________________________________ [1]
an increase in atmospheric pressure _____________________________________________________________________________________ [1]
an increase in the size of a body of water._____________________________________________________________________________________ [1]
(c) Explain how wind and the shape of the sea bed produce ocean currents and upwelling._____________________________________________________________________________________________________________________________________________________________________________________________________________________________________________________________________________________________________________________________________________________________________________________________________________________________________________________________________________________________________________________________________________________________________________________________________________________________________________________________________________________________________________________________________________________________________________________________________________________________________________________________________________________________________________________________________________________________________________________________________________________________________________________________________________________________ [5]
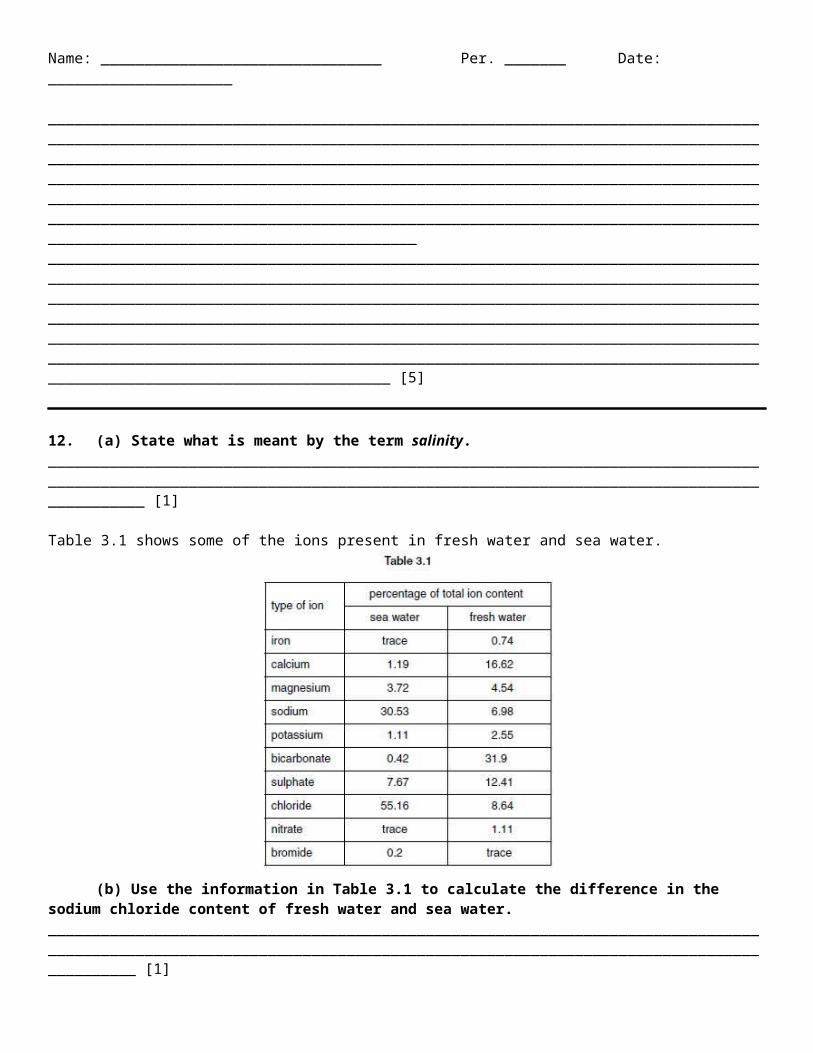
12. (a) State what is meant by the term salinity. _____________________________________________________________________________________________________________________________________________________________________________ [1]
Table 3.1 shows some of the ions present in fresh water and sea water.
Name: ________________________________ Per. _______ Date: _____________________
(b) Use the information in Table 3.1 to calculate the difference in the sodium chloride content of fresh water and sea water. ____________________________________________________________________________________________________________________________________________________________________________ [1]
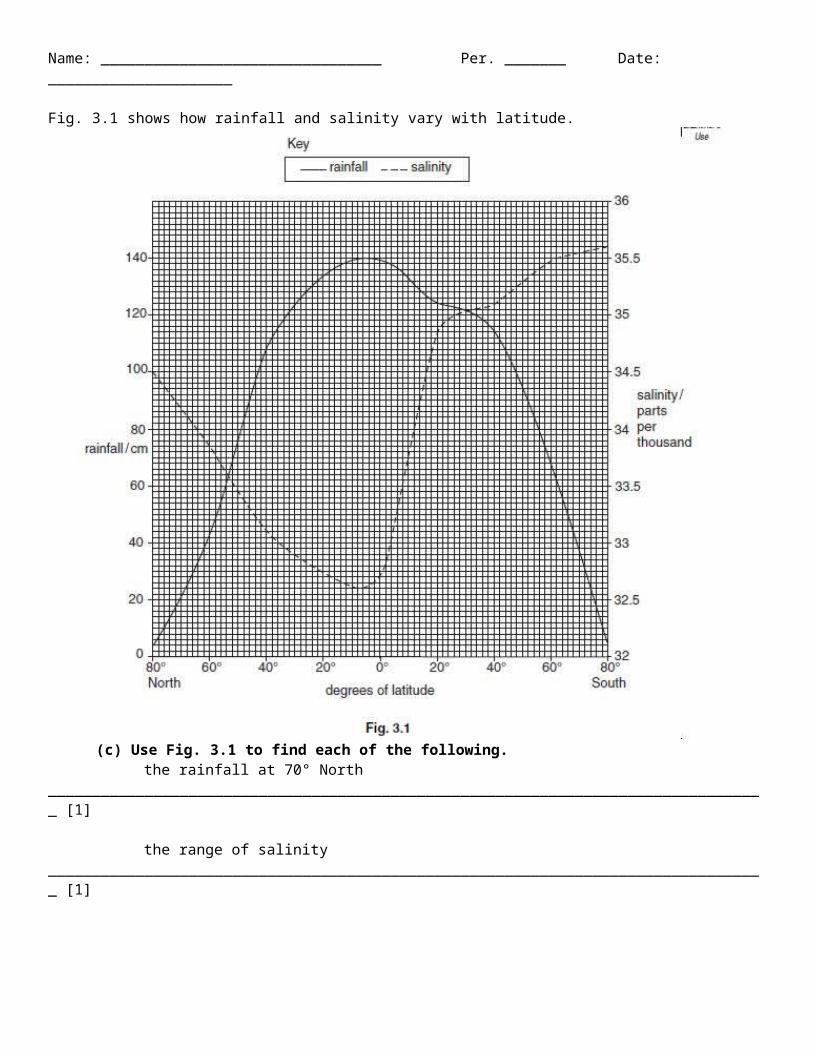
Fig. 3.1 shows how rainfall and salinity vary with latitude.
Name: ________________________________ Per. _______ Date: _____________________
(c) Use Fig. 3.1 to find each of the following.the rainfall at 70° North
__________________________________________________________________________________ [1]
the range of salinity __________________________________________________________________________________ [1]
(d) Describe the changes in salinity between 40° North and 40° South.________________________________________________________________________________________________________________________________________________________________________________________________________________________________________________________________________________________________________________________________________________________________
Name: ________________________________ Per. _______ Date: _____________________
_____________________________________________________________________________________________________________________________________________________________________________ [3]
(e) State the relationship between salinity and rainfall at latitudes 0° to 80° North. _____________________________________________________________________________________________________________________________________________________________________________ [1]
(f) State two factors, other than rainfall, that affect the salinity of seawater.
1______________________________________________________________________________2 ______________________________________________________________________________ [2]
(g) Suggest how global warming may affect the salinity of the oceans. Give an explanation for your answer._____________________________________________________________________________________________________________________________________________________________________________________________________________________________________________________________________________________________________________________________________________________________________________________________________________________________________________________________________________________________________________________________________________ [4]
13. (a) Give two factors required for the development of a tropical cyclone.1______________________________________________________________________________2 ______________________________________________________________________________ [2]
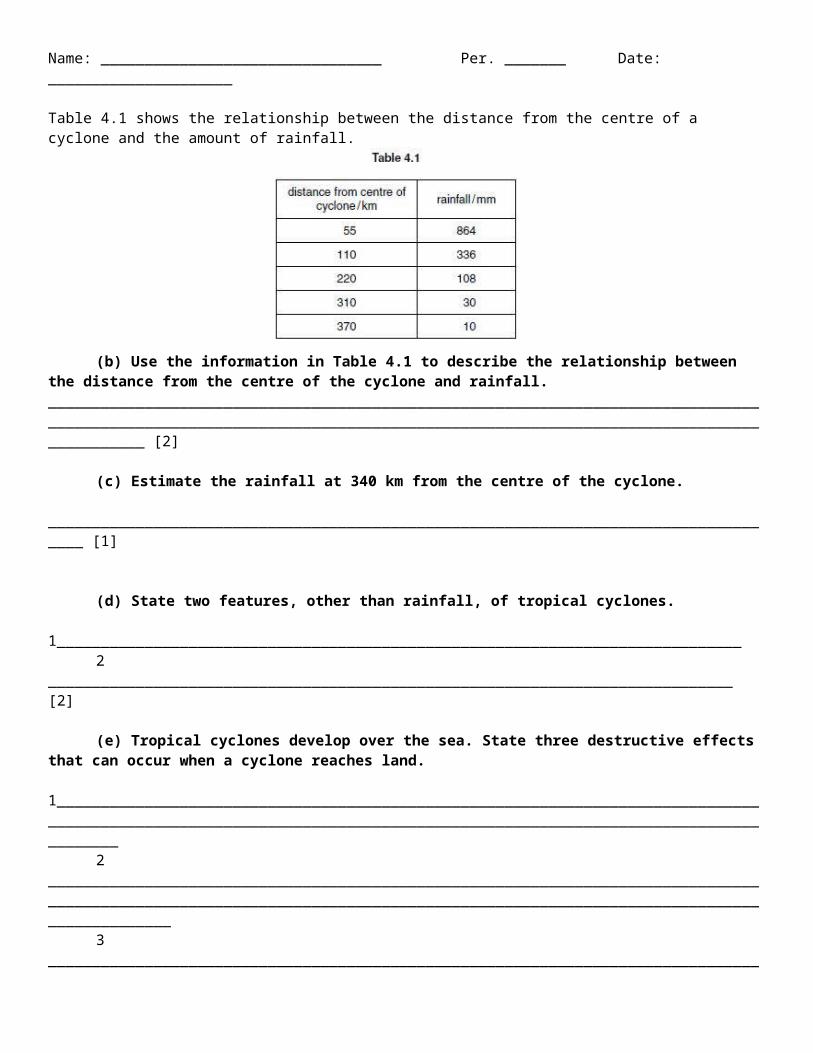
Table 4.1 shows the relationship between the distance from the centre of a cyclone and the amount of rainfall.
(b) Use the information in Table 4.1 to describe the relationship between the distance from the centre of the cyclone and rainfall. _____________________________________________________________________________________________________________________________________________________________________________ [2]
(c) Estimate the rainfall at 340 km from the centre of the cyclone.
_____________________________________________________________________________________ [1]
(d) State two features, other than rainfall, of tropical cyclones.1______________________________________________________________________________2 ______________________________________________________________________________ [2]
Name: ________________________________ Per. _______ Date: _____________________
(e) Tropical cyclones develop over the sea. State three destructive effects that can occur when a cyclone reaches land.
1_________________________________________________________________________________________________________________________________________________________________________
2 ________________________________________________________________________________________________________________________________________________________________________________
3 _____________________________________________________________________________________________________________________________________________________________________________ [3]
(f) Suggest one beneficial effect that may occur when a cyclone reaches land.
_____________________________________________________________________________________ [1]
14. (a) State two biological reasons why the concentration of oxygen in seawater varies.
1_________________________________________________________________________________________________________________________________________________________________________
2 _____________________________________________________________________________________________________________________________________________________________________________ [2]
(b) State three physical reasons why the concentration of oxygen in seawater varies.
1_________________________________________________________________________________________________________________________________________________________________________
2 ________________________________________________________________________________________________________________________________________________________________________________
3 _____________________________________________________________________________________________________________________________________________________________________________ [3]
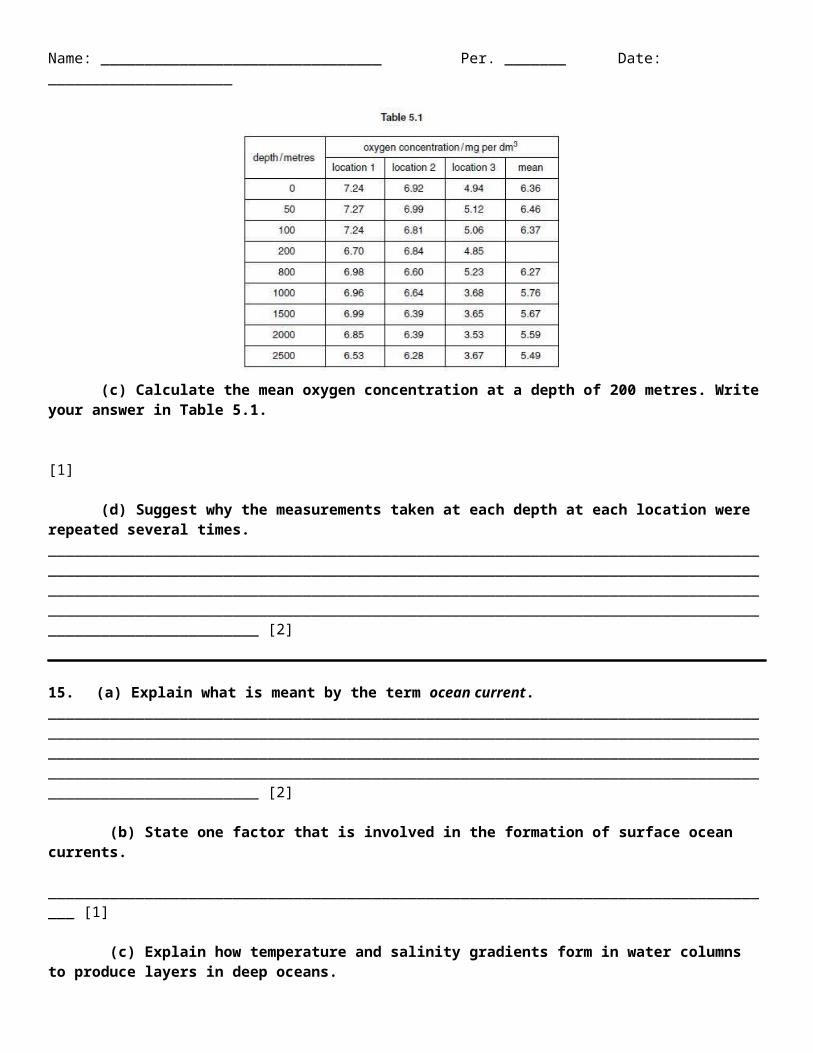
Table 5.1 shows the oxygen concentration at different depths in the sea at three different locations.
Name: ________________________________ Per. _______ Date: _____________________
(c) Calculate the mean oxygen concentration at a depth of 200 metres. Write your answer in Table 5.1.
[1]
(d) Suggest why the measurements taken at each depth at each location were repeated several times. ____________________________________________________________________________________________________________________________________________________________________________________________________________________________________________________________________________________________________________________________________________________________ [2]
15. (a) Explain what is meant by the term ocean current.____________________________________________________________________________________________________________________________________________________________________________________________________________________________________________________________________________________________________________________________________________________________ [2]
(b) State one factor that is involved in the formation of surface ocean currents.
____________________________________________________________________________________ [1]
(c) Explain how temperature and salinity gradients form in water columns to produce layers in deep oceans._____________________________________________________________________________________________________________________________________________________________________________________________________________________________________________________________________________________________________________________________________________________________________________________________________________________________________________________________________________________________________________________________________________ [4]
(d) Explain what is meant by the term upwellings._____________________________________________________________________________________________________________________________________________________________________________________________________________________________________________________________________________________________________________________________________________________________________________________________________________________________________________________________________________________________________________________________________________ [3]
Name: ________________________________ Per. _______ Date: _____________________
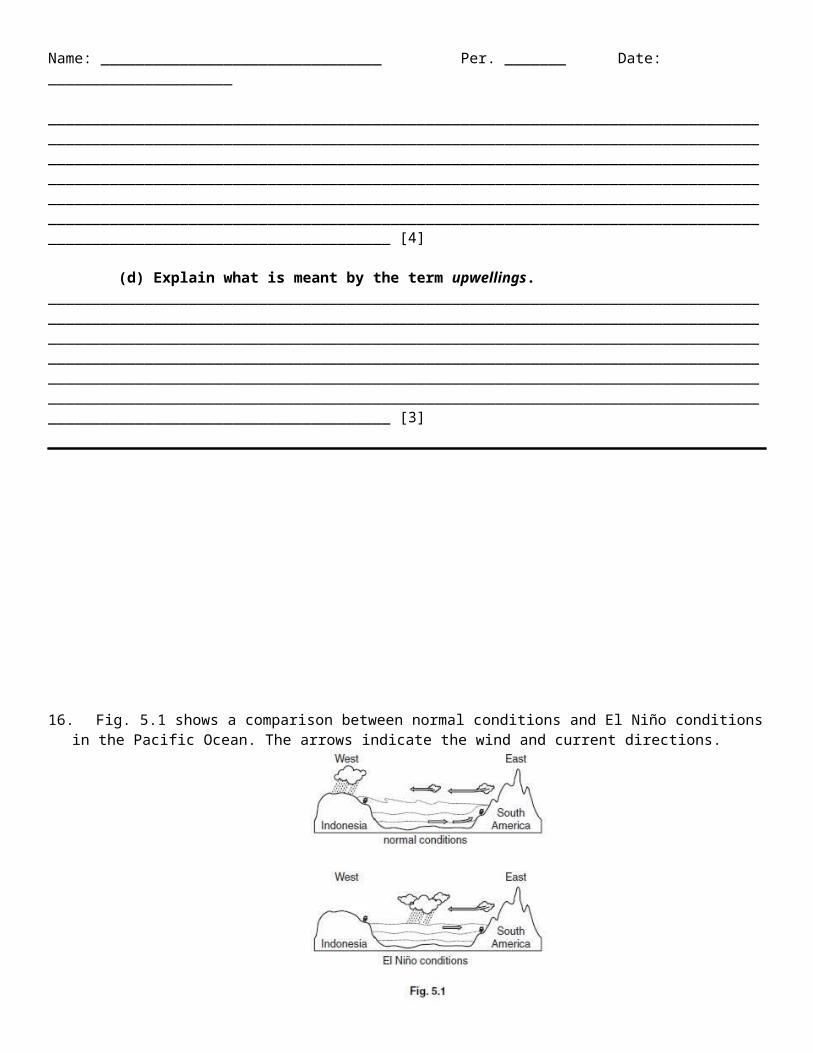
16. Fig. 5.1 shows a comparison between normal conditions and El Niño conditions in the Pacific Ocean. The arrows indicate the wind and current directions.
(a) Use Fig. 5.1 to describe three differences between normal conditions and El Niño conditions.1_________________________________________________________________________________
________________________________________________________________________________________2
________________________________________________________________________________________________________________________________________________________________________________
3 _____________________________________________________________________________________________________________________________________________________________________________ [3]
(b) Explain how El Niño conditions affect the fish populations near the coast of South America._____________________________________________________________________________________________________________________________________________________________________________________________________________________________________________________________________________________________________________________________________________________________________________________________________________________________________________________________________________________________________________________________________________ [3]
(c) In El Niño conditions some parts of the oceans may become warmer than usual. Suggest how this may affect coral growing in these regions._____________________________________________________________________________________________________________________________________________________________________________________________________________________________________________________________________________________________________________________________________________________________________________________________________________________________________________________________________________________________________________________________________________ [3]
Name: ________________________________ Per. _______ Date: _____________________
17. Tropical cyclones are also known as hurricanes and typhoons.(a) State three features of a tropical cyclone.
1_________________________________________________________________________________________________________________________________________________________________________
2 ________________________________________________________________________________________________________________________________________________________________________________
3 _____________________________________________________________________________________________________________________________________________________________________________ [3]
(b) State two conditions necessary for the formation of a tropical cyclone.1_________________________________________________________________________________
________________________________________________________________________________________2
_____________________________________________________________________________________________________________________________________________________________________________ [2]
Fig. 7.1 shows the number of different categories of hurricane from 1970 to 2004 at 5-year intervals.
(c) State the total number of category 4 and 5 hurricanes in the period 1990–1994.
__________________________________________ [1]
(d) Describe the changes in the number of category 4 and 5 hurricanes from 1970 to 1994._____________________________________________________________________________________________________________________________________________________________________________________________________________________________________________________________________________________________________________________________________________________________________________________________________________________________________________________ [2]
Name: ________________________________ Per. _______ Date: _____________________
18. (a) By what other name are tropical cyclones known?
_____________________________________________________________________________________ [1]
Fig. 6.1 shows a section through a tropical cyclone.
(b) State the minimum temperature at A.
____________________________________________________________________________________ [1]
(c) Give the letter of the point at which the winds are strongest.
____________________________________________________________________________________ [1]
(d) Name the process that provides the latent energy for the development of the cyclone.
____________________________________________________________________________________ [1]
(e) State what happens to the air pressure as the air rises from A to D.
____________________________________________________________________________________ [1]
(f) Describe three possible effects of cyclones on coastal communities.
1_________________________________________________________________________________________________________________________________________________________________________________________________________________________________________________________________________________________________________________________________________________________
2 ________________________________________________________________________________________________________________________________________________________________________________________________________________________________________________________________________________________________________________________________________________________________
3 _____________________________________________________________________________________________________________________________________________________________________________________________________________________________________________________________________________________________________________________________________________________________ [3]
Name: ________________________________ Per. _______ Date: _____________________
19.Fig. 2.1 shows the surface salinity of the world’s oceans. The figures are in parts per thousand. The measurements were taken in August.
(a) With reference to Fig. 2.1, describe how surface salinity varies with distance from land.
_____________________________________________________________________________________ [1]
(b) Suggest an explanation for the pattern that you have described.
_____________________________________________________________________________________________________________________________________________________________________________________________________________________________________________________________________________________________________________________________________________________________ [2]
Fig. 2.2 shows the difference between evaporation and precipitation, measured in cm, at latitudes between 40°N and 50°S.
Name: ________________________________ Per. _______ Date: _____________________
(c) Surface salinity tends, in general, to be slightly lower at high latitudes and the Equator than at intermediate latitudes.Use the information in Fig. 2.2 to explain this relationship between surface
salinity and latitude.
_____________________________________________________________________________________________________________________________________________________________________________________________________________________________________________________________________________________________________________________________________________________________________________________________________________________________________________________________________________________________________________________________________________ [3]
(d) Mangrove trees are able to survive in saline water. Describe two environmental factors, other than salinity, that may lead to the development of mangrove forest along a shore, rather than another type of ecological community.
1_________________________________________________________________________________________________________________________________________________________________________________________________________________________________________________________________________________________________________________________________________________________
2 _____________________________________________________________________________________________________________________________________________________________________________________________________________________________________________________________________________________________________________________________________________________________ [2]