Embed Size (px)
Citation preview

General enquiries on this form should be made to:Defra, Science Directorate, Management Support and Finance Team,Telephone No. 020 7238 1612E-mail [email protected]
SID 5 Research Project Final Report
NoteIn line with the Freedom of Information Act 2000, Defra aims to place the results of its completed research projects in the public domain wherever possible. The SID 5 (Research Project Final Report) is designed to capture the information on the results and outputs of Defra-funded research in a format that is easily publishable through the Defra website. A SID 5 must be completed for all projects.
This form is in Word format and the boxes may be expanded or reduced, as appropriate.
ACCESS TO INFORMATIONThe information collected on this form will be stored electronically and may be sent to any part of Defra, or to individual researchers or organisations outside Defra for the purposes of reviewing the project. Defra may also disclose the information to any outside organisation acting as an agent authorised by Defra to process final research reports on its behalf. Defra intends to publish this form on its website, unless there are strong reasons not to, which fully comply with exemptions under the Environmental Information Regulations or the Freedom of Information Act 2000.Defra may be required to release information, including personal data and commercial information, on request under the Environmental Information Regulations or the Freedom of Information Act 2000. However, Defra will not permit any unwarranted breach of confidentiality or act in contravention of its obligations under the Data Protection Act 1998. Defra or its appointed agents may use the name, address or other details on your form to contact you in connection with occasional customer research aimed at improving the processes through which Defra works with its contractors.
Project identification
1. Defra Project code
CC0361
2. Project title
Changes to Agricultural Management Under Extreme Events – Likelihood of Effects & Opportunities Nationally (CHAMELEON)
3. Contractororganisations
ADAS UK Ltd
Woodthorne
Wergs Road
Wolverhampton
WV6 8TQ
54. Total Defra project costs £ 249 933.09
(agreed fixed price)
5. Project: start date............. 01 April 2005
end date.............. 30 June 2008
SID 5 (Rev. 3/06) Page 1 of 137

6. It is Defra’s intention to publish this form.
Please confirm your agreement to do so........................................................................................YES NO
(a) When preparing SID 5s contractors should bear in mind that Defra intends that they be made public. They should be written in a clear and concise manner and represent a full account of the research project which someone not closely associated with the project can follow.Defra recognises that in a small minority of cases there may be information, such as intellectual property or commercially confidential data, used in or generated by the research project, which should not be disclosed. In these cases, such information should be detailed in a separate annex (not to be published) so that the SID 5 can be placed in the public domain. Where it is impossible to complete the Final Report without including references to any sensitive or confidential data, the information should be included and section (b) completed. NB: only in exceptional circumstances will Defra expect contractors to give a "No" answer.In all cases, reasons for withholding information must be fully in line with exemptions under the Environmental Information Regulations or the Freedom of Information Act 2000.
(b) If you have answered NO, please explain why the Final report should not be released into public domain
SID 5 (Rev. 3/06) Page 2 of 137

7
Executive Summary7.
Warming of the climate system is unequivocal and the UK government is committed under the UNFCCC to ensure successful adaptation to climate change. Thus Defra have funded a range of studies to examine the impacts of climate change on agriculture. The CHAMELEON project is the first of these studies that focuses on the potential for worthwhile pro-active adaptation measures in advance of extreme events. The project looks to develop a consensus on costed, practical and worthwhile adaptation methods that also account for existing drivers of change within the agricultural industry.
Based on literature survey, consultation and expert opinion a suite of 6 extremes were selected, namely, heat wave duration/timing; frequency of occurrence of maximum temperature exceeding 32°C for >10 days; growing season length, start and end dates; frequency of frost days per month; duration and timing of dry and wet periods and rainfall simple daily intensity index. Changes to these extremes derived from the Met Office’s HadRM3 model for the 2020s suggest that changes will be in line with other studies and occur across most or much of the UK: increase in growing season length; increase in dry spell duration and length; increase in heat wave duration and length; increase in rainfall intensity; decrease in wet spell duration and length; decrease in frost days.
Farmers by and large understand what is meant by a climate extreme, have recognised changes to extremes, been impacted by them and in some instances adapted accordingly. While the impacts of changing extremes are recognised they are not yet seen to be at a frequency (two consecutive or three out of 5 years) or magnitude required for farmers to undertake significant change. The collective attitude is that farmers have to deal with whatever the weather throws at them and as such autonomous adaptation is more likely. The Farmers Voice survey (2005) demonstrated that access to information is vital: Approaching half (42%) of farmers who have responded to extremes feel they are poorly or not at all informed about climate change; Farmers that consider themselves to be better informed are more likely to be responding already or to respond over the next 5 years; The number of farmers who have already adapted to extremes they identified as concerning is, in most instances, markedly lower than the proportion stating concern.
Several hundred possible adaptations in response to the likely impacts of climatic extremes on each sector, namely cattle/dairy, sheep, pig, poultry, arable and horticulture, were compiled through expert assessment and an assessment of the peer reviewed/grey literature. These adaptations range from fairly practical well tested methods through to more innovative adaptations and from fairly low cost operational/husbandry type adaptations to expensive capital investment schemes. Consultations with farmers on these adaptations yielded a wealth of opinion with farmers indicating they were very open to a wide range of adaptation ideas and prepared to consider the implementation of most of the adaptations, should the need arise. However, the implementation thereof will be driven by whether they perceive there to be an impact and will be a function of market forces, financial worthwhileness and/or regulation.
The final selection of the most important, likely, and practical adaptations for the economic costing was made by the sectoral experts such that they were representative of a range of climate extremes and of importance to a range of sectors.
The economic assessment of potential adaptations has been made through a combination of impact on profitability, break-even point and the return on investment that might be expected from adoption an adaptation to mitigate against a weather extreme. At individual business level, the drivers for change are complex and it is beyond the scope of this project to evaluate the processes leading to adoption of the adaptations. Individual farmers respond in unique ways to external factors and information available to them, complicated by their interpretation of the information, their attitude to risk, and the impact of change on the wider business. For the purposes of this project simplified assumptions have been made that the decision making
SID 5 (Rev. 3/06) Page 3 of 137

process is determined solely by the financial consequence of the extreme event and the mitigation offered by the adaptation. The economic impact of each adaptation is reported in section 8 of the report and summarised in table 44.
A second iteration of costing has been undertaken for a short list of adaptations considered to be most likely to be adopted by industry and/or with greatest economic implication at industry level. The impact of factors such as special variation and where appropriate soil type were evaluated along with sensitivity to changes in the assumptions used with regards future frequency of extreme events, the impact of the extreme on enterprise performance and the cost of mitigation.
There is special variation in the impact of extreme events, depending on the nature of the event in question. The impact of heat events and/or low rainfall events in the east and south east are such that the worthwhileness of adaptation is predicted to be greater than in the west or Northern Ireland. However, the meteorological data is at coarse resolution in UK terms so there will be significant variation in response rate at individual farm level within each of the geographic areas assessed.
The economic sensitivity to changes in future frequency of extreme events depends greatly on the nature of the enterprise and in particular the intensity of financial output, coupled with the cost of adaptation. In the main adaptations related to horticultural enterprise had greater scope for innovation than arable and livestock enterprises. This reflects the relative value of enterprise output and thus the financial consequence of the extreme is such that higher levels of capital investment are economic. An exception to this could be in some livestock systems in which animal welfare requirements demand adaptation even if it has negative economic impact.
A common theme throughout the assessment has been the reliance of producers on the demands of the market place and the effect that this has on the decision making process. When considering adaptation it is essential that any change would not compromise the relationship between production and the market. This project has not identified any potential adaptation that would add value or allow exploitation of a niche or novel market. That is not to say that such opportunities will not exist. There would however need to be greater reliability in the frequency and timing of the extreme event before serious consideration could be given to such enterprise.
In the main, farmers are focussed on a short term planning horizon, dealing with the day to day volatility of market prices and production costs. Making adaptations for predicted changes in climate extremes up to and beyond 2020 do not feature in the plans of most farmers. Equally, the wider environmental impacts of adaptation, many of which require greater input of resource, would not be expected to be a key factor in the future adoption strategies. Intervention will be needed if wide scale adoption of some mitigation adaptations is to be achieved in order to meet Government and social expectations with regards the environment and land management.
SID 5 (Rev. 3/06) Page 4 of 137

Project Report to Defra
Changes to Agricultural Management Under Extreme Events – Likelihood of Effects & Opportunities Nationally
(CHAMELEON)
June 2008
Prepared for
Katherine Bass
Farming and Food Science
Greg Hughes, Martin Wilkinson, David Boothby, James Clarke, Stephen Perkins, Mervyn Davies, Mark Temple, Duncan Cheshire, Jo Hossell (ADAS)
Mark Gallani (Met Office)
ADAS UK Ltd
Met Office

1. IntroductionWarming of the climate system is unequivocal with most of this increase attributable to increased concentrations of anthropogenic green house gases (GHG) (IPCC, 2007). With previous emissions committing us to certain climatic change and considering that current mitigation policies will see GHG emissions grow over the next few decades (IPCC, 2007) there is an urgent need for development of adaptive capacity in conjunction with increased mitigation efforts. The UK government is committed under the UNFCCC to ensure successful adaptation to climate change. However, successful adaptation depends upon technological advances, institutional arrangements geared towards cross-sectoral working, appropriate financing arrangements and information exchange (Stakhiv, E., 1993; Watson, R.T. et al., 1996; Smit, B. et al., 2000; IPCC, 2001; Adger, W.N. et al., 2007). Thus Defra have funded a range of studies to examine the impacts of climate change on agriculture looking mostly at the effects of changes in average conditions (HRI, 1998a, 1998b; Hossell, J.E. et al., 2001) along with proposed adaptations and the costs thereof (Hossell, J.E. et al., 2002). Similarly, related studies have examined the effects and reactive adaptations to extreme events, such as the hot summer of 1995 (Orson, J.H., 1999) and the wet autumn/winter of 2000/1 (Shepherd, M.A., 2001). Collectively, these studies demonstrated the costs of such events to the agricultural industry and prompted further work (Hulme, M. et al., 2002; Holman, I.P. and de Vries, T.T., 2005) looking at climate change impact thresholds (Parry, M. et al., 2001) and the potential for and adaptation to extreme events (Hossell, J.E., 2003; HRI, 2007).
However, the CHAMELEON (“Changes to Agricultural Management under Extreme events – Likelihood of Effects and Opportunities Nationally”) project is the first study focusing on the potential for worthwhile pro-active adaptation measures in advance of extreme events. While several past projects have attempted to provide information to farmers to raise awareness of the effects of climate change (Orson, J.H., 1999; Shepherd, M.A., 2001; Holman, I. and Loveland, P., 2002) and to encourage adaptation responses (MAFF, 2000; IGER, 2002), there has been limited direct consultation with farmers (IGER, 2002; UKCIP, 2003; Farming Futures, 2007) to determine their perceptions of extremes, the impacts thereof and to understand what adaptation options they may be willing or able to afford to make, especially as the impacts of gradual change are generally outweighed by other driving forces, which operate on a more rapid timescale. The Chameleon project looks to fill this information gap by developing a consensus on costed, practical and worthwhile adaptation methods that also account for existing drivers of change within the agricultural industry (e.g. CAP Reform, Water Framework Directive and Nitrate Vulnerable Zones). The results from this project are presented in the following chapters.
1.1 ObjectivesThe objectives of the project were:
1. To determine with agricultural stakeholders what the main extremes that will affect agricultural production are
2. To assess how the frequency and magnitude of the main extremes may change in the future under climate change to the 2020s and how well such changes may be predicted
3. To determine with the industry how it will adapt to these changes within the context of existing land use change drivers and projections of future socio economic change (med-high scenario)
4. To provide a range of costed adaptations to extremes that cover a range of sectors, regions and broad soil types
5. To produce a final report providing examples and a timescale for inclusion of these adaptations into farm business and industry development plans

2. Selection of Variables of Climatic ExtremesThe main impact of climate on society results from extreme events (Katz, R.W. and Brown, B.G., 1992). The IPCC Third Assessment Report (IPCC, 2001) defines two sorts of extreme event:
1. Extreme weather event: An extreme weather event is an event that is rare within its statistical reference distribution at a particular place. Definitions of “rare” vary, but an extreme weather event would normally be as rare as or rarer than the 10th or 90th percentile. An example would be the record temperature of 38°C reached in England in the summer of 2003. By definition, the characteristics of what is called extreme weather may vary from place to place.
2. Extreme climate event: Is an average of a number of weather events over a certain period of time, an average that is itself extreme (e.g. rainfall over a season). An example would be the hot August of 1995, which was 3.4°C warmer than the 1961-90 average.
The project focus is on relatively short term climate change i.e. within the next 15 to 20 years; given that farmers will only focus on conditions within their expected working life. Similarly, the types of extreme weather events that need to be examined are those with relatively frequent reoccurrence, i.e. 2-5 years since these are the events that will need and will probably be worthwhile for farmers and the industry to respond to. At the same time it is worth also including catastrophic/critical extreme climate events that can result in a step change in practices due to their severity.
This leads then to consideration of two issues:
1. What adaptation will occur if an extreme climate event becomes more frequent and,
2. What adaptation is made in response to extreme weather events that reach a critical frequency
So how frequent does a critical event have to be and how critical does a frequent event have to be to warrant adaptation?
2.1 Review of Available Literature The review included unpublished reports, such as research reports as well as published papers from academic and trade journals, and grey literature such as newspaper reports. The review focused on forms of temperature and precipitation extremes and was initially divided into effects on each of the three agricultural sectors under consideration, horticulture, arable and livestock. The search included material published in the last 10 years and so covered reports on the effects of extremes such as the hot summer of 1995, wet autumn/winter of 2001 and the hot summer of 2003, but not the heat wave of 2006.
There are most reports on the effects of extremes on arable production, partly reflecting the widespread nature of production and the range of crops, which may be affected by a variety of extremes. Note that high temperature extremes may also include problems caused by drought conditions. The reports cover both weather and climate extremes, but the majority of papers deal with extreme climate events. Only exceptionally high temperatures, storm flooding, late/unseasonal frost and hail have been noted in the literature as examples of potential/past problems for agricultural production caused by extreme weather events. Temperatures around or above 32°C will inhibit or curtail wheat development during emergence, anthesis, pollination, grain-fill and maturation stages (Porter, R.J. and Gawith, M., 1999). Unseasonal frost devastated fruit crops in 1997 (Grower, 1997) and 1999 (Grower, 1999a) and hail affected apple crops across small areas of Kent in 1999 (Grower, 1999b). Flooding

and storm winds also lead to severe damage and loss of livestock in Cumbria in January 2005. The problems caused by the climate extremes seemed to be somewhat less severe than those related to extreme weather (see Table 1), but the effects were felt generally over a wider area.
Table 1: Selection of reported UK climatic extremes since 1995, their timing and impact
Climate Extreme Timing Problems caused Reference
Heavy rain Anytime e.g. August 2004 in Eastern England
Poor harvest conditions for cabbage, lettuce and pea producers. Knock-on issue for winter cereal planting.
(Grower, 2004)
High maximum temperatures
Particularly summer e.g. 2005/2006
Limitations on the timing for transporting of livestock and poultry reduced feed intake in pigs.
(Orson, J.H., 1999; DARDNI, 2005; Huynh, T.T.T. et al., 2005)
Drought Early summer (June, July) e.g. 1995; 2005
Reduced grain fill period in wheat and hence lower yields
(Orson, J.H., 1999; Lotter, D.W. et al., 2003; Masters, G.S. and Wilhelm, W.W., 2003; Farmers’ Weekly, 2005b)
Late Summer/Early Autumn (August, September, October) e.g. 1995
Low levels of grass, planting issues for autumn crops such as wheat and oilseeds
(Orson, J.H., 1999; Farmers’ Guardian, 2003)
Reduced winter chill
Winter months Lower yields in top fruit (Oukabli, A. et al., 2003; Atkinson, C.J. et al., 2004)
Prolonged high rainfall
Autumn/winter e.g. 2001/Jan 2005
Reduced access for field operations in all crops, low soil N residues
(Farmers’ Weekly, 2001; Grower, 2001; Shepherd, M.A., 2001)
2.2 Chosen ExtremesThe impact of the extremes varies with sector and crop type. For example in the hot summer of 1995 dry conditions in late July occurred late enough not to affect wheat yields, but potato quality and therefore saleable yields were affected badly by scab (Orson, J.H., 1999). Hence in choosing extreme variables for this project it is important to explore the magnitude, frequency and timing of the events. The timing aspect should not just relate to the month in which an event occurs but also to the period within the growing season, since this will dictate the stage of crop development/commodity production that is being affected. Based on the literature review of adaptations proposed in response to climate change and extremes (see Table 11) and the information provided by ADAS sector experts the variables selected for use within the project are summarised in Table 2. Many of these are typically used in explorations of extreme event impacts on society and the environment (Jönsson, A.M. et al., 2003; Moberg, A. et al., 2006; Beniston, M. et al., 2007; ECA, 2007).
Table 2: Summary of the chosen extreme and its definition
Threshold/extreme Definition
Heat wave duration/timing It is defined as the total length of periods of at least 6 days,

Threshold/extreme Definition
during either the summer half-year or winter half-year, when the maximum temperature exceeds the 1961-1990 average for that day by at least 3°C and Julian day of start of heat wave.
Frequency of occurrence of maximum temperature exceeding 32°C for >10 days
Number of occurrences of maximum temperature exceeding 32°C for more than 10 days.
Growing season start and end dates
Date of start and end of growing season where the growing season is assumed to start on the 5th consecutive day with a mean temperature of 5°C or greater and end on the 5th consecutive day with a mean temperature of 5°C or less.
Frequency of frost days per month
Number of days with minimum temperature < 0°C.
Duration and timing of dry and wet periods
Greatest number of consecutive days where rainfall < 1mm or rainfall >1 mm and the start date of period.
Simple Daily Intensity Index Quotient of amount on days where rainfall > 1mm and number of days where rainfall > 1mm.

3. First Farmer Focus Group FindingsSix focus groups (with around 6-8 farmers per group) were undertaken across the UK with farmers. The groups took place between 26th January and 13th February 2006. The objectives of the discussions were to better understand what types of extreme weather have been experienced and the impacts that such weather has had upon their farming practices. These discussions were undertaken with farmers working on a range of different farm types and within different regions throughout the UK. The regions (and towns) in which the groups took place were:
South and East (Wisbech)
Welsh Borders (Hereford)
Northern Ireland (Coleraine)
East Scotland (Aberdeenshire)
South West (Barnstaple)
North East (Malton, N Yorkshire)
Further details regarding the composition of each group (farm type and size) can be found in Appendix A.
3.1 Experience of Extremes Overall, farmers’ understanding of an extreme event is accurate. For a minority, such extremes would need to be very severe to be classed as extreme (e.g. tornado, monsoon conditions) while for others it was unexpected weather, i.e. not predicted. Each group of farmers have experienced a wide range of extreme weather events, though to varying degrees across the different regions. For example the hot summer of 2003 noted as an extreme elsewhere was described as better than average in Northern Ireland. The general trends are described below:
Hot Summers: All groups recalled the hot summer of 2003 along with 1976 and 1993. Recollection was most evident amongst the dairy sector.
Drought: All groups and sectors recalled the drought that accompanied the hot summer of 2003. The winter of 2005/06 was also described as particularly dry. Herefordshire farmers believe they now experience increased drought frequency of every 3-4 years.
Mild Wet Winters: All groups believe the winters have become milder, e.g. 2004/05, with the more eastern and northern regions also describing these as wetter.
Rainfall and Flooding: All groups have experienced extreme rainfall. Extremes were described as ranging from a few hours/days or prolonged over a number of weeks/months, mainly in the spring and autumn e.g. 2000/01. In some instances, this additional rainfall has led to an increase in the frequency of flooding. This is particularly true amongst Welsh Border, Northern Irish and North East farmers with Welsh Border farmers believing the Wye now floods every 2-3 winters as opposed to every 5. There was also widespread agreement across the groups that the nature of the rain has also changed in recent years. It is now thought to be more powerful and intense.
Early/Late Frosts: Most groups have experienced late frosts (May), but there is little experience of early frosts, which for some groups were noted as becoming less frequent. Horticulturists were most affected by unseasonal frosts.

Strong Winds: With the exception of the South & East and Northern Irish groups, particularly strong winds were experienced across the groups albeit with different experiences. In the Welsh Borders, the wind is considered to have become more continuous in nature than previously, especially the southerly wind in winter. Farmers in this group also felt that strong wind was more prevalent in May/June. South West farmers recall very windy conditions, but not an increase in their frequency, and suggested a decrease in autumnal winds. North East farmers also noted an increase in wind speeds. Whilst strong winds are apparent in North East Scotland, they are something that has always been experienced, and none noted a change in the wind conditions experienced recently.
3.2 Experience of Impacts The focus group’s experiences of extremes were accompanied by experiences of impacts which vary by region and sector. These impacts are typically negative and are listed below for suites of extremes:
Hot Conditions and Drought: Yield reduction – this is usually accompanied by increased prices
Delayed harvest owing to slowed growth rate
Increased pesticide/fungicide/herbicide costs owing to over-wintering pests/disease
Increased pesticide/fungicide/herbicide costs owing to increased generations of insects and increased incidence of disease
Increased storage costs or decreased sales price owing to early sale
Income reduction as risky land is removed from production and put under another land use e.g. agri-environmental agreements
Indirect effect on livestock through water and feed availability
Increased feed costs Increased silage spoilage Increased water costs e.g. larger troughs or drilling a borehole
Increase in mortality in poultry
Decreased animal weight gain in pigs, poultry and livestock
Increased cost of controlling animal house temperatures e.g. through insulation or opening and closing shutters
Loss of milk production
Increase in fertility problems
Increased use of pesticide e.g. drenching for sheep
Easier combinable crop harvest owing to it being dry
Increased anti-biotic/vaccination costs for animals e.g. for pneumonia
Extended grazing season either side of winter
Lower feed costs during winter as animals eat less in milder winters
Wet Conditions and Flooding: Reduced quality of crop with associated lower sales price
Increased cost of drying (both grain and straw)
Poor seed quality for following year
Repeat drilling owing to crop failure (too wet) or crop loss (flash flooding)

Crop loss - in the event of flooding and water logging
Earlier autumn drilling to avoid wetter autumns
Changed application date of pesticide applications to avoid loss, e.g. after Christmas
Increased cost of re-application of pesticide lost in wet weather
Increased soil erosion and loss in soil quality
Longer housing period for livestock (a particular problem in NI), and associated increased costs
Re-seeding owing to crop failure (too wet) or crop loss (flash flooding)
Increased mortality associated with flash flooding
Increased costs to pump fields dry
Frost and Hail: Yield reduction in arable and horticultural operations (e.g. fruit, potatoes, sugar
beet and maize)
Repeat drilling owing to crop failure
Reduced effectiveness of fungicides
Increased expenditure disposing of manure/slurry owing to a reduction in days when the land can be travelled in winter
Wind: Reduced number of spray days in arable systems
Yield reduction owing to loss of grain from the seed head
Increased mortality in outdoor poultry (literally blown away)
3.3 Summary of FindingsAll farmers have recognised changes to extremes and all have been impacted by them, and where possible, caused them to adapt accordingly. The collective attitude, particularly amongst livestock farmers, is that they deal with whatever the weather throws at them as and when required. The need to react or adapt is assessed on an almost daily basis. Much of this belief stems from their experience, with no two consecutive years being the same. Hence, to adapt significantly is considered unnecessary at this stage.
Specific adaptations have been made. Several arable/horticulturists have considered, or are, growing new crops. Several livestock farmers have improved ventilation in their housing to combat pneumonia.
That is not to say farmers are not affected by the changing weather as has been documented. The most prominent impacts for livestock farmers concern poor quality feed as a result of wet weather, increases in bouts of pneumonia and increases in feed costs (amongst some but not all groups) as a result of keeping their livestock housed for longer. For arable, farmers it is loss of yield or poorer quality of crops as well as increases in diseases.
Of all the farm types, fruit growers appear to be to most reactive to changing weather patterns, and there is a link to the nature of their crops being more susceptible to unusual spells of weather, particularly late frosts, wet weather or strong winds. These
farmers appear to monitor weather patterns and plan more than other types of farmers.
From the discussions, the impression is left that the impacts of changing weather patterns are well recognised, but that they are not yet at a frequency or magnitude required for farmers to show significant change. This is illustrated by the responses to the severity of weather required in order for them to change their practices. For most, there would need to be a significant loss of yield for at least two consecutive years on account of weather extremes in order for them to consider permanent adaptation. Any adaptation is also limited by the financial climate in which farmers find themselves. It must be seen to be financially worthwhile it before substantial change will take place.

4. Met Office AnalysisThe focus of this section is changes in the chosen climatic extremes for the 2020s, relative to the 1970s, although for a few parameters, changes for the 2080s are also shown if they illustrate the changes better. The changes are derived from the Met Office’s Hadley Centre Regional Climate Model, HadRM3, for which data was available to simulate the climates of 1961-90 (the 1970s) and 2071-2100 (the 2080s). The changes for the 2020s were derived from the changes between the 1970s and the 2080s using scaling methods described in Hulme et al., (2002). The predicted changes should be viewed in the context of the uncertainty section included in Appendix B. Changes in precipitation parameters are generally more uncertain as to their significance relative to natural variability than changes in temperature parameters.
Where available, maps of the observed 1961-90 climate for parameters useful for comparison with the modelled parameters are included. These were obtained form the Met Office’s National Climate Information Centre (NCIC).
4.1 Frost Day Frequency and Timing Figure 1b shows that annual frost days are predicted to reduce significantly in all areas by the 2020s, especially inland, and in the north of the UK. The greatest difference is seen in the Highlands of central Scotland, where frost days in the 2020s are predicted to occur on at least 14 fewer days. Even in the least-affected regions (all coastal), it is predicted that there will be at least 5 fewer frost days in the 2020s.
Analysis of the data for separate months shows that it is in the transitions from warm to cold seasons and from cold to warm seasons where the greatest changes in the frequency of frost days occurs. In the middle of summer there is little change, since frost days are already rare. The month with the greatest change is March, where some parts of Scotland are predicted to have up to 3 fewer frost days in the 2020s. Despite the reduction in frost days there are still frost days likely to be experienced (see Figure 1a and 1b), enough to ensure that farmers will not be able to ignore the risk, especially of late frosts in March (see Figure 2a and 2b).
Figure 1: (a) Observed annual days of air frost, from 1961-90 (1970s) (b) Change in annual days of frost, from 1961-90 (1970s) to 2011-2030 (2020s)(a) (b)
Figure 2: (a) Observed days of air frost in March, from 1961-90 (1970s) (b) Change in days of frost for March, from 1961-90 (1970s) to 2011-2030 (2020s)(a) (b)
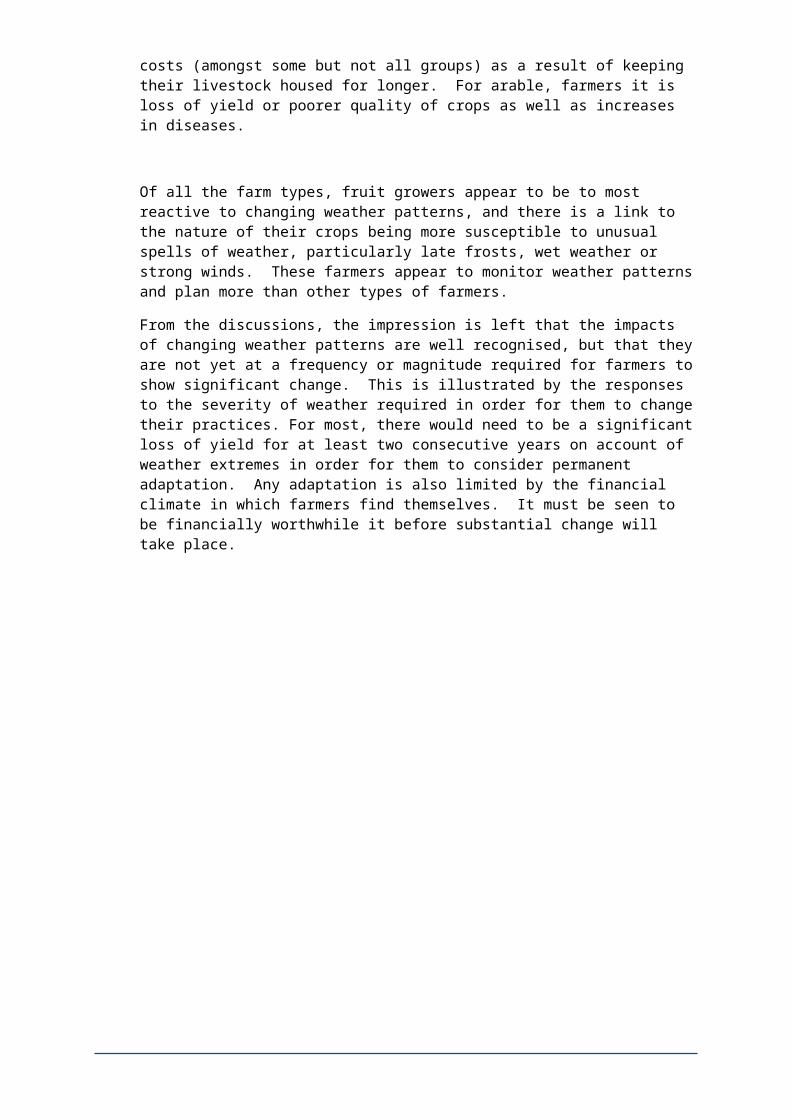
4.2 Growing Season Length Regional climate model (RCM) average temperature data was analysed on an annual basis to find the growing season start, end and length for each year of the climate
model simulation. The differences (in days) between the control and future climates were then calculated (see Figure 3b). The greatest differences are seen in the north of the UK, probably due to the growing season in the south already being close to year-round in the control run of the climate model.
Figure 3: (a) Growing season length in control climate (1961-90) (b) Comparison of changes in growing season length (2020s-1970s)(a) (b)
The growing season length in the control climate of the model shown in Figure 3a illustrates how the growing season lasts nearly the whole year in some southern parts of the UK, and therefore cannot increase by a great deal, whereas there is much more “room for improvement” in northern Scotland. Perry (2006) also concluded that the observed increase in growing season length from 1961-2003 is most significant over Scotland and northern England.
Met Office Note:Some of the maps, especially maps showing differences between the future and control climate model data, have sea areas coloured instead of blank. Most of the fields plotted have extremely anomalous values (which would not occur in nature) as a missing data indicator, e.g. over sea gridboxes. However, when fields are subtracted to calculate the 1970s to 2080s changes, the missing data indicators cancel each other out and cause the difference fields to also have zero over the sea, when often the difference fields have real differences of zero over some land gridboxes, and so the sea gridboxes have the same colour as some of the land gridboxes. Sometimes this can be eliminated by careful adjustment of colour palettes and contour levels, but this is not always possible whilst keeping distinct colours for the rest of the data range
4.3 Maximum Temperature > 32C for more than 10 daysThe maximum temperature data from the model runs was analysed for spells of more than 10 days where the maximum temperature exceeded 32°C. It transpired that this was such a rare event that only one such spell occurred in the control run, although in the future (2080s) data such spells affected a larger area and were more frequent. The 1970s and 2080s actual data are presented in Figure 4, along with the changes
for the 2020s and 2080s. Figure 4b shows how the frequency of prolonged very hot spells in the 1970s control run is fairly low while Figures 4c and d show the changes relative to the control run of the model for the 2020s and 2080s respectively.
Figure 4: (a) Number of spells of Tmax >32°C for >10 days, from 1961-90 (1970s) climate model (b) Number of spells of Tmax >32°C for >10 days, from 2071-2100 (2080s) climate model (c) Change in frequency of Tmax >32°C for >10 days, from 1961-90 (1970s) to 2011-2030 (2020s) (d) Change in frequency of Tmax >32°C for >10 days, from 1961-90 (1970s) to 2071-2100 (2080s)(a) (b)
(c) (d)
4.4 Heat Wave Duration Figure 5 shows the predicted change in the Heat Wave Duration Index (HWDI), the maximum length of periods of at least 6 days, when the daily maximum temperature is greater than the 1961-1990 average for that day by at least 3°C. The whole of the UK is predicted to see an increase in HWDI, and this consistency suggests that it is a significant result overall. Some parts (e.g. south-west England) are predicted to see an increase of more than 15 days, which seems significant, but some eastern parts are predicted to see increase of less than 3 days, which is probably not significant.

Figure 5: (a) Max length of spells of Tmax >3 °C above 1961-90 mean for >=6 days for the control run (b) Max length of spells of Tmax >3 °C above 1961-90 mean for >=6 days, change (in days) from 1970s to 2020s (a) (b)
4.5 Wet and Dry Spell Duration Regional Climate Model (RCM) daily precipitation data was analysed to find the maximum length of spells of more than 1mm (wet spells) and less than 1mm (dry spells) of precipitation during the climate model simulation. The differences between the control and future climates were then calculated.
Figure 6 displays the results for wet spells, and shows that there is little or no change over significant portions of the UK, especially in many coastal areas of England and Wales. However, coastal areas in south-east England see reductions in the maximum length of wet spells. Most areas where there is a change of more than one day in the maximum length of wet spells are predicted to experience a reduction in the length. A few small areas in the west of mainland Britain are predicted to see an increase of between 1 and 4 days in the maximum length of wet spells.
Figure 7 shows that most of the UK is predicted to experience increases in the maximum length of dry spells, with increases of more than 6 days in many parts, especially south-east England, south-west England, northern England and southern Scotland. There are a few small areas, mainly in parts of Wales and the Midlands, which are predicted to see small decreases (of less than three days) in the maximum length of dry spells.
There is some correspondence between the areas which are predicted to see the greatest increases in the maximum length of dry spells with those which are predicted to see the greatest decreases in the maximum length of wet spells, e.g. south-east England and central Scotland, but there are some smaller areas which are predicted to see little or no decrease (or even a slight increase) in the maximum length of wet spells but an increase in the maximum length of dry spells of more than six days, e.g.

parts of south-west England, northern England and western Scotland. It appears that for the UK in general, the predicted increases in the maximum length of dry spells are more clearly defined than the reductions in the maximum length of wet spells.
4.6 Rainfall Intensity The predicted changes in the Simple Daily Intensity Index (SDII) from the 1970s to the 2020s are shown in Figure 8. The SDII is the total annual precipitation divided by the number of days with more than or equal to 1 mm of precipitation. It is a measure of average precipitation conditions, as it gives the average precipitation per wet day. The SDII doesn't change much by the 2020s in a warmer UK climate: the map of changes shows that the maximum change by the 2020s is an increase of between 0.3 and 0.4. Detailed analysis of the data showed that the maximum change was actually just less than 0.33. There are no areas where the SDII decreases in the future climate. The areas of greatest increases in SDII tend to be on the western side of Britain, especially Wales and North West England, i.e. when there are wet days, they will tend to have more precipitation. This can be the result of increases in the annual amount of rainfall or decreases in the number of wet days: in this case we know that the model predicts a slight overall decrease (less than 10%) in annual precipitation for the UK by the 2020s (Hulme, M. et al., 2002).
From the preceding, we can conclude that the model predicts that there will be fewer wet days in the future climate, although in theory there could be a shift in the distribution of precipitation between days of less than 1mm and days of more than 1mm. However, other studies (Hulme, M. et al., 2002; Dale, M. et al., 2003) have concluded that although there will be less annual precipitation in the future, a greater proportion of it will fall in extreme events.

Figure 6: (a) Number of wet days (>1mm precipitation) in the control run (b) Change (in days) in number of wet days, 2020s minus 1970s (c) Length of the maximum wet spell duration in the control run (d) Change in length of the maximum wet spell duration (2020s – 1970s)(a) (b)
(c) (d)
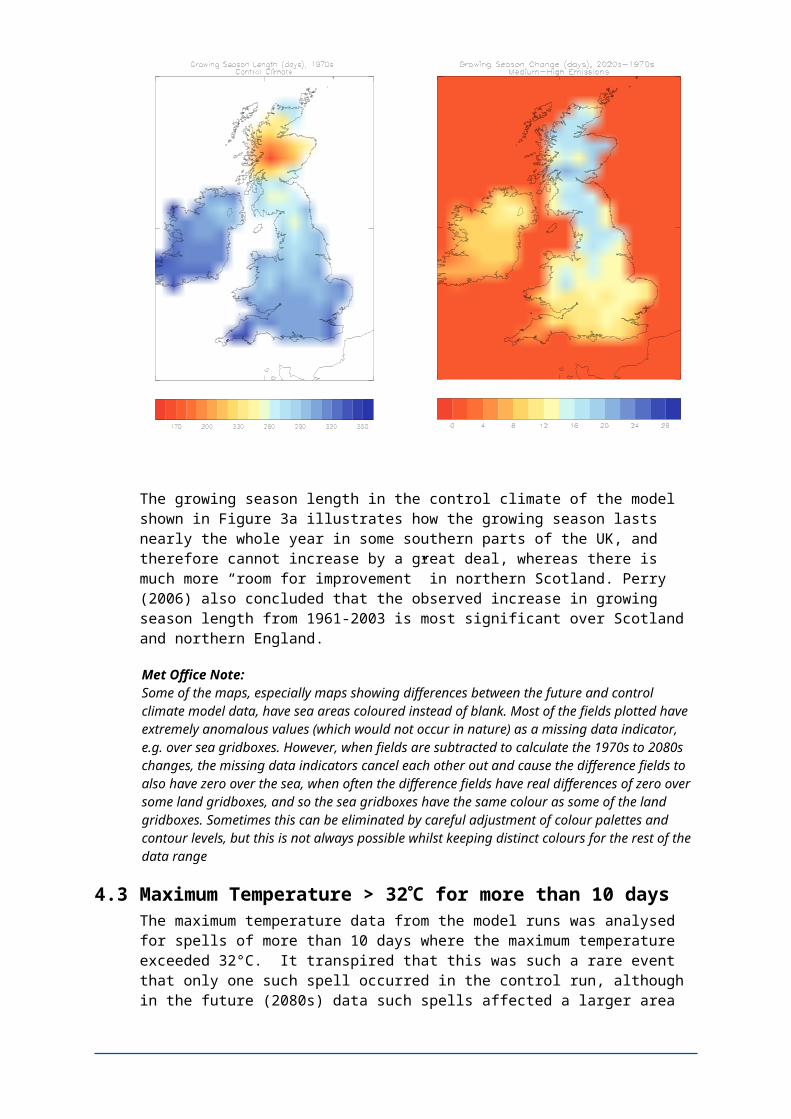
Figure 7: (a) Number of dry days (<1mm precipitation) in the control run (b) Change (in days) in the number of dry days (2020s - 1970s) (c) Duration of the longest dry spell in the control run (d) Change (in days) in duration of the longest dry spell (2020s – 1970s)(a) (b)
(c) (d)

Figure 8: (a) Average simple daily intensity index (SDII) in the control run (1961-1990) (b) Predicted change in simple daily intensity index (SDII), 2020s minus 1970s (c) Predicted change in simple daily intensity index (SDII) for winter, 2020s minus 1970s (d) Predicted change in simple daily intensity index (SDII) for summer, 2020s minus 1970s(a) (b)
(c) (d)

4.7 Conclusions Frost days are predicted to reduce significantly in all areas of the UK by the 2020s, especially inland, and in the north of the UK. The growing season is predicted to increase across the whole of the UK by the 2020s, by more than 20 days in some parts. The Heat Wave Duration Index is predicted to increase across the whole of the UK by the 2020s, by more than 15 days in some parts. Most of the UK is predicted to experience increases in the maximum length of dry spells, and the spatially cohesive nature of these areas (and their relatively large size) suggests that these changes are significant. The Simple Daily Intensity Index (SDII) changes little by the 2020s: the maximum change by the 2020s is an increase of less than 0.4. However, SDII increases across the whole of the UK, particularly on the western side of Britain, especially Wales and North West England.
With the development of the Regional Climate Model (HADRM3) approach to climate change scenario development, there has been an improvement in the temporal and spatial resolution of scenario data available. However, care is still needed in interpretation of these data since there are uncertainties inherent in the scaling of the 2070s data to provide information at the 2020s and 2050s timescales. Moreover, the data are still only calculated at a 50km grid resolution and hence they provide little indication of the potential for localised extremes in the future.

5. AdaptationThere are several ways to define adaptation to climate change (Smit, B. et al., 2000). For the purposes of this work adaptation is taken to mean adjustment in natural or human systems in response to actual or expected climate stimuli or their effects, which moderates harm or exploits beneficial opportunities (IPCC, 2001; Adger, W.N. et al., 2007). This includes any adjustment, whether autonomous, reactive or anticipatory (UKCIP, 2003), that is proposed as a means for ameliorating the anticipated adverse consequences associated with climate change (Stakhiv, E., 1993) or taking advantage of the opportunities that it presents. The UKCIP risk and uncertainty framework (UKCIP, 2003) suggests that progression towards successful adaptation strategies should be an iterative process that builds upon knowledge gained in earlier assessment stages. This work draws upon the findings of earlier UK studies of the impact of extreme events on agriculture (Orson, J.H., 1999; Shepherd, M.A., 2001; Holman, I. and Loveland, P., 2002; Hossell, J.E., 2003; Holman, I.P. and de Vries, T.T., 2005) as well as available literature and the substantial industry knowledge of the sectoral experts and their contacts who have contributed to this study.
5.1 Proposed AdaptationsA range of possible adaptations in response to the likely impacts of climatic extremes on each sector, namely cattle/dairy, sheep, pig, poultry, arable and horticulture, were compiled through expert assessment and an assessment of the peer reviewed and grey literature. These adaptations range from fairly practical, well tested methods through to more innovative adaptations and from fairly low cost operational/husbandry type adaptations to expensive capital investment schemes as illustrated in Figure 9.
Figure 9: Illustration of the range of complexity and expense of adaptations options considered
Expe
nsiv
e
Insulate animal housing
Breed new varieties; Water
harvesting
Inex
pens
ive Winter
shearing; Stock shaded
field
Plant early to avoid summer
drought
Well Proven Innovative
Several hundred adaptations were identified for specific impacts to each sector. These were then summarised into a suite of more generic adaptations, for example insulation of a poultry house or the insulation of the arcs used to provide shade to outdoor pigs were both grouped into “Redesign of animal housing – insulation”. Some adaptations are however, very specific to a particular sector or even a particular portion of that sector and could not be grouped, for example overhead irrigation of top fruit within the horticultural sector to prevent unseasonal frost damage. These adaptations compiled by impact for each extreme and sector are provided in Tables 3 through 10. In addition to listing the proposed adaptation, the likelihood of uptake of this adaptation along with whether it is already practised in the UK or other countries, where known either through expert opinion or from the literature, was noted. The final

generic adaptation list considered for inclusion in the economic costing exercise is provided in Table 11 along with any literature references that propose this adaptation. Many of the references to adaptations in the literature are speculative, cursory or implied and have been assessed by the sectoral experts before being included in this list.

Table 3: Summary of the impacts and adaptations relating to the frequency and timing of heat wavesSector Effects Adaptation Likely uptake Practiced in UK Overseas examples
Cattle Yield reduction owing to decline in breeding success 1,2,3,5 all-M all USA
Reduced yield owing to reduced feed intake 1,2,3,5 all-M all USA
Yield reduction owing to increased incidence of pneumonia 2,3,64,37 all-H except 37-M allSheep Heat stress during housed lambing 6 HPigs Reduced growth rate caused by lower feed intake 1,2,3,4,5 1-L, 2-M, 3-L, 4-L, 5-M all 1-Canada,US, 3,4-Spain, 5-Europe
Heat stress during transportation 5,11,17,18,37,49 all-M but 49-L 5 17,18-Spain,49 Spain
Heat stress caused by lower/restricted water availability for cooling 48 H SpainPoultry Reduced output owing to fertility impacts 1,2,3,4,5 all-H all Hot countries
Reduced output owing to higher bird mortality 1,2,3,4,5,7,17,63 all H all Hot countries
Reduced output owing to reduced feed intake 1,2,3,4,5,8,17,63 1-5H, 8-L, 17 & 63-H all Hot countries
Heat stress during transportation 17,49 M
Arable Yield reduction 65 M all Global
Change in pest and disease threats 66,67,68 66 & 67-H, 68-M
Storage temperature control 80 MHorticulture Seed thermodormancy 65,92 all-H
Thermodormancy affecting fruit shape and size 65 H
Slowed ornamental establishment 93 H
Increased pest/disease/weed incidence 66,67,68,78,85,94 H except 78 & 85 - M
Reduction in crop yield and quality 83,70 all-M
Disruption to crop schedules and continuity of supply 70,95,96,97 all-M
Shelf life reduced 961 Housing redesign - improved insulation2 Housing redesign - portable ventilation3 Housing redesign - improved permanent ventilation4 Housing redesign - ventilation with evaporative cooling5 Housing redesign - sprays/misters6 Winter Shearing7 Thinning of stock numbers prior to extreme8 Dietary change - supplement/improved feed, Buffer feeding11 Provision of shade17 Night transport/transport18 Avoid heat of the day37 Reduced stocking rates48 Access alternative water supply e.g. borehole; use of 'grey' water49 Transporters featuring on-board mechanical ventilation systems63 Nocturnal catching/thinning
64 Vaccinate65 Grow new varieties/crops e.g. heat tolerant and drought resistant66 Increased usage of pesticide/herbicide/fungicide67 Change in type of pesticide/herbicide/fungicide68 Grow less susceptible varieties/crops70 Move production elsewhere in UK e.g. to cooler N&W78 Increased mechanical weed control80 Cool storage83 Install or increase irrigation capacity85 Increased pest and disease surveillance92 Thermal screens93 Expand use of crop shading94 Increased use of crop covers 95 Higher levels of crop management96 Investment in storage and transport temperature control97 Novel crops
Page 23

Table 4: Summary of the impacts and adaptations relating to the frequency of maximum T > 32°C for longer than 10 daysSector Effects Adaptation Likely uptake Practiced in UK Overseas examples
Cattle Heat stress 9,10,15 9-M, 10-H, 15-MLonger finishing owing to reduced feed intake 1,2,3,4,5,11,15 1-5 M, 11-H, 15-MSilage spoiling 12,13 12-H, 13-MFertility issues 14,15 all-M
Sheep Heat stress 16,11,17,15 16-L, 11-M, 17L, 15L 16-Spain/Italy, 15-Hot countiesPigs Reduced fertility 11,18,19,48,53 11-M, 18-H, 19-H, 48-M, 53-H all All-Mediterranean countries
Reduced yield and increased mortality 11,1,4,5,17 11-H, 1-L, 4-M, 5-H, 17-M 5,11 4 - Spain, 1 - US, 1 - CanadaReduced cleanliness 2,3,4,5 2-M, 3-L, 4-L, 5-M 2,3,4,5 5 - NetherlandsOutdoor pig photosensitisation 20,15 20-M, 15-H 15Heat Stress 1-insulated outdoor arcs,60,11 1-H, 60-M, 11-L 1,60,11 Mainly UK
Poultry Reduced yield and increased mortality 2,11,21,15 2-M, 11-H, 21-L, 15-L 2,11,21 UK Outdoor FlocksReduced output owing to reduced feed intake 1,2,3,4,5,8,17,63 1-5H, 8-L, 17 & 63-H all UK indoor flocks
Arable Reduced yield 69, 65, 70 69-M,65-H, 70-M 65-France, AustraliaHorticulture Reduced yield - Crop failure 83,65 all-H
Fruit set problems - excessive to watercore 98, 65 98-H, 65-MIncrease in sun damage 99, 93, 65, 98 all-MDelayed emergence and establishment 100, 70, 65 all-H 70Lower levels of certain disease 101Decreased efficacy of herbicide/pesticide and bio-control 77,78,79,93 all-MLabour force health implications 102,103 all-HDifficulties harvesting root/bulb crops 104
1 Housing redesign - improved insulation2 Housing redesign - portable ventilation3 Housing redesign - improved permanent ventilation4 Housing redesign - ventilation & evaporative cooling5 Housing redesign - sprays/misters8 Dietary change - supplement/improved feed, Buffer feeding9 Summer housing of animals10 Nocturnal grazing/diurnal housing11 Provision of shade12 Switch to lighter coloured plastic13 Store in shed14 Coincide 60 day dry period with mid summer and calve in
September
15 Use different breeds16 Nocturnal grazing 17 Night transport/transport18 Avoid heat of the day 19 Artificial Insemination20 Consider crop rotation ahead of outdoor pigs21 Leave flock outdoors at night48 Access alternative water supply e.g. borehole; use of 'grey'
water53 Tents for breeding60 Arcs with rear openings - additional ventilation63 Nocturnal catching/thinning65 Grow new varieties/crops e.g. heat tolerant and drought
resistant
69 Grow earlier maturing varieties70 Move production elsewhere in UK e.g. to cooler N&W77 Increased chemical applications78 Increased mechanical weed control79 Need for better herbicides 83 Install or increase irrigation capacity93 Expand use of crop shading98 Amend pruning regime99 Increase application of trace elements like calcium100 Target production for certain periods of the year only101 Lower fungicide usage102 Change shift patterns103 Air-condition machinery cabs104 Pre-harvest irrigation
Page 24

Table 5: Summary of the impacts and adaptations relating to the growing season lengthSector Effects Adaptation Likely uptake Practiced in UK Overseas examples
Cattle Early/late grass growth 22,23 all-HSheep Early/late grass growth 24,25 all-MPigs Altered use of manure 26,27 26-L, 27-M 27 26-Germany, 27-Denmark,NetherlandsPoultry Altered use of manure 26 26-L 26-GermanyArable Change in timing of sowing/harvesting 71,72 all-H all Australia
Earlier maturation of determinate crops 73,74 73-L,74-H
Increased yields in indeterminate crops 75
Insufficient water supply 76
Increased weed growth 77,78 all-H 77
Decreased herbicide efficacy 77,78 all-H 77Horticulture Extended production season 65, 105, 106, 73 all-H except 106-M
Increased pest and disease incidence 77,85,94 all-H
Increased weed control - longer season 77, 78 all-M
Increased soil fertility requirement 107,108 all-M
Irrigation required over a longer season 83 H
22 Extend grazing season23 Harvest late silage24 Earlier lambing25 Increased stocking rates26 On farm heat/power units; Bio-digesters27 Increase manure storage capacity65 Grow new varieties/crops e.g. heat tolerant and drought resistant71 Adopt flexible operational strategy72 Flexibility WRT autumn versus spring sown crops73 Double crop74 Extend geographical range of suitable production areas
75 Reduce area required to meet demand76 Adopt non-agricultural use77 Increased chemical applications78 Increased mechanical weed control83 Install or increase irrigation capacity85 Increased pest and disease surveillance94 Increased use of crop covers105 Change crop programming and marketing schedule106 Access more casual labour107 Increased use of compost and green manures108 Increased crop rotation
Page 25

Table 6: Summary of the impacts and adaptations relating to the frequency and timing of frostSector Effects Adaptation Likely uptake Practiced in UK Overseas examples
Cattle Reduction in winter manure spreading days 27 H
Maize may be grown at higher altitudes 28 M
Warmer upland farms 29 HSheepPigs Reduction in winter manure spreading days 27,26,50 26-L, 27-M, 50-H 27,50 26-Germany,27-Denmark,NetherlandsPoultry Deterioration in range conditions 37,41 37-M, 41-M 37,41
Reduction in winter manure spreading days 27,26,50 26-L, 27-M, 50-H 27,50 26-GermanyArable Lack of winter kill of pests 77 H
Less winter kill of weeds 77,78,79 all-H
Change in storage requirements for root crops 80 80-L
Late frost coincides with flowering more often 81 M AustraliaHorticulture Lack of winter kill of pests/Increased disease carryover 77,85,94 all-M
Late frost coincides with flowering more 110,111,112 all-H Spain and Italy
Lack of winter chill 65, 113 all-H 65-New Zealand
26 On farm heat/power units; Bio-digesters27 Increase manure storage capacity28 Introduce beef finishing in preference to store cattle29 Introduce softer breeds with better carcass composition and milking qualities37 Reduced stocking rates41 Introduce free draining material around house50 Use of flotation tyres in slurry spreading equipment; umbilical cord slurry application65 Grow new varieties/crops e.g. frost tolerant or low chill requirement77 Increased chemical applications78 Increased cultural/mechanical weed control
79 Need for better herbicides80 Cool storage81 Spread risk - grow range of varieties with different flowering dates85 Increased pest and disease surveillance94 Increased use of crop covers110 Frost burners111 Frost windmills112 Irrigation e.g. overhead113 Dormancy-breaking sprays
Page 26

Table 7: Summary of the impacts and adaptations relating to the duration and timing of dry spellsSector Effects Adaptation Likely uptake Practiced in UK Overseas examples
Cattle Reduced grazing grass 30,32,33,8,34,35 8-H, 34-L, others-M
Reduced natural water 97 HSheep Reduced natural water 97 HPigs Increased soil erosion through bare ground exposure 51 51-MPoultry Reduced grass cover in free range 15 15-H 15 15-France
Increased soil erosion through bare ground exposure 51 51-M 51Arable Changes to field conditions for field operations 82,72 82-M, 72-H
Yield reduction 83,65,70 83-M, 65-H, 70-M 65-Africa
Changed pest and disease requirements 84,85 all-HHorticulture Changes to field conditions for field operations 107,108,114,83 all-M
Yield reduction 115, 83 all-M
Changed pest and disease requirements 84,85 all-H
8 Dietary change - supplement/improved feed, Buffer feeding15 Use different breeds30 Grow drought resistant forage e.g. maize or lucerne32 Increased use of rotation and short term leys33 Increased use of old permanent pasture (common grazing)34 Introduce summer finishing indoors35 Increased use of mix of forages including catch crops51 Use deeper rooting and more persistent grass species to maintain pasture65 Grow heat tolerant and drought resistant varieties/crops70 Move production to cooler N and W of UK
72 Flexibility WRT autumn versus spring sown crops82 Increase range of equipment and specification83 Install or increase irrigation capacity84 Change pesticide usage85 Increased pest and disease surveillance97 Water harvesting and storage107 Increased use of compost and green manures108 Increased crop rotation114 Production planning e.g. site avoidance115 Grow crop under cover e.g. Spanish tunnels
Page 27

Table 8: Summary of the impacts and adaptations relating to the duration and timing of wet spellsSector Effects Adaptation Likely uptake Practiced in UK Overseas examples
Cattle Limited access to pasture in winter 31,27 31-H, 27-HSheep Water logging of pasture 40Pigs Increased moulds in grain and straw 36,52 36-M, 52-L 36
Water logging affects land suited to outdoor pigs 37,38,54 37-H, 38-L, 54-L 37,38,54 UK issue only
Water logging affecting ability to feed and bed stock 61,31,37,46,45,38, all-M except 31-L all UK issue only
Increased mud walked into farrowing arcs by sows 62 62-H 62 UK issue onlyPoultry Increased mud walked into the house by free range birds 41,42 41-H, 42-M 41,42 Mainly UK issue, although can occur in France
Dirty eggs shells in free range birds 43 43-H 43 Mainly UK issue, although can occur in FranceArable Changes to field conditions for field operations 82,72 82-M, 72-H
Difficulty harvesting root crops 86, 82 L
Reduced storage potential for root crops harvested wet 87, 86 87-M, 86-LHorticulture Reduced shelf life and quality 115, 116, 117, 118 all-L
Reduced number of spray days 82, 119 all-H
Difficulty harvesting autumn crops 82,86,107 all-M
27 Increase manure storage capacity31 House stock36 Improved feed bin cleanliness and design37 Reduced stocking rates38 Trough feeding as opposed to broadcast41 Introduce free draining material around house42 Concrete directly around house and clean regularly43 Collect eggs more often45 Improve drainage systems and flood protection46 Improve runoff containment52 Acid treatments to kill moulds54 Availability of spare paddocks
61 Adapted vehicles/feeding equipment for wet conditions62 Provide additional bedding inside and out-use of straw as doormat72 Flexibility WRT autumn versus spring sown crops82 Increase range of equipment and specification86 Grow on lighter soils87 Harvest earlier with yield and quality penalty107 Increased use of compost and green manures115 Grow crop under cover e.g. spanish tunnels116 Artificial lighting117 Terminate crop early118 Train pickers119 Weather monitoring
Page 28

Table 9: Summary of the impacts and adaptations relating to rainfall intensitySector Effects Adaptation Likely uptake Practiced in UK Overseas examples
Cattle Increased risk of poaching 31 H
Decreased manure spreading days 27 H
Increased leaching of inorganic/organic fertiliser 44 H
Increased soil erosion 44 H
Flash flooding 45 H
Increased pollution incidents 46 HSheep Increased flood risk 45 M
Increased soil erosion 47 MPigs Increased soil erosion 46,55,56,57 all-H all UK issue onlyPoultry Increased soil erosion 45,46 all-M all FranceArable Increased soil erosion and nutrient loss 88 H if severe, otherwise M 88 USA, Australia
Decreased efficacy of pesticides 89 M
Increased risk of lodging 90, 109 all-HHorticulture Increased soil erosion, nutrient/pesticide loss 88 M
Crop damage 94,115,120 H
27 Increase manure storage capacity31 House stock44 Follow GAP guidelines45 Improve drainage systems and flood protection46 Improve runoff containment47 Create hard standings55 Alternate field entry/exits to avoid rutting
56 Alternate paddock orientation to avoid 'water chutes'57 Avoid steeply sloping land88 Adopt soil conservation techniques e.g. cover crops, contour ploughing89 Use foliar rather than soil applied herbicides90 Better management - cultivar and plant nutrition109 Apply second application of growth regulator94 Increased use of crop covers115 Grow crop under cover e.g. Spanish tunnels120 Move crops to more sheltered sites
Page 29

Table 10: Summary of the impacts and adaptations relating to the frequency and strength of windSector Effects Adaptation Likely uptake Practiced in UK Overseas examples
Cattle Loss of power 121 Mpigs field equipment/buildings damaged, increase in mortality 58,59 all-H 58,59Poultry field equipment/buildings damaged, increase in mortality 59 59-H 59Arable Increased risk of lodging 90, 109 all-H
Increased damage to emerging spring sown crops 91 H
Decreased number of spray days 82 MHorticulture Loss of power 121 M
Wind erosion 91,94,122 all-M
Damage to crop, crop covers, equipment, glasshouses 123, 120, 124 all-M
58 Heavier arcs, better tent fixings59 Improved construction/durability to wind damage82 Increase range of equipment and specification90 Better management - cultivar and plant nutrition91 Increased use of inter-row cover crops94 Increased use of crop covers
109 Apply second application of growth regulator120 Move crops to more sheltered sites121 Install backup generator122 Use of mulches123 Plant windbreaks124 Use artificial windbreaks e.g. netting
Page 30

Table 11: Summary of adaptations with references to these within the literature
Adaptation Description Reference
1 Housing redesign - improved insulation 2, 4, 7, 16, 19
2 Housing redesign - portable ventilation 2, 4, 7, 11, 16, 19
3 Housing redesign - improved permanent ventilation 2, 4, 7, 11, 16, 19
4 Housing redesign - ventilation with evaporative cooling 2, 4, 7, 11, 16, 19
5 Housing redesign - sprays/misters 2, 4, 7, 11, 16, 19
6 Winter Shearing 19, 20
7 Thinning of stock numbers prior to extreme 2, 6, 7, 16, 19, 20
8 Dietary change - supplement/improved feed, Buffer feeding 16, 19, 22
9 Summer housing of animals 2, 4, 16, 19, 22
10 Nocturnal grazing/diurnal housing 16, 19, 20, 22
11 Provision of shade 2, 4, 11, 16, 19, 22
12 Switch to lighter coloured plastic / Other materials 3
13 Store in shed 3
14 Coincide 60 day dry period with mid summer and calve in September 16, 19, 20, 22
15 Use different breeds 1, 4, 16, 11, 19, 20
16 Nocturnal grazing 16, 19, 20
17 Night transport/transport 2, 6, 7, 16 19, 20
18 Avoid heat of the day 2, 16, 19, 20, 22
19 Artificial Insemination 16, 19
20 Consider crop rotation ahead of outdoor pigs 2
21 Leave flock outdoors at night 2
22 Extend grazing season 1, 2, 13, 14, 16, 19, 21, 22
23 Harvest late silage 16, 19
24 Earlier lambing 2, 16, 19
25 Increased stocking rates 20, 21
26 On farm heat/power units; Bio-digesters 19
27 Increase manure storage capacity 8, 19
28 Introduce beef finishing in preference to store cattle 19
29 Introduce softer breeds with better carcass composition and milking qualities 4, 16, 19, 20
30 Grow drought resistant forage e.g. maize or lucerne 1, 15, 16, 17, 19, 21, 22
31 House stock 2, 4, 16, 19, 22
32 Increased use of rotation and short term leys 16, 17, 19, 20, 21, 22
33 Increased use of old permanent pasture (common 2, 16, 19
Page 31

Adaptation Description Reference
grazing)
34 Introduce summer finishing indoors 19
35 Increased use of mix of forages including catch crops 1, 16, 19, 21, 22
36 Improved feed bin cleanliness and design 3
37 Reduced stocking rates 2, 16, 19, 20
38 Trough feeding as opposed to broadcast 3
39 Additional processing of feed 19
40 Earlier housing at lambing and later turnout after lambing 4, 16, 19, 20
41 Introduce free draining material around house 3
42 Concrete directly around house and clean regularly 3
43 Collect eggs more often 3
44 Follow GAP guidelines 16, 19
45 Improve drainage systems and flood protection 1, 13, 14, 16, 19, 20, 21
46 Improve runoff containment 16, 19, 20
47 Create hard standings 3
48 Access alternative water supply e.g. borehole; use of 'grey' water e.g. for wallows 16, 19, 20, 22
49 Transporters featuring on-board mechanical ventilation systems 6, 7, 16, 19
50 Use of flotation tyres in slurry spreading equipment; umbilical cord slurry application 19
51 Use deeper rooting and more persistent grass species to maintain pasture 1, 2, 16, 19, 20, 21
52 Acid treatments to kill moulds 3
53 Tents for breeding 16
54 Availability of spare paddocks 16, 19
55 Alternate field entry/exits to avoid rutting 16, 19, 21
56 Alternate paddock orientation to avoid 'water chutes' 16, 19, 20, 21
57 Avoid steeply sloping land 16, 19, 20
58 Heavier arcs, better tent fixings 16, 19
59 Improved construction/durability to wind damage 16, 19
60 Arcs with rear openings to provide additional ventilation 16, 19
61 Adapted vehicles/feeding equipment for wet conditions 16, 19
62 Provide additional bedding inside and out-use of straw as doormat 2, 3
63 Nocturnal catching/thinning 2, 6, 7, 16, 19, 20, 22
64 Vaccinate 16, 18, 19
Page 32

Adaptation Description Reference
65 Grow heat tolerant and drought resistant varieties/crops
1, 4, 11, 13, 14, 16, 17, 19, 20, 21, 22
66 Increased usage of pesticide/herbicide/fungicide 16, 19, 22
67 Change in type of pesticide/herbicide/fungicide 16, 19
68 Grow less susceptible crops 4, 5, 8, 9, 11, 15, 16, 17, 19, 20, 21, 22
69 Grow earlier maturing varieties 4, 9, 11, 16, 17, 19, 20, 21, 22
70 Move production to cooler N and W of UK 16, 19
71 Adopt flexible operational strategy 1, 4, 15, 16, 11, 19, 20, 21, 22, 23
72 Flexibility WRT autumn versus spring sown crops 9, 16, 19, 20, 21, 22
73 Double crop 9, 17, 22
74 Extend geographical range of suitable production areas
1, 9, 13, 14, 16, 17, 19, 20, 21, 22
75 Reduce area required to meet demand 13, 14, 17
76 Adopt non-agricultural use 4, 8, 13, 14, 17, 19, 22
77 Increased chemical applications 16, 19, 22
78 Increased cultural/mechanical weed control 16, 19
79 Need for better herbicides 16, 19
80 Cool storage 19
81 Spread risk - grow range of varieties with different flowering dates
4, 9, 11, 15, 16, 17, 19, 20, 21, 22
82 Increase range of equipment and specification 11, 16, 17, 19, 20
83 Install or increase irrigation capacity 1, 9, 11, 13, 14, 16, 17, 19, 20, 21, 22, 23
84 Change pesticide usage 16, 19
85 Increased pest and disease surveillance 16, 19, 20
86 Grow on lighter soils 8, 16, 19
87 Harvest earlier with yield and quality penalty 4, 9, 17, 19, 22
88 Adopt soil conservation techniques e.g. cover crops, contour ploughing
8, 9, 11, 17, 16, 19, 20, 21, 22, 23
89 Use foliar rather than soil applied herbicides 16, 19
90 Better management - cultivar and plant nutrition 8, 11, 16, 17, 19, 20, 22
91 Increased use of inter-row cover crops 17
92 Thermal screens 11, 16, 19
93 Expand use of crop shading 11, 16, 19
94 Increased use of crop covers 11, 19
95 Higher levels of crop management 9, 11, 16, 17, 19, 20, 23
96 Investment in storage and transport temperature control 11, 16, 19, 20
Page 33

Adaptation Description Reference
97 Water harvesting and storage 1, 4, 9, 13, 14, 16, 17, 19, 20, 21, 22, 23
98 Amend pruning regime 2, 7
99 Increase application of trace elements like calcium 16
100 Target production for certain periods of the year only 16, 19, 20
101 Lower fungicide usage 16, 19
102 Change shift patterns 2, 19, 20
103 Air-condition machinery cabs 2
104 Pre-harvest irrigation 13, 14
105 Change crop programming and marketing schedule 2, 4, 9, 11, 19, 20
106 Access more casual labour 2
107 Increased use of compost and green manures 16
108 Increased crop rotation 16, 17, 19, 20, 21, 22
109 Apply second application of growth regulator 2
110 Frost burners 2, 5
111 Frost windmills 2, 5
112 Irrigate 13, 14, 16, 19, 20, 21, 22
113 Dormancy-breaking sprays 16, 19
114 Production planning e.g. site avoidance 16, 19, 20, 21
115 Grow crop under cover e.g. Spanish tunnels 11, 16, 19
116 Artificial lighting 16, 19
117 Terminate crop early 4, 9, 20, 22
118 Train pickers 2, 3
119 Weather monitoring 5, 8, 9, 19, 20, 22, 23
120 Move crops to more sheltered sites 9, 17, 19, 20, 21
121 Install backup generator 2, 3
122 Use of mulches 16
123 Plant windbreaks 9, 11, 16, 17, 19, 20, 21
124 Use artificial windbreaks e.g. netting 9, 11, 16, 17, 19, 20
Page 34

5.2 Adaptation Bibliography1. Adams, R.M., B.H. Hurd, S. Lenhart and N. Leary, 1998. Effects of global change
on agriculture: an interpretative review. Climate Research 11, pp. 19-30
2. ADAS, 1995. Review of the direct effects of the dry and hot summer of 1995 on decision making of the individual farmer. Final report to Defra on project CC0322, ADAS Wolverhampton.
3. ADAS, 2001. The wet autumn of 2000: implications for agriculture. Final report to Defra on project CC0372, ADAS Wolverhampton.
4. ADAS, 2006. Farmers’ intentions in the context of the CAP reform – analysis of ADAS Farmers’ Voice 2006 survey of England and Wales. Defra, London. 120pp
5. Atkinson, C.J., R.J. Sunley, H.G. Jones, R. Brennan and P. Darby, 2004. Defra Desk Study on winter chill in fruit. Final report for Defra (project code CTC0206)
6. DARDNI, 2005. Transporting livestock and poultry in hot weather. Press release 198/05 1st July 2005. 3pp. url: http://www.thepigsite.com/swinenews/9716/transporting-livestock-and-poultry-in-hot-weather [accessed on 28th March 2008]
7. Defra, 2005. Heat Stress in Poultry. Defra, London. 28pp
8. Defra, 2006. Climate Change: the UK Programme 2006. Defra, London. 202pp
9. Easterling, W.E., 1996. Adapting North American agriculture to climate change in review. Agricultural and Forest Metereology 80, pp. 1-53
10. Easterling, W.E., B.H. Hurd and J.B. Smith, 2004. Coping with global climate change: the role of adaptation in the United States. Pew Center on Global Climate Change, Arlington, VA. 52pp
11. Easterling, W. and M. Apps, 2005. Assessing the consequences of climate change for food and forest resources: a view from the IPCC. Climatic Change 70, pp.165-189
12. Farmers’ Guardian, 2003. Dry weather takes its toll on arable crops and feed supplies. 24th October, 2005 pp. 14
13. Holman, I.P., M.D.A. Rounsevell, S. Shackley, P.A. Harrison, R.J. Nicholls, P.M. Berry and E. Audsley, 2005a. A regional, multi-sectoral and integrated assessment of the impacts of climate and socio-economic change in the UK: Part I. Methodology. Climatic Change 71, pp. 9-41
14. Holman, I.P., R.J. Nicholls, P.M. Berry, P.A. Harrison, E. Audsley, S. Shackley and M.D.A. Rounsevell 2005b. A regional, multi-sectoral and integrated assessment of the impacts of climate and socio-economic change in the UK: Part II. Results. Climatic Change 71, pp. 43-73
15. Lotter, D.W., R. Seidel and W. Liebhardt, 2003. Performance of organic and conventional cropping systems in an extreme climate year. American Journal of Alternative Agriculture, 18 (3), pp.146-54
16. MAFF, 2000. Climate Change & Agriculture in the United Kingdom. London: MAFF, 65pp
17. Maracchi, G., O. Sirotenko and M. Bindi, 2005. Impacts of present and future climate variability on agriculture and forestry in the temperate regions: Europe. Climatic Change 70, pp. 117-195
18. Mlot, C., 2006. Spread of tropical livestock virus linked to climate change. BioScience 56 (12), pp. 1028
Page 35

19. NFU, 2005. Agriculture and Climate Change. NFU, 52pp
20. Smit, B. and M.W. Skinner, 2002. Adaptation options in agriculture to climate change: a typology. Mitigation and Adaptation Strategies for Global Change 7, pp. 85-114
21. Wall, E. and B. Smit, 2005. Climate change adaptation in light of sustainable agriculture. Journal of Sustainable Agriculture 27 (1), pp. 119-123
22. West, C.C. and Gawith, M.J. [Eds.], 2005. Measuring progress: Preparing for climate change through the UK Climate Impacts Programme. UKCIP, Oxford. 72pp
23. World Meteorological Organisation, 2002. Application of Climate Forecasts for Agriculture: Proceedings of an Expert Group Meeting for Regional Association I (Africa) (9-19 December 2002, Banjul, Gambia). WMO/TD-No. 1223. 195pp
Page 36

6. Second Farmer Focus Group Consultation Six focus groups were undertaken across the UK with farmers working on a range of different farm types and within different regions. The consultations took place between 19th March and 3rd April 2007. The regions (and towns) in which the groups took place, together with types of participants present were:
South and East (Wisbech) – arable/horticulture
Welsh Borders (Hereford) – mixed, but focus was upon arable/horticulture
Northern Ireland (Coleraine) – mixed, but focus was upon livestock
North Scotland (Aberdeenshire) – mixed, but focus was upon livestock
South West (Barnstaple) - livestock
North East (Malton, N Yorkshire) – mixed, but focus upon pigs and poultry
The objective of the discussions was to obtain views from farmers towards proposed adaptations to changing extreme events. Further details regarding the composition of each group can be found in Appendix C.
6.1 Focus Group Assessment of the Proposed Adaptations The consultations yielded a wealth of opinion with regards to the ‘long list’ of adaptations suggested by both the literature review and the sectoral experts. These are summarised in Table 12. It should be noted that within the free ranging consultations opinions were not expressed on all adaptations, for some adaptations the opinion was divided and some adaptations only applied to one or some of the sectors and as such Table 12 has been populated as far as possible. It should be emphasised that the groups were deliberately limited in size to allow for in-depth discussion, and as such the opinions expressed cannot be said to be representative of all farmers.
It will be noted from Table 12 that farmers were prepared to consider the implementation of most of the adaptations, should the need arise. There were a number of adaptations that they considered as standard practice or dismissed as being too expensive, impractical or unlikely. However, there were also a few that they emphasised the importance of going forward (subjectively ranked as of moderate or high importance). These assessments were used along with the sectoral expert’s opinion to inform the selection of the adaptations used in the economic costing.
There were a number of headline issues which arose during the discussions and these are summarised below:
Impact before adaptation: All farmers noted that they would not invest in adapting to an extreme that they have not experienced yet. Most farmers believed that between 2 and 5 years of largely consistent weather (possibly 3 out of 5 years) would be required before they would consider adapting.
Type of adaptation: Most believe that autonomous adaptation which has always happened within the industry as it evolves is the most likely.
Existing Implementation: Many of the low cost or simple operational adaptations are currently being used, for example, choosing which field to put stock into during hot periods to maximise the provision of shade.
Drivers: The driver for implementation of some of the adaptations is not necessarily climate related. For example, winter shearing of sheep is being practiced quite widely but driven by factors like cleaner fleece and ease of
Page 37

assessment of animal health rather than an attempt to reduce heat stress during spring/summer. Similarly, the production of forage/catch crops to ensure year round feed supply is being practiced more frequently but often driven by CAP reform and the reduction in stocking rates and farm subsidies.
Spatial Variability: The response to the threat of extremes varies widely across the UK, for example, with Scottish and Northern Ireland participants suggesting that they did not feel extreme heat would ever be a problem within their countries. Similarly, the extent, importance and nature of the different sectors varies within each country/region and as a result different emphases are placed on some extremes and adaptations e.g. sheep are not typically finished and ergo shorn in northern Scotland and the ability to produce forage maize for silage is limited by regional climate.
Problem Swapping: The solution of some problems through implementation of an adaptation may lead to another problem, for example, the provision of shade for sheep to reduce heat stress during summer heat waves, either through increased hedgerow or trees, also encourages flies and these bring additional disease risk. Similarly, the use of mulch leads to an increase in vermin like slugs and mice.
Economics: Farmers are very sensitive to the finances associated with the adaptations. Adaptations with perceived large capital investment are considered less likely to be adopted owing to the economics of their sector e.g. drilling a £6000 borehole for livestock watering. Likewise, the margins are all important, for example, changes in breed/crop/variety would only be considered, even if more drought or heat tolerant, if the margins were better.
Positive Exploitations: Although limited, there are examples of farmers exploiting changing climate (not necessarily just extremes), for example in Herefordshire the planting swedes after barley; the emergence of strawberries as a major crop; the production of late raspberries on account of the later autumn.
Control: Farmers felt that some of the impacts of extremes could not be addressed through adaptation, e.g. flooding. Another is the transporting of animals which is often dictated by the transport contractor with the farmer having no influence over the time or type of vehicle.
Information: Most farmers believe that the provision of accurate long range weather forecasts was important. They also believed that the provisions of information highlighting what options (e.g. new varieties and crops) were available and what adaptations others were trying and were working would be useful. There were no strong feelings on how this information should be disseminated, either through the farming media or farm demonstrations.
In summary, farmers are very open to a wide range of adaptation ideas. However, the implementation thereof will be driven by whether they perceive there to be a climate/weather impact and will be a function of market forces and/or regulation.
Page 38

Table 12: Summary of the Focus Group assessment of the proposed adaptationsAdaptation Description Cattle Sheep Pigs Poultry Arable Horticulture1 Housing redesign - improved insulation C
2 Housing redesign - portable ventilation H H3 Housing redesign - improved permanent ventilation H H4 Housing redesign - ventilation with evaporative cooling C
5 Housing redesign - sprays/misters C
6 Winter Shearing S/C
7 Thinning of stock numbers prior to extreme D D R8 Dietary change - supplement/improved feed, Buffer feeding S S D D9 Summer housing of animals D
10 Nocturnal grazing/diurnal housing D
11 Provision of shade D M H/S
14 Coincide 60 day dry period with mid summer and calve in September C
15 Use different breeds C C C C16 Nocturnal grazing D
17 Night transport/Cooled transport H H H H18 Avoid heat of the day C C C
21 Leave flock outdoors at night D22 Extend grazing season C/S C/S
23 Harvest late silage S S
24 Earlier lambing C/S
25 Increased stocking rates D D D D26 On farm heat/power units; Bio-digesters D D D D D D27 Increase manure storage capacity D/R
28 Introduce beef finishing in preference to store cattle C
29 Introduce softer breeds with better carcass composition and milking qualities C C C
30 Grow drought resistant forage e.g. maize or lucerne C
31 House stock S/D
32 Increased use of rotation and short term leys S S S
33 Increased use of old permanent pasture (common grazing) C C
34 Introduce summer finishing indoors D
35 Increased use of mix of forages including catch crops C/R
36 Improved feed bin cleanliness and design D/C
Page 39

Adaptation Description Cattle Sheep Pigs Poultry Arable Horticulture37 Reduced stocking rates D
38 Trough feeding as opposed to broadcast S
39 Additional processing of feed D40 Earlier housing at lambing and later turnout after lambing C/D
41 Introduce free draining material around house C/S42 Concrete directly around house and clean regularly C/S43 Collect eggs more often D44 Follow GAP guidelines C/R45 Improve drainage systems and flood protection S S S S S S46 Improve runoff containment S/R S/R S/R S/R S/R S/R47 Create hard standings D D
48 Access alternative water supply e.g. borehole; use of 'grey' water H H H
49 Transporters featuring on-board mechanical ventilation systems H H H H50 Use of flotation tyres in slurry spreading equipment; umbilical cord slurry application S S S
51 Use deeper rooting and more persistent grass species to maintain pasture, C C C C52 Acid treatments to kill moulds S/D
53 Tents for breeding D
54 Availability of spare paddocks D D D
55 Alternate field entry/exits to avoid rutting S S S
56 Alternate paddock orientation to avoid 'water chutes'
57 Avoid steeply sloping land S S S
58 Heavier arcs, better tent fixings C
59 Improved construction/durability to wind damage C C C C C C60 Arcs with rear openings to provide additional ventilation C
61 Adapted vehicles/feeding equipment for wet conditions D D D D D D63 Nocturnal catching/thinning C/S
64 Vaccinate H65 Grow drought tolerant crops C C68 Grow crops that are less susceptible to disease C C69 Grow earlier maturing crops C71 Change cropping plans D72 Autumn versus spring sowing U/D73 Double crop U/S/D76 Adopt non-agricultural uses D D D D D D
Page 40

Adaptation Description Cattle Sheep Pigs Poultry Arable Horticulture77 Increased pesticide/herbicide use H H78 Increased cultural/mechanical weed control H H81 Grow a range of varieties to spread flowering risk D/C D/C82 Increased equipment specification/Improved nozzle specification C/D C/D85 Crop monitoring for pests S S87 Harvest earlier D88 Contour plough C/S89 Foliar rather than soil applied herbicides S/R S/R91 Increased use of inter-row crops C C92 Thermal screens D96 Cooling at harvest H H97 Storage reservoirs/Water capture H H H H99 Increased application of calcium to some crops C/S102 Changes in work patterns S S S S S S103 Air-condition vehicles S S S S S S104 Irrigate prior to harvesting106 Increase in casual labour D D D D D D116 Artificial lighting D D118 Increased training of pickers D119 Weather monitoring to ensure optimum spraying S S121 Standby generators C C C C C C123 Windbreaks S S125 Provide additional water through mains C C C126 Housing redesign - increase building height when build C C127 Minimal/alternate cultivation C C128 Increase/cease production in parts of the year D D129 Tracked vehicles D D D D D D130 Installation of gutters C/D131 Emergency action plans S132 Increased use of mulches and hand weeding D
C = Would consider implementing if extreme becomes a problem S = Considered standard practice within the industryM = Moderate importance placed on this adaptation H = High importance placed on this adaptationR = Regulatory/Code of practice driven D = Dismissed as too expensive, impractical, unlikely, not available, not relevant to farmers presentU = Uncertain
Page 41
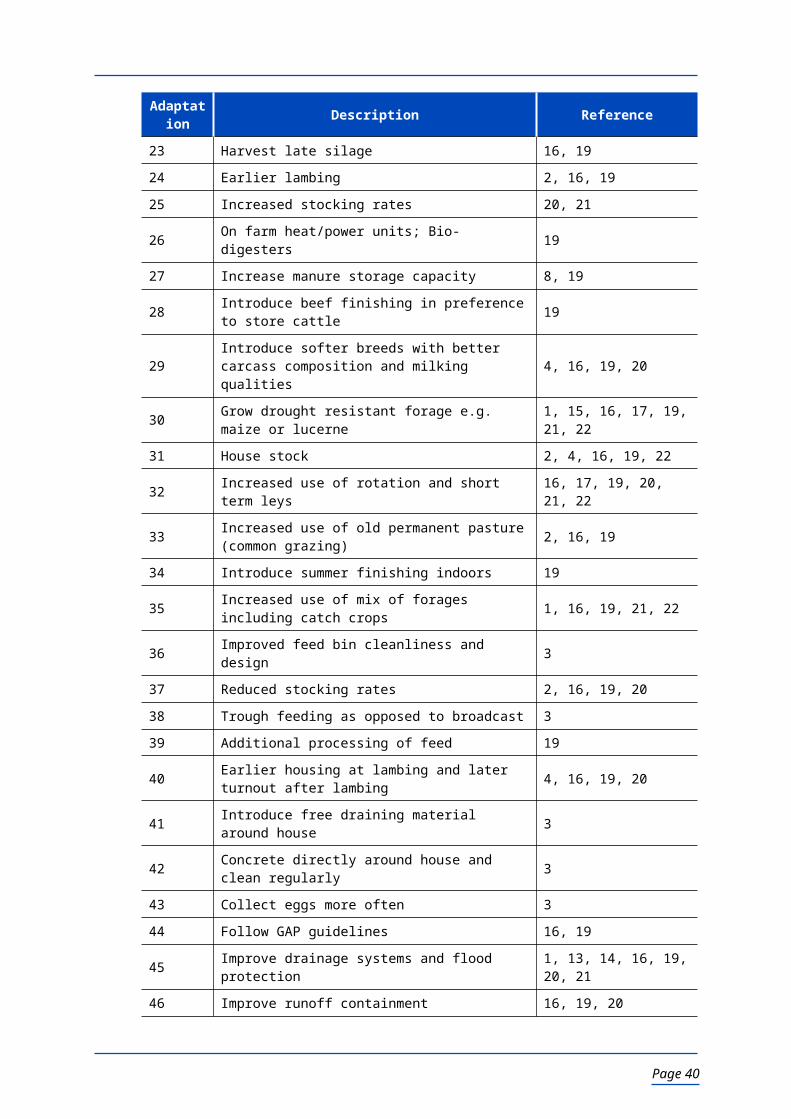
7. ADAS Farmers’ Voice Climate Change Findings (2005 to 2007) ADAS Farmers’ Voice is a large-scale survey of farmers in England and Wales. It was first conducted by ADAS in 1999 and repeated in the years 2000, 2002, 2004 to 2007. The survey has become an established source of reference for government and decision-makers in the industry.
ADAS Farmers’ Voice takes the form of a self-completion postal questionnaire. The focus of the survey is on strategic issues facing today’s farm businesses, which include extreme weather patterns. In addition to the inclusion of repeat questions that allow changing attitudes to be tracked over time, the survey also investigates subjects of a topical nature, like climate change.
7.1 Overview of MethodologyTo undertake the survey, a randomly drawn sample of 12,000 holdings, stratified by region, is drawn annually from an in-house database containing approximately 47,000 holdings. The questionnaire is dispatched in January of each year, and in 2005, over 1,000 responded, while in 2006 and 2007 over 2,000 were returned.
Data is weighted according to Defra standard farm type and size definitions and these, together with standard Government Office Region, are often used in the analysis. The ability to cross analyse the data by responses to any of its questions, is one of the strengths of the ADAS Farmers’ Voice.
As part of this project the 2005 and 2006 survey contained questions on farmers’ experience and understanding of extreme weather events and future climate change. In 2007, the level of concern towards extreme weather patterns was identified, together with the degree to which farmers have adapted to such extremes.
In general the responses showed a low level of both reactive and planned adaptation activities. The range of actions that are being undertaken or are planned is lower for reactions to past extremes than it is within future plans, reflecting partly a limited experience of past weather extremes and a greater range of future climate change patterns.
7.2 Experience of Extreme WeatherIn respect of extreme weather events, in 2005, the vast majority of respondents stated they had either not responded to recent extremes (43% in England and 33% in Wales) and/or that they had no recent experience of extreme events (38% in England and 50% in Wales). Of those who have adapted their practice following recent extremes the general cropping sector showed the largest response in England (22%), with the response rate also rising with farm size (14% small, 17% medium and 22% large farms) across all sectors. It is interesting to note though that the adaptation responses are not focused within traditional general cropping areas (Figure 10). North West and West Midlands showed the highest adaptation rates (25% and 20% respectively) with the East of the country showing the least (14 %). The average regional response rate is just 16%. The particularly high response rate in the North West may be a reflection of the extreme rainfall experienced in January 2005 around Carlisle.
Page 42

Figure 10: Percentage of farmers reporting an adaptation to extreme weather by region
A variety of adaptation responses had been undertaken in 2005 following recent weather extremes, with a number of farmers undertaking more than one adaptation (average of 1.25 adaptations in England and 1.31 in Wales). Changes in the timing or methods of production were the most common responses (housing livestock earlier/later – 11% in England, 9% in Wales, Changes from crops to grassland – 11% in England, timing of lambing – 12% in Wales, and Changed cropping pattern/harvest timing/drilling methods – 23% in England). Most of these adaptations are reactive responses to weather conditions, and often require no additional expenditure/specialist knowledge. However, long-term adaptations/capital expenditure measures were also indicated (Built/improved buildings – 10% in England and 12% in Wales, installed new water sources/reservoirs – 4% in England and 15% in Wales).
Cattle and sheep farmers, and cereal farmers in England showed greatest range of responses (1.34 and 1.29 actions per respondent), with most including a change in the timing of operations, whilst mixed farms showed fewest adaptations (1.15 actions). Again larger and medium size farms were more likely to be undertaking a range of measures than small farms in England (1.3, 1.29 and 1.17 adaptations respectively).
7.3 Intended AdaptationsIn the 2006 Farmers’ Voice survey, respondents were asked if they intended to change their farming practice within the next five years, and if so, in what ways.
“Within the next five years, in what ways do you intend to change your farming business in response to climate change? If you do not intend to make any changes, please tick here”.
In 2005, the comparative question asked was,
“Climate change may lead to drier, hotter summers and warmer, wetter winters - when, if at all, do you expect to have to adapt your farming business to take account of such impacts?”Already adapting/Between 1 to 5 years from now/Between 5 to 10 years from now/Between 10 to 15 years from now/Not for 15 years or more from now/No adaptation anticipated”
Page 43

The proportion of respondents intending to adapt in response to climate change within the following five years increased in 2006, compared to 2005 (44% in 2006, 28% in 2005).
The proportion of respondents intending to change in response to climate change within five years was slightly higher in 2006 than for 2005 in England (46% in 2006, 40% in 2005). For Wales, a slight decrease was reported (34% in 2006, 41% in 2005) in those stating that they do intend to make adaptations within this timeframe.
In 2006, pig and poultry were again one of the sectors least likely to be responding to climate change (39%) but cattle and sheep, and surprisingly horticultural producers also gave a small number of positive responses (39% and 38% respectively). The least positive response were in Wales (34%) and the North East of England (39%), with Yorkshire and Humberside farmers showing greatest willingness to adapt to climate change (54% stating that they intend to change their business in response to climate change.
Those respondents aiming to adapt their farm business in response to future climate change over the next 5 years also have chosen a variety of adaptations ( See Table 13 where average of 1.9 in England and 1.8 in Wales). The South and East of England showed the highest number of average responses, with large farms also showing a greater range of responses than medium or small farms. Table 14 reveals the ways in which those adapting to climate change plan on adapting.
Table 13: Average number of different adaptations to be undertaken within the next 5 years from 2006
Region Average number of climate change adaptations
North East 1.91
North West 1.85
Yorks & Humber 1.83
East Mids 1.77
West Mids 1.85
Eastern 2.11
South East 2.02
South West 2.14
Wales 1.80
Page 44

Table 14: Adaptations intended as a result of climate change by region in 2006
Adaptation North East
North West
Yorks & Humber
East Mids
West Mids Eastern South
EastSouth West Wales
Replace existing crops/livestock with new varieties
30% 11% 29% 23% 10% 36% 27% 24% 7%
Introduce new types of crops/livestock alongside those currently grown/kept
24% 13% 31% 23% 34% 32% 27% 27% 12%
Increase off farm income sources 46% 31% 44% 51% 40% 50% 36% 40% 30%
Invest in irrigation 4% 8% 2% 3% 5% 12% 17% 1% 3%
Invest in livestock housing 9% 24% 9% 9% 15% 5% 13% 18% 29%
House livestock earlier/later in the year
27% 37% 12% 15% 25% 6% 20% 32% 39%
Change timing of sowing/spraying/ fertiliser application
37% 36% 45% 37% 31% 51% 37% 37% 3%
Cut down on stock 0% 18% 0% 11% 0% 5% 3% 0% 12%
Continuous review/ will respond as required
14% 18% 20% 38% 7% 0% 22% 17% 9%
Energy (bio-crops/ hydro/wind power etc)
0% 4% 36% 11% 8% 30% 0% 14% 0%
Will retire/sell up/ emigrate 18% 18% 17% 0% 23% 30% 10% 15% 12%
Will stop main stream farming/ diversify (unspec)
0% 25% 0% 0% 3% 0% 0% 0% 0%
Reduce energy use 0% 6% 12% 16% 0% 0% 5% 0% 0%
Plant woodland 0% 10% 0% 0% 31% 0% 0% 5% 0%
Change heating (new heaters/lower temperatures)
0% 0% 0% 0% 0% 0% 0% 18% 0%
Convert to organic 0% 0% 0% 0% 0% 0% 0% 3% 0%
Let out/lease land 0% 0% 0% 0% 0% 0% 0% 0% 24%
Livestock will stay outside 14% 0% 0% 0% 0% 0% 0% 9% 0%
Increasing off-farm income or getting out of farming altogether are popular adaptation choices in both England (41%, and 16% respectively) and Wales (30%, and 12% respectively). Alternative or new crops/livestock breeds were also commonly suggested (23% and 26% in England and 7% and 12% in Wales), as were changes to the timing of farming activities such as sowing/spraying/fertiliser application and housing livestock. Large farms in England show a greater tendency towards investment-based responses (increased irrigation and livestock housing) than smaller and medium sized enterprises.
Page 45

7.4 Understanding of Climate ChangeDespite the activities being undertaken to adjust to weather extremes, in 2005, there was a lack of knowledge about how they relate to climate change and to the impact of climate change in general. In 2005, approaching half (42%) of farmers who have responded to weather extremes feel they are poorly or not at all informed about climate change (see Figure 11).
Figure 11: Relationship between adaptation response and level of knowledge of the climate change issue across England and Wales in 2005
In 2005, only 6% of respondents in England and Wales felt they were well informed about the issue, whilst 11% felt they were not at all informed about it.
7.5 Impact of Climate Change upon Business PerformanceIn 2005, most respondents felt climate change would have a neutral effect on their business performance or they were unsure what the effect would be (71%). In those regions in which farmers were more likely to state an intention to adapt to climate change (Table 15), more farmers stated it was a negative effect, particularly in the North East, South East and Wales (22%, 18% and 23% respectively) than a positive one (17% in South West, 14% in the North West).
Overall only 6% of respondents in England and 4% in Wales felt they were well informed about the issue, whilst 11% in England and 12% in Wales felt they were not at all informed about it. The pig and poultry and horticultural sectors in England show the lowest awareness of the issue (48% and 51% respectively stating they were not or poorly informed on the topic).
Page 46

Table 15: Attitudes towards overall impact of climate change on performance of farm business by Government Region (in 2005)
Impact Positive Neutral Negative Don’t know Number responding
North East 10 35 22 28 59
North West 14 41 11 34 115
Yorks & Humberside 6 36 13 43 83
East Midlands 7 43 15 31 87
West Midland 11 43 11 33 137
Eastern region 9 47 16 25 142
South East 12 37 18 31 258
South West 17 43 12 26 144
Wales 9 33 23 29 194
A large number of the farmers who responded to the survey in 2005 did not feel they would need to adapt to climate change (32% of respondents in England and 26% in Wales). A quarter (24%) in both countries stated they already were adapting, however in England this high average is largely driven by the large response from the horticultural sector, where despite respondents feeling uninformed about climate change, 43% stated that they are already adapting to it. In contrast, pig and poultry farmers showed that their lack of awareness of the issue is also translated into lack of anticipated adaptation need, with 55% of respondents stating that they would not be responding to climate change. Around one in five (18%) of those not already adapting in 2005 but who are intending to, felt they will respond over the medium term (10-15 years). A cross analysis of information levels against timeline for adaptation (Figure 12) shows that farmers that consider themselves to be better informed farmers are more likely to be responding already or to respond over the next 5 years.
Page 47

Figure 12: Relationship between knowledge of climate change issue and the timescale for response over England and Wales in 2005
7.6 Type of Extreme Causing ConcernThe type of extremes that farmers are concerned about and the degree to which they are concerned is summarised in Figure 13. Here it will be noted that drier summers, wetter winters, intense rainfall and extremely high temperatures are of most concern to farmers. Further exploration of the results by sector, farm size and region indicates that there are some variations by sector and region. These are summarised below:
1. Prolonged summer drought: Those with horticultural or general cropping holdings and those based in the West Midlands, Eastern and South East are the most concerned while pig and poultry farmers and those based in the North East and North West are the least concerned.
2. Prolonged wet winter: Those most concerned are those with horticulture businesses and those with livestock, presumably on account of increased housing periods.
3. Intense Rainfall: There are high levels of concern across all sectors, farm sizes and regions although the horticulture section is the most concerned and the pig/poultry sector the least.
4. Extremely high temperatures: Those in Horticulture, the West Midlands and the South East are the most concerned while livestock and pig and poultry farmers and those in the North East are the least concerned.
5. Unseasonal Frost: The horticulture sector was again the most concerned about unseasonal frost while the rest were not. Northerly and westerly regions are less concerned than southerly and easterly regions.
6. Growing season start/end: The horticulture sector was more concerned than other sectors which in general were unconcerned about an earlier start or later end to the growing season.
Page 48

The survey also sought other extremes that were of concern to farmers. In doing so, it was found that wind was by far the most concerning other extreme to all sectors, farm sizes and regions.
Figure 13: Level of concern towards extreme weather patterns
5%
6%
7%
16%
18%
21%
26%
36%
33%
41%
51%
52%
50%
47%
40%
40%
34%
20%
17%
17%
15%
0% 10% 20% 30% 40% 50% 60% 70% 80% 90% 100%
Unseasonal Frost
Growing Season Start/End
Intensity/Frequency of Frost
Extremely High Temperature
Intense Rain
Prolonged Wet Winter
Prolonged Summer Drought
Very Concerned Concerned Not Concerned
Note: Totals do not equal 100% due to exclusion of “Not stated”
7.7 Comparison between Concern and Adaptation Figure 14 indicates that those extremes for which concern is greatest, i.e. drier summers, wetter winters, intense rainfall and extremely high temperatures, have the highest levels of adaptation associated with them ranging between 9 and 14%. The levels of adaptation associated with the change in season length are also high, presumably a function of farmers not only mitigating risk but also exploiting the changing conditions to their benefit.
Figure 14: Summary graph of the degree to which farmers have adapted to weather extremes according to level of concern
9%
14%
6%
10%
9%
12%
14%
41%
39%
48%
67%
70%
71%
73%
0% 10% 20% 30% 40% 50% 60% 70% 80%
Unseasonal Frost
Growing Season Start/End
Intensity/Frequency of Frost
Extremely High Temperature
Intense Rain
Prolonged Wet Winter
Prolonged Summer Drought
Already Adapting Very Concerned/Concerned
Page 49

Having seen the relatively high levels of concern expressed by farmers towards some of the extremes listed, it is interesting to discover that the proportion of farmers who have already adapted to each extreme is, in most instances, markedly lower than the proportion stating they are very concerned about it. The majority of farmers (71%) did not indicate that they were adapting to any of the conditions shown.
Whilst farmers are concerned, it would appear that they feel it to be a future, rather than, existing issue to resolve. Another interpretation may be that farmers are poorly informed (see section 7.5) and unsure of what mitigation measures to put in place, or indeed, may be unable to do so. Analysis of the extent of the adaptation already being undertaken in response to each extreme by each sector indicates that the degree of adaptation between sectors is variable and that some sectors appear to be more proactive than others. For example, pig and poultry units display consistently low levels of adaptation across all extremes while the cattle/sheep and horticultural sectors demonstrate consistently high levels of adaptation. What is unknown from this data is if the adaptation was adopted purely as a response to climatic extremes or if other factors were part of the decision making process. Analysis of the extent of the adaptation already being undertaken in response to each extreme by farm size indicates that smaller farms are most responsive while medium size operations are the least. This is as one would expect with smaller farms being more sensitive to risk and the larger operations having the funds to invest in capital outlay. What is not demonstrated by these statistics is the type of adaptations being employed, for example are the smaller operations adopting the lower cost more operational type options while the larger farms are making more capital investments? Analysis of the extent of the adaptation already being undertaken in response to each extreme by each region, as illustrated in Figure 15, indicates that the degree of adaptation between regions is variable and that some regions appear to be more proactive than others. For example, the North East has consistently low levels of adaptation while the East Midlands have consistently high levels of adaptation. Underlying reasons for this may, in part, relate to the farm types associated with each region, for example the South West is a traditional livestock region, or they may reflect the success of advisory services and Regional Climate Change Partnerships in convincing the regional farming community to adapt.
Figure 15: Summary graph of the degree to which farmers in the different regions have adapted their operations/practices in response to climatic extremes
2
2
5
2
3
3
6
10
9
10
13
8
6
10
7
7
8
7
9
8
8
18
22
13
22
15
11
13
8
11
7
9
11
13
12
8
7
10
12
9
8
5
18
22
19
17
15
21
11
24
17
19
15
19
22
22
6
4
9
4
10
7
12
0% 20% 40% 60% 80% 100%
Extremely high temperatures
Occurrence of unseasonal frost
Intense rainfall events
Reduction in intensity/frequency of frost
Start and/or end of growing season
Prolonged summer drought
Prolonged wet winter weather
North East North West Yorks & Humber East Mids West Mids
Eastern South East South West Wales
Page 50

8. Costing of Adaptations
8.1 Selection of Adaptations for Economic Costing The selection of the ‘long list’ of up to 30 adaptations that would be included in the costed adaptation section of the project was undertaken through a sectoral expert workshop. The range of adaptations were assessed in a qualitative fashion considering the outputs from the project produced to this point along with expert opinion, for example given the size of the farmer focus groups if the sectoral experts felt that an adaptation that they had dismissed as unlikely was of sufficient importance this adaptation was considered for inclusion in the ‘long list’. The final selection was considered to be a pragmatic choice of the most important, likely, and practical adaptations. These were representative of a range of climate extremes and of importance to a range of sectors. The adaptations selected are listed in Table 16.
8.2 Objective The objective of the costed adaptations is to assess the impact of the proposed adaptation on the profitability of the respective farming enterprise as well as undertaking an investment appraisal to show the financial return which might be expected from uptake of the adaptation.
The intention is to produce indicative costing for a range of enterprise scenarios. The output from the project will contribute to greater understanding of the key drivers for change in terms of working practice at farm level. The report expands on the costings and addresses other factors considered with regards to behavioural change as well as the environmental consequences of adaptation in the discussion section.
The impact on profit and return on capital results has been used to identify a “short list” of adaptations to be evaluated in greater detail at regional level.
Page 51

Table 16: Long list’ of adaptations chosen for the economic costing exercise
Sector Extreme Adaptation Expert Assessment
Farmer Assessment
Environmental Impacts
Poultry Frequency/timing of heat waves; Frequency of extreme heat Housing redesign - improved permanent ventilation H H L
Pigs Frequency/timing of heat waves; Frequency of extreme heat Housing redesign - improved insulation H S L
Pigs Frequency/timing of heat waves; Frequency of extreme heat Housing redesign - sprays/misters M C/D L
Dairy Frequency/timing of heat waves; Frequency and duration of dry spells Increased use of mix of forages including catch crops M C/H L
Poultry Frequency/timing of heat waves; Frequency of extreme heat Night transport/Cooled transport/Ventilated transport/Reduced animal density for transport H Con M
Sheep Frequency/timing of heat waves; Frequency of extreme heat Night transport/Cooled transport/Ventilated transport/Reduced animal density for transport H Con M
Dairy Rainfall intensity; Frequency/duration of wet spells Improve runoff containment and storage H D L
Beef & Sheep Frequency/timing of heat waves; Frequency/duration of dry spells Storage reservoirs/Water capture H H L
Horticulture - Top fruit Frequency/timing of heat waves; Frequency/duration of dry spells Install or increase irrigation capacity H H L/M
Arable - Root crops Frequency/timing of heat waves; Frequency/duration of dry spells Irrigation- potatoes M - L/M
Horticulture - Vegetables Frequency/timing of heat waves; Frequency/duration of dry spells Irrigation- vegetables (swede) H H L/M
Arable - Root crops Frequency/timing of heat waves; Frequency/timing of frost Cool storage H - M
Horticulture - Soft fruit Frequency/timing of heat waves; Frequency of extreme heat Investment in field cooling and transport temperature control H H L/M
Horticulture - Soft fruit Frequency/timing of heat waves; Frequency/timing of frost Grow new varieties/crops H C L
Horticulture - Vegetables
Growing season length; Frequency/duration of dry spells; Frequency/duration of wet spells Additional crop – vegetables (lettuce) M C/S/D H
Arable - Cereals Rainfall intensity; Frequency/duration of wet spells Adopt soil conservation techniques e.g. contour plough, crop cover H D/C LB
Arable - Cereals Rainfall intensity; Frequency/duration of wet spells Adopt soil conservation techniques e.g. reduced cultivation to improve soil stability M D/C LB
Horticulture - Soft fruit Rainfall intensity; Frequency/duration of wet spells Increased use of mulches H D L/M
Page 52

Sector Extreme Adaptation Expert Assessment
Farmer Assessment
Environmental Impacts
Horticulture - Vegetables Rainfall intensity; Frequency/duration of wet spells Increased use of crop covers M D L/M
Horticulture - Top fruit Rainfall intensity; Frequency/duration of wet spells Increased use of crop covers M D L/M
Dairy Rainfall intensity; Frequency/duration of wet spells Install backup generator H M L
Horticulture - Soft fruit Rainfall intensity; Frequency/duration of wet spells Plant windbreaks M S L
Horticulture - Vegetables Rainfall intensity; Frequency/duration of wet spells Increased use of movable windbreaks M S LB
Arable - Cereals Frequency/timing of heat waves; Frequency/timing of frost Spread risk - grow range of varieties with different flowering dates M CD L
Arable - Cereals Frequency/timing of heat waves; Frequency/duration of dry spells Increase range of equipment and specification M D H
Arable - Cereals Rainfall intensity; Frequency/duration of wet spells Better management – growth regulator H - M
Beef & Dairy Frequency/timing of heat waves; Frequency/timing of frost Housing redesign - improved permanent ventilation H H L
Sheep Frequency/timing of heat waves; Frequency/duration of wet spells Increased frequency of preventative treatment (dipping / poor-on) H H M/H
- = not assessedL = Low importance/Impact M = Moderate Importance/Impact H = High Importance/ImpactC = Consider doing in future LB = Low impact but may also be beneficial to the environment D = Dismissed as too expensive, impractical, unlikely, not available, not applicable to farmers presentS = Standard practice R = Regulatory/Code of practice driven Con = Contractors dictate transport terms
Page 53

8.3 Methodology 8.3.1 Information Needed for the Economic Evaluation
Consultation with the agricultural and horticultural sector experts provided enterprise scenarios considered representative of farms in the UK. Table 17 summarises the selected enterprises against the description of the adaptation to the extreme event.
The sector experts provided:
Descriptions of the current enterprise situation
The impact the respective extreme events would have on enterprise performance
Estimates of capital costs for the adaption
The impact that adoption of the adaptation would have on enterprise performance
8.3.2 Calculation of Impact on Profit The impact of the adaptation on the profitability of the enterprise has been assessed using partial budgeting techniques. Figure 16 demonstrates the structure of the partial budgets.
Figure 16: Structure of the partial budgets
Extra costs as a result of the adaptation, as compared to no action
ACosts Saved as a result of the adaptation, as compared to no action
C
Income lost as a result of the adaptation, as compared to no action
BExtra Income as a result of the adaptation, as compared to no action
D
A + B = X C+D = Y
Impact on Profit Y – X
If Y less X (from Figure 16) is positive, then the impact on the profit of the adaptation is positive. The reverse situation (Y-X is negative) indicates that the adaptation would result in a loss of profit.
8.3.3 Calculation of Return on Capital - Adaptation Involving Capital InvestmentNot all of the adaptations required a capital investment. For those that do require capital investment the investment is assessed by calculation of the internal rate of return (IRR); the net present value (NPV) and the payback period (payback). These have been calculated using discounted cashflow (DCF). The NPV calculates the future value of money at today’s values. The NPV has been calculated by discounting at 10%.
The internal rate of return guides you on your financial journey from the present to the future.
The internal rate of return (IRR) is another means for managers to decide whether to commit to a particular investment opportunity. It is defined as the discount rate, the rate at which the NPV of an investment equals zero. Typically, when the IRR is greater than the opportunity cost (the expected return on a comparable investment) of the capital required, the investment under consideration should be undertaken.
Page 54

The IRR calculation is based on the same algebraic formula as the NPV calculation. With the NPV calculation, you know the desired rate or return and are solving the equation for the net present value of the future cash flows. With IRR, by contrast, the net present value is set at zero and the equation is solved for the rate of return. Your spreadsheet program or calculator will perform IRR calculations for you, just as it will for NPV.
What's a reasonable rate of return for a business to expect on an investment comparable to the one under consideration? Typically, it's well above what they could get on a risk-free investment, such as a Treasury bond.
Discounted Cash Flow - Future value of anticipated cash receipts and expenditures on a specified date. It is computed using net present value (NPV) or internal rate of return (IRR) and is a consideration in analyses of capital and securities investments. The NPV method uses a discounted rate of interest based on the marginal cost of capital to future cash flows to bring them into to the present. The IRR formula finds an investment's average return for the life of the investment. It identifies the discount rate that matches the present value of future cash flows to the investment's cost.
8.3.4 Calculation of Return on Capital - Adaptations which do not Require Capital Investment In the case of adaptations achieved through a change in farming practice which do not require the investment in capital items, the return on capital has been estimated by comparison of the effect on profit against the change in working capital involved in the adaptation.
8.3.5 Adaptations which were not Evaluated There were two scenarios with adaptations that were not evaluated. The first of these relates to a system change in dairy production to increase the use of forage maize in the forage production. This adaptation was proposed to address a year in which the combination of extreme high temperatures coupled with little or no rain results in grass growth ceasing and grass dying off. The justification for not evaluating this scenario is that the adaptation has the potential for significant increase in dairy outputs and dairy profits. This improvement relates to the impact on milk yield due to the inclusion of forage maize in the diet. It is beyond the scope of this project to analyse the response to the extreme event as compared to the impact of changing the winter rations.
The second scenario not evaluated related to increasing the capacity of drains and store to deal with an increased incidence of high intensity rain fall leading to localised flash flooding in the yard areas. The justification for not undertaking the economic evaluation is that there are no returns at all from the adaptation of farming practice. At times when heavy rainfall at a level that cannot be dealt with by the existing drainage and stores on farm, there would be sufficient localised flooding to mask any source of pollution emanating from the yards and buildings. At the same time, the capital costs of increasing the drainage and storage capacity will be tens of thousands of pounds. There is no economic justification for the farmers making the needed investment. The environmental benefits of the investment will not be the main consideration for farm businesses faced with significant capital investment to make the necessary adaptation to cope with the extreme event.
8.3.6 Frequency of Extreme EventAn assessment of the frequency of the extreme event has to be made in order to assess the impact of the event on the selected scenario. Throughout the whole project forecasting the frequency of the extreme event proved to be particularly
Page 55

difficult. In consultation with the technical experts estimations of the frequency of the extreme events were made.
An estimation of the frequency of the event was needed in order to assess the number of years in which the event would not be expected. Adoption of the adaptation in the years that the event did not occur would reduce the profitability of the enterprise.
8.3.7 Behavioural Change - Triggers to Adoption of the AdaptationThe drivers for behavioural change are many and complex. Each individual farmer or grower will respond in unique ways to the external factors and information available to them. The decision making process is further complicated by their interpretation of the information they have, their attitude to risk and many other complex social interactions.
It is beyond the scope of this project to evaluate the processes leading to adoption of the adaptations to mitigate against the anticipated impact of a possible extreme weather event. Previous research studies have clearly demonstrated that in the main farmers are not motivated to maximise profit (Garforth et al 2006). They strive to achieve sufficient profit from their mix of enterprises to meet their personal requirements. The individual requirements for profit vary from farmer to farmer depending on their motivational type and the nature of the decision to be taken. A research report (Angell 1997) short-lists to three types. The resigned pragmatists are certainly not motivated to maximise profit and are prepared to accept lower incomes to maintain a way of life. The second group, referred to as focused specialists, do consider farming as a business and recognise the need for profit in order to continue to farm but would consider themselves in farming for the long-term. The third group are the opportunists. Fewer in number, they are driven by the challenge and the opportunity to make money.
For the purposes of this project, the process leading to changes in farming systems has had to be simplified. The basis of the evaluation has been that the impact on profit and the break even point will be the main trigger for change.
Page 56

Table 17: Description of enterprise scenario in the costed adaptations
Extreme Weather Event Scenario
Adaptation Extreme Enterprise System Enterprise Size
Ventilation Existing Building Frequency/timing of heat waves; Frequency of extreme heat Broilers 120,000 birds
Insulation of existing buildings Frequency/timing of heat waves; Frequency of extreme heat
Outdoor breeding farrowing arc 400 breeding sows
Misting existing buildings Frequency/timing of heat waves; Frequency of extreme heat Finishing Pigs 1000 pigs from 35-105 kg
Year round feed supply - maize silage in dairy Frequency/timing of heat waves; Frequency and duration of dry spells Dairy 100 dairy cows, 60 young stock, 200ac maize
Transporting Poultry to slaughter– Reduction in transport density. Frequency/timing of heat waves; Frequency of extreme heat Poultry 100,000 broilers
Transporting Lambs to slaughter – Reduction in transport density. Frequency/timing of heat waves; Frequency of extreme heat Lambs 400 lambs
Hard standing design spec for flash flooding Rainfall intensity; Frequency/duration of wet spells Dairy 80 hectares 100 cows and 60 youngstock
Water Storage - capture, storage, piping/troughing Frequency/timing of heat waves; Frequency/duration of dry spells Beef & Sheep 500 ewes
Irrigation in Top Fruit Frequency/timing of heat waves; Frequency/duration of dry spells Apples 14 hectares
Irrigation- potatoes Frequency/timing of heat waves; Frequency/duration of dry spells Potatoes 17 hectares
Irrigation- veg Frequency/timing of heat waves; Frequency/duration of dry spells Swede 4 hectare
Long term storage Frequency/timing of heat waves; Frequency/timing of frost Potatoes 1000 tonne store
Storage short term Frequency/timing of heat waves; Frequency of extreme heat Strawberries 35 hectares
Change of Cultivar (perennial) Frequency/timing of heat waves; Frequency/timing of frost Blackcurrants 60 hectares 600,000 bushes
Additional CroppingGrowing season length; Frequency/duration of dry spells; Frequency/duration of wet spells
Little Gem Lettuce 74 hectares
Page 57

Extreme Weather Event Scenario
Adaptation Event Enterprise System Enterprise Size
Soil runoff (slope, soil dependant) - soil cons structures and management costs re maize
Rainfall intensity; Frequency/duration of wet spells Maize silage 12 hectares of maize
Soil runoff (slope, soil dependant) - soil cons structures; plant seedlings/replanting
Rainfall intensity; Frequency/duration of wet spells
A typical arable rotation = wheat, barley, oilseed rape, wheat, barley
117 hectares
Crop splash prevention – soil mulches Covers. Rainfall intensity; Frequency/duration of wet spells Strawberries 16 hectares
Hail netting/covers - leaf damage Rainfall intensity; Frequency/duration of wet spells Baby leaf salad crop 39 hectares
Hail netting/covers - fruit damage Rainfall intensity; Frequency/duration of wet spells Apples 25 hectares
Power Supply Loss due to Wind. Rainfall intensity; Frequency/duration of wet spells Dairy 100 head dairy herd.
Windbreaks - vegetative (crops and infrastructure) – perennial Rainfall intensity; Frequency/duration of wet spells Blackcurrants 60 hectares
Windbreaks – artificial - annual Rainfall intensity; Frequency/duration of wet spells Romaine Lettuce 63 hectares
Cereals - spread flowering risk through different varieties Frequency/timing of heat waves; Frequency/timing of frost Wheat 100 hectares
Bigger/ Stronger Cultivation Machinery Frequency/timing of heat waves; Frequency/duration of dry spells Wheat 100 hectares
Avoidance of lodging through husbandry Rainfall intensity; Frequency/duration of wet spells Wheat 100 hectares
Animal respiratory disease (winter) Frequency/timing of heat waves; Frequency/timing of frost Suckler herd 50 head
Animal summer disease - fly strike Frequency/timing of heat waves; Frequency/duration of wet spells Lowland sheep flock 250 ewes
Page 58

8.4 ResultsThe costed adaptation for each extreme includes the impact on profit and an investment appraisal. For each of the scenarios, a summary table has been prepared. This summary contains a description of the event, the impact that it has on the enterprise, the description of the adaptation and the financial results based on estimates of the frequency of the extreme.
The frequency of the climate extreme was informed by expert opinion to reflect on farm observations of the ADAS sectoral expertise using their first hand experience and knowledge gained working on farm. The sensitivity of the results to changes in the frequency has been evaluated and where necessary frequency estimates revised
8.4.1 Ventilation of Broilers Table 18 summarises the extreme, the impact of the extreme, the likely adaptation and the financial consequences of the adaptation.
Table 18: Summary of the Financial Effect of Improving Ventilation in existing Broiler Production Buildings
Climate extreme Frequency/timing of heat waves; Frequency of extreme heat
Adaptation Improve Ventilation in Existing Building
Impact of Extreme Existing ventilation would be inadequate and would result in higher mortalities and production problems
Description of adaptation Construction of tunnel ventilation and evaporative cooling system
Extreme frequency 2 in 10 years.
Capital invested £64,000
Effect on profit -£9,183
NPV -£56,325
IRR See notes
Break even frequency 13.9 events in 10 years
Note: The financial impact is so negative that a return on capital calculation is not relevant.
This adaptation responds to extreme heat, namely temperature exceeding 32°C for more than 10 days and the frequency and duration of heat waves. The practical adaptation is to increase the ventilation systems in our scenario poultry house, housing 120,000 birds. The installation of low pressure high volume fans is assumed, which involves investment of capital. Failure to undertake the adaptation will result in 20% increased mortality and reduced weight for those birds that survive which will have an impact on the profitability of the operation. The assessment utilises an extreme frequency of 2 in 10 years with a single crop affected on each occasion.
Based on the assumed capital costs and impact on performance of the flock, then a break-even frequency is calculated at almost 14 crops in any 10 year period. The birds are at greatest risk of succumbing to the extreme heat in the last 10 – 12 days of their lives. This has the effect of reducing the period in which exposure to the extreme will result in losses as described for the scenario. All in all the theoretical frequency in which an investment decision is justified is once the producer has an expectation that there will be at least 14 heat extremes in a 10 year period. In practice however, the producers are far more responsive to the extreme and will undertake adaptation after
Page 59
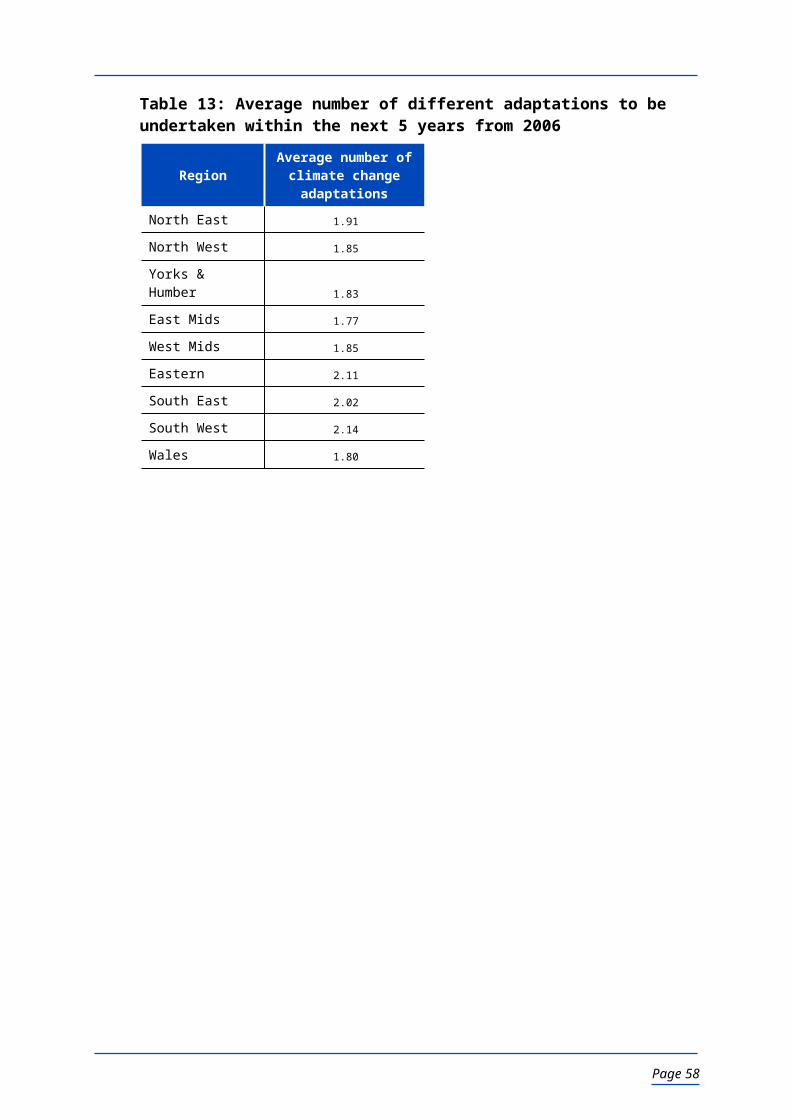
they have experiences one or certainly a second heat extreme. This scenario is expanded further at section 10.3.
8.4.2 Insulation of Pig Arcs Table 19 summarises the extreme, the impact of the extreme, the likely adaptation and the financial consequences of the adaptation.
Table 19: Summary of the insulation of outdoor pig arcs enterprise scenario
Climate Extreme Frequency/timing of heat waves; Frequency of extreme heat
Adaptation Insulation of existing buildings
Impact of Extreme Weather too warm for the sow inside the arc and this would have detrimental effect on the piglets inside
Description of adaptation Insulate the arcs to keep sows cool and encourage them to stay with piglets
Extreme frequency 2 in 10 years.
Capital invested £7,000
Effect on profit -£1,032
NPV -£1735
IRR 2%
Break even frequency 4.05 events in 10 years
This adaptation responds to extreme heat, namely temperature exceeding 32°C for more than 10 days and the frequency and duration of heat waves. The effect of the high temperatures is that the sows spend time away from the arc in wallows to keep cool and hence away from the young piglets. This reduces the opportunity for piglets to suckle leading to increased piglet mortality and reduced weights of the piglets at weaning.
The scenario describes a typical system of 400 sow units, but at any one time we would expect to need 70 arcs to accommodate the breeding cycles. The problems caused by high temperature heat extremes are recognised within the outdoor pig industry and increasingly producers are making adaptations to reduce the impact on performance. Currently some producers are already using insulated arcs and in other cases single skinned arcs are painted white to reflect heat from direct sunlight. The initial evaluation is made on a frequency of 2 extreme events in a 10 year period. The economic breakeven point to merit the greater investment in high specification arcs is just over 4 extreme events in a 10 year period.
The costed adaptation, as shown in Table 19, indicates that financially the frequency of the extreme event needs to be at least four occasions in the ten year period to make investment in insulated arcs worthwhile. The nature of this project is such that it is necessary to establish a climate threshold to trigger an impact on production systems. However, in practice, there is a progressive relationship between temperature and enterprise impact. While currently the high temperature extreme may be an infrequent event, there will be a lot of occasions when temperatures exceed a sow’s thermal comfort temperature of 25OC. Above this temperature she needs to take action to maintain a stable body temperature, such as wallowing, reducing feed intake, seeking shelter/draughts/shade. Above this temperature, the
Page 60

sows will change behaviour spending less time in the arc and more time wallowing or in the shade. This has an adverse impact on the piglet’s opportunity to feed and thus on piglet mortality and piglet growth. The performance of the enterprise is affected by temperatures below 32°c considered as a climate extreme. There are also welfare benefits of insulated arcs at very low temperatures, when the insulation helps to retain heat in the arc. It is because of this there is already adoption of the adaptation despite the costed analysis indicating that it does not seem to be worthwhile. There are no alternative adaptations that could be considered as having greater environmental benefits. Providing replacement arcs with greater insulation at the point when existing arcs are at the end of their working life has the benefit of not increasing waste or inefficiency in developing the adaptation.
8.4.3 Installing Misting into Existing Building Intensively housed pig systems are equally exposed to the adverse impact of extreme heat events as outdoor units. Without adaptation, the heat event would result in an increase of 10% in pig mortality and a reduced feed intake and thus poorer growth rates for those growing pigs that survived. While some compensatory growth could be expected when temperatures return to normal for the time of year, it would not be sufficient to recover all of the lost growth. Expert opinion is that pigs would be 3 Kg deadweight lighter as a result of the heat event without the misting adaptation. Table 20 summarises the extreme, the impact of the extreme, the likely adaptation and the financial consequences of the adaptation.
The scenario describes a typical system of finishing batches of 1000 pigs brought in at 35 kg and taken through to a slaughter weight of about 105kg. The initial evaluation is made on a frequency of 1 extreme event in a 5 year period. This is an adaptation which requires minimal capital investment but which generates a significant contribution to profitability. Table 20 shows that a frequency of 1 event in 5 years will generate an IRR of over 100% while the break even period is under one year.
Page 61

Table 20: Description of the mist cooling of indoor pigs enterprise scenario
Extreme event Frequency/timing of heat waves; Frequency of extreme heat
Adaptation Misting existing buildings
Impact of Extreme The increased temperature would result in existing systems being inadequate.
Description of adaptation Introduce misting to cool the finishing pigs down
Extreme frequency 2 in 10 years.
Capital invested £2,000
Effect on profit £1,581
NPV £5,862
IRR 100%
Break even frequency 0.62 events in 10 years
8.4.4 Transporting Poultry to Slaughter – Reduction in Transport DensityThe current and foreseeable margins on rearing and processing broilers are very marginal for both the producers and the processors, despite recent articles in the press and media calling for less intensive systems of production. For this reason the broiler industry requires a planned and prescriptive approach to production. The processors need to plan throughputs to maximise the efficiency of their facilities. Farmers need to produce broilers to a high standard following operating procedures set out by the processors. In an extreme heat event, birds must be transported from farm to factory. Stopping transport due to heat stress is not an option. The most obvious adaptation to the heat event will be to reduce the density of birds on the hauliers’ transport. This will allow greater movement of air to circulate through the load while moving. Failure to cool the birds in-transit could increase mortality from 0.19% to 1.00%. We must remember however that using mortality alone as an index of welfare is not appropriate for two reasons:
A dead bird has clearly had its welfare compromised, but how many of its associates on the same journey have been severely compromised and thus suffered poor welfare.
Those birds that have died are not processed. However, those birds that have been thermally compromised will have used evaporative cooling (via respiration) to try to maintain a stable body temperature. They may thus be dehydrated and, from a production standpoint, will have lost product weight.
There is no information on exactly what weight the birds would lose as a result of dehydration. However, the sector specialists felt that this is likely to be very variable. Estimates indicate that losses in weight during transport are between 1-2% but much of this can be attributed to losses from bowels.
The extreme, the impact of the extreme, the likely adaptation and the financial consequences of the adaptation are summarised in Table 21.
Page 62

Table 21: Description of poultry transport density enterprise scenario
Extreme event Frequency/timing of heat waves; Frequency of extreme heat
Adaptation Transporting poultry to slaughter– reduction in transport density.
Impact of Extreme
Temperature and humidity affect poultry during transport. High temperatures during transport may affect mortality rates. High temperatures in-transit may cause birds to become dehydrated resulting in weight loss and therefore a reduction in price.
Description of adaptation Reduce the numbers of birds transported on any one load to reduce the density of broilers by 12%.
Extreme frequency 2 in 10 years.
Capital invested £0
Effect on profit £127
NPV £0
IRR No Cap Inv
Break even frequency n/a in 10 years
8.4.5 Transporting Lambs to Slaughter – Reduction in Transportation DensityIncreased temperatures when transporting livestock, in this case lambs, may result in higher mortality rates. However there is little data on the upper heat tolerance limits for lambs/sheep. These are considered the most tolerant of the farmed species to elevated temperatures. While there may be a small rise in mortality the lambs may also have their welfare compromised due to heat stress and may become dehydrated, especially with prolonged exposure.
Using mortality alone as an index of welfare is inappropriate as lambs may have their welfare compromised due to dehydration. This will depend on (a) the conditions the animals have experienced pre-transport, (b) the severity of exposure, and (c) the duration of exposure.
The scenario put forward for consideration is to transport 1000 lambs to slaughter by lorry in temperatures exceeding 32°C. The suggested adaptation is to reduce maximum load of sheep in transport by 10%. The farmer could use his own transport or a haulier for lamb movements. Heat stress is likely to be more common on large sheep transporter lorries.
Where farmers have their own transport it will often be a trailer (towed by a tractor or landrover type of vehicle) and will accommodate about 40 lambs rather than a livestock lorry. The likelihood of heat stress is reduced by the small size of the vehicle with ventilation by vents in the side. Finished lambs tend to be drawn weekly according to body condition and marketed over a period of at least three months. Hence they are sold in batches which are small compared to annual production. The transport is only likely to be fully utilised for a few trips. Only on those occasions would reducing the stocking density require additional trips. It is not particularly likely that these trips when transport is fully loaded would coincide with extremely hot spells. Also, we could reasonably assume that transportation during the hottest parts of the day would be avoided, probably switching to evening or night when conditions should be cooler.
Page 63

While this scenario and adaptation were deemed important enough to include in the final “long list” or adaptations and a range of sectoral experts have attempted to populate the economic costing of this scenario, ADAS has concluded that it is not realistic to cost this adaptation owing to a lack of suitable data.
8.4.6 Water Storage - Capture, Storage, Piping A period of prolonged dry weather could in some situations result in natural water supply (ponds, streams and rivers) drying up. This is a scenario most likely to be found on light land and permeable soils. In addition, legislation like the Nitrate Vulnerable Zones (NVZ) and Water Framework Directives (WFD) could soon mean that animals will no longer be allowed to drink directly from water courses. The proposed adaptation is the installation of a system of rain water harvesting and storage. Evaluation of the impact of this event is complicated as the extreme event will potentially impact on both water supply and feed supply.
The costed adaptation includes rain water harvesting from buildings, pumping to a storage tank and gravity feed through pipes to drinking troughs. The enterprise evaluated is a 500 head sheep flock. The extreme, the impact of the extreme, the likely adaptation and the financial consequences of the adaptation are summarised in Table 22.
Table 22: Summary of Water Storage - capture, storage and piping enterprise scenario
Extreme event Frequency of extreme heat ; Frequency/timing of heat waves; Frequency/duration of dry spells
Adaptation Water Storage - capture, storage, piping/troughing
Impact of Extreme The weather will lead to reduced natural water supply
Description of adaptation
Currently the event is expected about 1 year in 10. Farmers currently rely on water bowsers, or tanks and trailers to carry water to stock. The proposition is that with increased frequency of the event, farmers will build storage tanks and harvest rain water from building roof areas as a supply and will pipe water from the storage tank to field troughs.
Extreme frequency 1.4 in 10 years.
Capital invested 5530
Effect on profit -£624
NPV -£5,338
IRR -2%
Break even frequency 8.7 events in 10 years
The enterprise costed in this adaptation is a sheep flock. However, a significant component in this costing is the relatively small volumes of water consumed by sheep, as compared to cattle. Cattle have greater requirements for water, and this type of adaptation is now much more common, mainly on dairy farms. Driven by the costs of mains water, sometimes coupled with unreliable low pressure supplies in remote locations dairy farmers frequently invest in a bore hole to extract ground water, linked to storage tanks on farm as a means of securing and storing water. This investment should not be mistaken for the adaptation assessed in this project, involving rainwater harvesting and storage.
Page 64

8.4.7 Irrigation in Top Fruit A relatively dry period followed by 14 days without rain and temperatures of 32°C or above would lead to reduced yields and quality; smaller fruit size; poor tree growth and the following year’s the crop yield will also be affected. The scenario is a 14 hectare apple orchard and the adaptation is to install a solid set sprinkler system to apply water daily to achieve 25 mm of water per week while the temperatures exceed 32°C.
The capital costs of the adaptation are estimated at about £1300 per hectare. However, the high value of the crop is such that the investment is worthwhile at an extreme event frequency of just over 1 per 10 years. Table 23 summarises the extreme, the impact of the extreme, the likely adaptation and the financial consequences of the adaptation.
Table 23: Summary of Water Storage - capture, storage and piping enterprise scenario
Extreme event Frequency/timing of heat waves; Frequency/duration of dry spells
Adaptation Irrigation in Top Fruit
Impact of Extreme Drought would affect yields and quality of fruit. It would also lead to poor tree growth and affect future years production.
Description of adaptation Install irrigation system and progressively replace with more drought tolerant varieties.
Extreme frequency 2 in 10 years.
Capital invested £18,200
Effect on profit £3,159
NPV £2,8391
IRR 33%
Break even frequency 1.1 events in 10 years
8.4.8 Irrigation of Potatoes to Maintain Yield and Quality The extreme event considered in this adaptation is prolonged dry weather leading to summer drought, poor crop growth and harvesting difficulties. The majority of potato crops grown for processing receive irrigation but in a very dry season there is often insufficient water, or machinery to apply the water to meet crop requirements. The need for irrigation is dependant on soil series, soil texture and local weather patterns. Historically, farmers plan to supply sufficient water to meet crop demand during the 5th
driest year in 20. In scenarios where the number of extreme drought years increases, it is likely that yield losses will force a re-evaluation of this practice and result in a need to increase irrigation capacity by securing additional water supplies.
Additional to the issue of poor growth due to drought, soil conditions at harvest can adversely affect tuber quality and therefore crop value. On heavier land, the soil becomes hard which results in tuber damage, mostly bruising, during harvesting. On light land, the soil does not harden but it is so dry that it falls away from the potatoes too quickly as it passes up the first web of the potato harvester. Again this causes bruising as the soil normally acts to absorb some of the mechanical shocks encountered. The cost to the grower can be considerable, due to lost yield and the rejection of whole loads at processing factories due to bruising and growth cracks.
Page 65
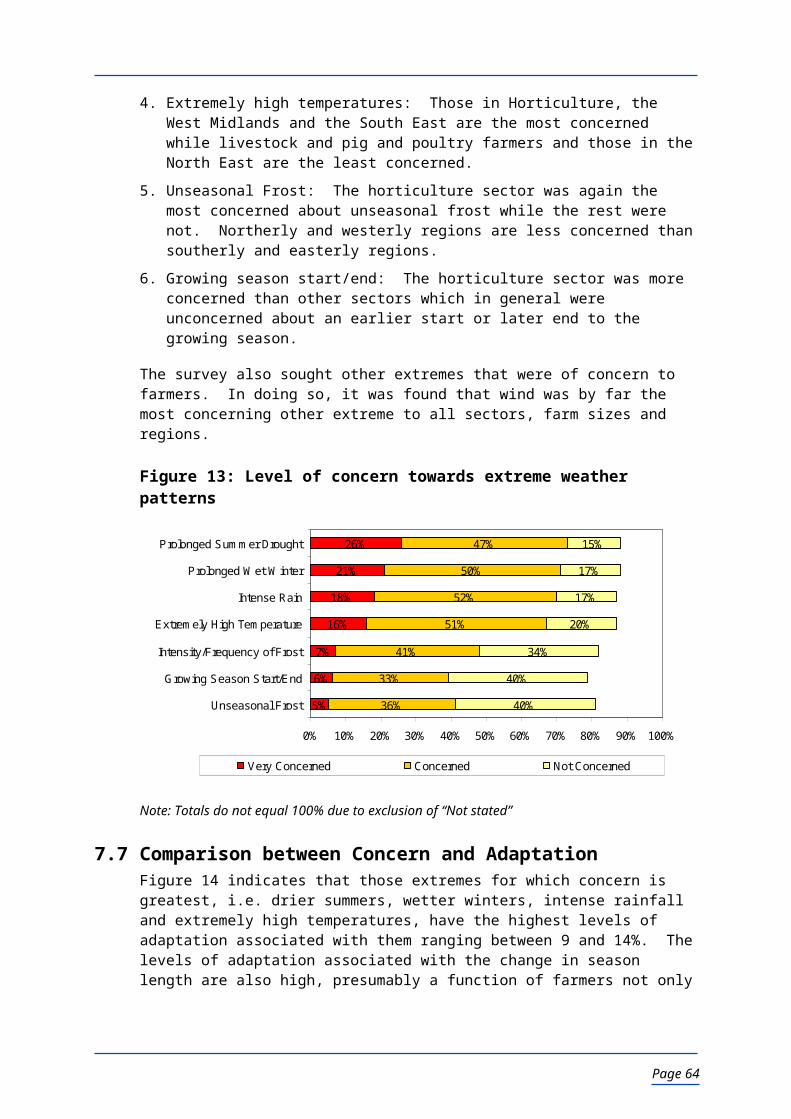
The adaptation here is to apply irrigation to offset yield loss and to soften the soil before harvest
In assessing this scenario it is assumed that the Environment Agency would prevent summer abstraction of water due to the adverse impact this would have on water flow in the prolonged dry period. It is also assumed that there is no surplus stored water on farm as the currently available capacity of stored water is required and used in the growing season. The farmer adaptation to this event is to increase the storage capacity to provide an additional 50mm of irrigation water. Table 24 summarises the extreme, the impact of the extreme, the likely adaptation and the financial consequences of the adaptation.
It is acknowledged that at local level there are some areas in which there is no capacity even for winter abstraction. In these areas the adaptation may not be available to the producers growing potatoes. In regions such as the South East and East Anglia, increased frequency of the extreme, coupled with uncertainty over the capacity for abstraction may result in reduction of potato production, with migration to wetter areas where the frequency and magnitude of the event is less and there is capacity for abstraction. The scenario is evaluated further at section 10.
Table 24: Summary Pre harvest irrigation of potatoes enterprise scenario
Extreme event Frequency/timing of heat waves; Frequency/duration of dry spells
Adaptation Irrigation- potatoes
Impact of Extreme Hard ground and reduced crop growth. Tubers production would be compromised, and the hard ground would result in damage at harvested
Description of adaptation Irrigate potatoes more often during this weather period to soften the ground. The scenario is to increase the water storage capacity to facilitate an additional 50 mm of irrigation in the summer period.
Extreme frequency 2.35 in 10 years.
Capital invested £66,000
Effect on profit -£2,427
NPV -£22,898
IRR 6%
Break even frequency 3.55 events in 10 years
For a 40 hectare potato enterprise the net loss as a result of the extreme is calculated at just over £30,000 in the year of the extreme. The costs of running the irrigation, coupled with the amortisation of the capital invested reduce the net gain to £13,000 per year. There is however an on going maintenance and amortisation cost of the increased storage capacity of over £7000 per year. To some extent potato producers have similar market driven motivation as the poultry producers with production contracts to supply potatoes to a market specification. In the main the produces will wish to maintain these contracts and are more likely to be motivated to make the investment to improve the saleable yield and quality of the crop they produce.
The expectation is that where possible, producers are likely to increase water storage capacity, but this will be a response to the combination of climate change and water resource management issues, as opposed to climate extremes. There is also an
Page 66
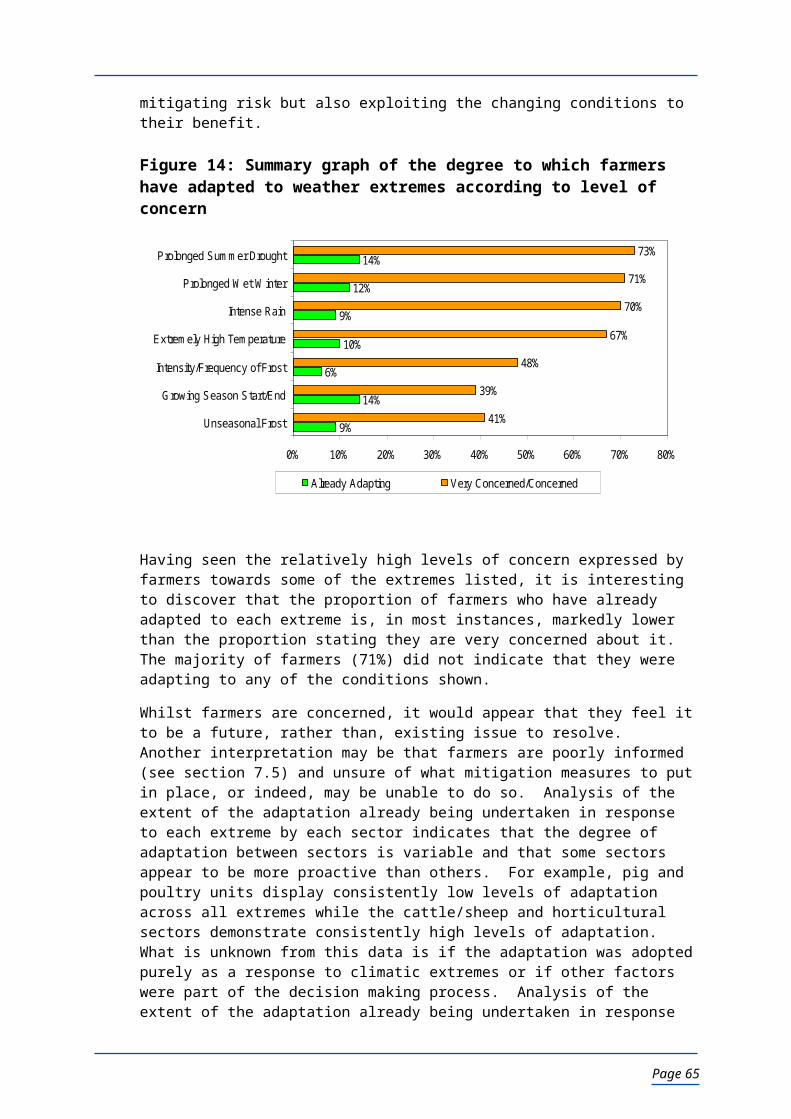
expectation that there will be a migration west to areas less likely to suffer drought conditions. This change is also a climate change not climate extreme issue.
8.4.9 Irrigation to Harvest Other Root Vegetables (Swedes)The enterprise costed is a four hectare crop of Swedes. The impact of the climate extreme is to reduce the marketable return by 20%, due to root damage at harvest affecting both price and quantity of Swedes sold. This adaptation has similarities with that described for potatoes (8.4.8). Irrigation will be required to soften soils hardened by prolonged dry periods. Irrigation will reduce damage to the root crops being lifted as well as reducing the wear of harvesting machinery. However this scenario envisages that stored irrigation water is not available at the onset of the extreme and that the pre-harvest irrigation applications will be sourced from water drawn by additional mains supply. The capital cost is therefore that attributable for increasing the water storage capacity for 2 further applications of 25mm.
Table 25 summarises the extreme, the impact of the extreme, the likely adaptation and the financial consequences of the adaptation.
Table 25: Summary Pre harvest irrigation of Swedes to maintain quality
Extreme event Frequency/timing of heat waves; Frequency/duration of dry spells
Adaptation Irrigation – Swedes
Impact of Extreme Soil hardening
Description of adaptation More frequent irrigation pre crop establishment and prior to harvest of crop
Extreme frequency 2 in 10 years.
Capital invested £6,600
Effect on profit -£493
NPV -£1,074
IRR 8%
Break even frequency 3.25 events in 10 years
The costed adaptation indicates a net loss if the adaptation is to be undertaken. In practice the impact of the extreme will depend on the specific soil conditions of the farm. There will also be other situations where the farmers will choose to irrigate a proportion of the growing crop in order to have some for harvest and leave the area intended for later harvest as un-irrigated, hoping that later rain will soften the ground.
8.4.10 Refrigeration to speed the temperature drop in crop to improve storage (Potatoes) Harvesting, grading and storing potatoes in periods of high temperature result in the potatoes entering the store at higher temperatures leading to disease and loss of quality. Excessive heat will affect the crop:
Increased dry matter content of potato tubers leads to increased bruising susceptibility.
Increased bruising at harvest and store loading may lead to increased incidence of rotting in store.
Page 67

If potato tubers are warmer at store it will take longer for the temperature of the tuber to be reduced to the required storage temperature. If this takes too long it will lead to reduced quality of the potatoes.
These impacts may see a 20% increase in rejection of loads of potatoes by the processors and therefore loss of income to the farmer. To reduce this, installation of additional refrigeration facilities to the current potato store would be required in order to cool the temperature of potatoes in the store in a shorter period of time than would be the case without the refrigeration.
The system chosen is based on chipping potatoes where 30% of the crop is stored and 70% is sold directly off the harvester. Storage of these potatoes must be between 8-9C, to meet current and foreseeable contractual obligations and to prevent sugar accumulation with consequent deterioration in fry colour. The costed adaptation is for 1,000 tonnes of storage for processing potatoes for chipping. The adaptation is additional refrigeration placed on to existing ventilation systems. This will assist with reducing the surrounding and crop temperature in the same ‘pull down’ period (typically 20 days).
Table 26 summarises the extreme, the impact of the extreme, the likely adaptation and the financial consequences of the adaptation.
Table 26: Summary of adaptation to increase refrigeration to improve long-term potato storage
Extreme event Frequency/timing of heat waves; Frequency of extreme heat
Adaptation Long term storage
Impact of ExtremeExcessive heat will affect the crop by increasing the amount of rotting, viability of bruising, both leading to rejection of loads. It will cause the breakdown of starch in the potato and therefore quality
Description of adaptationIncrease the amount of refrigeration on the current system of the store in order to pull down the store temperature in the same period of time
Extreme frequency 3 in 10 years.
Capital invested £20,000
Effect on profit -£658
NPV -£5,678
IRR 6%
Break even frequency 3.6 events in 10 years
It is expected that there will be greater uptake of this technology in the potato sector, but driven as much by the concentration of production to fewer and fewer professional potato growers and the increasing demands of the market. This costed scenario is covered in greater detail at section 11.
8.4.11 In-field Refrigeration to Reduce Temperature Immediately Post Harvest (Strawberries)Soft fruit, such as strawberries have a short shelf-life, which is shortened further when harvesting takes place in high temperatures, with fruit also being damaged more easily. Once harvested, the temperature of the fruit needs to be reduced as quickly as possible.
Page 68

These conditions could result in 50% of the crop being unsuitable for the supermarket requirements. This will result in some being sold on the wholesale market or for processing and half will be waste. This therefore will lead to a substantial loss of income.
The enterprise costed is 35 hectares of strawberries, producing fruit to a supermarket contract specification. The adaptation is the use of in-field refrigeration using systems designed to quickly reduce the temperature of the fruit. The capital cost of the adaptation (e.g. a modified refrigerated lorry body) is modest at £4,000. While the production enterprise is 35 hectares, it is assumed that only a third of the crop will be harvested at any one time. This is due to the varieties being grown, cropping through the season – early, main-season and late. Table 27 summarises the adaptation and the financial results. The intrinsic value of the harvested fruit, as compared to the relatively modest capital investment results in a very high impact on profit and on the IRR.
Table 27: Summary of adaptation to increase in-field cooling of harvested crop (strawberry)
Extreme event Frequency/timing of heat waves; Frequency of extreme heat
Adaptation Storage short term
Impact of Extreme Excessive heat may lead to softened fruit, reduced shelf life and reduced quality. This will therefore lead to lower returns for the crop
Description of adaptation Investment into cold storage in the field to pull down the crop temperature sooner. There will be adequate permanent cool storage on site
Extreme frequency 3 in 10 years.
Capital invested £4,000
Effect on profit £1
NPV £5.50
IRR 10%
Break even frequency 3 events in 10 years
There are no alternative adaptations capable of achieving the same result. The practicalities of growing the crop and the infrastructure (labour equipment etc.) for growing, harvesting, grading and marketing have to be available throughout the season. It is not a practical proposition to move the main season crop alone, the part most likely to be affected by the climate extreme, to other parts of the country. An option being examined by some leading businesses is to be very selective about sites for production, trying to take account of local micro-climate. This may offer some level of adaptation, but in a climate extreme is not likely to be sufficient to prevent significant loss of Class 1 quality fruit.
8.4.12 Varietal Change to Avoid Need for Chemical Intervention to Break Dormancy (blackcurrants)In blackcurrants the lack of winter chill can result in reduced or uneven bud break, variability in development, lower yields and uneven ripening. Processors will not take any samples with green fruit. The proposed adaptation is a change of cultivar to low
Page 69
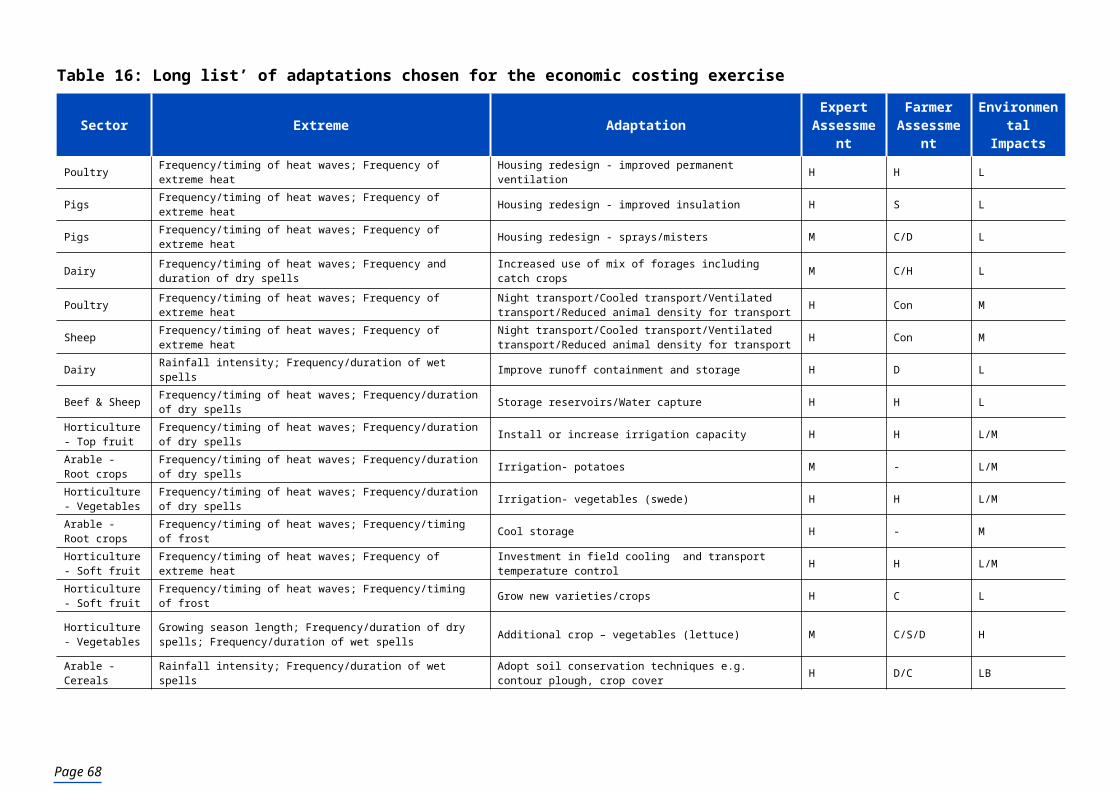
chill varieties of blackcurrants instead of planting existing varieties which need a dormancy breaking spray. This would typically happen gradually over a period of 10 years in line with the re-planting programme.
Table 28 summarises the adaptation and the financial results. This cultural adaptation is an attractive option as it requires no additional capital investment and the performance of the new cultivars matches that of the traditional varieties.
Table 28: Summary of change of cultivar to ensure a break of dormancy and even ripening of the crop
Extreme event Frequency/timing of heat waves; Frequency/timing of frost
Adaptation Change of Cultivar (perennial)
Impact of Extreme
Lack of wind-chill due to mild winters results in reduced or uneven bud break, variability in development and uneven ripening. This leads to reduced yields and the processors will not accept samples with green fruit
Description of adaptationProgressively replant and re-grub with low chill varieties from New Zealand and France. In the short term use dormancy breaking sprays until all bushes are replaced.
Extreme frequency 2 in 10 years.
Capital invested £0.00
Effect on profit £25.00
NPV £0.00
IRR No Cap Inv
Break even frequency See notes
Note: The adaptation assumes that the varietal change will occur as part of the normal management of the enterprise. There are no additional costs associated with the change; the only benefit is the saving in a spray application to chemically break the bud dormancy.
8.4.13 Extended Growing Season Leading to Additional Cropping (lettuce) If the growing season is extended this could potentially increase the number of lettuce crops that could be grown in a year. The extended production season may allow the programmed production of an additional quick growing salad crop over the production season.
In this scenario, growers could plant another crop of Little Gem Lettuce as a result of an enhanced growing season. In practice, market demand may be more limiting than land area. Hence the extent to which the farmer would increase cropping would depend on market outlets. For this reason, the budget illustration has been prepared to show one hectare of land double cropped; and the actual area that the farmer would replant for an additional crop would depend likely market demand and discussions with buyers. Table 29 summarises the adaptation and financial return which may be available to the grower with the market outlet for the produce.
The other consideration for this extreme event is the lack of certainty regarding the frequency of the event. Production is market driven, so buyers will be contracting the supply. Unusually early seasons would offer the opportunity for double cropping, but the wholesale and retail organisations will probably have contracted and sourced supplies, so the opportunity, in terms of availability of contracts and volumes of
Page 70

produce offered by extreme events is actually limited. Extension of the growing season at the end of the season offers no opportunity unless it becomes the norm. The production costs are so high that the growers require a certainty that the weather will hold and the crop can reach harvest size and condition.
It is debatable as to whether this is an adaptation to consider as a response to an extreme weather event, or simply the opportunity offered by on going climate change.
Table 29: Summary of opportunity offered from additional cropping
Extreme event Growing season length; Frequency/duration of dry spells; Frequency/duration of wet spells
Adaptation Additional Cropping
Impact of Extreme Hot weather could extend or accelerate the growing season resulting in the opportunity to add an extra crop.
Description of adaptation Plant two crops where previously only one was planted a season.
Extreme frequency 1 in 10 years.
Capital invested £0
Effect on profit £394
NPV £0
IRR No Cap Inv
Break even frequency 2.5 events in 10 years
Note: There are no opportunity costs for this adaptation. The market and enterprises are driven by market conditions and availability of lowest cost product from anywhere in the world.
The estimation of a break-even frequency of 2.5 years in 10 is calculated on the basis that the producer is to incur the costs of trying to double the crop, but the climate extreme only results in a successful marketed harvest periodically.
8.4.14 Intense Rainfall Events – Soil Management Post-harvestRainfall events of increasing intensity between maize harvest (October) and the following spring can cause soil erosion from maize fields after harvest. A large amount of water run-off (during the autumn and winter period) will lead to:
Gullies and soil washed off fields
The need for moving soil and extra cultivation to level fields
Excessive water pollution
This will lead to the cost of remedial work to move soil back onto fields and level them. The farmer will need to add into the current farming system cultivation practices that will aide soil conservation after the harvest of a maize crop. The summary of the adaptation and financial results is shown in Table 30.
The impact varies due to soil type and gradient of slopes. 15mm of rain per day at 4mm/hour is enough to cause soil run off (Defra - Environmentally Sensitive Farming project).
The adaptation is to introduce post-harvest cultivation of sloping soils, especially soils compacted by vehicle movement at harvest time, as a routine operation immediately
Page 71
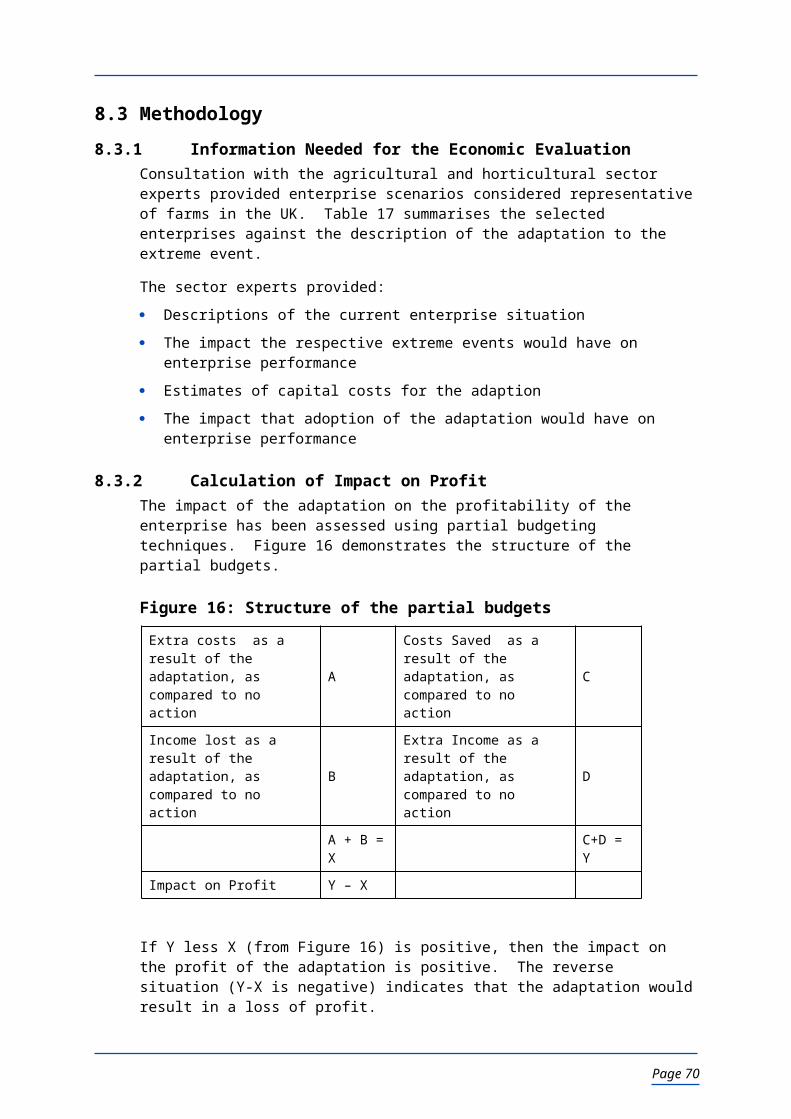
after maize harvest. Cultivation will break the soil structure making it more permeable to rainfall and so avoid water flows over the surface of the field.
A conflict with this adaptation is that the response to the extreme event is a field cultivation activity, using machinery and by definition using tractor fuel so contributing to carbon emissions. Another difficulty can be water retention in the cultivated soil. Soils with a clay or silt component develop natural crack and fissures during the growing season. This is particularly true when a deep rooted forage maize crop has been grown. Cultivation breaks this system leading to a sponge effect. This can delay cultivation and establishment of the following crop.
Alternative approaches to reduce the risk of increased rainfall intensity could include not growing maize on fields prone to surface run-off. However, replacing the feed value of the maize silage not produced could result in comparable or greater use of resource and fuels that will be used in undertaking the surface cultivation. Another alternative could be a change of variety to earlier maturing varieties and/or earlier establishment of maize, particularly if the growing season is to increase as predicted. This could give the opportunity to harvest the maize earlier in the autumn to allow the establishment of a either the following crop in a rotational situation or a cover crop if the land is to intended to grow maize the following season. The risk with this option is a late frost after the growing season has started. Maize is not frost tolerant and a late frost could significantly reduce the performance of the crop resulting in shortages of forage the following winter.
Table 30: Summary of post harvest cultivation to mitigate heavy rainfall events
Extreme event Rainfall intensity; Frequency/duration of wet spells
Adaptation Soil runoff (slope, soil dependant) - soil conservation structures and management costs
Impact of EventA large amount of water, during the autumn period will lead to soil structure damage. Large ravines and gullies, excessive water pollution, low levels of soil organic matter.
Description of adaptation More attention to methods to improve soil conservation post maize harvest
Event frequency 6 in 10 years.
Capital invested £0
Effect on profit -£167.40
NPV £0
IRR No Cap Inv
Break even frequency Note*
Note: The adaptation assumes that the costs of soil restoration are less than those of cultivation, thus the adaptation will always be a cost to the farmer.
The adaptation to this event has to be an annual event, undertaking some post harvest cultivation. The costs of the cultivations are greater than the cost of the remedial work and as such even if the extreme was to occur every year, there is an economic loss. The exception to this would be any penalties applied by the local authority or the Environment Agency if the run-off resulted in prosecution. There is however considerable promotion of the adaptation by the Environment Agency and
Page 72

Natural England in relation to the Code of good Agricultural and Environmental Condition (GAEC) requirements set out as part of the cross compliance for Single Payments (SP). We could expect to see further support for this adaptation as part of catchment-specific management plans under the Water Framework Directive, directly linked to GAEC under CAP.
8.4.15 Intense Rainfall Events – Change Cultivation System to a Reduced Tillage System Arable cropping enterprises are at risk from heavy rainfall events before the crops are well established and a strong root system has developed to anchor the plans in the soil as well as contributing to the overall structure of the soil. The impact of the event will vary depending on a range of factors such as the location of the farm, the gradient of the land and the soil moisture prior to the event.
The adaptation proposed is a complete change of cultivation and establishment to a minimal tillage operation. The benefit of this approach is it minimises the disturbance to the soil structure. In assessing the economics of this adaptation the assumption made is that the soil type is a medium soil in which a rotation of autumn sown combinable crops are grown. A heavy rainfall event in the October to December period will result in loss of soil and nutrients as well as loss of plants.
The capital cost of minimal tillage equipment, and the size of tractors needed to use such equipment is such that for the majority of producers adoption of minimal tillage systems will only be economic if contractors are used for crop establishment. The net effect of the change in terms of the cost of operation is positive, in that a contractor should be able to undertake the work at a lower cost than the ownership and operation costs of farmer owned machinery to undertake deeper cultivations. The disadvantage to the farmer is the yield penalty and increased pesticide usage (slug pellets and herbicide) that would be expected with minimal cultivation compared to traditional ploughing and cultivation to prepare a seedbed for crop establishment. Table 31 summarises the economic impact based on a heavy rain event occurring at different frequencies.
Table 31: Summary of change to minimal tillage for winter sown combinable crops
Extreme event Rainfall intensity; Frequency/duration of wet spells
Adaptation Soil runoff (slope, soil dependant) - soil conservation structures; plant seedlings/replanting
Impact of Extreme
This event could cause some issues around germination and establishment. There may also be some issues around soil run off and loss of nutrients, leading to an increase use of inorganic fertilisers and therefore more issues associated with water pollution
Description of adaptation Increased use of direct drilling to a more minimum tillage system
Extreme frequency 1 in 3 years. 2 in 3 years. 3 in 3 years.
Capital invested £0 £0 £0
Effect on profit (£) -£3,899 -£2,735 -£1,571
NPV (£) £0 £0 £0
IRR % No Cap Inv No Cap Inv No Cap Inv
Break even frequency See note below
Page 73

Note: The adaptation to the extreme is a preventative adaptation undertaken before the farmer knows whether the event will occur or not. The long term move to minimal cultivation results in a yield penalty and increased pesticide costs. There is thus a net loss to the farmer even if the event is annual.
8.4.16 Intense Rainfall Events – Crop Splash Prevention with Ground-covering Mulch (Strawberries)
Rainfall events of increasing intensity can cause crop damage due to the splash effect of the rain on the soil contaminating the crop. Strawberries grown in the ‘leg’ (outer) rows of polytunnels are particularly prone to losses due to rain splash. The crop value is high, making it economic to consider options which will mitigate this damage.
The scenario costed is a strawberry enterprise, grown under ‘Spanish’ poly-tunnels, which applies to the bulk of the current UK crop. The adaptation evaluated is to place polypropylene woven matting (e.g. ‘Mypex’) between the outer crops of adjacent tunnels (the ‘leg’ rows’) to prevent soil splash onto the maturing fruit. Under normal conditions strawberry yields on 16.2 ha of strawberries will be 227 tonnes worth £430,920. Production in the leg row is around 1/5th of total production - 45 tonnes worth £86,184. If a polypropylene woven material is not installed the expected loss would be around 15% (6.8 tonnes) of the production in the leg rows worth £12,920. If the adaptation is adopted, the losses can be assumed to fall to around 5% (2.3 tonnes) worth £4370.
Table 32 summarises the capital investment and financial return from the adaptation.
Table 32: Summary of protection to minimise the impact of rain splash
Extreme event Rainfall intensity; Frequency/duration of wet spells
Adaptation Crop splash prevention
Extreme frequency 3 events in 10 years.
Impact of EventIntense rainfall running off the polytunnels covering strawberries will cause high levels of soil splash into fruit on plants in the ‘leg’ rows, rendering them susceptible to rotting and contamination.
Description of adaptation
Land between leg rows of adjacent tunnels covered with polypropylene woven matting so that rainfall coming off the tunnel covers is absorbed into the soil and the soil isn't splashed, up onto the fruit with resultant spoilage.
Capital invested £6,000
effect on profit -£818
NPV -£1,568
IRR -6%
Break even frequency 4.2 events in 10 years
Page 74
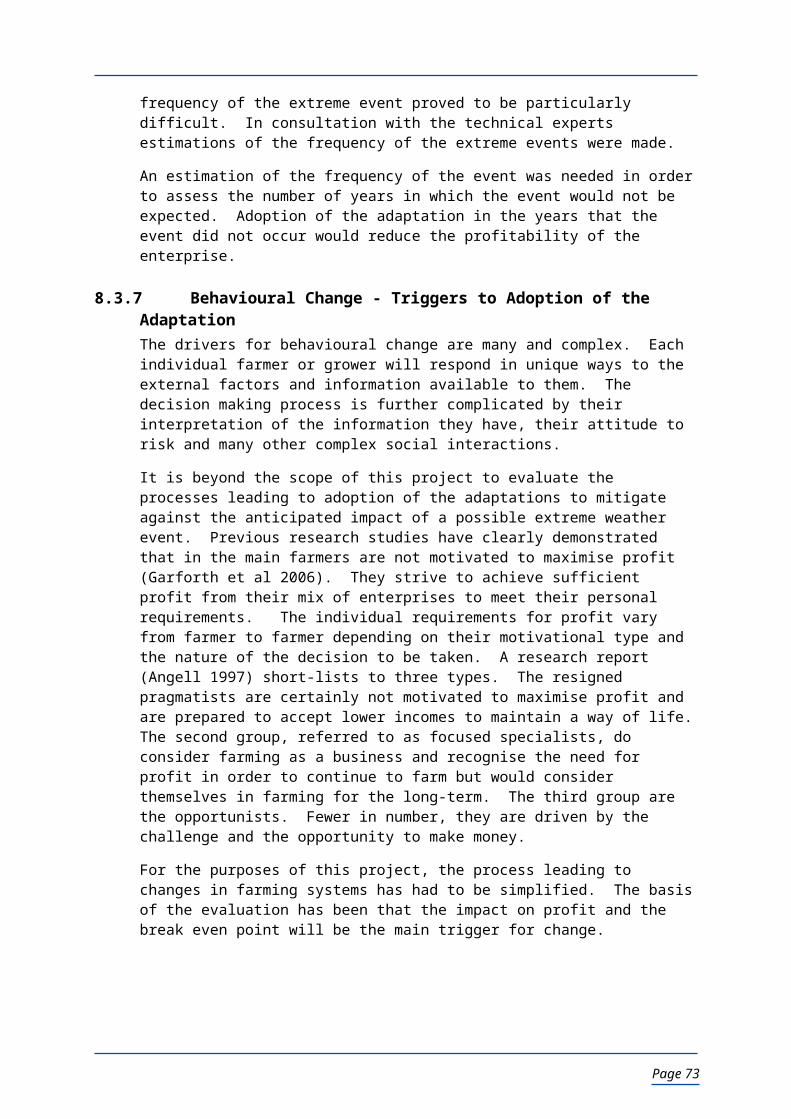
8.4.17 Intense Rainfall/Hail Damage - Netting Covers to Protect Baby Leaf Salad The extreme event considered in this adaptation is intense storms with associated hail and the impact on outdoor baby leaf salad crops. Severe hail storms would damage the leaves of these crops. This is particularly important for baby leaf salad crops producers. The event could lead to the whole crop to be destroyed by the hail storm by ‘shredding’ the crop, thus leading to a complete loss of income from the affected area. It is therefore important that possible methods of protecting the crop are used.
The growers will invest in hail netting to protect the leaves from the hail stones. The crop would require a durable mesh type netting over the crop at all times of the year.
The capital investment and financial returns are shown in Table 33.
Table 33: Summary of protection to minimise the impact of rain splash
Extreme event Intense rainfall accompanied by hail
Adaptation Hail netting/covers - leaf damage
Impact of ExtremeHailstones will lead to damage to the leaves of crops and in particular baby leaf salad crops. There is a potential for the whole crop to be destroyed by shredding of the leaves.
Description of adaptation Invest in hail netting to cover crop for protection from the hail stones.
Extreme frequency 1 in 7 years.
Capital invested £49,000
Effect on profit £43,145
NPV £303,742
IRR 74%
Break even frequency 0.4 events in 10 years
8.4.18 Intense Rainfall/Hail Damage - Netting Covers to Protect Top FruitHeavy hailstorms could result in damage to the fruit such as bruising, russetting and holes. The damaged fruit would be unacceptable to supermarkets. It would be uneconomical to attempt to grade out any sound fruit. It would therefore be sent direct to processors for juicing. However this market will have a reduced financial return (say £60/tonne), leading to the farm losing income as a result.
The adaptation to this extreme event is to apply netting (secured with posts and wire) to protect the fruit. This system is in use on the Continent and in New Zealand. The structure will remain in place through the season, with the net only being drawn over the crop when required (otherwise shading and poorer quality fruit/lower yields would result). As this example concentrates on hail events rather than intense rainfall, no allowance has been made for additional drainage costs.
The capital investment and financial returns are shown in Table 34.
Page 75

Table 34: Summary of protection to minimise the impact of hail
Extreme event Rainfall intensity; Frequency/duration of wet spells
Adaptation Hail netting to avoid fruit damage
Impact of ExtremeIn top fruit it may damage blossom and fruit, cause increase bruising, russetting and holing. The crop will then only be suitable to juice and this will lead to less economic return from the crop
Description of adaptation Increase use of netting over the crop all year round
Extreme frequency 1 in 10 years.
Capital invested £70554
Effect on profit 80
NPV £357
IRR 10%
Breakeven 1 event in 10 years
8.4.19 Intense Rainfall/Winds – Loss of Power SuppliesIncreased intensity of storms, causing structural damage and loss of power supplies will impact on a wide range of farming situations. Enterprises for which power is considered essential have already made provision for loss of power with the installation of on-farm generators, either with their own engine, or driven by a power-take-off (PTO) drive from a tractor.
There are however some farms that do not have generators and the impact on these farms could be more severe if power went down for a considerable time such as 2 days.
For a dairy farm with out a generator a power outage for two days could:
Result in the loss of two days worth of milk.
Impact upon the lactating cows causing a longer term fall in milk production.
Cause mastitis problems.
Lead to added costs in terms of waste milk disposal.
The costed adaptation is for a dairy unit producing 800,000 litres of milk per year. The adaptation costed is the purchase and installation of a power tack-off (PTO) driven back-up generator. The requirement for on-farm back-up electricity generation will largely depend upon the location of the farm and its remoteness. Farms located close to centres of population may be less likely to experience long term loss of power, as the electricity supply companies will respond to re-connect supplies. The more remote locations serving fewer properties and businesses are expected to be at greater risk to loss of power.
Table 35 shows the financial returns from the proposed investment of £2000 in a PTO driven generator.
Page 76

Table 35: Summary of backup on farm generator in case of loss of power supply
Extreme event Rainfall intensity; Frequency/duration of wet spells
Adaptation Ensure Power Supply
Impact of Extreme
Loss of power on a dairy farm could result in: Inability to milk resulting in a loss of milk. Impact upon lactating cows causing a longer term fall in milk
production. Cause mastitis problems. Additional costs in terms of waste milk disposal due to
inability to cool milk.
Description of adaptation Purchase a standby PTO generator.
Extreme frequency 1 in 10 years.
Capital invested £2,000
Effect on profit -£209
NPV -£1,772
IRR 0%
Break even frequency 1.9 events in 10 years
Based on the assumptions used and in particular the frequency of the extreme leading to 2 days loss of production, the investment in emergency generation does not appear worth while. However, for a business of this size and type with an annual turnover of about £250,000, the capital investment of £2000 is a modest sum. Those in remote locations have already made the investment as an insurance against loss of power. Those close to urban centres may experience loss of power for short periods of time, but these delay milking rather than not being able to milk at all. Producers in this position are less likely to make the investment.
8.4.20 Intense Rainfall/Winds – Vegetative Windbreaks (perennial crops – blackcurrants) The extreme event considered in this adaptation is increased intensity of storms with associated winds causing damage to vegetative crops. The crop used to evaluate the adaptation to this extreme event is blackcurrants, using a windbreak of poplar trees. Poplar are used due to the growth rate being better than the majority of species naturally occurring in the landscape. The height of the shelter belt increases the protective effect across the field. The impact on landscape character is not a consideration for the majority of producers.
Blackcurrants are particularly vulnerable to damage from strong winds, which will result in lost production and loss of income, at 2 periods in the year. The first is from April to June, from flowering to fruit set. The second critical period is immediately pre-harvest, from mid- July to early August, depending on geographical location and variety.
The evaluation assumes that the poplar trees will have no value at the end of the production period, due to the need to retain lower branches for windspeed amelioration, which reduces timber quality. Table 36 shows the economic impact of vegetative windbreaks on a high value crop.
Page 77

Table 36: Summary of vegetative windbreaks
Extreme event Rainfall intensity; Frequency/duration of wet spells
Adaptation Windbreaks - vegetative (crops and infrastructure) - perennial
Impact of ExtremeReduced rates of blossom set and reduced tonnage from fruit by 15%. Damage to the structure of the bush/tree leading it to be less productive in future years
Description of adaptation Implementation of a windbreak in the form of popular trees
Extreme frequency 1 in 10 years.
Capital invested £3,600
Effect on profit -£1,466
NPV £15,678
IRR 47%
Break even frequency 1.4 events in 10 years
In general, producers already take account of site exposure when locating new plantations. Some windbreaks are currently in use but, at the present time, these are almost entirely restricted to perimeter field planting. Increased incidence of intense wind events is likely to require more division of plantations into smaller areas with intermediate shelter belts consisting of either a number of rows and/or mixed species planting.
8.4.21 Intense Rainfall/Winds - Artificial Windbreaks for High Value Salad Crops With high wind events, a crop may incur direct physical damage, such as damage to the plant, leaves and/or fruit. This may lead to a reduction in quality, and, in some cases, could result in the whole crop becoming unmarketable.
This is particularly important for outdoor crops, (although those covered with low level fleeces and covers or crops in polytunnels may be affected by loss of covering material or damage to structures) Crop rotation considerations often mean that establishment of perennial ‘living’ windbreaks is not appropriate. Temporary solutions are needed to protect crops as they move round the farm and from season to season. The adaptation evaluated is the placement of artificial windbreaks through a 63 hectare crop of romaine (cos) lettuce. These can be erected when the crop is established and removed for re-use after harvest.
Table 37 summarises the adaptation and the financial returns anticipated from the use of this type of wind break.
Page 78

Table 37: Summary of artificial wind breaks to protect high value crops in open fields
Extreme event Wind associated with Rainfall intensity; Frequency/duration of wet spells.
Adaptation Increased use of movable windbreaks
Impact of Extreme With extreme high winds, the crop may suffer physical damage to leaves, rendering it un-saleable.
Description of adaptation Construction of an artificial windbreak
Extreme frequency 1 in 10yrs.
Capital invested £75,725
Effect on profit -£6945
NPV -£10,826
IRR 11%
Break even frequency 1.45 events in 10 years
A few growers are already adopting this practice on land that is particularly prone to wind blows or is exposed. It is not yet widespread as the capital cost is high. The value of the crop is such that the costing of the adaptation is very sensitive to changes in the frequency of the climate extreme. A change in frequency of 1 event in a 10 year period will result in a £15,700 change in profits at current.
8.4.22 Cereals - Spread Flowering Risk through use of Different Varieties Earlier warmer springs are predicted resulting in cereal flowering being brought forward about a week. The climate extreme considered in this adaptation is the risk of a late frost. Late frost during the flowering period will result in loss of some of the grain sites and thus overall yield. While stem extension and onset of flowering relate to temperature and day length, there are varietal differences. The adaptation proposed is to select from three types of flowering, early, mid and late. By spreading the flowering period, the exposure to a late frost is reduced.
In years when there is no late frost in the flowering period, it is assumed that all varieties have the same yield potential.
Increasing the range of varieties may result in difficulties at harvest if the different varieties have to be stored separately in order to maintain integrity of the sample. This is not likely to be an issue for base commodity production of feed wheat, but will be an issue for growers producing premium wheat. Table 38 summarises the adaptation and the financial returns anticipated.
Page 79

Table 38: Summary of reducing exposure to heat events through selection of different varieties of wheat
Extreme event Growing season length; Frequency/timing of frost
Adaptation Cereals - spread flowering risk through different varieties
Impact of ExtremeEarlier onset of flowering, increases the exposure to and risk of late frost. Late frost at flowering can result in loss of grain sites and thus loss of yield.
Impact of EventEarlier onset of flowering increases the exposure to and risk of late frost. Late frost can result at flowering can result in loss of grain and thus loss of yield.
Description of adaptation Change the variety of wheat that is sow. Plant three varieties which ripen at different rates in order to spread the risk.
Extreme frequency 1 in 10 years.
Capital invested £0
Effect on profit £37
NPV £0
IRR No Cap Inv
Break even frequency 3 events in 10 years
8.4.23 Change of Cultivation Techniques to Establish a Crop in Land Hardened by Prolonged Period of Dry Weather Prolonged periods of hot dry weather in the summer will result in hardening of soils. Heavier soils with higher clay contents are particularly prone to this problem. The solution of irrigation to soften the soil, covered at 8.4.8 is not a practical option for land used for combinable crops. Table 39 summarises the adaptation and the financial returns anticipated.
Page 80

Table 39: Summary of adaptation to establish combinable crops in soils hardened by prolonged dry periods
Extreme event Frequency/timing of heat waves; Frequency/duration of dry spells
Adaptation Change of cultivation technique / reduced cultivation
Impact of EventDry, hot weather causing soils to become baked hard resulting in unsuitable seed beds. This will affect germination and therefore impact upon yields.
Description of adaptation Invest in tillage system that is able to cope with the soil structure and prepare the seed bed.
Extreme frequency 2 in 10 years.
Capital invested £0
Effect on profit £58.95
NPV £0
IRR 10%
Break even frequency 2.3 events in 10 years
The uptake of this adaptation will depend on the nature of the farm, in particular the size of the arable enterprise. With increased joint venture activity there is an increase in the number of farmers covering larger area (hectare) of arable cropping. These specialist arable farmers are more likely to consider this level of investment than perhaps smaller more traditional mixed farms. Other factors, such as the increasing costs of fuels and machinery will also contribute to increased use of reduced cultivations. The environmental consequences could be increased use of pesticides to deal with increased weed competition over time.
8.4.24 Increased Use of Growth Regulators to Reduce Lodging in Intense Rainfall Events Lodging is the permanent displacement of cereal stems from the vertical and it drastically affects profitability through lower yield and reduced grain quality. Lodging events currently occur every 1 in 4 years (Berry P. M., 1998). Climate change may result in lodging occurring more frequently. Heavy rainfall can cause plants to become lodged which can lead to total loss of the crop, partial loss of the crop and can cause problems in harvesting the crop. On average a lodged patch yields 25% less. Lodging also leads to extra drying costs and losses of bread making premium.
The scenario used to evaluate the adaptation is a wheat producer growing 100 ha of wheat. ,A second growth regulator is applied to the crop, using the businesses equipment and labour, in order to prevent lodging as a result of heavy rainfall. The 2nd application of growth regulator is applied as a tank mix with an existing spray that was to be applied. The straw is incorporated. Table 40 summarises the adaptation and the results.
Page 81

Table 40: Summary of adaptation to increase the use of growth regulator to reduce risk of loss due to lodging
Extreme event Rainfall intensity; Frequency/duration of wet spells
Adaptation Avoidance of lodging through husbandry
Impact of ExtremeThe impact may result in plants becoming lodged which can lead to total loss of the crop, partial loss of the crop and can cause problems in harvesting the crop.
Description of adaptation Purchase and application of a second growth regulator.
Extreme frequency 2 in 10 years.
Capital invested £0
Effect on profit £2949
NPV 0%
Rate of return 420%
Break even frequency 1.1 events in 10 years
The future frequency of this extreme is estimated at 2 years in a 10 year period. The adaptation is an additional growth regulator treatment above that already used for a 1 in 4 year frequency currently experienced.
8.4.25 Modification of Buildings to Reduce Respiratory Disease in Housed Cattle The risk of respiratory disease in cattle is increased in warm humid weather during the winter months. The risk depends upon the age of the cattle and their general state of health. Stress will contribute to the risk, so young cattle recently housed and/or recently weaned from their dams are particularly susceptible to respiratory disease. In the worst cases, mortality rates can be very high. Those cattle that recover will have lost some lung capacity and will not achieve the growth and sale weights of healthy cattle.
The adaptation in the cattle sheds is to introduce artificial ventilation to increase air movements. Table 41 summarises the adaptation and the results.
Page 82

Table 41: Summary of animal housing modifications to reduce the incidence of winter animal respiratory disease
Extreme event Frequency/timing of heat waves;
Adaptation Reduce winter animal respiratory disease through improved ventilation
Impact of Extreme Existing ventilation in livestock buildings are inadequate- leading to disease
Description of adaptation
The adaptation evaluated is to improve the ventilation. This could be achieved through opening the ridges and sides of the building (£1000) or by installation of fans to increase the air movement (£4000).
Extreme frequency 2 in 10 years
Adaptation option Modification of building Installation of fans
Capital invested £1,000 £4,000
Effect on profit £288 -£288
NPV £1770 -£1761
IRR 44% -2%
Break even frequency 0.72 events in 10 3.6 events in 10
Table 41 shows two levels of capital investment. In some situations, simple structural changes to the building such as opening the ridges and sides of the building may be sufficient to achieve the requirement improvement. In other situations, greater investment of capital will be required to install mechanical ventilation (fans) to improve the air movement in the building in order to reduce the risk of pneumonia. It was assumed that farmers would be unwilling to reduce stock numbers.
8.4.26 Increased Risk of Fly Strike in SheepThe prolonged warmer weather may mean sheep are more susceptible to fly strike. As a result, existing fly strike preventative treatments would be inadequate to protect the animal and an adaptation to deal with this would be required for animal health and welfare reasons as well as for productivity. Increased mortality could also result from higher fly strike incidence.
To prevent fly strike occurring in the flock during the weather conditions described above, the following are suggested:
Shear the sheep earlier
Routine dagging of dirty sheep around the rump/tail areas to ensure they are kept relatively clean and repeat every 4-6 weeks
Use preventative treatments more often than they are currently being used.
Prevention is better than treatment of this infestation. The earlier it is treated the better the success rate. To treat existing infestations the farmer will need to use a dip or pour-on containing cypermethrin. However this will not protect the sheep longer term against further attack.
The scenario used to assess the adaptation is to implement the husbandry changes described above as well as increasing the use of treatments to prevent fly strike. The
Page 83

scenario assumes that the integrity of the chemical treatments can be maintained and that there is no increased resistance developed as a result of increased use of the products. In the long term, if fly strike becomes a serious annual problem then a change of sheep breeds may be considered for example the use of Wiltshire Horn, an easy care breed with a wool shedding trait.
Table 42: Summary of routine increased use of chemicals to reduce impact of fly strike in sheep
Extreme event Frequency/timing of heat waves; Frequency/duration of wet spells
Adaptation Increased treatment of animal summer disease - fly strike
Impact of Extreme These are ideal conditions for fly strike to occur in lowland flocks. Seasons where sheep affected will be longer.
Description of adaptation Increase preventative treatment for fly strike for the longer season
Extreme frequency 4 in 10 years.
Frequency of treatments 1.6 in 10 years
Capital invested £0
Effect on profit £359
NPV 0%
Break even frequency 1.04 events in 10 years
Note, the numbers of treatments are less than the frequency of the events, as the treatments cover between an 8 to 16 week period. Current practice is estimated as a treatment frequency of 1.6 treatments per year.
Page 84

9. Selection of the Adaptations to be Included in the Detailed Costing ExerciseThe selection of up to ten adaptations for more detailed assessment was carried out in the following manner. The detailed assessments explore the impact of region and soil type on the costing as well as the sensitivity of the costings to the assumptions used. The purpose of the detailed costings is to add to the costed adaptations covered in Section 8 in terms of the implication of climate extremes on the industry at farm business level and at industry level. This will be useful information for Defra and other stakeholders on whether some level of intervention may be needed to meet wider Government and social expectations with regards the environment and land management.
9.1 Type of ProductionFirstly, a quota by type of enterprise was set to ensure that a wide range of enterprises was selected. The quota sets a limit on the number of adaptations which apply to any one type of production. The quotas were set as follows:
Table 43: Quota by enterprise
Type of agricultural and horticultural enterprises Number of Adaptations
Horticulture (but not more than one adaptation per crop) 2
Combinable cropping 2
Root crops 1
Total cropping adaptations 5
Dairying 1
Beef and sheep farms 2
Pigs 1
Poultry 1
Total livestock adaptations 5
Overall total adaptations 10
9.2 Profitability Profitability is an important aspect of any adaptation since it is linked with the probability and willingness of farmers to adopt them. In order to compare very different adaptations some common yardstick was required which could be applied across them all.
Return on capital was the chosen yardstick. Regardless of resources employed (land labour etc) and the time frame of adaptations, rate of return on capital can be used to assess the profitability of a change to the business to adapt to extreme weather events.
Rate of return on capital was calculated by two processes according to whether or not long term capital investments are made:
1. If the adaptation involves long term fixed capital investments, then the Internal Rate of Return (as % per year) was calculated from the Discounted Cash Flows.
Page 85
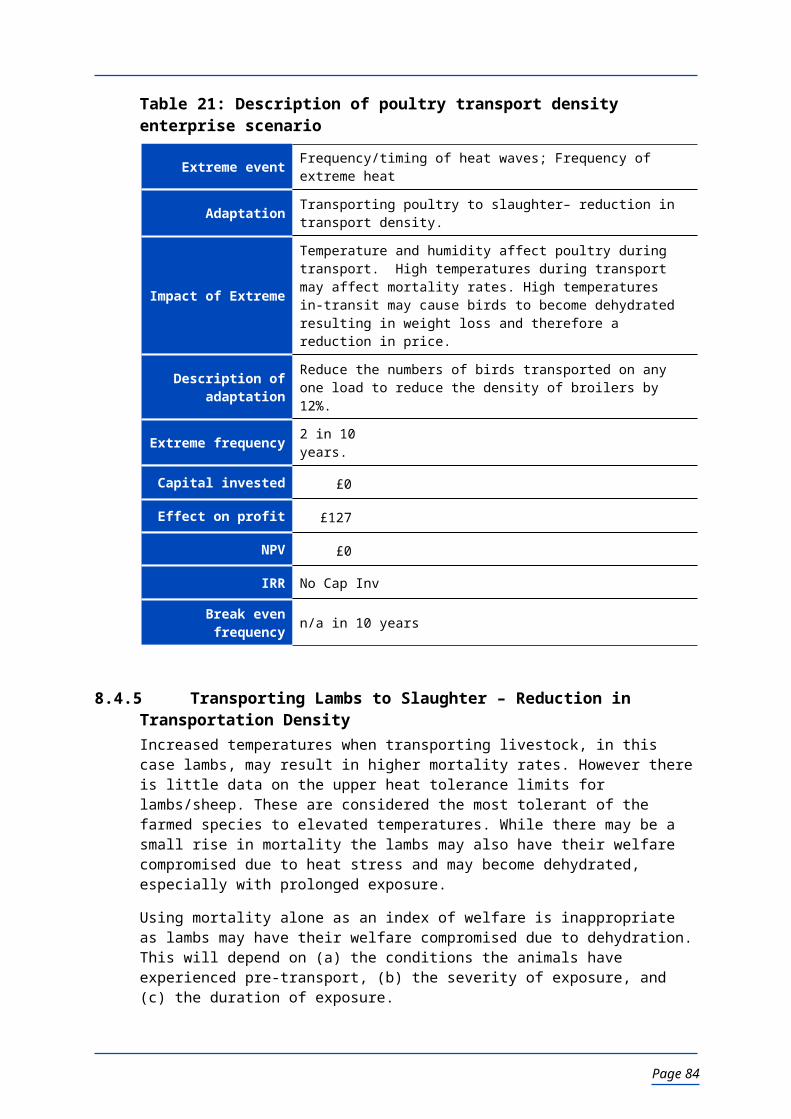
2. If the adaptation involves no long term fixed capital investments, the rate of return on extra capital employed (as % per year) was calculated by a farm business management specialist. An example of this is where an additional spray is used to increase the value of a crop at harvest. (There is no fixed investment and the interval from extra expenditure to increased revenue is only a few months).
The returns on capital calculated in these two ways (one applying to some adaptations and the other to the remainder) provided a single measure of profitability.
9.3 Selection of the ShortlistThe adaptations were ranked by profitability (return on capital) and selected until the enterprise quotas were filled (Rejection because quota is filled is Reason 1). During this process some additional questions were asked which could lead to rejection of adaptations. These were:
Are the adaptations so obviously worth doing (highly profitable) that further assessment will yield no additional insights (Reason 2)? An example here is reducing the stocking densities of broilers transported during hot weather. A small amount of additional lorry hire reduces mortality and brings very quick improvement in revenue. Further analysis seemed unlikely to reveal new information.
Is the adaptation more closely related to climate change than extreme events (Reason 3)? An example here was additional cropping of lettuce which would happen every year only if growing seasons were predictably longer.
Is the positive return in spite of a negative impact in profit (Reason 4)? This can occur where capital is released and profits decline. These adaptations were rejected on the basis that farmers and growers would in general not want to make changes that reduce profits.
Table 44 reports the result of applying these criteria are presented in the order of ranking on return on capital.
Page 86

Table 44: Selection of the shortlist for further economic evaluation
Extreme Weather Event Financial Assessment Short list
Adaptation Extreme Impact of Event Description of adaptationCapital
Invested (£)
Effect on Profit (£)
Overall return (%) Y/N
Cereals - spread flowering risk through different varieties
Frequency/timing of heat waves; Frequency/timing of frost
Earlier onset of flowering, increases the exposure to and risk of late frost. Late frost at flowering can result in loss of grain sites and thus loss of yield.
Change the variety of wheat that is sow. Plant three varieties which ripen at different rates in order to spread the risk.
237 >2000% n
Transporting Poultry to slaughter– Reduction in transport density.
Frequency/timing of heat waves; Frequency of extreme heat
Temperature and humidity affect Poultry during transport. High temperatures during transport may affect mortality rates. High temperatures in transport may cause birds to become dehydrated resulting in a loss in weight and therefore a reduction in price.
Reduce the numbers of birds transported on any one load. Reduce the density of broilers by 12%.
127 >2000% n
Avoidance of lodging through husbandry
Rainfall intensity; Frequency/duration of wet spells
The impact may result in plants becoming lodged which can lead to total loss of the crop, partial loss of the crop and can cause problems in harvesting the crop.
Purchase and application of a second growth regulator. 2949 1769% n
Animal summer disease - fly strike
requency/timing of heat waves; Frequency/duration of wet spells
These are ideal conditions for fly strike to occur in lowland flocks. Seasons where sheep affected will be longer
Increase preventative treatment for fly strike for the longer season 359 1111% y
Soil runoff (slope,soil dependant) - soil cons structures; plant seedlings/replanting
Rainfall intensity; Frequency/duration of wet spells
This event could cause some issues around germination and establishment. There may also be some issues around soil run off and loss of nutrients, leading to an increase use of inorganic fertilisers and therefore more issues associated with water pollution
Increased use of direct drilling to a more min till system -3899 183% n
Misting existing buildings
Frequency/timing of heat waves; Frequency of extreme heat
The increased temperature would result in existing systems being inadequate.
Introduce misting to cool the finishing pigs down 2,000 1581 100% n
Hail netting/covers - leaf damage
Rainfall intensity; Frequency/duration of wet spells
Hailstones will lead to damage to the leaves of crops and in particular to baby leaf salad crops. There is a potential for the whole crop to be destroyed by shredding of the leaves.
Invest in a hail netting to cover crop for protection from the hail stones 49,000 43145 74% n
Change in cultivation practice
Frequency/timing of heat waves;
Dry, hot weather causing soils to become baked hard resulting in unsuitable seed beds.
Invest in tillage system that is able to cope with the soil structure and
0 59 48% y
Page 87
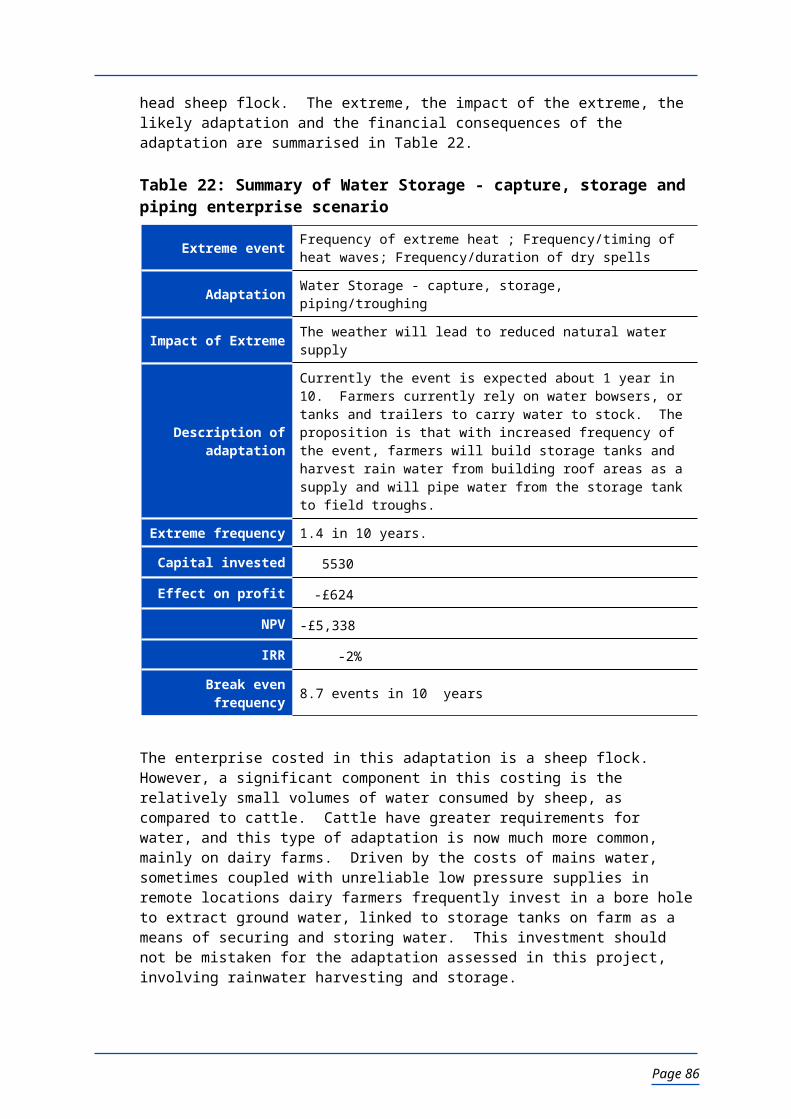
Extreme Weather Event Financial Assessment Short list
Adaptation Extreme Impact of Event Description of adaptationCapital
Invested (£)
Effect on Profit (£)
Overall return (%) Y/N
Frequency/duration of dry spells
This will affect germination and therefore impact upon yields. prepare the seed bed.
Windbreaks - vegetative (crops and infrastructure) - perennial
Rainfall intensity; Frequency/duration of wet spells
Reduced rates of blossom set and reduced tonnage from fruit by 15%. Damage to the structure of the bush/tree leading it to be less productive in future years
Implementation of a windbreak in the form of popular trees 3,600 -1466.4 47% n
Animal respiratory disease (winter)
Frequency/timing of heat waves; Frequency/timing of frost
Existing ventilation in livestock buildings are inadequate- leading to disease
The adaptation evaluated is to improve the ventilation 1,000 288 44% y
Double Cropping
Growing season length; Frequency/duration of dry spells; Frequency/duration of wet spells
Hot weather could extend the growing season resulting in the opportunity to double crop.
Plant two crops where previously only one was planted a season. 394 29% n
Irrigation in Top Fruit
Frequency/timing of heat waves; Frequency/duration of dry spells
Drought would affect yields and quality of fruit. It would also lead to poor tree growth and affect future years production.
Install irrigation system and progressively replace with more drought tolerant varieties.
18,200 -7 14% n
Windbreaks - vegetative (crops) - annual
Rainfall intensity; Frequency/duration of wet spells
Under extreme high wind events, the crop may suffer physical damage to the leave, thus rendering it to un-saleable. This is particularly important for unprotected crop
Construction of an artificial windbreak (e.g.Paraweb) 75,725 136 11% n
Hail netting/covers - fruit damage
Rainfall intensity; Frequency/duration of wet spells
In top fruit it may damage blossom and fruit, cause increase bruising, scabbing and holing. The crop will then only be suitable to juice and this will lead to less economic return from the crop
Increase use of netting over the crop all year round 70,554 80 10% n
Removal of field heat - short term cooling
Frequency/timing of heat waves; Frequency of extreme heat
Excessive heat may lead to soft fruit, reduced shelf life and reduced quality, with lower returns for the crop or rejected fruit.
Investment into cold storage in the field to pull down the crop temperature sooner. There will be adequate permanent cold storage on site
4,000 1 10% y
Irrigation – veg to aid harvest operation
Frequency/timing of heat waves;
Soil hardening More frequent irrigation pre crop establishment and prior to harvest
6,600 -493 8% n
Page 88

Extreme Weather Event Financial Assessment Short list
Adaptation Extreme Impact of Event Description of adaptationCapital
Invested (£)
Effect on Profit (£)
Overall return (%) Y/N
Frequency/duration of dry spells of some crop
Irrigation- potatoes
Frequency/timing of heat waves; Frequency/duration of dry spells
Hard ground. Tubers production would be compromised, and the hard ground would result in damage at harvested
Irrigate potatoes more often during this weather period to soften the ground. The scenario is to increase the water storage capacity to facilitate an additional 50 mm of irrigation in the summer period.
66,000 -2427 6% y
Long term storage
Frequency/timing of heat waves; Frequency/timing of frost
Excessive heat will affect the crop by increasing the amount of rotting, viability of bruising, both leading to rejection of loads. It will cause the breakdown of starch in the potato and therefore quality
Increase the amount of refrigeration on the current system of the store in order to pull down the store temperature in the same period of time
20,000 -658 6% n
Insulation of existing buildings
Frequency/timing of heat waves; Frequency of extreme heat
Weather too warm for the sow inside the arc and this would have detrimental effect on the piglets inside
Insulate the arcs to keep sows cool and encourage them to stay with piglets
7,000 -1033 2% n
Year round feed supply - maize silage in dairy
Frequency/timing of heat waves; Frequency and duration of dry spells
Warm weather would lead to poor grass growth. Would need enough maize silage to see stock through the summer months (i.e. June – end Aug). This may lead to reduced cattle numbers to order to ensure that adequate level feed is available to all cattle.
Replace the area of grass lost with maize silage and reduce cattle numbers to levels that adequate levels of forage can be produced
0% n
Transporting Lambs to slaughter – Reduction in transport density.
Frequency/timing of heat waves; Frequency of extreme heat
Temperature and humidity affect Lambs during transport. High temperatures during transport may affect mortality rates.
Reduce the number of lambs transported on any one load. Reduce the density of lambs by 10%.
0% n
Hard standing design spec for flash flooding
Rainfall intensity; Frequency/duration of wet spells
Flash flooding could cause problems for housed animals with regards to increase foot problems, increase mastitis cases stress on the animal and as a result reduce milk yields
Adapt and alter current drainage system and storage facilities in order to increase the capacity reduce the amount of dirty water and the effects on the cattle
0% n
Power Supply Loss due to Wind.
Rainfall intensity; Frequency/duration of wet spells
Loss of power on a dairy farm could result in: Inability to milk resulting in a loss of milk. Impact upon lactating cows causing a longer term fall in milk pr
Purchase a standby PTO generator. 2,000 -209 0% n
Page 89

Extreme Weather Event Financial Assessment Short list
Adaptation Extreme Impact of Event Description of adaptationCapital
Invested (£)
Effect on Profit (£)
Overall return (%) Y/N
Water Storage - capture, storage, piping and drinking troughs
Frequency/timing of heat waves; Frequency/duration of dry spells
The weather will lead to reduced natural water supply
Currently the event is expected about 1 year in 10. Farmers currently rely on water bowsers, or tanks and trailers to carry water to stock. The proposition is that with increased frequency of the event means that farmers will build storage tanks and rainwater harvesting systems.
5,530 -624 -2% y
Crop splash prevention – Covers.
Rainfall intensity; Frequency/duration of wet spells
Higher, more intense rainfall will lead to greater soil splash onto fruit of rows grown on the outer rows of ‘Spanish’ tunnels
Replace…. Install woven plastic sheeting between outer crop rows to minimise soil splash and encourage absorption of excess water into the soil
6,000 -818 -6% n
Ventilation Existing Building
Frequency/timing of heat waves; Frequency of extreme heat
Existing ventilation would be inadequate and would result in higher mortalities and production problems
Improve ventilation by installing 48 inch fans to pull air through the building
64,000 -9183 -8% y
Change of Cultivar (perennial)
Frequency/timing of heat waves; Frequency/timing of frost
Lack of windchill due to mild winters results in reduced or uneven budbreak, variability in development and uneven ripening. This leads to reduced yields and the processors will not accept samples with green fruit
Progressively grub existing plantations and replant with low chill varieties from New Zealand and France. In the short term use dormancy breaking sprays until all bushes are replaced.
25 -120% n
Soil runoff (slope, soil dependant) - soil cons structures and management costs re maize
Rainfall intensity; Frequency/duration of wet spells
A large amount of water, during the autumn period will lead to soil structure damage. Large ravines and gullies, excessive water pollution, low levels of soil organic matter.
More attention to methods to improve soil conservation post maize harvest
-167 -620% n
Page 90

10. Detailed Economic Assessment of the Short Listed Adaptations The economic costings prioritised in section 9 were expanded within this more detailed costing exercise. This addition of detail was largely through incorporation of regional data, e.g. regional extreme frequencies demonstrating that heat will be more of an issue in the south relative to the northerly regions of the UK. In addition, multiple options were included e.g. improvement of animal housing to address the increased incidence of calf pneumonia as well as a simple vaccination scheme which would achieve a similar goal. These detailed economic costing of seven adaptations are included in the following sections.
10.1 Frequency AnalysisThe detailed economic costing exercise required frequencies of occurrence of the extremes and their impacts as this affects the partial budgets (loss rates and period over which the costs of adaptation may be recouped). These frequencies are very specific to each sector and impact described and typically relate to specific timings of operations or time of year e.g. harvesting or winter housing of livestock. They also need to relate to a defined threshold to which a loss rate is ascribed and to which the industry and sector are thought likely to respond. The extremes chosen while being related to these impacts could not always be considered in the absence of other factors, for example pneumonia in cattle housed during winter is not just a function of winter heat waves but also relative humidity and wind. As such the mapping exercise reported in section 4 was not able to contribute directly to this exercise. Rather, a simplified bespoke frequency analysis was undertaken incorporating these additional requirements.
10.2 MethodologyThis approach needed to capture the regional variation required for the detailed costing exercise and as such a representative single HADRM3 climate grid cell for each region was selected, namely: Northern Ireland (Londonderry), Scotland (Aberdeenshire), North West (Yorkshire), North East (Lancashire), East (East Anglia), West/Welsh Borders (Herefordshire), South East (Kent) and South West (Cornwall). For each grid cell, current (1961-1990) and future (2071-2100) modelled climate was used to derive the frequencies. The 2070’s data was scaled back to the 2020’s using the approach described in section 4.
The variables required for each adaptation and the thresholds required to trigger an impact and ergo an adaptation were defined from both the literature as well as expert opinion and are summarised in Table 45. These impact periods were cross-checked with the extremes to which they were originally attributed to ensure that the scope of the project had not altered, for example, the pneumonia days derived are typically associated with winter heat waves and spoilage days in soft fruit are always associated with summer heat waves. The frequencies calculated were scrutinised by a range of experts who assessed if the current frequencies were in line with what they expected.
In most cases the frequencies were as expected, especially with respect to inter-regional differences. However, the HADRM3 soil moisture data used for some of the adaptations is affected by the very broad and general soil types used in the model with all regions having the same soil type except for East Anglia which has a soil with a lower soil water capacity and as such dries out much quicker heightening the inter-regional differences. It should also be noted that in keeping with the overall project to target the arable and mixed systems of eastern and northern Scotland, the frequencies outlined will not always be appropriate for the western highlands/isles as the east-west gradients displayed in other parts of the UK (e.g. North East and North West England) will be mirrored in Scotland.
Page 91

Table 45: Summary of the variables and thresholds used to derive the frequency analysis
Sector Extreme Adaptation Description including Variables and Thresholds
Poultry
Frequency/timing of heat waves; Frequency of extreme heat
Housing redesign - improved permanent ventilation
The poultry crop is affected by heat most during days 30-42 of the crop cycle when the birds are nearly fully grown and space within the poultry house is at a premium. These periods are typically during the summer. More than one crop can be impacted by a heat wave or extreme heat period with losses occurring not only to due to more intense heat but potentially because there are more of them in a year. The analysis defined critical hot days by findings spells of 2 days or more where the Tmax > 30 C. It was assumed that given the number of operations in any region that at any one time there would be an operation with a flock at the required growth stage. An optimized routine searched all subsequent day 30-42 periods allowing a 7 day window between crops to define the maximum number of crops in a year that may be impacted by heat.
Beef & Sheep
Frequency/timing of heat waves; Frequency/duration of dry spells
Storage reservoirs/Water capture
The lack of natural water in streams requiring the provision of water for stock is difficult to model simplistically and using more sophisticated models was beyond the scope of the project. The analysis defined dry days as days on which the available soil moisture was below 10 mm and precipitation was below 1 mm. The number of dry days between July and October were totalled and years where more than 30 such days occurred defined as years in which natural water would be difficult to access.
Arable - Root crops
Frequency/timing of heat waves; Frequency/duration of dry spells
Irrigation- potatoes
Running a sophisticated water budgeting/irrigation scheduling model like Irriguide for each region was beyond the scope of the project. However, using experience gained from developing/using this model and drawing on 20 years of potato irrigation trial data from the ADAS Gleadthorpe Farm the following parameters were defined. Years in which irrigation would not be sufficient were years in which the soil moisture at the start of the growing season (mm) + precipitation (mm) + 150 mm of irrigation water < 375 mm.
Horticulture - Soft fruit
Frequency/timing of heat waves; Frequency of extreme heat
Investment in cooling and transport temperature control
Soft fruit spoilage is a function of fruit temperature which is affected by maximum temperatures during the daytime and ambient air temperature at night. Days on which this spoilage would take place were defined as days where TMax > 30C and TMin > 15C. Years with one or more of these days were determined as well as the average number of spoilage days per year.
Arable - Cereals
Growing season length; Frequency/timing of frost
Spread risk - grow range of varieties with different flowering dates
Frost days were defined as days where TMin < 0C during the flowering period, namely, May/June. The number of years in which this would potentially be a problem was determined.
Beef & Dairy Frequency/timing of heat waves; Frequency/timing of frost
Housing redesign - improved permanent ventilation
The incidence of Enzootic Calf Pneumonia (ECP) in cattle is difficult to model as there are three suites of causative factors with many of these poorly understood, namely etiological agents which include a range of viruses, calf factors which include nutrition and age and environmental factors. This model focuses on the environmental factors as these are the factors addressed within the adaptation. Potential ECP periods were defined as days where TAve > 10C, RH > 90% and wind speed is < 6.5 km/hr for 3 or more days during the period
Page 92

Sector Extreme Adaptation Description including Variables and Thresholds
October to February. Years with one or more of these periods were defined as years in which pneumonia was likely.
Sheep
Frequency/timing of heat waves; Frequency/duration of wet spells
Increased dipping
The flystrike season length was determined as the first and last five day period where TAve > 8.5C. Within these seasons the flystrike days were defined for 3 different periods, namely pre-shearing, post-shearing when fleece in adults and lambs is growing and late season when it is fully grown. The fleece length affects the fleece humidity as well as the amount of rainfall required to get the fleece wet. Using the model described by Wall et al. (2002) the following parameters were defined:
Pre-shearing (until 18 June): TAve > 8.5C and Precip or Precip + fleece moisture (mm) > 5 mm
Post-shearing 1 (19 June till 30 September): TAve > 8.5C and Precip or Precip + fleece moisture (mm) > 15 mm
Post-shearing 2 (30 September till end of season): TAve > 8.5C and Precip or Precip + fleece moisture (mm) > 5 mm
Page 93

10.3 Ventilation of Broiler House10.3.1 Background Data
The climate extreme is ambient daytime temperature exceeding 30oC for at least 2 days coinciding with birds at or near market weight on a broiler farm, i.e. typically between flock ages of 30 – 42 days. In the initial 2 days of temperature above 30°C, heat stress mortality can result, especially in humid weather. If the event is pro-longed, mortality tends not to increase, but the remaining flock have a reduction in flock target weights. Broiler houses are significant capital investments with design life of at least 25 years with some still being used that are over 40 years old. While the specification of these buildings is not the same as current new buildings, the strategic decision taken by the majority is to retain the older broiler houses making what ever changes can easily be done, as opposed to demolition and erection of new buildings.
Current expected output of, for example, 120,000 birds with normal 3% mortality per crop leaves 116,400 birds per cycle, at an average weight of 2.2 kg/bird and a value of £1.40/bird. This generates and output value of £162,960 per crop.
Failure to undertake any hot weather adaptations in standard houses built more than 10 years ago could result in 20% mortality and reduced weight for those birds that survive. For those that survive, the target weight of 2.2 kg/bird will not be achieved; it is assumed that weights will be 90% of the target. (= 1.98 kg).
93,000 birds will finish the cycle at a value of £1.29, a loss of up to £43,269 on income per cycle effected by the extreme weather event.
The adaptations are based on known techniques of cooling livestock. Cooling can be carried by any one or a combination of the following:
Increased air change (removing heated air from the house)
Increased air speed (creating a wind-chill effect)
Air conditioning using in-house evaporative cooling by water misting or by absorption refrigeration (reduction of in-house temperature)
Under-floor cooling pipes (cooling the floor, litter and birds by conduction)
Air conditioning using external evaporative cooling (pre-cooling of air outside the house)
In the majority of situations, all but the under floor cooling could be achieved within existing broiler houses. Under floor cooling coupled with external air conditioning would provide very good temperature control, but would require a new build costing about £1,500,000 as compared to about £960,000 for a conventional specification currently being erected.
The suggested adaptation can be summarised as installation of additional low pressure fans to increase the cooling effect by wind-chill, coupled with evaporative cooling by misting system, in a tunnel format. The capital cost of installation for a unit comprising 120,000 bird capacity in 4 individual houses is estimated at £64,000.
10.3.2 Climate DataThe climate data currently indicates the frequency of high temperature weather events, above the temperature threshold set for the scenario could be expected 2.6 times in a 10 year period with a predicted increase to 4.25 times in 10 years by 2020. Figure 17 shows the regional variation in these extreme frequencies.
) Page 94

Figure 17: Frequency of extreme heat event, by region (for ventilation in poultry houses)
0
1
2
3
4
5
6
7
8
SouthWest
South East East Anglia WelshBorders
North East North West Scotland N. Ireland
Freq
uenc
y (y
rs in
10
year
per
iod)
Current Future
10.3.3 Economic Impact of the AdaptationThe economic impact of the scenario is summarised in Table 46.
Table 46: Summary of economic impact of scenario and adaptation on a 4 house broiler unit
Current Future
Frequency (events in 10 years)
2.6 in 10 yrs 4.2 in 10 yrs
Impact of event if no adaptation made
-£9,554
Undertake the adaptation Capital £64,000
Trading costs Every year £10,932
Event related £808
Profit/loss -£7,600
Internal rate of return N/A
Net present value -£44,261
Break even frequency (events in 10 years)
13.0 in 10 yrs
Table 47 indicates the predicted economic losses caused by the extreme based on the current facilities. It also show that in this case the capital costs of the investment are so great that, economically speaking, producers would be better of not making the investment and accepting the loss of birds.
The scenario and economic impact is sensitive to changes from the assumption used.
) Page 95

Table 47: Sensitivity to impact of extreme event on mortality in the house
Freq
uenc
y of
Ext
rem
e (
year
s in
10
year
s)
Mortality rate increased by
5% 10% 15% 20% 25% 30% 35%
Effect on profit (£)
1 -10582 -10368 -10154 -9939 -9725 -9511 -9297
2 -10233 -9804 -9375 -8947 -8518 -8090 -7661
3 -9883 -9240 -8597 -7954 -7311 -6669 -6026
4 -9533 -8676 -7819 -6962 -6105 -5247 -4390
5 -9183 -8112 -7041 -5969 -4898 -3826 -2755
6 -8834 -7548 -6262 -4977 -3691 -2405 -1119
7 -8484 -6984 -5484 -3984 -2484 -984 516
8 -8134 -6420 -4706 -2991 -1277 437 2152
9 -7784 -5856 -3927 -1999 -70 1858 3787
10 -7435 -5292 -3149 -1006 1137 3280 5422
Table 47 shows the impact on the profitability of changes in the assumed mortality rate and the frequency of the event. It is clear that the frequency of the extreme and the mortality rate have both to increase significantly before the investment in cooling makes a positive contribution to the calculated profitability of the unit.
In practice, no UK producer would permit mortality to increase to the levels indicated before the investment was considered worth while.
Table 48: Sensitivity to frequency of event and capital cost of adaptation
Freq
uenc
y of
Ext
rem
e (
year
s in
10
year
s)
Capital cost of conversion
£34,000 £44,000 £54,000 £64,000 £74,000 £84,000 £94,000
Effect on profit (£)
1 -5331 -6961 -8591 -10221 -11851 -13481 -15111
2 -4619 -6249 -7879 -9509 -11139 -12769 -14399
3 -3908 -5538 -7168 -8798 -10428 -12058 -13688
4 -3196 -4826 -6456 -8086 -9716 -11346 -12976
5 -2485 -4115 -5745 -7375 -9005 -10635 -12265
6 -1773 -3403 -5033 -6663 -8293 -9923 -11553
7 -1062 -2692 -4322 -5952 -7582 -9212 -10842
8 -350 -1980 -3610 -5240 -6870 -8500 -10130
9 361 -1269 -2899 -4529 -6159 -7789 -9419
10 1072 -558 -2188 -3818 -5448 -7078 -8708
The factors motivating farmers to make the decision to invest in adaptations for climate extremes are almost entirely marketplace issues. Producers will have a supply contract with a processer. The contract specification will be set by the end point retailer, usually a supermarket,
) Page 96

for whom the birds are being produced. The capital investment made by the farmers to produce broilers is significant. The viability of the broiler production is largely dependent on maintaining the supply contract to the named processor or supermarket.
Having made the considerable investment in facilities to produce broilers, the farmers will be motivated to maintain the contract. If, as predicted, the frequency of high temperature climate extremes increases, producers will make the adaptation to maintain welfare standards and meet contract specifications. Failure to undertake necessary preventative actions might result in farmers being in breach of contract and the contract to supply could be terminated. Having invested hundreds of thousands of pounds if not millions of pounds in production facilities, the capital cost of adaptation is modest. Loss of supply contract would have much greater impact on farm profitability.
The impact of the climate extreme on performance in this case on mortality, will vary depending on the relative humidity as well as the absolute temperature. Chickens cool by panting; the greater the relative humidity the less effective panting will be as a means of cooling. In the extreme weather of August 2003, it was noted that broilers suffered less heat stress on the east of the country where humidity was lower than in the west.
An environmentally positive solution to the extreme event is to reduce the stocking density in the buildings. This however has the effect of reducing the mass of birds in the building and thus reducing the impact of the climate extreme.
Reducing the housing density is not, however, a reliable adaptation to deal with the hottest of climate extremes. It is not possible to predict an incident 4-5 weeks in advance and the policy would have a severe impact on the forward planning of chicks from breeding companies. Producers relying solely on reduction in stocking do not have alternative strategies available to them if needed. Installation of mechanical misting and extra fans to move the air offer greater reliability in temperature extremes.
The other difficulty in reducing stocking is the impact it has on the overall profitability and viability of the unit. Margins are currently very low pence per bird reducing density reduces the efficiency of production with overheads being covered by fewer birds.
For the purposes of this report the assumption is made that there is no regional variation in the enterprise performance. In practice there maybe some variation in costs of inputs, by region, this is a function of distance from the main cereal growing regions and the feed mills producing poultry feeds. While there will be variation in performance from one unit to the next, the differences are not a material consideration. The two important factors affecting the costs are the initial capital costs of the adaptation and the anticipated mortality from failure to make the adaptations
The costed adaptation, complete with the sensitivity analysis reported in Table 47 and Table 48 indicates that in isolation, the combination of frequency of event, mortality impact of the event and the capital costs of adaptation, the investment in the adaptation would not be worthwhile.
The most important consideration for the poultry producer is the impact that the heat stress mortality has on retention of the contract to supply. Loss of contract to supply a major retail supermarket would have much greater impact on the viability of the business than any high temperature weather extreme.
) Page 97

Table 49: Economic impact of the adaptation – regional results
Profit (£) IRR (%) NPV (£)
Current Future Change Current Future Current Future
N. Ireland -10932 -10390 542 -8% -7% -55506 -52174
Scotland -10346 -9375 971 -7% -5% -51906 -45941
North East -10057 -8221 1837 -6% -2% -50132 -38848
East Anglia -5685 -4495 1189 3% 5% -23264 -15956
Welsh Borders -7722 -5895 1828 -1% 2% -35785 -24554
South East -5973 -4679 1294 2% 5% -25037 -17084
South West -8020 -6078 1941 -2% 2% -37612 -25682
North West -10346 -8623 1723 -7% -3% -51906 -41319
Table 49 shows that while there are regional variations in terms of the effect on profit and the return on capital, economically all regions show a net loss if the adaptation is to be undertaken.
10.4 Long Term Water Storage - Livestock Farms10.4.1 Background Data
The long term dry weather would lead to natural water courses being unavailable for livestock to drink. Currently farmers deal with this situation by carrying water to stock in bowser or tanks on trailers, taking water from mains supplies. However the costs of mains water and uncertainty about the reliability of volumes needed means that the farmer will consider the capture and storage of rain water for stock. This would be achieved by investing in a storage tank for capturing rainfall during the winter months and wetter periods. The water would be captured from building roofs.
Legislation re NVZ and water diffuse pollution could soon mean that animals will no longer be allowed to drink directly from water courses.
Utilisation of the stored water will require piping from the storage tank to the fields or areas that require this water. During a drought situation, water would be piped to the nearest fields and would be positioned to enable all sheep to have access to some water on a daily basis.
) Page 98

10.4.2 Climate DataThe climate data indicates currently the frequency of high temperature weather events, above the temperature threshold set for the scenario could be expected 1.42 times in a 10 year period with a predicted increase to 2.23 times in 10 years by 2020. Figure 18 shows the regional variation in frequencies.
Figure 18: Frequency extreme heat event, by region (for long term water storage on livestock farms)
0
1
2
3
4
5
6
7
8
SouthWest
SouthEast
EastAnglia
WelshBorders
NorthEast
NorthWest
Scotland N. Ireland
Freq
uenc
y (y
rs in
10
year
per
iod)
Current Future
10.4.3 Economic Impact of the Adaptation The economic impact of the scenario is summarised in Table 50.
Table 50: Summary of economic impact of scenario and adaptation to capture and store water for livestock farms
Current Future
Frequency 1.4 in 10 yrs 2.2 in 10 yrs
Impact of event if no adaptation made £1,463
Undertake the adaptation Capital £5,530
Trading costs Every year £ 647
Event related £ 100
Profit/loss -£421
Internal rate of return N/A
Net present value -£3,604
Break even frequency 5.1 in 10 yrs
The scenario and economic impact is sensitive to changes from the assumption used.
) Page 99

Table 51: Sensitivity to the length of the dry period over which drinking water would not be available to the livestock
Freq
uenc
y of
Ext
rem
e (
year
s in
10
year
s)Dry days over which water has to be carried to stock
15 days 20 days 25 days 30 days 35 days 40 days 45 days
Effect on profit (£)
1 -691 -681 -671 -661 -651 -641 -631
2 -634 -614 -594 -574 -554 -534 -514
3 -578 -548 -518 -488 -458 -428 -398
4 -522 -482 -442 -402 -362 -322 -282
5 -466 -416 -366 -316 -266 -216 -166
6 -409 -349 -289 -229 -169 -109 -49
7 -353 -283 -213 -143 -73 -3 67
8 -297 -217 -137 -57 23 103 183
9 -240 -150 -60 30 120 210 300
10 -184 -84 16 116 216 316 416
Table 52: Sensitivity to frequency of event and capital cost of adaptation
Freq
uenc
y of
Ext
rem
e (
year
s in
10
year
s)
Change in capital cost
£2,530 £3,530 £4,530 £5,530 £6,530 £7,530 £8,530
Effect on Profit (£)
1 -310 -427 -544 -661 -778 -895 -1012
2 -223 -340 -457 -574 -691 -808 -925
3 -137 -254 -371 -488 -605 -722 -839
4 -51 -168 -285 -402 -519 -636 -753
5 35 -82 -199 -316 -433 -550 -667
6 122 5 -112 -229 -346 -463 -580
7 208 91 -26 -143 -260 -377 -494
8 294 177 60 -57 -174 -291 -408
9 381 264 147 30 -87 -204 -321
10 467 350 233 116 -1 -118 -235
) Page 100

Table 53: Economic impact of the adaptation – regional results
Profit (£) IRR (%) NPV (£)
Current Future Change Current Future Current Future
N. Ireland -747 -747 0 - ! 0% -5906 -5906
Scotland -661 -565 96 - ! -1% -5171 -4355
North East -661 -586 74 - ! -1% -5171 -4539
East Anglia -287 -170 117 5% 8% -1990 -990
Welsh Borders -689 -583 106 - ! -1% -5413 -4510
South East -546 -450 96 0% 2% -4194 -3378
South West -661 -597 64 - ! -2% -5171 -4627
North West -747 -737 10 - ! - ! -5906 -5818
The frequency of extreme events has been predicted and is shown for each of the regions in Figure 18. The regional data indicates that currently the South East and East Anglia are most likely to experience the climate extreme that results in farmers having to supplement or replace natural water supply for livestock.
This scenario is affected by the soil type in the region. The lighter soils are more prone to water courses drying up than is the case for the heavier soils with a greater clay or silt content. In the UK situation it is anticipated that farmers will provide water for stock as opposed to the alternative option of destroying the stock. Movement of the stock to regions of better water supply is not a widespread option, but it would be a practice on some farms where alternative grazing could be identified.
From the environmental perspective reliance on natural water courses may not be permitted anyway. Stock exclusion provides better biodiversity options along riparian corridors. It also makes a significant contribution to water quality management. The requirement for improved environmental management is expected to be the driver for change rather than any expectation from farmers of drinking water shortages.
The costed components of this adaptation are substitution of mains water supply transported to livestock with captured rain water piped to the stock. It is assumed that the technical performance of the livestock is unaffected by the source of water and its method of supply. In practice the adaptation may provide a better solution than transporting water, as it should ensure that stock always have access to fresh water. There may be occasions when troughs run dry for a few hours where all water has to be transported to the stock.
Considering the cost of adaptation, the frequency of event is not sufficient to merit the investment on financial grounds alone. ADAS’ expectation is that uptake of this adaptation is likely to be modest. The second consideration likely to reduce the uptake of the adaptation is the layout of many farms. In practice farms have land in more than one single block i.e. not all the fields are next to each other. The adaptation requires water to be captured from roofs pumped to a header tank from which gravity feed supplies the drinking trough. It will not be practical to link all of the fields not located to the main farm to a pipe system. Installation of multi-systems will not be an alternative to overcome the location problems as many blocks of land do not have buildings from which water can be harvested.
) Page 101

Alternatives practised on some farms are to build water tanks to capture and store water from springs, field drains and watercourses. In the main this extraction and holding of water is done without the knowledge or consent of appropriate authorities. While this is a practical on-farm solution it is not considered an adaptation to be costed in this project as it depends on field specific conditions (available water) and topography (fall to allow gravity feed of troughs). Often the capacity of these systems is not adequate to provide a reliable solution for water supply in a climate extreme.
10.5 Irrigation to Soften Ground and Maintain Potato Output 10.5.1 Background Data
The climate extreme considered in this adaptation is prolonged dry weather leading to summer drought, poor crop growth and harvesting difficulties. The majority of potato crops receive irrigation but in a very dry season there is often insufficient water, or machinery to apply the water, to meet crop requirements. The need for irrigation is dependant on soil series, soil texture and local weather patterns. Historically, farmer plan to supply sufficient water to meet crop demand during the 5th driest year in 20 years. In scenarios where the number of extreme drought years increases it is likely that yield losses will force a re-evaluation of this practice and result in a need to increase irrigation capacity. This adaptation involves the need to secure additional water and possibly extra machinery. Additional to the issue of poor growth due to drought, soil conditions at harvest can adversely affect tuber quality and therefore crop value. On heavier land, the soil becomes hard which results in tuber damage, mostly bruising, during harvesting On light land, the soil does not harden but the soil is so dry it falls away from the potatoes too quickly as it passes up the first web of the potato harvester. Again this causes bruising as the soil is not present to absorb some of the mechanical shocks encountered. The adaptation here is to apply irrigation to soften the soil before harvest.
The cost to the grower can be considerable, due to lost yield and the rejection of whole loads at processing factories
In assessing this scenario it is assumed that the Environment Agency would prevent summer abstraction of water due to the adverse impact this would have on water flow in the prolonged dry period. It is also assumed that there is no surplus stored water on the farm as the currently available capacity of stored water, is required and used in the growing season. The farmer adaptation to this event will be to increase the storage capacity by the application of a winter fill license for abstraction from a river to a purpose build on-farm reservoir, together with the purchase of additional machinery to apply irrigation water.
) Page 102

10.5.2 Climate Data The climate data indicates currently the frequency of high temperature weather events, above the temperature threshold set for the scenario could be expected 2.35 times in a 10 year period, with a predicted increase to 3.82 times in 10 years by 2020. Figure 19 shows the regional variation in frequencies.
Figure 19: Frequency extreme heat event, by region (for pre-harvest irrigation of potatoes)
0
1
2
3
4
5
6
7
8
SouthWest
South East East Anglia WelshBorders
North East North West Scotland N. Ireland
Freq
uenc
y (y
rs in
10
year
per
iod)
Current Future
10.5.3 Economic Impact of the AdaptationThe economic impact of the scenario is summarised in Table 54.
Table 54: Summary of economic impact of scenario and adaptation to abstract and store sufficient water to allow 50 mm of additional irrigation on potatoes
Current Future
Frequency 2.4 in 10 yrs 4.0 in 10 yrs
Impact of event if no adaptation made £30,094
Undertake the adaptation Capital £66,000
Trading costs Every year £7,196
Event related £9,800
Profit/loss £836
Internal rate of return 11.41%
Net present value £7,865
Break even frequency 3.55 in 10 yrs
) Page 103
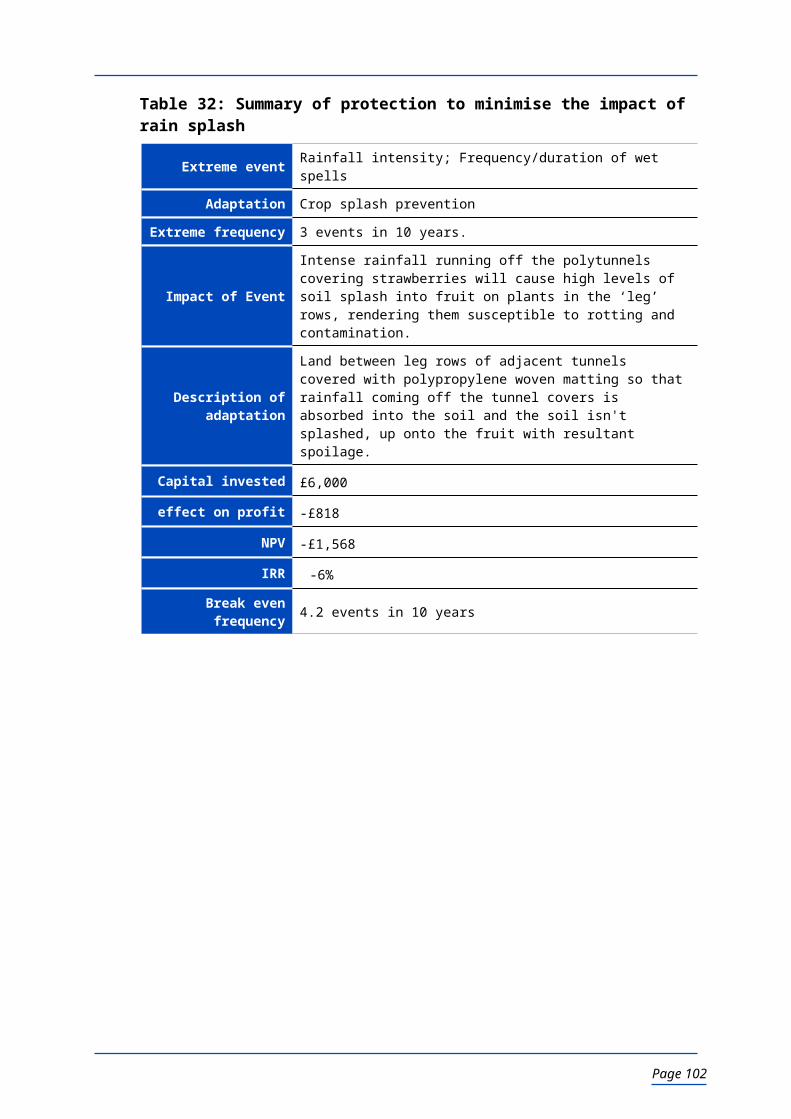
The scenario and economic impact is sensitive to changes from the assumption used.
Table 55: Sensitivity to the “normal” yield potential of the crop Fr
eque
ncy
of E
xtre
me
(ye
ars
in 1
0 ye
ars)
Normal yield (tonnes per hectare)
36.5 38.5 40.5 42.5 44.5 46.5 48.5
Effect on profit (£)
0.5 -6314 -6281 -6248 -6214 -6181 -6148 -6115
1 -5432 -5365 -5299 -5233 -5167 -5100 -5034
1.5 -4550 -4450 -4351 -4251 -4152 -4052 -3953
2 -3668 -3535 -3402 -3270 -3137 -3005 -2872
2.5 -2785 -2620 -2454 -2288 -2122 -1957 -1791
3 -1903 -1704 -1506 -1307 -1108 -909 -710
3.5 -1021 -789 -557 -325 -93 139 371
4 -139 126 391 657 922 1187 1452
4.5 743 1041 1340 1638 1936 2235 2533
5 1625 1957 2288 2620 2951 3283 3614
Table 56: Sensitivity to frequency of event and impact on yield
Freq
uenc
y of
Ext
rem
e (
year
s in
10
year
s)
Impact of the extreme - total yield loss (tonnes per hectare)
0 3 5 7 9 11 13 15
Effect on profit (£)
1 -8176 -7156 -6476 -5796 -5116 -4436 -3756 -3076
2 -9156 -7116 -5756 -4396 -3036 -1676 -316 1044
3 -10136 -7076 -5036 -2996 -956 1084 3124 5164
4 -11116 -7036 -4316 -1596 1124 3844 6564 9284
5 -12096 -6996 -3596 -196 3204 6604 10004 13404
6 -13076 -6956 -2876 1204 5284 9364 13444 17524
7 -14056 -6916 -2156 2604 7364 12124 16884 21644
8 -15036 -6876 -1436 4004 9444 14884 20324 25764
9 -16016 -6836 -716 5404 11524 17644 23764 29884
10 -16996 -6796 4 6804 13604 20404 27204 34004
) Page 104

Table 57: Sensitivity to frequency of event and capital cost of adaptation
Freq
uenc
y of
Ext
rem
e (
year
s in
10
year
s)Capital Investment Required
£46,000 £51,000 £56,000 £61,000 £66,000 £71,000 £76,000 £81,000 £86,000
Effect on profit (£)
0.5 -4061 -4591 -5121 -5651 -6181 -6711 -7241 -7771 -8301
1 -3047 -3577 -4107 -4637 -5167 -5697 -6227 -6757 -7287
1.5 -2032 -2562 -3092 -3622 -4152 -4682 -5212 -5742 -6272
2 -1017 -1547 -2077 -2607 -3137 -3667 -4197 -4727 -5257
2.5 -2 -532 -1062 -1592 -2122 -2652 -3182 -3712 -4242
3 1012 482 -48 -578 -1108 -1638 -2168 -2698 -3228
3.5 2027 1497 967 437 -93 -623 -1153 -1683 -2213
4 3042 2512 1982 1452 922 392 -138 -668 -1198
4.5 4056 3526 2996 2466 1936 1406 876 346 -184
5 5071 4541 4011 3481 2951 2421 1891 1361 831
The decision to make the investment in increased water storage capacity is more complex than just economic return alone. The potato growers will wish to maintain the supply contracts with the processor which will be a positive incentive to make the investment. Increasingly producers are considering the unit cost of producing the tonne of potatoes. At the outset, the growers do not plan for a long dry period. In this scenario the normal yield expectation is 40 tonnes of potatoes sold per hectare. The investment in inputs (seed, fertiliser and sprays) will be made on the basis that the return will be 40 tonnes per hectare. Similarly the investment in machinery, equipment and even storage will all be based on this level of yield. From this information the producers are in a position to estimate the unit cost of production. In the year of the climate extreme, the costs have been invested and it is not until the end of the season at harvest when it becomes apparent that the yield potential has not been achieved. The impact on the unit cost can be dramatic. A typical cost of production might be £110 per tonne in a normal year. In the costed adaptation the predicted yield loss is 8.8 tonnes per hectare, which increases the cost of production of the remaining 31.2 tonnes per hectare to over £141 per tonne, an increase of £31 per tonne. In comparison, making the adaptation increases the costs of production across the enterprise as a whole by about £6 per tonne across the whole enterprise, which at the frequency of 2.35 years in 10 equates to about £27 per tonne for the 8.8 tonnes of production that results in the years of the climate extreme. The decision to invest will be made by individual businesses through a combination of costing the investment against the specific experience of yield impact on the individual and the availability of funds for investment. There will be others who make the investment because they see other local producers doing so and they believe that if it is correct for the neighbours it must be the correct for them to make the investment.
There are a number of environmental impacts of the adaptation. There is a small amount of land use change and a potential impact on the water source from winter abstraction. Within the production system the most significant environmental consideration is the use of abut 80 litres of fuel needed to pump the 50mm per hectare of irrigation water from the source to the irrigation reservoir and then from the reservoir to the crop.
Table 58: Economic impact of the adaptation – Regional results
Profit (£) IRR (%) NPV (£)
Current Future change Current Future Current Future
N. Ireland -7196 -6952 244 -67857 -65561
) Page 105

Scotland -2676 197 2873 5% 10% -25244 1837
Yorkshire -3298 73 3371 4% 10% -31115 666
East Anglia 3327 5387 2060 15% 19% 31344 50765
Herefordshire -3349 617 3967 4% 11% -31594 5798
Kent -846 2829 3676 9% 15% -8000 26651
Cornwall -4497 -235 4262 1% 10% -42412 -2237
North West -7196 -6202 994 -67857 -58482
The regional impact has been calculated for all regions. There is however no significant processing sector in Northern Ireland or Cornwall.
The predicted frequency of extreme, by region, costed by region indicates that investment in additional storage capacity is already worthwhile in East Anglia and the return on investment will increase as the frequency of the event increases in the future. The impact of the soil type for East Anglia (ref section 10.2) on the economic results is considered significant. Clearly at farm level the specific soil type will determine the return achieved.
At industry level there would appear to be a case to relocate potato production away from the eastern counties of England to the western side of the country where the frequency of the extreme is predicted to be less than the east. There may be some migration to the west, particularly from areas without capacity for any further abstraction of water. This is not considered a practical solution before 2020, as much of the infrastructure for growing, storing and in many cases processing the potatoes is in the east. Growers in the east have made significant investment of many millions of pounds in production facilities and storage. While the machinery is transferable the specialist stores are not. There are also agronomic reasons for retaining the production spread across different regions. The greater the area available for the production of potatoes the easier it is to extend the rotation period, i.e. the frequency with which potatoes are grown in the same field. This has the advantage of reducing the incidence of pest and disease and thus the requirement for pesticide application. In addition, the processors source potatoes from different regions to spread their risk. If there is a production problem in one area such as flooding, or a disease outbreak such as potato blight, which would also be more of a risk in the wetter areas such as the west, it may not be repeated in other regions. Concentrating production in the west would increase the exposure to risk of poor crop yields and potentially shortages of supply for processing
10.6 Investment in Cooling to Reduce Fruit Quality Loss - Strawberries 10.6.1 Background Data
High ambient temperature leading to high temperature in the harvested fruit results in significant loss of output. The shelf life of the fruit is reduced and likelihood of rejection by the supermarket retailer increases. Some strawberry growers are already developing some form of in-field refrigerated storage systems to try and reduce the temperature in the punnets and in the fruit.
Harvest losses without adaptation are predicting that 50% of the crop will not be fit for the intended market. Of which 50% will have a wholesale or processing sale value and 50% will be waste. Adoption of in field refrigeration will reduce losses to just 10% of the marketable crop.
10.6.2 Climate Data The climate data indicates the current frequency of high temperature weather events, above the temperature threshold set for the scenario could is 3.33 times in a 10 year period, with a predicted increase to 5.03 times in 10 years. Figure 20 shows the regional variation in frequencies.
) Page 106

Figure 20: Frequency extreme heat event, by region (for Strawberry growers)
0
1
2
3
4
5
6
7
8
9
South West South East East Anglia WelshBorders
North East North West Scotland N. Ireland
Freq
uenc
y (y
rs in
10
year
per
iod)
Current Future
10.6.3 Economic Impact of the AdaptationThe economic impact of the scenario is summarised in Table 59.
Table 59: Summary of costed adaptation to provide in field refrigeration to address high temperatures at harvest in strawberries
Current Future
Frequency 3.3 in 10 yrs 5.0 in 10 yrs
Impact of event if no adaptation made £25,902
Undertake the adaptation Capital £4,000
Trading costs Every year £1,562
Event related £78
Profit/loss £11,428
Internal rate of return 285.79%
Net present value £43324
Break even frequency 0.605 yrs in 10 a year period
The scenario and economic impact is sensitive to changes from the assumptions used.
Table 60: Sensitivity to the impact on marketable yield
Impact of extreme on marketable yield (% to market)
% Class 1 30 35 40 45 50 60 70 80 90
% Class 2 0 8 15 21 25 25 22.5 17.5 10
% Waste 70 57 45 34 25 15 7.5 2.5 0
Freq
uenc
y of
ext
rem
e 0.5 -800 -907 -1007 -1099 -1183 -1302 -1405 -1494 -1568
1 -39 -253 -452 -637 -805 -1043 -1249 -1426 -1574
1.5 722 401 102 -174 -427 -783 -1093 -1359 -1580
2 1483 1055 657 288 -48 -524 -937 -1291 -1586
2.5 2245 1710 1212 750 330 -264 -781 -1223 -1592
)
Effect on profit (£)
Page 107

(yea
rs in
10
year
s) 3 3006 2364 1766 1213 708 -5 -624 -1156 -1598
3.5 3767 3018 2321 1675 1087 255 -468 -1088 -1604
4 4528 3672 2876 2138 1465 514 -312 -1020 -1611
4.5 5290 4327 3430 2600 1843 774 -156 -953 -1617
5 6051 4981 3985 3063 2221 1033 0 -885 -1623
Table 60 shows that the greater proportion of the crop that is unaffected by the heat event, the less worthwhile the investment in refrigeration will be. An important relationship exists between the quality of fruit, and the percentage of the daily harvest that is 1st quality attracting the market price of £1,700 per tonne, as compared to second quality fruit sold at £850 per tonne.
Table 61: Sensitivity to frequency of event and capital cost of adaptation
Freq
uenc
y of
Ext
rem
e (
year
s in
10
year
s)
Capital Investment Required (£)
£400 £1,400 £2,400 £3,400 £4,400 £6,400 £8,400 £10,400 £12,400
Effect on profit (£)
0.5 -245 -509 -773 -1037 -1301 -1829 -2357 -2885 -3413
1 15 -249 -513 -777 -1041 -1569 -2097 -2625 -3153
1.5 275 11 -253 -517 -781 -1309 -1837 -2365 -2893
2 536 272 8 -256 -520 -1048 -1576 -2104 -2632
2.5 796 532 268 4 -260 -788 -1316 -1844 -2372
3 1057 793 529 265 1 -527 -1055 -1583 -2111
3.5 1317 1053 789 525 261 -267 -795 -1323 -1851
4 1577 1313 1049 785 521 -7 -535 -1063 -1591
4.5 1838 1574 1310 1046 782 254 -274 -802 -1330
5 2098 1834 1570 1306 1042 514 -14 -542 -1070
The capital investment for this adaption is modest in comparison to the value of the harvested fruit. The met data indicates that in the main strawberry producing regions of the UK (Welsh border, South East and East Anglia) the frequency of the high temperature heat event is already above the economic threshold.
Table 62: Economic impact of the adaptation – Regional results
Effect on Profit £ IRR % NPV £
Current Future Change Current Future Current Future
N. Ireland -1390 -1067 323 -5265 -4041
Scotland -1213 6 1218 10% -4594 25
North East -520 698 1218 -10% 32% -1968 2651
East Anglia 2432 2818 385 77% 86% 9224 10684
Welsh Borders 693 1724 1031 31% 59% 2631 6539
South East 1391 2162 771 50% 70% 5276 8197
South West 693 1656 963 31% 57% 2631 6283
North West -692 464 1156 -18% 25% -2620 1762
) Page 108

10.6 Change in Cultivation Practice to Establish Combinable Crops in Hardened Ground 10.6.1 Background Data
Prolonged periods of hot dry weather in the summer can result in hardening of soils. Heavier soils with higher clay contents are particularly prone to this problem. Irrigation to soften the soil is not a cost-effective or practical option for land used for combinable crops.
Currently arable farmers cultivate and establish combinable crops using a mixture of ploughing and reduced tillage operations. Reduced or minimum tillage systems are increasingly popular as they result in reduced energy and time required to establish the following crop; increased areas can be covered by the same amount of tractor horsepower and equipment; reducing the movement (ploughing) and working down to a seed bed reduces the power requirement thus reducing the costs of the cultivation and establishment operation.
10.6.2 Climate DataThe climate data indicates currently the frequency of high temperature weather events, above the temperature threshold set for the scenario could be expected 2.35 times in a 10 year period with a predicted increase to 3.82 times in 10 years. Figure 21 shows the regional variation in frequencies.
Figure 21: Frequency of climate extreme, by region (for ground hardening of combinable crops)
0
1
2
3
4
5
6
SouthWest
South East EastAnglia
WelshBorders
North East NorthWest
Scotland N. Ireland
Freq
uenc
y (y
rs in
10
year
per
iod)
Current Future
10.6.3 Economic Impact of the Adaptation The economic impact of the scenario is summarised in Table 63.
) Page 109

Table 63: Summary of costed adaptation to change cultivation practice in years when excessively hot and dry summers have dried and hardened arable land
Current Future
Frequency 2.4 in 10 yrs 4.0 in 10 yrs
Impact of event if no adaptation made £30,094
Undertake the adaptation Capital £66,000
Trading costs Every year £7,196
Event related £9,800
Profit/loss £836
Internal rate of return 11.41%
Net present value £7,865
Break even frequency 3.55 in 10 yrs
The scenario and economic impact is sensitive to changes form the assumptions used. The difficulty in assessing the sensitivity is the uncertainty in predicting the relationship between a single reduced cultivation or multiple occurrences on the yield potential of the crop. Assessed as a one off event, the reduced cultivation adaptation will always result in increased profitability. The reasons for this are simple; there is less movement of soil so less draught power is needed to pull cultivation equipment through the soil. However, this approach is not suitable in most situations as a long terms solution as over time it will result in a build up of weed problems leading to reduced crop performance.
The environmental solution to this problem is to leave the land uncultivated until later in the autumn or winter when there has been sufficient rain to soften the land. Most farmers will not consider this as a solution as for many it will restrict them to a spring sown combinable crop. The yield penalty from the spring sown crops as opposed to the winter sown crop is much greater than the costs of undertaking some cultivation and establishing the autumn sown crop (known as winter sown).
Table 64: Economic impact of the adaptation – Regional results
Effect on Profit £ Rate of Return %
Current Future Change Current Future
N. Ireland 0 0 0 0% 0%
Scotland 59 113 54 3% 6%
North West 0 22 22 0% 1%
North East 88 121 33 5% 7%
Welsh Borders 59 145 86 3% 8%
East Anglia 323 431 108 18% 23%
South East 205 238 33 11% 13%
South West 59 124 65 3% 7%
) Page 110

10.7 Mechanical Ventilation in Cattle Buildings to Reduce Incidence Respiratory Disease 10.7.1 Background Data
Calf pneumonia is one of the most significant causes of economic loss to cattle farmers as well as being a cause of suffering to the affected animals. The total cost to farmers in the UK has been estimated to be over £80 million per year (National Office of Animal Health (NOAH)). The condition is farm related, with some farms suffering serious losses, while on others the disease is either very mild or non-existent. Sporadic outbreaks can, however, be experienced by farms that normally see very little respiratory disease in calves.
Losses arise from the cost of treatment, reduced weight gain, increased work for stockpersons and most significantly of all from calf deaths. The disease is one of the so-called multi-factorial diseases. This means that in addition to the range of infectious micro-organisms that cause the disease, husbandry and management factors have an essential role in precipitating outbreaks. The micro-organisms that cause the disease are largely found in every herd of cattle irrespective whether or not pneumonia is a problem. The factors that allow the micro-organisms to cause the disease are those that are under the control of management or are a result of the husbandry system.
While early antibiotic treatment can be very effective in reducing the losses caused by the disease the most cost effective approach to managing pneumonia lies in a preventive programme that includes vaccination and a positive management programme to control the contributory factors.
The main environmental factor predisposing calves to respiratory disease is poor ventilation in calf housing (Anderson et al., 1998; Pritchard, 1982). Cold, humid conditions, sudden changes in air temperature, stress due to different causes and change in the environment have also been associated with outbreaks of pneumonia in young calves. (Webster et al., 1985; Roe, 1982; Scott, 1995).
The scenario evaluated assumes that vaccination against pneumonia is part of the current farming practice. This assumption is made as this is current practice on farms prone to winter pneumonia outbreaks in young cattle. The breakeven threshold for vaccination is about 1 event in 20 years. Not all farmers vaccinate, their experience being that their buildings are not prone to pneumonia due to the combination of design and location.
10.7.2 Climate DataThe climate data indicates currently the frequency of high temperature weather events, above the temperature threshold set for the scenario could be expected 2.33 times in a 10 year period with a predicted increase to 3.1 times in 10 years. Figure 22 shows the regional variation in frequencies.
) Page 111
Figure 22: Frequency of humid, calm winter heat waves, by region (for cattle pneumonia)
0
1
2
3
4
5
6
SouthWest
SouthEast
EastAnglia
WelshBorders
North East NorthWest
Scotland N. Ireland
Freq
uenc
y (y
rs in
10
year
per
iod)
Current Future
10.7.3 Economic Impact of the Adaptation The economic impact of the scenario is summarised in Table 65.
Table 65: Summary of economic impact of scenario and adaptation to improve the ventilation in a cattle building
Current Future
Frequency 2.33 in 10 yrs 3.10 in 10 yrs
Impact of event if no adaptation made £2,322
Undertake the adaptation Capital £4,000
Trading costs Every year £652
Event related £500
Profit/loss -£87
Internal rate of return 6.84%
Net present value -£527
Break even frequency 3.6 in 10 yrs
The scenario and economic impact is sensitive to changes from the assumption used.
) Page 112

Table 66: Sensitivity to the changes in mortality Table 66a: Adaptation £1000 invested in changes to structure of building to improve air movement
Freq
uenc
yMortality
0% 2% 4% 6% 8% 10% 12% 14% 16% 18%
Effect on Profit £
0.5 -95 -73 -50 -28 -5 17 40 62 85 107
1 -28 17 62 107 152 197 242 287 332 377
1.5 40 108 175 243 310 378 445 513 580 648
2 108 198 288 378 468 558 648 738 828 918
2.5 176 288 401 513 626 738 851 963 1076 1188
3 243 378 513 648 783 918 1053 1188 1323 1458
3.5 311 468 626 783 941 1098 1256 1413 1571 1728
4 379 559 739 919 1099 1279 1459 1639 1819 1999
4.5 446 649 851 1054 1256 1459 1661 1864 2066 2269
5 514 739 964 1189 1414 1639 1864 2089 2314 2539
Table 66b: Adaptation £4000 invested in fans to improve air movement
Freq
uenc
y
Mortality
0% 2% 4% 6% 8% 10% 12% 14% 16% 18%
Effect on Profit £
0.5 -606 -583 -561 -538 -516 -493 -471 -448 -426 -403
1 -560 -515 -470 -425 -380 -335 -290 -245 -200 -155
1.5 -514 -446 -379 -311 -244 -176 -109 -41 26 94
2 -468 -378 -288 -198 -108 -18 72 162 252 342
2.5 -422 -309 -197 -84 29 141 254 366 479 591
3 -375 -240 -105 30 165 300 435 570 705 840
3.5 -329 -172 -14 143 301 458 616 773 931 1088
4 -283 -103 77 257 437 617 797 977 1157 1337
4.5 -237 -35 168 370 573 775 978 1180 1383 1585
5 -191 34 259 484 709 934 1159 1384 1609 1834
The scenario assumes that the vaccination alone will result in 8% mortality in the event of a pneumonia outbreak. Improving the ventilation in the building is assumed to reduce mortality to 4%. In practice, a severe outbreak of pneumonia can result in mortality rates in excess of 20%.
Table 66 (a & b), indicates that the scenario is very sensitive to the mortality rates. A farmer’s decision on whether to adapt the building and the nature of the adaption will depend on the specific situation on the farm and the experience to date with the disease.
It is anticipated that under the current economic conditions in the livestock sector, that farms will make structural changes to buildings, at modest cost, but are likely to experience high incidences of disease and mortality before they will consider making the investment in mechanical ventilation systems
) Page 113

In this scenario a capital investment of £4000 is assumed for fan, pipe work and the associated installation costs. Structural changes to a building would include increasing the ridge space, opening the sides and cutting slots in the roof sheets. These changes require significantly less investment. Table 67 shows the sensitivity of the scenario to changes in the level of capital investment.
Table 67: Sensitivity to frequency of event and capital investment required to achieve adequate improvement in the ventilation in the building
Freq
uenc
y
Capital Cost
£1,000 £2,000 £3,000 £4,000 £5,000 £6,000 £7,000 £8,000 £9,000 £10,000
Capital Cost per head
£20 £40 £60 £80 £100 £120 £140 £160 £180 £200
Effect on Profit £
0.5 -50 -229 -395 -561 -727 -894 -1062 -1229 -1398 -1566
1 62 -131 -300 -470 -640 -811 -983 -1155 -1328 -1502
1.5 175 -34 -206 -379 -552 -727 -903 -1080 -1259 -1438
2 288 64 -111 -288 -465 -644 -824 -1006 -1189 -1374
2.5 401 161 -17 -196 -377 -560 -745 -931 -1120 -1310
3 513 259 78 -105 -290 -477 -666 -857 -1050 -1246
3.5 626 356 172 -14 -202 -393 -586 -782 -981 -1183
4 739 454 266 77 -115 -310 -507 -708 -911 -1119
4.5 851 551 361 168 -27 -226 -428 -633 -842 -1055
5 964 649 455 259 60 -142 -349 -558 -772 -991
Table 68: Economic impact of the adaptation – Regional results Table 68a: Based on £1000 capital invested in changing the structure of the building to improve air movement.
Effect on Profit £ IRR % NPV £
Current Future change Current Future Current Future
£ % £
N. Ireland 333 1478 1145 50% 109% 3222 8319
Scotland 833 922 89 76% 80% 5447 5845
North East 333 609 276 50% 64% 3222 4451
East Anglia 1206 1619 414 95% 117% 7107 8950
Welsh Borders 833 922 89 76% 80% 5447 5845
South East 1079 1355 276 89% 103% 6543 7771
South West 583 903 321 63% 79% 4335 5762
North West 460 963 503 56% 83% 3787 6028
) Page 114
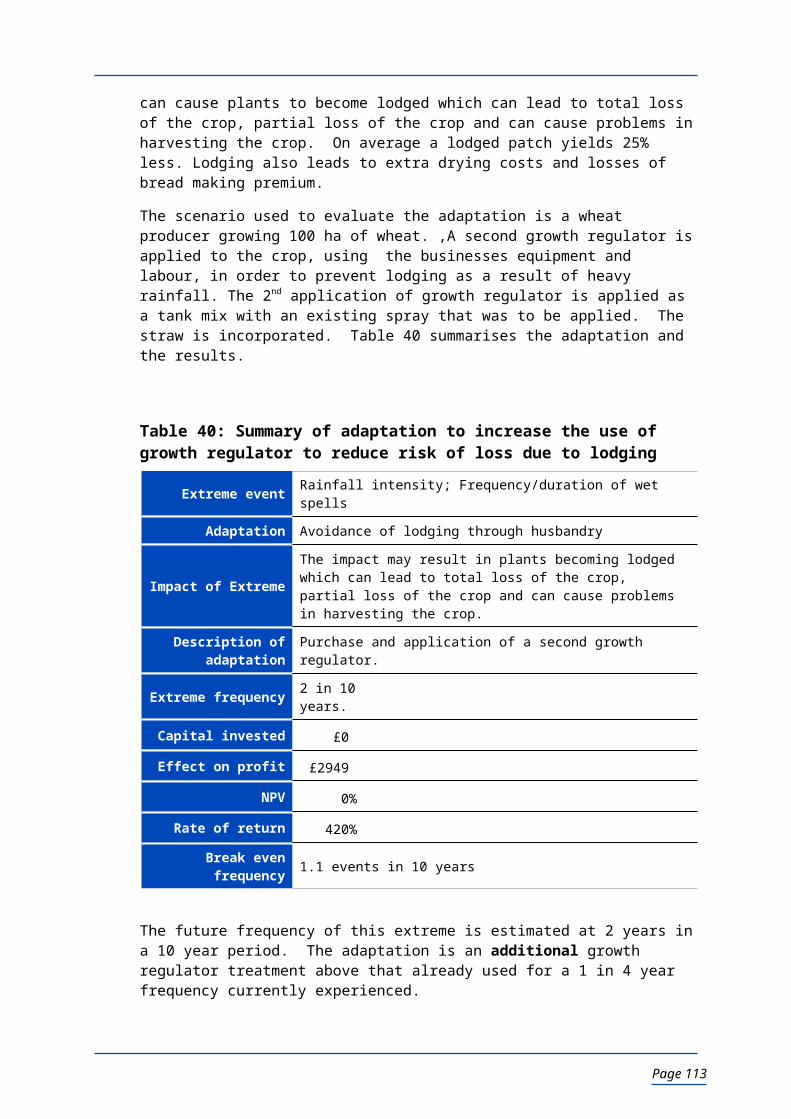
Table 68b: Based on £4000 capital invested in fans to improve air movementEffect on Profit £ IRR % NPV £
Current Future Change Current Future Current Future
£ % £
N. Ireland -156 989 1145 27% 222 5319
Scotland 344 433 89 18% 19% 2447 2845
North East -156 120 276 15% 222 1451
East Anglia 717 1130 414 23% 29% 4107 5950
Welsh Borders 344 433 89 18% 19% 2447 2845
South East 590 866 276 22% 25% 3543 4771
South West 94 414 321 14% 19% 1335 2762
North West -29 474 503 20% 787 3028
10.8 Preventative Treatment to Reduce the Risk of Fly Strike in Sheep Systems10.8.1 Background Data
Blowfly strike in sheep is the result of infestations of blowfly larvae (maggots). A survey carried out in the mid-1990s (French et al 1995) found that 80% of sheep farmers in England and Wales had recorded at least one case of blowfly in their flocks. The authors estimated that half a million sheep were struck annually with an average of 1.6% of sheep within a flock reported as being struck. It is estimated that about 12,000 sheep die each year as a result of fly strike.
Blowfly strike is a highly seasonal problem and is weather dependent. It tends to occur after periods of heavy rain followed by warm weather or during periods of high humidity. Strikes can occur at any time from March to December in the South and generally from June to November in the North (Bates, 2006). The highest number of strike incidences occur during May and October. Noting weather conditions when treating for strike will allow farmers to build up a record of when they are most susceptible to strike. Breech strike (where the hindquarters of the animal are affected) depends less on weather as the moisture supplied by urine or scouring is generally sufficient to attract flies (Bates, 1999).
10.8.2 Climate DataThe climate data indicates currently the frequency of high temperature weather events, above the temperature threshold set for the scenario could be expected 4.46 times in a 10 year with a predicted increase to 6.31 times in 10 years. Figure 23 shows the regional variation in frequencies.
) Page 115

Figure 23: Frequency of humid spring and summer heat waves by region (for fly strike)
0
1
2
3
4
5
6
7
8
SouthWest
SouthEast
EastAnglia
WelshBorders
NorthEast
NorthWest
Scotland N.Ireland
Current Future
10.8.3 Economic Impact of the Adaptation The economic impact of the scenario is summarised in Table 69.
Table 69: Summary of economic impact of scenario and adaptation to increase the preventative treatment of sheep against blow fly attack
Current Future
Frequency 1.60 in 10 yrs 2.18 in 10 yrs
Impact of event if no adaptation made £6,373
Undertake the adaptation Capital £ -
Trading costs Every year £ -
Event related £661
Profit/loss £1,835
Internal rate of return 1110.80%
Net present value £6,373
Break even frequency 1.04 in 10 yrs
The scenario and economic impact is sensitive to changes from the assumptions used.
) Page 116

Table 70: Sensitivity to changes in cost of prevention
Freq
uenc
y o
f pre
vent
ativ
e tre
atm
ents
in th
e ye
arTreatment Cost per ewe
£1.73 £1.93 £ .14 £2.38 £2.64 £2.91 £3.20 £3.52 £3.87 £4.26
Effect on profit (£)
0.8 76 28 -25 -85 -151 -217 -290 -369 -457 -554
1 204 156 102 43 -23 -89 -162 -242 -330 -427
1.2 331 283 230 170 104 38 -35 -115 -202 -299
1.4 459 411 357 298 232 166 93 13 -75 -172
1.6 586 538 485 425 359 293 220 140 52 -44
1.8 714 666 612 553 487 420 348 268 180 83
2 841 793 740 680 614 548 475 395 307 211
2.2 969 921 867 808 742 675 603 523 435 338
2.4 1096 1048 994 935 869 803 730 650 562 466
2.6 1224 1175 1122 1063 996 930 858 778 690 593
The sensitivity table above indicates that in economic terms preventative treatments are economically worthwhile. It must however be stated that the motivation to undertake preventative treatment is simply to prevent widespread fly strike in the flock. Fly strike certainly compromises the welfare of the sheep and is distressing and time-consuming from the farmer’s perspective.
The climate data forecasts an increase in the frequency of extreme weather conducive to an increase in the numbers of blow flies and blow fly attack. Provided the efficacy of preventative treatments can be maintained, farmers will continue to use this approach as a quick and cost effective method of prevention.
Table 71: Economic impact of the adaptation – Regional results
Effect on Profit £ Rate of Return %
Current Future Change Current Future
£ %
N. Ireland 327 830 502 198% 502%
Scotland 21 462 441 13% 280%
North East 586 1133 547 355% 686%
East Anglia 663 913 250 481% 681%
Welsh Borders 795 1125 330 401% 553%
South East 414 487 73 251% 295%
South West -17 23 40 -10% 14%
North West 106 106 0 64% 64%
The regional analysis only reports impact on profit. There is no capital investment and the operating costs of undertaking the adaptation are significantly less than those of not taking preventative action so there is no capital investment against which returns can be assessed.
) Page 117

Regional data has been calculated for all regions. There is however little need or opportunity to consider the adaptation in a number of the regions due to the nature of the farming systems employed. In the South West and South East regions a significant number of sheep are lambed early, and lambs are sold off-farm before the start of the fly season. This is also the practice for some producers in the West Midlands and East Anglia. In these regions, sheep are shorn earlier in the season which also contributes to reducing the risk of fly strike.
Environmentally speaking, the adaptation could be considered to have the potential for a negative environmental impact as it will result in an increase in the use of dips and pour-on treatments to prevent fly attack. At present veterinary medicines used in the control of ectoparasites pose an issue for water quality (e.g. EA, 2005; EA, 2007). Management options are available that will contribute to prevention of attack. These include regular dagging of sheep and shearing earlier in the season. Dagging is clipping all soiled wool from the tails and flacks of the sheep which might otherwise attract flies. In the long term there is the potential to change breeds or crosses to include a wool shedding trait. The introduction of this trait will require long term breeding programmes to ensure that the other production traits such as growth rate, muscle depth especially in the hind quarters; milkiness and prolificacy are not compromised with the introduction of genetics for the wool shedding trait
) Page 118

11. DiscussionThe ability to separate out the effects/impacts of general climate change and climate variability from the impacts of climate extremes has been a distinct difficulty in the more qualitative parts of this project with impacts from general climate change trends often amplified within the extremes. Similarly, it has been necessary to disentangle the synergistic and knock on effects of the various extremes with many of them co-occurring. For example increased dry spell duration is usually associated with elevated temperatures and heat waves leading to water resource issues. It has also been necessary to consider the antagonistic effects of the extremes where the benefit of one is negated by another as exemplified by the extended growing season. This may bring opportunities to crop earlier to avoid the mid-summer drought or even the potential for additional cropping. However, earlier cropping may make certain crops particularly vulnerable to late frosts, be offset by an increase in the length of the mid-summer drought or be negated by shorter wetter autumns. The timing of this synergism/antagonism is often key to whether these combinations are considered detrimental or beneficial and are often sector specific. An example is the synergism of dry and warm conditions - in spring when soil moisture is not a limiting factor to grass growth these conditions are favourable for the sheep sector (e.g. 2007), however, in the late summer these conditions produce difficult harvesting conditions for the root crop portion of the arable sector.
Given these difficulties the study has gauged the opinion of the agricultural industry on how informed it feels with respect to climate extremes, its experiences of climate extremes, what if anything it has already done to adapt and what if anything it would consider doing to adapt. Most farmers (in England and Wales) do not feel well informed and when this is considered along with the finding that farmers that consider themselves to be better informed are more likely to be responding already or to respond over the next 5 years, highlights information dissemination as a key priority. Most farmers have experienced extremes and in some instances have chosen to adapt, while many accept that loss as a result of climate variability is an inherent part of their industry. The GCM/RCM projections indicate increased frequency and intensity of extremes in the future, even by 2020. Despite this, most farmers state that they are unlikely to adapt in advance of experiencing the changes for themselves with the major drivers for adoption of adaptation being current economics and regulation.
Our deliberations of a future climate centre on 2020. This time horizon was chosen as it conforms to one of the standard 30 year climate normals used for climate change research. It was also believed that it is close enough to the present time that changes over this period would not be completely mismatched with farm business planning horizons which are considered to be relatively short. However, in reality, the changes identified (sections x and y) have to an extent already been realised as these represent the change between the baseline climate (1961-1990) and the future. It should also be borne in mind that some of these projected climate changes may be within the limits of natural variation making it difficult to assess if climate change or natural inter-decadal variability will be the driving force over the next decade. While caution should also be shown given the sources of uncertainty associated with the modelling of future climate (See Appendix B) it is also important to consider that the changes in the frequency of extremes may be a function of changes in the mean of the distribution, changes in the variation of the distribution, changes in the shape of the distribution or indeed combinations of all of these factors (Easterling et al., 2000). While RCM’s have been shown to mimic current climate extreme distributions (e.g. Fowler et al, 2004; Palutikof et al., 2004) whether they will capture these changes into the future appropriately remains to be seen. The scale at which these models operate (GCM ~ 2.5 Degrees; RCM ~50 km) make it difficult to predict the impacts at a farm/field scale as local topographic and landscape features will ameliorate or enhance the projected extremes (Diffenbaugh et al., 2005).
Of all the climate extremes that are predicted, the effect of temperatures and/or low rainfall are considered by all as the aspect of change of greatest concern to the industry. All but one of the climate extremes has a negative effect on the farming system. The potential exception is an opportunity to increase production by including additional crops. However, in the context of climate extremes, additional cropping does not feature well. The climate extreme is, as
) Page 119

suggested by the title, an untypical or unexpected event. This differs from climate change which should over time offer greater reliability.
Perhaps the closest to this is the potential for additional cropping as a result of an extended growing season. Currently this is a technically feasible option for some producers, but not a reliably economic option. The forecasts suggest that the potential will increase with increased frequency of longer growing season. If greater reliability of production could be achieved, and the supply chain, especially the retailers, could accept UK product instead of importing lower cost produce, there may be scope to develop this further. The difficulty is that the scenario currently has too many “ifs and buts” coupled with the retail chains aversion to risk in the context of reliability of supply.
A common theme throughout all of the assessment of the adaptations is the fact that the marketplace dominates the decision making process of farmers and producers. Producers are dependent upon the market demands. These demands combine time of sale, quality and quantity of product and in some cases breed or varietal choice. Contracts to supply have value to the producer beyond the price paid per unit of product. In effect they provide a licence to produce coupled with a reasonable expectation of achieving a profit. The alternative is production for the open market. This is a higher risk, perhaps more traditional approach to agriculture, in which farmers produce without knowing who will buy the product or what specification is needed. Increasingly this is an unreliable and financially unsustainable approach to farming.
When considering alternative adaptations it is considered essential that the adaptation in no way compromises the relationship between the producers and the market place. The quality of the product has to be maintained. In this context quality comprises the whole range of requirements of the process and retail supply chain, from the eating quality to the volume, seasonality and availability of the produce. Within the context of adaptation to climate extremes, the project has not identified potential adaptations that would add value to the produce, or target a niche market. If such adaptations could be identified for other commodities and markets then the financial returns available may encourage producers to consider system changes.
Climate extremes place a greater burden on the livestock sector than arable and horticultural sectors due to the combination of financial and animal welfare consequences. Plants do not have any welfare rights and as such financial considerations can dominate the decision making process. With livestock, the white meat sector (pig and poultry) has greatest exposure to welfare pressures over finance due to the combination of numbers of livestock in a typical enterprise and the modest margin per unit of livestock constraining the opportunity to profit from investment in adaptation. Put simply the financial returns on an adaptation may not be sufficient to justify the investment. The financial response is to accept the loss whenever the climatic extreme occurs.
Welfare requirements place greater onus on farmers to adapt their production systems. The speed of onset of events also requires livestock producers to seriously consider anticipating adaptation such as investment to mitigate against extreme heat events. The industry suggestion is, however, that even in situations in which an extreme would compromise the welfare of livestock, producers may well have to experience the impact of an extreme before employing an adaptation. As most producers appear to feel poorly informed about climate change impacts such as extreme events, this finding may be different if communication efforts were prioritised and highly effective. However, given the strategic nature of decisions to be made, the response of the individual farmer will depend upon the wider personal and business objectives and not solely on the immediate impact on profits that the extreme event could cause.
The study has costed adaptations to production systems over a time period beyond the planning window of most farm businesses. On most farms, business planning focuses on a one or two year period. Some arable businesses will have an indicative cropping plan covering a rotation of several years, but the outer years, certainly past year 2 of the plan will only be indicative and are prone to change. Change will be brought about by economic prospects of the output of one crop as compared to that of different crops. Even capital investment will be made on the basis of expenditure over the next three to five years coupled with an aspiration that the investment
) Page 120

will still be considered a good and needed investment after the initial few years. It should not then be a surprise that for some climate extremes farmers neither recognise the issue, or would want to experience the event at least two or three times in a five year period (section 6.1) before they would consider an adaptation. Adaptation to climate extremes is currently a low priority factor in the business planning and decision making process.
Farmers have much shorter timescale pressures which dominate decision making. Costs of fuel have doubled in a little more than two years. Fertiliser prices have increased between 250% and 300% over a similar period of time. Other input costs have increased at a rate much greater than inflation. It is this sort of market volatility which drives decision making not a concern about either climate change or climate extremes. Developing this point further, it is our opinion that market price and the cost of production changes will influence future structural change in UK agriculture to a far greater extent than climate extreme. An exception to this could be changes required to land use and land management driven by wider social or environmental requirements. For example management of land to provide flood relief for urban areas and the impact of proposed changes in the use of pesticides in the EU.
The nature of the adaptation, in terms of level of innovation as compared to current practice and system change, versus capital involved in the innovation is shown in Figure 24. This indicates that in the main the adaptations related to horticultural cropping involve greater levels of adjustment and innovation than the arable and livestock adaptations. The selection of adaptations for detailed costing involved an assessment of likelihood of uptake. In the main the value of the product from the horticultural enterprise is greater than that of the livestock or arable. The higher the value of output the greater the scope there is for adoption of novel and innovative adaptations.. The two arable adaptations referenced 11/A and 14/A in Figure 24 are both for potato enterprises. Potatoes are classed as arable crops, but they are high value crops comparable to the horticultural crops in terms of value of output. The three livestock adaptations considered to involve combinations of greater capital and more than just day to day system changes are referenced 1/L (increased ventilation in poultry), 2/1 (insulation against heat in pig arcs) and 9/L (water harvest for drinking supply). In these cases the requirement to achieve good animal welfare standards is as much the driver for the investment as the value of the product and the financial return that can be achieved.
While some clear messages have emerged from the surveys and focus groups, the project has identified some anomalies in feedback from the industry. The farmer survey indicates that the pig and poultry producers show the lowest awareness of the issue of climate change. This translated in to a lack of any anticipated adaption need, with 55% of respondents stating that they would not be responding to climate change. The anomaly is that the focus groups findings were that poultry producers with indoor units indicated a high likelihood of adaptation to address high temperature events, by improved ventilation. With regards to the pig producers, ADAS experience is that while those who contributed to the project showed low levels of awareness of the issues and a lack of intent to change the production system, there is already significant uptake of the adaptations in the UK industry.
In the main, the adaptations identified for the climate extremes affecting the arable sector can be achieved relatively easily through change in working practice and modest additional investment in pesticides for weed control and slug treatment. For most arable enterprises, there is no requirement for large scale investment in new machinery or significant change in enterprise mix.
The arable sector adaptations to climate extremes have a mix of positive and negative environmental consequences. Increasing the water storage capacity of farms needing to irrigate crops will have a positive impact if winter abstraction and storage replaces abstraction in the growing season. The negative consequences will be increased use of fuel to pump water to the store, as well as small loss of habitat when the irrigation reservoir is created. Change of variety to mitigate against an extreme could also be a positive adaptation provided the new varieties have comparable yield potential and disease and pest resistance.
The environmental consequence of adaptations which include increased use of fertiliser and pesticides could be considered as negative outcome as the adaptation provides increased opportunity for misapplication of product. The environmental consequence of misapplication of
) Page 121

pesticides and fertilisers particularly the type used (organic or inorganic), needs continued updating and promotion. Changing crop variety or sowing date has a potential to deliver environmentally positive mitigation to extremes such as hardening of the ground, risk of late frosts and increased risk of lodging. Currently however, farm businesses will be financially disadvantaged by such actions, as it would mean a change from their planned ‘normal’ cropping rotations. The overhead structure is set up for a planned rotation and the resources of labour and machinery would be available to deliver the planned rotation. A cropping pattern changed to mitigate for one or more extremes would probably have different requirements for these operational resources.
) Page 122

Figure 24: Distribution of adaptation against capital involved and level of system change/innovation
Key to adaptations shown in Figure 241/L Improve ventilation in poultry building2/L Insulate the arcs to keep sows cool and encourage them to stay with piglets3/L Introduce misting to cool the finishing pigs down6/L Reduce the numbers of birds transported on any one load to reduce impact of high temperature extreme7/L Reduce the number of lambs transported on any one load to reduce impact of high temperature extreme9/L Harvest and store rainwater to replace watercourse supply of drinking water for sheep10/H Install irrigation system in apple orchard to reduce impact drought conditions11/A Irrigate potatoes more often during this weather period to soften the ground12/H Irrigation of Swedes pre harvest14/A Increase the amount of refrigeration on the current potato store in order to pull down the store temperature15/H Investment into cold storage in the field to reduce fruit temperature post harvest for strawberries
) Page 123
31/h
27/h11/A
1/L
26/h
14/A10/h
2 / L
12/h9/L15/h30/h
3/L28/L35/L
33/A
32/A
6/L
34/A 36/L
23/A
17/H
7/L
16/H
22/A
24/h
Well Proven Innovation
Cap
ital I
nves
tmen
t

16/H Progressively replant with low chill varieties from New Zealand and France to overcome lack of winter chill required to break bud dormancy
17/H Plant two crops where previously only one was planted a season22/A Cultivation of soils to break surface after maize harvest in order to reduce risk of rain water run off23/A Increased use of direct drilling to a more min till system to increase soil stability and reduce risk of soil run off
in extreme rain event24/H Replace existing polytunnels with polytunnels with pre formed gutters26/H Invest in a hail netting cover crop (baby leaf salad) for protection from the hail stones27/H Increase use of netting over the apple orchard all year round to reduce fruit damage from the hail30/H Implementation of a windbreak in the form of popular and alder in blackcurrant crops31/H Construction of an artificial windbreak to prevent wind damage in salad crops32/A Change the variety of wheat to spread the flowering period and reduce risk of late frost at flowering33/A Invest in tillage system that is able to cope with the soil structure and prepare the seed bed when hot dry
summers harden ground making conventional cultivation difficult34/A Purchase and application of a second growth regulator to reduce lodging in cereals35/L The adaptation evaluated is to improve the ventilation in cattle building to reduce respiratory disease36/L Increase preventative treatment for fly strike for the longer season
Environmental schemes such as HLS may offer opportunity for payment to farmers who change cropping rotation. However, the operation of environmental schemes is not sufficiently flexible to offer widespread mitigation to a climate extreme. Entry to the scheme is dependent upon a much wider range of issues than simply adaptation for climate extremes. The funding is limited and targeted but not solely on mitigation. They also require a long term contract to the scheme. From Autumn 2008, entrance into HLS will be invitation only. The invitation will be based on SSSI and other specific habitats identified through geographical surveys. An adjustment to existing schemes, perhaps making greater use of modulated support payments, with specific modules or tiers to mitigate for climate extremes may however be a useful positive action against some adaptations to climate extremes in the arable sector.
In the livestock sector the adaptations to climate extremes are a combination of some system change but mainly involve investment in additional inputs or production facilities. The welfare of livestock being transported can be significantly compromised in a hot weather heat extreme. The practical system change is to maximise ventilation in the transport (lorry or trailer), and where practical restrict movement to the cooler times of the day, coupled with reducing the numbers of stock in transport. This has the effect of reducing the body mass and thus the body heat and increasing the opportunity of air flow between individual animals. The environmental consequences of adaptations to heat extremes are broadly environmentally neutral. There is an impact in terms of the materials used in the adaptation as well as the electricity or water used for cooling. The impact on animal welfare is however much more significant.
Housed pigs and poultry units can mitigate against the consequence of heat extremes by reducing stocking density in buildings. This approach does however require management decisions well in advance of the extremes. For the majority there will not be scope to reduce stocking density immediately before or during the extremes. It is not efficient for producers to keep space available just in case they need it to reduce stocking density in a building. Improved forecasting techniques would increase the information available to producers in advance, which in turn will allow producers to implement whatever mitigation options are available to them. Consideration should be given to establishing dedicated heat extreme forecasting and informing services for these sectors. A further consideration is the changes in the market place to ‘more welfare friendly systems’ under retailer incentive has reduced stocking rate and density on a small but significant percentage of farms. This will reduce susceptibility to weather extremes. It is not yet possible to determine if this trend will continue so that a larger proportion of producers move to lower stocking rates, but it will certainly reduce susceptibility to weather extremes.
The adaptation to increase capacity to deal with intense or prolonged rain events in livestock building complexes was not costed. There are a number of justifications for not costing the proposed adaptations. The first of these is the fact that in practice there is no financial penalty for the farmers if their existing facilities do not have sufficient capacity leading to escape of
) Page 124
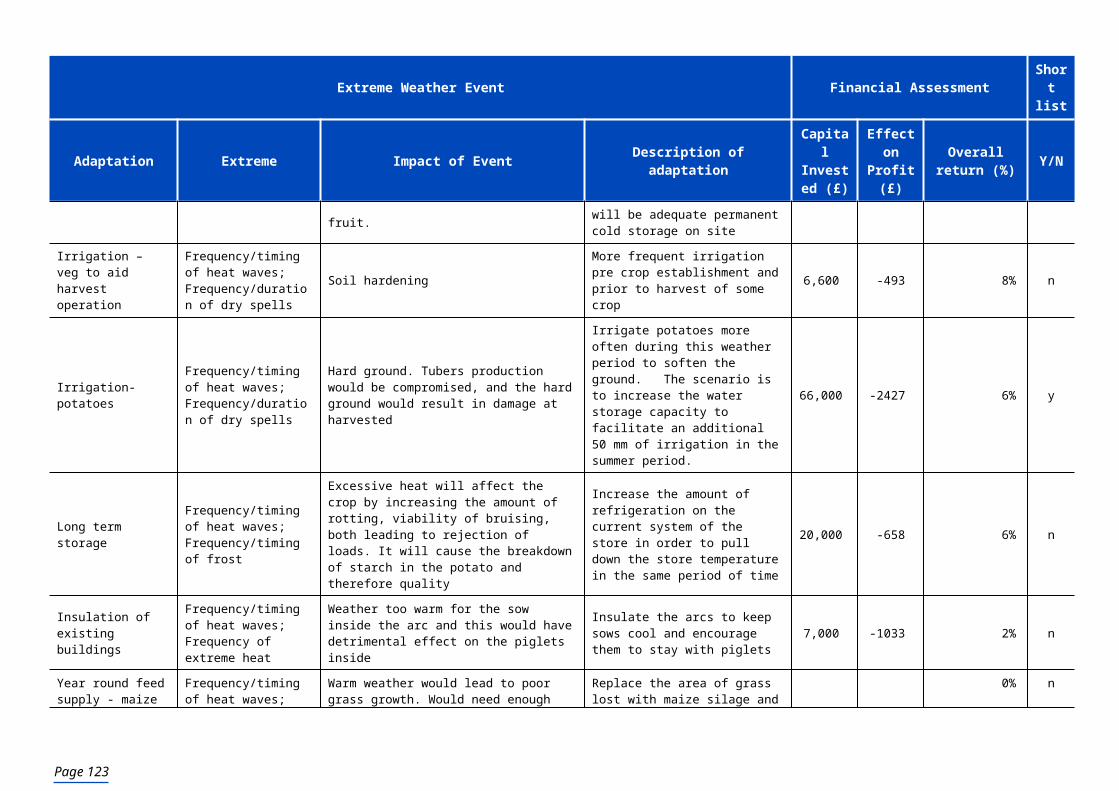
waste and water. There is little financial motivation for farmers to invest what could be a significant amount of money on preventative actions. The second reason for not costing the adaptation is the inaccuracy in estimating the capital cost of the adaptation. The cost will be bespoke to each business and is not a function of enterprise or business size. It will reflect the geographical location and capacity of the existing facilities, the layout of the yard and buildings and the storage capacity available. On farm practice to reduce the impact of an intense rainfall event should be encouraged as common “good practice”. The most practical being to minimise the ground area contaminated by animal waste and taking opportunity to prevent flow of uncontaminated water through these areas.
A further consideration would be to place greater emphasis on where and how manures and dirty water are stored on livestock farms. The legislative requirements of nitrate vulnerable zones (NVZ) have resulted in an increased requirement for storage. Manure stores with effluent tanks are unlikely to provide adequate protection in an intense rainfall extreme despite being deemed adequate to meet current legislative requirements.
Predictions of longer wetter winters preclude the option of out-wintering cattle to avoid respiratory disease. The wetter winter extreme may also reduce the sustainability of out-wintering cattle as part of the normal husbandry practice. This will not result in a significant increase in new cattle housing. The capital cost of providing housing and manure storage far outweighs the return being achieved from rearing cattle that were previously out-wintered.
The study has identified issues for further consideration by Defra in the context of climate extremes, but also efficient and competitive production. In addition, the issue of food security further complicates the strategic planning for UK land use in the future. The time scale of the project, considering changes by the 2020’s, is too short to identify needs for strategic structural change such as re-location of production from one part of the country to a different region, less prone to frequency of an extreme. This may however be the reality when considering the long-term strategic plan for land use in the UK. However, any such change could have an impact on the post farm gate infrastructure. For example, relocating poultry production to the regions of reduced frequency of high temperature extremes may reduce the impact on the production units, but the processors would also need to consider the impact of this structural change on the location and operation of their facilities. The factors to be covered would include transport distances; and transport in periods of high temperature extremes. This places a requirement on Defra to liaise with the whole food supply chain when considering interventions related to climate extremes in the UK. This would be extremely timely given the rising costs of fuel globally, the knock-on effects of rising food costs and the enormous leverage that public sector procurement can bring to bear on more sustainable purchasing measures as a core element of the sustainable consumption and production agenda.
Defra and other stakeholders (EA, NE) need to consider the cost to the farmers of adaptation against the wider social and environmental benefits that could be achieved. Within the adaptations costed in this study there are a number of adaptation which are environmentally negative, with either increased use of resource (energy and water) or increased use of pesticides. Alternative adaptations are available to the farmers but these often compromise the financial efficiency of the business. An example would be reduction of stock numbers to reduce stocking density in buildings. This is applicable to varying degrees in all livestock systems. However, the loss of output is greater than the cost of adapting buildings to mitigate against heat extremes. In other structures pre and post harvest operations to manage soils result in additional input. But delaying harvest and or moving to spring establishment of the following crop would be a possible environmental response but would have negative impact on farm profitability. This will continue to be the case unless wider socio-environmental benefits are costed into agri-environment support systems, and these benefits are recognised and valued by farmers, so that the farmers themselves can directly benefit for providing essential ecosystem goods and services in given localities.
) Page 125

There is continued need for advice programmes to improve farmer awareness of climate extremes and the frequency and magnitude of these extremes in the future. Coupled with this is a need to provide more information on the options to mitigate the impact of extremes as well as the environmental responsibilities of farmers and land managers. To balance these obligations further changes to support payments to farmers should be considered which better match the farmer’s costs and public benefits of the green and blue services that land management can provide.
) Page 126

12. ConclusionsPredicting Impacts of and Adaptation to Extreme Events - The frequency of extremes in the future that will impact on farm businesses is difficult to quantify in a general sense as each sector is vulnerable in different ways at different times of the year and with varying thresholds triggering the impact and a response. Quantifying these thresholds and their impacts is difficult and often subjective. Coupled with the RCM uncertainty and application of these coarse resolution climate projections at the farm or landscape scale requires caution when interpreting the results. Of the extremes considered, extreme heat, increasing dry spell duration and their combined impact on water resources seemed to be of particular concern to the agricultural industry.
Regional variation – Regional variation in the projections of future extremes, the attitudes towards the requirement or potential to adapt and the ability/opportunity to implement the adaptation adds an additional layer of complexity to communicating the risks of climate extremes and benefits of adaptation.
Awareness of Climate Extremes and Options - Levels of knowledge on climate extremes in the industry are low and variable as are the levels of existing adaptation (whether these are to extremes or average climate change) or plans to adapt in the near future. The numbers of people who do not believe they are well informed or that adaptation may be required suggests that further readily available and easily digestible information sources are required. The industry suggests that having access to a database of options and what is tried and tested would be a particularly useful resource.
Nature of Adaptations - Most of the adaptations that have already been made or planned are autonomous, relating to the continued changes that each sector experiences. Climate change already experienced, is contributing to the change, but is not the key motivating factor. While many of the autonomous changes contribute to mitigation of the climate extremes, it is not necessarily the experience or expectation of the extreme that has triggered the change. The economic costing exercise has focused on farm level adaptations although industry level, for example moving production to wetter areas of the UK, have been highlighted as have adaptations external to the industry, for example the development of new breeds or agro-chemicals.
Farmers decision making process – More farming decisions are made taking account of relatively short term factors, such as the season in question and the demands of the market place, than consider climate extreme changes after 2020. Personal values and objectives have as much influence on decisions made by farmers as the motivation of profit. Farmers will however respond to legislative requirements and as such regulation may be required to ensure some adaptations to extremes are put in place e.g. adequate ventilation in animal housing to ensure welfare standards.
Environmental consequence of adaptation - Nearly all of the costed adaptations considered most likely to be adopted by farmers require input of additional resource. The nature of the additional resource include:
variable inputs (pesticides, fertiliser, water),
operational resource (labour, power, machinery),
capital (investment in facilities and equipment)
While increase use of resource does not automatically result in negative environmental impact, in does increase the consumption of resource as well as increasing the opportunity for misapplication, both of which have negative environmental implications.
) Page 127

Environmentally positive change – could be achieved from some adaptations, but these are not costed as uptake is expected to be very small. These changes involve strategic change within the business, such as changes to enterprise size, and species / varietal choice. They impact the long term plan for the business and compromise economic performance.
Structural industry change – is an on-going autonomous change within the industry, driven by the demands of the marketplace as much as the opportunities available to farmers. None of the costed adaptations have identified a need to implement widespread structural change. There is potential for migration of some production systems / produce, away from regions in which the frequency and impact of climate extreme will impact most. This would effect, and could be influenced by, the post farm-gate supply chain.
Structural change – could also result in displacement of production and release of land (in the areas impacted by the extreme). A further consideration is the transfer of knowledge and the availability of skilled production labour. There is an knowledge / information requirement to provide farmers taking on the “new” production lines with the skills to undertake the production in an environmentally positive manner. There is potential for negative impact on biodiversity and natural ecosystems changing land use from grassland to arable or horticultural production. The post farm-gate supply chain – has great potential to contribute to the transfer of knowledge and the adoption of adaptations to that will mitigate for climate extremes. It is in the interests of this post farm-gate supply chain (processors & retailers) to better understand the risks brought about by the frequency and impact of climate extremes as the efficiency of their businesses is as equally exposed to the impact of climate extreme as the individual farm business. Defra engagement with the post farm-gate supply chain offers great potential to influence the type and speed of on-farm adoption of adaptation to mitigate against climate extremes.
) Page 128

References to published material
Adger, W.N., Agrawala, S., Mirza, M.M.Q., Conde, C., O’Brien, K., Pulhin, J., Pulwarty, R., Smit, B., and Takahashi, K. 2007. Assessment of adaptation practices, options, constraints and capacity. Climate Change 2007: Impacts, Adaptation and Vulnerability. Contribution of Working Group II to the Fourth Assessment Report of the Intergovernmental Panel on Climate Change, M.L. Parry, O.F. Canziani, J.P. Palutikof, P.J. van der Linden and C.E. Hanson, Eds., Cambridge University Press, Cambridge, UK, 717-743.
Anderson, J.F. Bates, D.W and Jordon K.A (1998) Medical and engineering factors relating to calf health as influenced by the environment. Transactions of the ASAE. 21:(6), 1169-1174
Angell B., Francis J., Chalmers A., Flint C. Agriculture and The Rural Economy - Information and Advice Needs 1997 report for MAFF.
Atkinson, C.J., Sunley, R.J., Jones, H.G., Brennan, R., and Darby, P. 2004. Defra Desk Study on winter chill in fruit, Final report for Defra project CTC0206.
Bates, P (2006) Sheep Farmer – May / June Edition – Controlling Ectoparasites
Bates, P (1999) Ectoparasites. Diseases of Sheep Eds
Beniston, M., Stephenson, D.B., Christensen, O.B., Ferro, C.A.T., Frei, C., Goyette, S., Halsnaes, K., Holt, T., Jylhä, Koffi, B., Palutikof, J., Schöll, R., Semmler, T., and Woth, K. 2007. Future extreme events in European climate: an exploration of regional climate model projections. Climatic Change, 81: 75-89.
Berry, P.M., Spink, J.H, Griffin, J.M., Sylvester-Bradley, R., Baker, C.J., Scott, R.K. and Clare, R.W (1998). Research to understand, predict and control factors affecting lodging in wheat. Home-Grown Cereals Authority Research Project No. 169.HGCA, London, 131pp.
Bruce, J. M., and Clark, J. J. 1979. Models of heat production and critical temperature for growing pigs. Animal Production, 28: Part 3.
Close, W. H. 1981. The climatic requirements of the pig. Environmental aspects of Housing for Animal Production:edited by J.J. Clark
Dale, M., Fullwood, J., Gallani, M.L., Hollis, D., and Kitchen, K. 2003. Climate Change and the Hydraulic Design of Sewerage Systems: Volume I - Climate Change Effects on Rainfall; IB Sensitivity Report: Validation of HadRM3 and Comparison with HadRM2, UKWIR Project CL/10, Report SR 630, UKWIR, London, UK.
DARDNI, 2005. Transporting livestock and poultry in hot weather, press release 138/05. 1st July. 3pp.
Diffenbaugh, N.S., J.S. Pal, R.J. Trapp and F. Giorgi, Fine-scale processes regulate the response of extreme events to global climate change, Proceedings of the National Academy of Sciences, 102(44), 15774-15778, 2005
Page 129

Easterling DR, Evans JL, Groisman PYa, Karl TR, Kunkel KE, Ambenje P (2000) Observed variability and trends in extreme climate events: a brief review. Bull Am Meteorol Soc 81:417–425
ECA. 2007. "European Climate Assessment and Dataset - Indices of extremes dictionary." from http://eca.knmi.nl/indicesextremes/indicesdictionary.php#3.
EA, 2005. Diffuse source pressures: Pesticides and sheep dip. Downloaded from http://www.environment-agency.gov.uk/commondata/acrobat/r_diff_pest_v2_1781258.pdf in March 2008.
EA, 2007. SHEEP DIP POLLUTION REDUCTION PROGRAMME, Downloaded from http://www.environment-agency.gov.uk/commondata/acrobat/sheepdip_prp_0807_1410874.pdf in March 2008.
Farmers’ Guardian. 2003. Dry weather takes its toll on arable crops and feed supplies. 24th October. p14.
Farmers’ Weekly. 2001. Race is on to stage cropping plan recovery: after wet autumn. 9th March. p66.
Farmers’ Weekly, 2005b. SE growers fear worse drought than in 1976. 1st July. p49.
Farming Futures. 2007. http://www.farmingfutures.org.uk/x8.xml.
Fowler HJ, Ekström M, Kilsby CG and Jones PD. 2004. New estimates of future changes in extreme rainfall across the UK using regional climate model integrations. 1: Assessment of control climate. Journal of Hydrology, 300(1-4), 212-233
French, N.P, Parkin, T.D.H. Morgan K.L (1996). A case control study of blowfly in lambs. Veterinary Record 139: 16, 384-388
Garforth, C., Rehman, T., McKemey, D., Yates, C., Rana, R. B., Wilkinson, M., Beechener, S., Hollis, K., McIntosh,L. Research to Understand and Model the Behaviour and Motivations of Farmers in Responding to Policy Changes (England), Research project EPES 0405/17
Grower, 1997. 14 weeks and counting: With no more than a 60% crop of apples & pears countrywide, growers will not be the only ones to suffer as a result of the frost damage. Grower 128 (5), 16-17.
Grower, 1999a. Frost report: no real threat: The state of top fruit crops after the latest crop scare. Grower 131 (17), 22-23.
Grower, 1999b. 60 second havoc: experiences of weather problems and apples. 7th October. p21-23.
Grower, 2001. How much soil nitrogen is left: after wet winter. 1 March. p13.
Grower, 2004. Rain pours on the harvest problems: crops damaged by high rainfall. 2nd September. p9.
Holman, I., and Loveland, P. 2002. Regional climate change impact and response studies in East Anglia and North West England (RegIS), Final report to Defra for Project CC0337.
Holman, I.P., and de Vries, T.T. 2005. Development of a metamodel tool for regional integrated climate change management’ (RegIS2), Final report to Defra for project CC0362.
Page 130

Hossell, J.E., Ramsden, S.J., Gibbons, J., Harris, D., Pooley, J., and Clarke, J. 2001. Timescale of farmlevel adaptations and responses to climate change, Final report to Defra for Project CC0333.
Hossell, J.E., Temple, M.L., Finlay, I., Gay, A., Oakley, J., Symmonds, W., and Moorhouse, D. 2002. Identifying and costing agricultural responses under climate change scenarios (ICARUS), Final report to DEFRA for project CC0357.
Hossell, J.E. 2003. Validating the Impacts of Climate Extremes, Final Report to Defra for project CC0360.
HRI. 1998a. To Investigate The Likely Impact On Vegetable Crop Development Of Changes In Temperature And CO2 Associated With Global Warming, Final report to Defra for Project CC0329.
HRI. 1998b. To investigate the likely impact on crop development of changes in temperature and water associated with global warming, Final report to Defra for Project CC0328.
HRI. 2007. Vulnerability of UK agriculture to extreme events, Interim report to Defra for Project AC0301.
Hulme, M., Jenkins, G.J., Lu, X., Turnpenny, J.R., Mitchell, T.D., Jones, R.G., Lowe, J., Murphy, J.M., Hassell, D., Boorman, P., McDonald, R., and Hill, S. 2002. Climate change scenarios for the United Kingdom. The UKCIP02 Scientific Report., School of Environmental Science, University of East Anglia, Norwich, UK. p. 120.
Huynh, T.T.T., Aarnink, A.J.A., Verstegen, M.W.A., and Others. 2005. Effects of increasing temperatures on physiological changes in pigs at different relative humidities. Journal of Animal Science, 83: 1385-1396.
IGER. 2002. Knowledge Transfer Initiative On Impacts And Adaptation To Climate Change In Agriculture, Final report to Defra on project CC0365.
IPCC, 2001. Climate change 2001: Impacts, Adaptation and Vulnerability. Cambridge University Press, Cambridge, UK.
IPCC. 2007. Summary for Policymakers. In: Climate Change 2007: The Physical Science Basis. Contribution of Working Group I to the Fourth Assessment Report of the Intergovernmental Panel on Climate Change [Solomon, S., D. Qin, M. Manning, Z. Chen, M. Marquis, K.B. Averyt, M.Tignor and H.L. Miller (eds.)]. Cambridge University Press, Cambridge, United Kingdom and New York, NY, USA.
Jönsson, A.M., Linderson, M.-L., Stjernquist, I., Schlyter, P., Nilsson, C., and Bärring, L. 2003. Will climate change increase the frequency of temperature backlashes causing frost damage in Swedish forests? Geophysical Research Abstracts, 5: 01010.
Katz, R.W., and Brown, B.G. 1992. Extreme events in a changing climate: variability is more important than averages. Climatic Change, 21: 289-302.
Lotter, D.W., Seidel, R., and Liebhardt, W. 2003. Performance of organic and conventional cropping systems in an extreme climate year. American Journal of Alternative Agriculture, 18: 146-154.
MAFF. 2000. Climate change and agriculture in the United Kingdom, Ministry of Agriculture Fisheries and Food, London, UK. p. 65.
Page 131

Masters, G.S., and Wilhelm, W.W. 2003. Phenological responses of wheat and barley to water and temperature – improving simulation models. Journal of Agricultural Science, 141: 129-147.
Moberg, A., Jones, P.D., Lister, D., Walther, A., Brunet, M., Jacobeit, J., Alexander, L.V., Della-Marta, P.M., Luterbacher, J., Yiou, P., Chen, D., Klein Tank, A.M.G., and Others. 2006. Indices for daily temperature and precipitation extremes in Europe analysed for the period 1901-2000. J. Geophys. Res, 111: (D22106), doi:22110.21029/22006JD007103.
Orson, J.H. 1999. The review of the direct effects of the dry and hot summer of 1995 on decision making of the individual farmer, Final report to Defra on project CC0322.
Oukabli, A., Bartolini, S., and Viti, R. 2003. Anatomical and morphological study of apple flower buds growing under inadequate winter chilling. Journal of Horticultural Science and Biotechnology, 78: 580-585.
Palutikof, J. and Hanson, C. (2004) Integrated assessment of the potential for change in storm activity over Europe: Implications for insurance and forestry, Tyndall Centre Technical Report 12
Parry, M., Wheeler, T.R., and Others. 2001. Investigation of thresholds of impact of climate change on agriculture in England and Wales Final report to Defra for project CC0358
Perry, M. 2006. National Climate Information Centre Climate Memorandum No 21, A spatial analysis of trends in the UK climate since 1914 using gridded datasets. Met Office, London, UK.
Porter, R.J., and Gawith, M. 1999. Temperatures and the growth and development of wheat: A review. European Journal of Agronomy, 10: 23-36.
Pritchard, D.G (1982). Social and management factors involved in respiratory disease of calves. Applied Animal Ethology 9:2, 198-199
Roe C.P (1982). A review of the environmental factors influencing calf respiratory disease. Agricultural Meteorology 26:(2) 127-144
Scott P.R (1997) Epidemiology and treatment of bovine respiratory disease in beef cattle. Cattle Practice 5:(4) 283-288
Shepherd, M.A. 2001. A review of the impact of the wet autumn of 2000 on the main agricultural and horticultural enterprises in England and Wales, Final report to Defra for Project CC0372. p. 151.
Smit, B., Burton, B., Klein, R.J.T., and Wandel, J. 2000. An Anatomy of Adaptation to Climate Change and Variability. Climatic Change, 45: 223-251.
Stakhiv, E. 1993. Evaluation of IPCC Adaptation Strategies, Institute for Water Resources, U.S. Army Corps of Engineers, Fort Belvoir,VA, USA.
UKCIP. 2003. Climate adaptation: Risk, uncertainty and decision-making, Technical Report, 14UK Climate Impacts Programme, Oxford, UK. p. 154.
Watson, R.T., Zinyoera, M.C., and Moss, R.H., 1996. Climate Change 1995: Impacts, Adaptations and Mitigation of Climate Change: Scientific-Technical Analysis. Contribution of Working Group II to the Second Assessment Report of the
Page 132

Intergovernmental Panel on Climate Change. Cambridge University Press, Cambridge, UK.
Wall, RL, Cruickshank, I, Smith, KE, French, NP & Holme, AS. (2002) Development and validation of a simulation model for blowfly strike of sheep Medical and Veterinary Entomology, 16 (4), 335 - 346.
Webster, A..J.F, Saville, C, Church B.M Gnanasakathy A and Moss R (1985) . Some effects of different rearing systems, cleanliness and injury in calves. British Veterinary Journal 1985 141 (5) 472-483
Page 133