Embed Size (px)
Citation preview
Design, sustainability analysis and multiobjective optimisation of ethanol production via syngas fermentation
Stavros Michailos * [a], David Parker [b], Colin Webb [c]
aSchool of Chemical Engineering & Applied Chemistry, Aston University, Aston Express Way, Birmingham B4 7ET
bSchool of Biosciences, University of Exeter, Stocker Road, Exeter, EX4 4QD, UK
cSchool of Chemical Engineering and Analytical Science, The University of Manchester, Oxford Road, Manchester, M13 9PL, UK
*Corresponding Author
E-mail address: [email protected] (S. Michailos)
Keywords: second generation ethanol, syngas fermentation, technoeconomic analysis, sustainability analysis, process simulation, multiobjective optimisation
Abstract. Ethanol production from non-edible feedstock has received significant attention over the past two decades. The utilisation of agricultural residues within the biorefinery concept can positively contribute to the renewable production of fuels. To this end, this study proposes the utilisation of bagasse in a hybrid conversion route for ethanol production. The main steps of the process are the gasification of the raw material followed by syngas fermentation to ethanol. Aspen plus was utilised to rigorously design the biorefinery coupled with Matlab to perform process optimisation. Based on the simulations, ethanol can be produced at a rate of 283 L per dry tonne of bagasse, achieving energy efficiency of 43% and according to the environmental analysis, is associated with low CO2 emissions. The conduction of a typical discounted cash flow analysis resulted in a minimum ethanol selling price of 0.69 $ L-1. The study concludes with multiobjective optimisation setting as objective functions the conflictive concepts of total investment costs and exergy efficiency. The total cost rate of the system is minimised whereas the exergy efficiency is maximised by using a genetic algorithm. This way, various process
configurations and trade-offs between the investigated criteria were analysed for the proposed biorefinery system.
1. Introduction
Because of oil price volatility as well as environmental concerns, significant research has been focused on the sustainable production of lignocellulose-based fuels and chemicals with the aim of substituting existing petroleum-derived products. In developed countries, the transport sector represents approximately 35% of the total energy consumption which even now is still highly dependent on fossil sources (~98%) [1]. However, due to the inevitable depletion of fossil reserves, the manufacture of bio-based fuels from renewable sources is crucial for meeting increasing world demand for transportation fuels as an essential element of the long term energy mix [2]. Production of biofuels commenced in the late 19th century, when corn ethanol was produced for the very first time and Rudolf Diesel’s first engine utilised peanut oil. Until the 1940s, biofuels were considered as feasible transportation fuels, but the decrease in fossil fuel prices halted their further expansion [3]. It was not until the mid-1970s that significant interest in commercial manufacture of biofuels rose again. At that time, ethanol from sugar cane in Brazil and corn in USA were efficiently produced. However, in most regions of the world the sharpest growth in biofuel manufacture has been observed during the past 20 years, mainly due to government policies [4]. Nowadays, bio-ethanol is the chief biofuel, and is swiftly escalating as a fuel additive along with its utilisation as a chemical raw material. At present, it is, in principle, exploited in gasoline blends at 10% with the potential to reach 85% in flexible fuel cars [5]. Even though the production of first generation ethanol has raised concerns over its sustainability, the exploitation of lignocellulosic biomass derived from forestry or agricultural residues, including bagasse, can positively contribute to the renewable production of building block chemicals and biofuels without competing for land and with the food supply chain [6].
There are currently three main process routes that can efficiently convert lignocellulosic biomass into ethanol, i.e. the biochemical, the thermochemical and the hybrid [7]. In the biochemical, there are two main steps: 1) hydrolysis in order to break down the physico-chemical structure of the material and release the sugars, and 2) yeast fermentation of sugars to ethanol. This route has received much attention from the research community mostly because of its
similarity with the existing production technology of ethanol and the anticipated lower capital costs [8]. The main disadvantage of this route is that lignin cannot be decomposed and as such does not contribute to ethanol production. The thermochemical route consists of the transformation of biomass into syngas via gasification followed by mixed alcohol catalytic synthesis. The drawbacks of this alternative are the high energy requirements and low ethanol selectivity [9]. The hybrid route is, in fact, a combination of the other two technologies. Biomass is gasified and then syngas is fermented by acetogenic bacteria to ethanol. Several advantages accompany this technology including higher yields, higher reaction specificity, lower energy demands, syngas composition versatility and higher resistance to impurities [10]. In addition, it exploits the lignin content of the raw material and the use of expensive enzymes is avoided. In spite of the large number of articles on the topic of syngas fermentation [11], only a small number have conducted techno-economic analyses of the hybrid gasification-fermentation (G-F) technology. Piccolo and Bezzo [12] have compared the hydrolysis-fermentation route to the gasification-fermentation route and the estimated production costs were 0.58 $ L -1 and 0.85 $ L-1
respectively. They also reported that the main drawback of the G-F process was the low conversion of syngas to ethanol. In addition, Wagner and Kaltschmitt [13] have tested and compared the three ethanol pathways and concluded that the hybrid route is the most energy efficient. Finally, Roy et al. [14] have tested several process configurations for the G-F technology and the production costs varied from 0.78 to 0.9 $ L-1. It can also be concluded from the literature review that, so far, bagasse utilisation in this hybrid process has not been tested.
Sugar cane bagasse was selected as feedstock for ethanol production for several reasons. It is a major agro-industrial residue in many countries (such as Brazil, South Africa and Australia) and despite its suitability for fuels and/or chemicals production [15], it is mainly utilised to raise steam and generate electricity; nevertheless there is still some excess [16]. Furthermore, if more efficient combustion boilers are implemented, it has been estimated that less bagasse would be incinerated (approximately 36% reduction [16]). To this end, research has focused on exploiting bagasse in biorefining technologies that are capable of producing saleable fuels from sugars, pyrolysis oil and syngas [17]. In addition, the expected escalation in cane production in order to satisfy the increase of global ethanol demand (from 70 to 130 million m3 between 2009 and 2025), will also give rise to further bagasse availability [18]. The composition of
bagasse chiefly comprises two polysaccharides (cellulose and hemicellulose) as well as a polyphenolic macromolecule (lignin). Cellulose consists of a linear chain of numerous highly structured β(1→4)-linked D-glucose units that creates crystalline districts and as a result it is more resistant to hydrolysis compared to hemicellulose. The latter component is made of heteroxylans, with a prevalence of xylose sub-units, and along with lignin (possesses a complex structure derived from aromatic alcohols polymerization), cover the cellulosic matrix providing a barrier to enzymatic and chemical degradation [19]. Table 1 [20] presents the compositional analysis of bagasse. It has been reported that sugarcane bagasse possesses the greatest positive net energy balance among the prevalent raw materials considered nowadays [21]. Presently, the energy generated from sugarcane is seven times more compared to that consumed in its creation. And when bagasse is counted in the equation, it is projected that the number might rise to as much as 15 times [22]. It is, also, believed that if bagasse is converted to ethanol the overall fuel yield can be increased by 30% (mass basis) without the requirement of using extra land and with the additional advantage of further decreasing the carbon footprint [23].
In view of these, the present study conducts a comprehensive techno-enviro-economic analysis to assess the feasibility of utilising sugarcane bagasse via the G-F route. The research incorporates 1) thermodynamic evaluation which comprises the calculation of the energy/exergy efficiencies 2) economic evaluation which includes the calculation of several financial indicators including net present value (NPV), internal rate of return (IRR), return on investment (ROI), payback period (PP) and the biofuel production cost and 3) the estimation of typical sustainability metrics. The analysis concludes with multiobjective optimization (by using a genetic algorithm) of the best option setting as objective functions the conflictive concepts of the total investment costs minimization and the exergy efficiency maximisation. This perception nearly always provides, not a sole solution, but instead a group of solutions, called the Pareto optimal set, allowing the user to choose the most suitable solution based on the occasion.
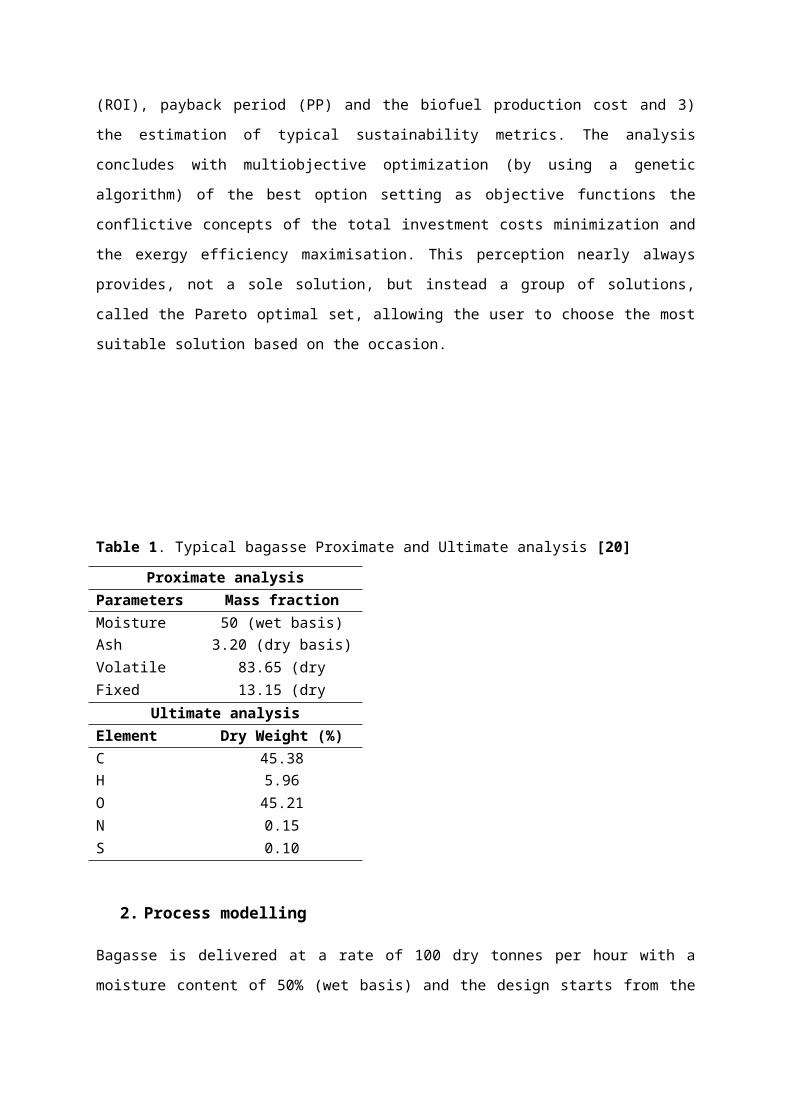
Table 1. Typical bagasse Proximate and Ultimate analysis [20]Proximate analysis
Parameters Mass fraction (%)Moisture 50 (wet basis)Ash 3.20 (dry basis)Volatile matter
83.65 (dry basis)Fixed Carbon
13.15 (dry basis)Ultimate analysis
Element Dry Weight (%)C 45.38H 5.96O 45.21N 0.15S 0.10
2. Process modelling
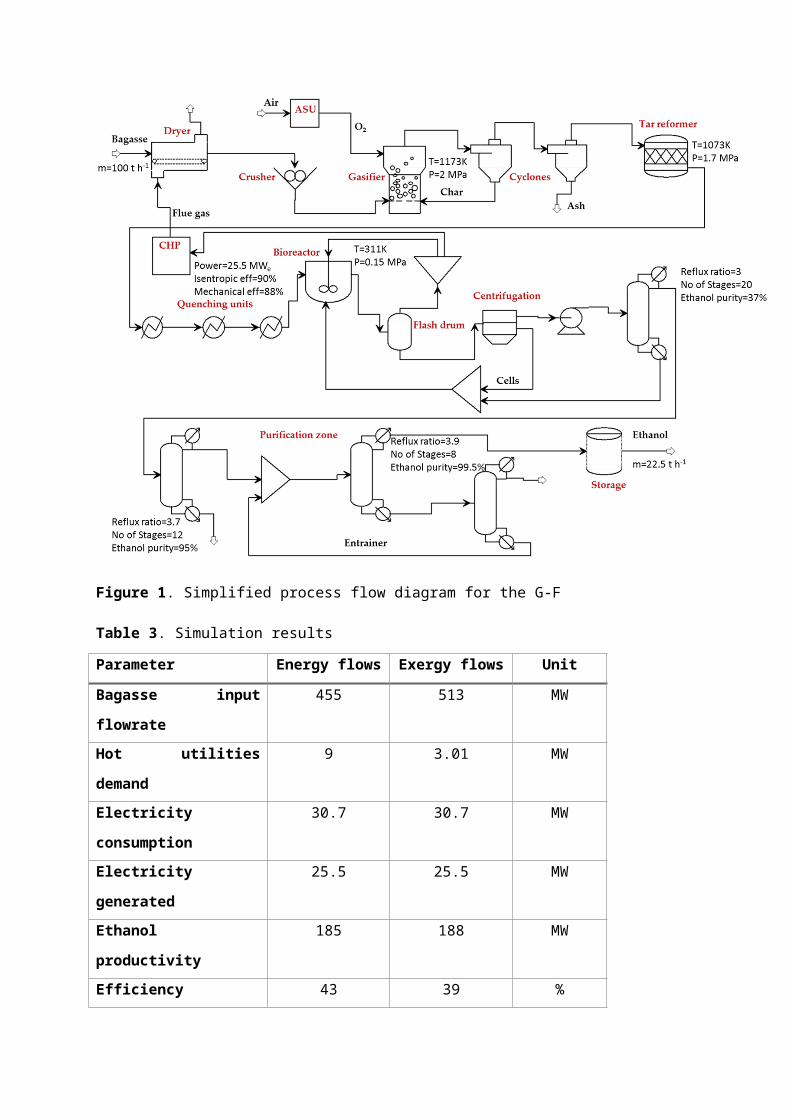
Bagasse is delivered at a rate of 100 dry tonnes per hour with a moisture content of 50% (wet basis) and the design starts from the drying module and concludes with the ethanol storage units (gate to gate analysis). Bagasse and ash can be defined by the user as non-conventional solids. As a result, two Aspen physico-chemical models were assigned to these components: one for the density (DCOALIGT) and the second one for the enthalpy (HCOALGEN). Both require awareness of proximate and ultimate analysis of bagasse (see Table 1). The physical properties of the conventional components were calculated by using the Redlich-Kwong-Soave cubic equation of state with Boston-Mathias alpha function (RKS-BM). This technique is appropriate for gas-processing, refinery and petrochemical applications including gas plants, crude towers and ethylene plants [24].Aspen plus process simulator was utilised aiming at solving the required material and energy balances. The G-F process consists of the following steps: 1) Bagasse pre-treatment (drying and crushing), 2) gasification, 3) syngas conditioning, 4) syngas fermentation, 5) ethanol recovery and 6) utilities section.
Bagasse pretreatment was described in details in a previous paper [25] and the same approach was adopted in this study. In short, an Aspen Plus crusher block has been employed to simulate a gyratory crusher which chops bagasse to a
final particle size of 2 mm. Afterwards, bagasse enters a dryer (RStoic block) in order to reduce its moisture content to 10%. As heating agent flue gas from the CHP unit is utilised. Dried and chopped biomass is then sent to the gasifier. An oxygen blown circulated fluidised bed (CFB) reactor operating at 1173 K and 2 MPa was considered. A CFB gasifier is suitable for large scale biorefinery applications and the utilisation of oxygen, instead of air, reduces the capital costs from smaller equipment sizes and more effective processes [26]. The employment of oxygen as oxidising agent implies the utilisation of an air separation unit (ASU). Several methods for air separation purposes are currently available including cryogenic, membrane and separation by adsorption. A cryogenic air separation process was chosen in this study since it is the most prevalent air separation process, utilized commonly in medium to large scale plants. It is considered to be the most efficient method for high productivity plants and the favoured option for nitrogen, oxygen and argon production as gases and/or liquids. Initially air is filtered and compressed which causes an increase to its temperature [27]. Therefore between each compression stage air is cooled down in heat exchangers and water is also removed. Before entering the distillation part of the process, air has to be purified from CO2, which can be accomplished by employing a molecular sieve unit. Subsequently, air has to be further cooled down in order to meet the cryogenic process specifications (~ 100 K). The final step of the procedure consists of two distillation units – one high and one low pressure. Purified air is sent to the HP distillation column (7 bar) where pure nitrogen exits from the top and the bottom stream is oxygen-enriched liquid air. The latter product enters the LP column where waste nitrogen leaves from the top and high purity liquid oxygen is recovered from the bottom which afterwards is heated and compressed [28].
A common technique for modelling biomass gasification is by estimating thermodynamic equilibrium composition through Gibbs free energy minimisation calculations for the C, H, and O atoms of the fuel and the gasification agent mixture. This approach has been used before in several studies [29, 30] and it is suitable for feasibility studies but not for reactor design [29]. For simulation purposes, the gasifier was divided in two steps. The first step employs a RYield reactor which decomposes bagasse to its constituent elements according to the ultimate analysis. This way the non-conventional feedstock is converted to components that the simulator can effectively handle.
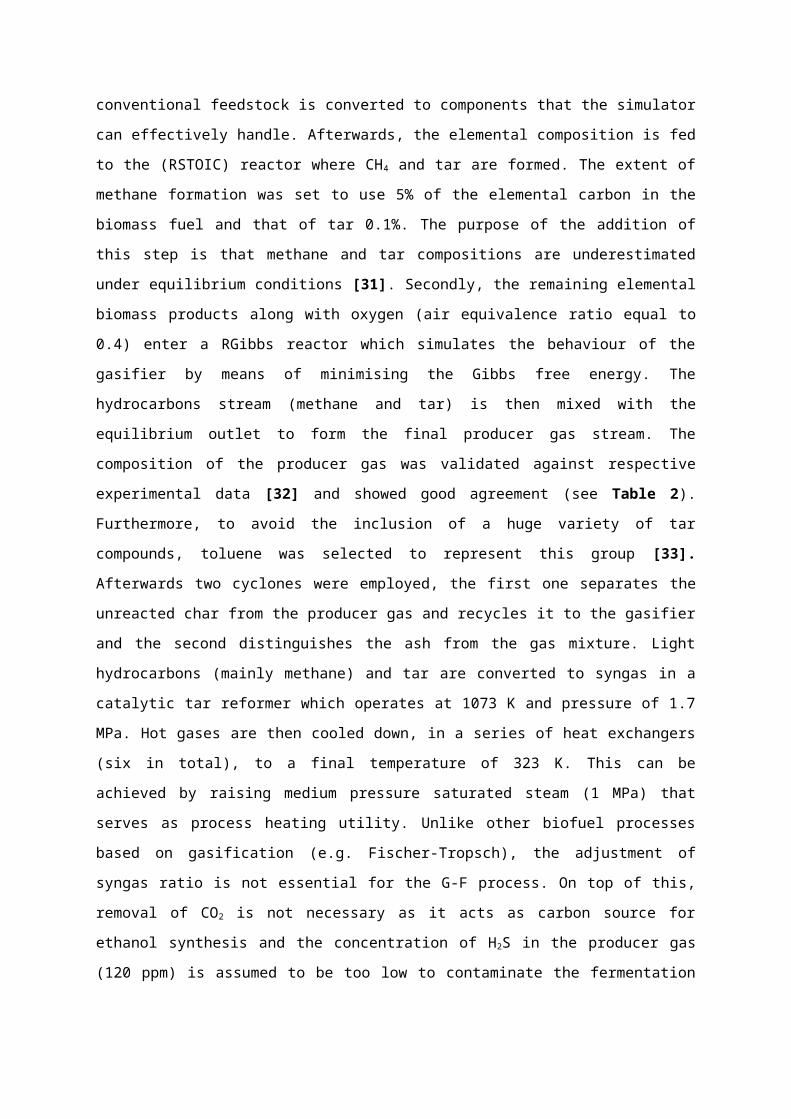
Afterwards, the elemental composition is fed to the (RSTOIC) reactor where CH4 and tar are formed. The extent of methane formation was set to use 5% of the elemental carbon in the biomass fuel and that of tar 0.1%. The purpose of the addition of this step is that methane and tar compositions are underestimated under equilibrium conditions [31]. Secondly, the remaining elemental biomass products along with oxygen (air equivalence ratio equal to 0.4) enter a RGibbs reactor which simulates the behaviour of the gasifier by means of minimising the Gibbs free energy. The hydrocarbons stream (methane and tar) is then mixed with the equilibrium outlet to form the final producer gas stream. The composition of the producer gas was validated against respective experimental data [32] and showed good agreement (see Table 2). Furthermore, to avoid the inclusion of a huge variety of tar compounds, toluene was selected to represent this group [33]. Afterwards two cyclones were employed, the first one separates the unreacted char from the producer gas and recycles it to the gasifier and the second distinguishes the ash from the gas mixture. Light hydrocarbons (mainly methane) and tar are converted to syngas in a catalytic tar reformer which operates at 1073 K and pressure of 1.7 MPa. Hot gases are then cooled down, in a series of heat exchangers (six in total), to a final temperature of 323 K. This can be achieved by raising medium pressure saturated steam (1 MPa) that serves as process heating utility. Unlike other biofuel processes based on gasification (e.g. Fischer-Tropsch), the adjustment of syngas ratio is not essential for the G-F process. On top of this, removal of CO2
is not necessary as it acts as carbon source for ethanol synthesis and the concentration of H2S in the producer gas (120 ppm) is assumed to be too low to contaminate the fermentation [34]. Therefore, there is no need to add to the design any water-gas-shift reactors or acid gases removal units.
Table 2. Comparison of prediction syngas composition with the corresponding experimental values from [32]
Component
Experimental This model
mol composition (% dry basis)CO 31.9 33.3
H2 25.5 26.2
CO2 27.3 26.8
CH4 3.8 3.8
The next step of the process is the syngas fermentation. The modelling of the bioreactor is based on the experiments conducted by Arora et al. [35]. As so, syngas fermentation takes place in a CSTR with operating conditions of temperature equal to 311 K and pressure of 0.15 MPa. Fermentation is catalysed by bacterium C. ljungdahlii and apart from ethanol acetic acid is also produced. In the current model, the reactions that were taken under consideration are as follows:
6CO+3H 2O→CH 3CH 2OH +4CO2
(8)
2CO2+6H2→CH3CH 2OH+3H2O
(9)
4CO+2H 2O→CH 3COOH+2CO2
(10)
2CO2+4H 2→CH 3COOH +2H 2O (11)
A conversion reactor block was used to simulate the bioreactor considering that 70% of CO is converted to ethanol while 50% of H2 is converted to ethanol [35]. Furthermore, the proposed design suggests that after distillation aqueous broth with dilute acetic acid is recycled back to the inlet of the fermenter. This way, it reaches equilibrium conditions and its concentration remain constant. As so, Eqs 10 and 11 were not considered in the model. Cells are, also, recycled to the bioreactor after they are separated in a centrifugation unit (not simulated in detail but considered for the economic analysis). The fermenter broth contains a significant amount of unreacted gases which are separated from the liquid products in a flash drum separator. This gas stream is recycled to the bioreactor but in order to avoid accumulation a portion (~20%) is split and sent to a combined gas-steam turbine system to raise electricity equal to 25.5 MW. Design specifications for the CHP unit can be found in the literature [36]. Briefly, the gases are compressed up to 0.7 MPa and enter a gas turbine where they are burned with excess of pressurised oxygen derived from the ASU. Carbon dioxide produced from the fermentation step is used as diluent instead of nitrogen [37] and in this way the employment of energy and cost intensive CO2 capture technologies is avoided. The exhaust gas from the gas turbine is
recovered from a heat recovery steam generation (HRSG) system and the produced steam drives a typical steam turbine. A minor proportion of the unreacted gases still remain in the liquid mixture and will separate in the first distillation column condenser using a pressure relief valve. Also, the bottom stream is recycled to the fermentor (aqueous broth).
Finally, the liquid fermentation product enters a series of two distillation columns which give as output distillate with 95% wt. of ethanol – water mixture (azeotrope). This is fed to an extractive distillation unit that comprises two more distillation columns: the extractive distillation one and the solvent recovery unit where the entrainer is obtained. The entrainer used in this technology should be non-volatile and have a high boiling point and essentially does not form any azeotrope with either component of the original azeotropic mixture. A compound that meets these requirements is ethylene-glycol. The distillate of the first column (extractive) is pure ethanol and the bottom stream a mixture of water and the entrainer. The latter stream is sent to the second column where pure ethylene-glycol is recovered from the bottom and is returned to the extractive column. The main advantage of extractive distillation compared to azeotropic is that the necessary amount of the entrainer is much lower which leads to lower energy consumption and lower capital costs (due to lower volume of the distillation units) [38]. Ethanol is produced at a rate of 22.5 t h -1. Figure 1 provides a simplified schematic of the G-F process and Table 3 the main simulation results. The design suggests that the process cannot be self-sufficient and both electricity and heating imports are essential. The main reason behind this is the employment of the air separation unit which requires 28 MW of electricity while heating and cooling duties count for 9 and 21 MW respectively.
Figure 1. Simplified process flow diagram for the G-F
Table 3. Simulation results
Parameter Energy flows Exergy flows UnitBagasse input flowrate
455 513 MW
Hot utilities demand
9 3.01 MW
Electricity consumption
30.7 30.7 MW
Electricity generated
25.5 25.5 MW
Ethanol productivity
185 188 MW
Efficiency 43 39 %
3. Techno-Enviro-Economic assessment3.1 Energy/ Exergy analysis
In any chemical process, energy quantitative evaluation can be carried out by utilising the first law of thermodynamics. In contrast, the direction of flow or work (qualitative evaluation) can be realised by employing the second law of thermodynamics and it is known as exergy analysis. In effect, it is equally significant to study both the quantity and the quality of energy within a system. Nevertheless, exergy analysis is more valuable as it recognises the causes, locations and magnitude of the system inefficiencies and incorporates irreversibility in the thermodynamic assessment. By investigating the exergy destroyed by each component in a process, it is feasible to spot the stages that have to be enhanced. Furthermore, exergy analysis is often employed to compare systems and/ or components to assist in making well-versed design decisions. Energy and exergy efficiencies (η∧ψrespectively) are calculated by utilizing the following equations [39]:
η=mfuel LHV Fuels+W out
mbagasse LHV bagasse+Q¿+W ¿
(12)
ψ=EFuels+W out
Ebagasse+E ¿Q+W ¿
(13)
Where mfuel and mbagasse are the mass flow rates of produced fuels and bagasse
respectively, E corresponds to exergy flows, W refers to electricity, Q symbolises heat streams and subscripts in and out stand for energy/exergy import flows to the system and produced energy/exergy flows respectively. All the necessary thermodynamic data were extracted from Aspen plus process simulator. The energy and exergy content of bagasse was calculated in a previous study [40], i.e. 16.5 MJ kg-1 and 18.6 MJ kg-1 respectively. Work is considered as pure exergy while the exergy content of a heat stream is equal to:
EQ=Q(1− TT 0 ) ,T 0=298K (14)
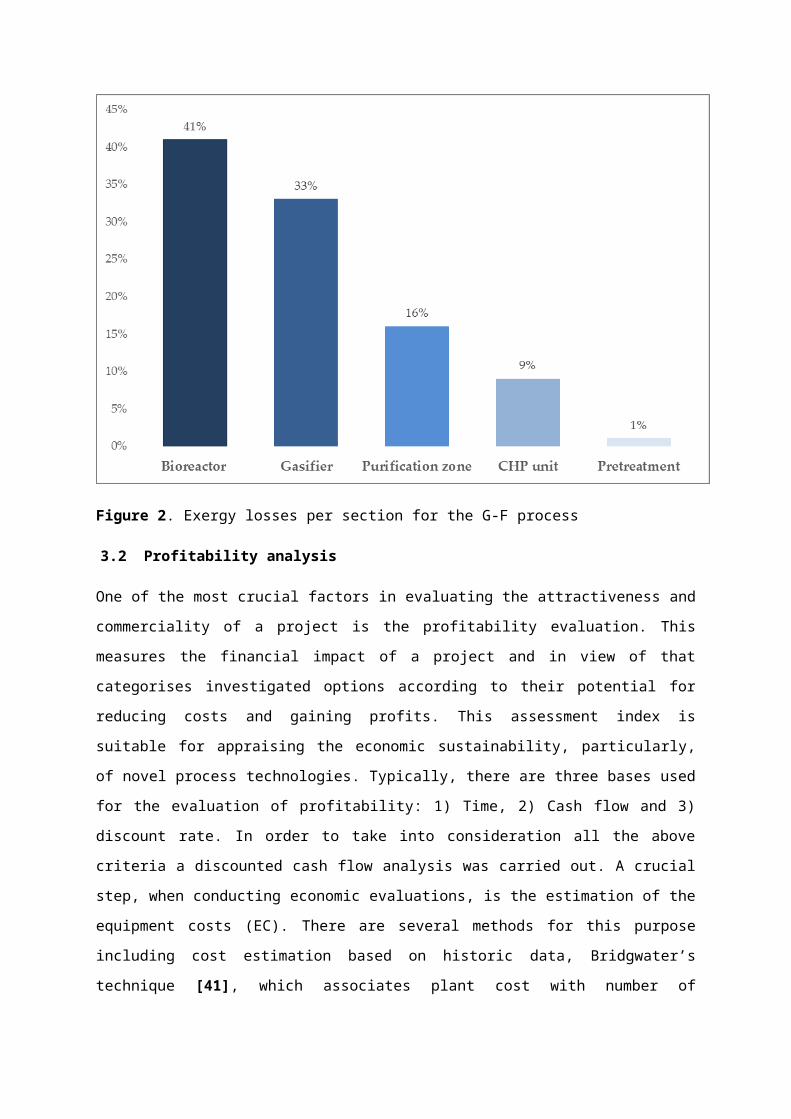
Given the process technologies simulated, the G-F process achieves energy/exergy efficiencies of 43%/39%. The bioreactor due to low conversion of syngas to ethanol is the major contributor to the exergy losses as depicted in Figure 2. A 82% of the chemical exergy contained in bagasse can be preserved after gasification in the chemical exergy of carbon monoxide, methane and hydrogen. These losses count approximately for the one of third of the total losses of the system. Other than these, losses associated with the purification zone are attributed to heating imports and mechanical/isentropic efficiencies are mainly responsible for energy wastes within the CHP unit.
Figure 2. Exergy losses per section for the G-F process
3.2 Profitability analysis
One of the most crucial factors in evaluating the attractiveness and commerciality of a project is the profitability evaluation. This measures the financial impact of a project and in view of that categorises investigated options according to their potential for reducing costs and gaining profits. This assessment index is suitable for appraising the economic sustainability,
particularly, of novel process technologies. Typically, there are three bases used for the evaluation of profitability: 1) Time, 2) Cash flow and 3) discount rate. In order to take into consideration all the above criteria a discounted cash flow analysis was carried out. A crucial step, when conducting economic evaluations, is the estimation of the equipment costs (EC). There are several methods for this purpose including cost estimation based on historic data, Bridgwater’s technique [41], which associates plant cost with number of processing stages, the factorial method of cost estimation, via which the total capital cost is estimated as the sum of the equipment cost multiplied by an installation factor (known as Lang factor) and cost estimating based on recent data on actual prices paid for similar equipment. The latter method is the most accurate one but access to large amounts of high quality data is required which is possible only for international companies that carry out projects globally. Thus for this study cost estimation is based on historic data coupled with relevant Lang factors. Therefore, equipment cost were calculated by utilizing the following equation [39]:
C=C0(SS0
)f
(15)
Where C is the estimated actual cost of the unit, C0 the base cost of the unit, S the actual size or capacity of the unit, S0 the base or capacity and f an empirical scaling factor. The values of C0, S0 and f can be found in the literature [42, 43, 44, 45]. After the estimation of the equipment cost it is possible to proceed in calculating the direct and indirect costs of the project by following the methodology proposed by Peters et al. [46]. According to this method the direct (DC) and indirect costs (IC) are calculated as a percentage of the EC and total capital investment (TCI) is the sum of EC, DC and IC plus contingency and working capital. Table 4 presents the components of the TCI along with the respective Lang factors and Figure 3 the breakdown of the EC.
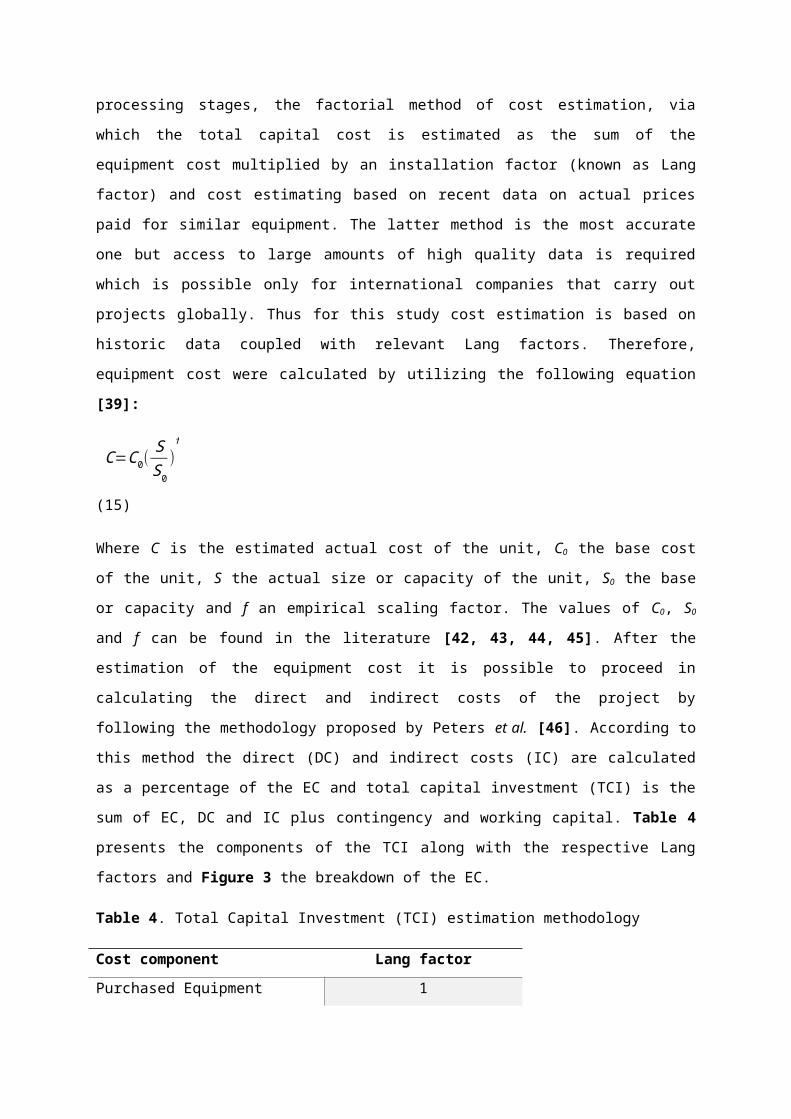
Table 4. Total Capital Investment (TCI) estimation methodology
Cost component Lang factorPurchased Equipment 1Purchased Equipment Installation
0.39
Instrumentation and controls 0.26Piping 0.31Electrical Systems 0.1Buildings(including services) 0.29Yard Improvements 0.12Direct costs (DC) 2.47Engineering and Supervision 0.32Construction Expenses 0.34Legal Expenses 0.04Contractor's Fee 0.19Indirect costs (IC) 0.89Contingency 0.2*(DC+IC)Fixed Capital Investment (FCI)
Contingency + IC + DC
Working Capital (WC) 0.15*FCITotal Capital Investment (TCI)
FCI+WC
Figure 3. Breakdown of the equipment cost
Subsequent to the estimation of total capital investment, operating costs, including feedstock price ($44 per dry tonne [47]) utilities costs, maintenance and labour expenditures, were calculated and finally the estimation of net cash
flows (CF) has been conducted. The cost of capital was set equal to 10% per annum, full equity financing and straight line depreciation were assumed (assets depreciated over 10 years), the annual operating hours were taken as 8000, project lifetime was 25 years, reference year is 2014 (all the costs were updated by utilising Chemical Engineering Plant Cost Indices) and the tax rate was selected as 25%. In addition, any kind of subsidies associated with the production of renewable value products was not taken into account. Several economic indicators, such as net present value (NPV), IRR, ROI, annualised capital cost (ACC) and payback period (PP), are estimated in order to measure the economic performance of the project.
NPV=−TCI+∑t=1
20 CF(1+i)t
(16)
∑t=1
20 CF(1+ IRR)t
=0
(17)
ROI= Annual incomeCapital Investment
×100%
(18)
ACC=TCI × i×(1+i)n
−1+(1+i)n
(19)
The total annual cost (TAC) derives from the sum of the ACC and the annual operating costs. Subsequently, it is conceivable to compute a vital economic factor, the cost of production. The production cost is extremely useful when the value of a product cannot be determined clearly, for instance when a known product is produced from a nonconventional feedstock (such as bagasse).
ProductionCost= TACProductionrate
(20)
The ethanol production cost is equal to 0.67 $ L -1 and for a selling price of 0.5 $ L-1 [48] the NPV value is negative. Thus, a minimum ethanol selling price (MESP) of 0.69 $ L-1 was calculated for NPV break-even (NPV = 0 or IRR = cost
of capital). Table 5 summarises the economic results for the G-F process. Considering an IRR of 15%, the ethanol selling price is 0.71 $ L-1 and the net profits equal to M$ 40. In addition, financial risk analysis was carried out in order to investigate the effect of TCI and ethanol selling price on the NPV. The estimation of capital investments comes usually with an uncertainty of 30%− ¿+¿ ¿ ¿
while to take into account price volatilities a 20%− ¿+¿ ¿ ¿ range was considered for
ethanol price (MESP). Figure 4 depicts the resultant histogram derived from 10,000 Monte Carlo iterations (triangular distribution was assumed for both variables). The mean value of NPV was positive and equal to M$ 8.5.
Figure 4. Financial risk analysis on NPV
Table 5. Economic outputsEconomic parameter ValueEquipment cost 130 M$Total Capital Investment
603 M$
Annualised capital cost 84.5 M$Operating cost 67.8 M$Total annual cost 110 M$
Production cost 0.67 $ L-1
MESP 0.69 $ L-1
ROI 14.5 %Payback period 8 years
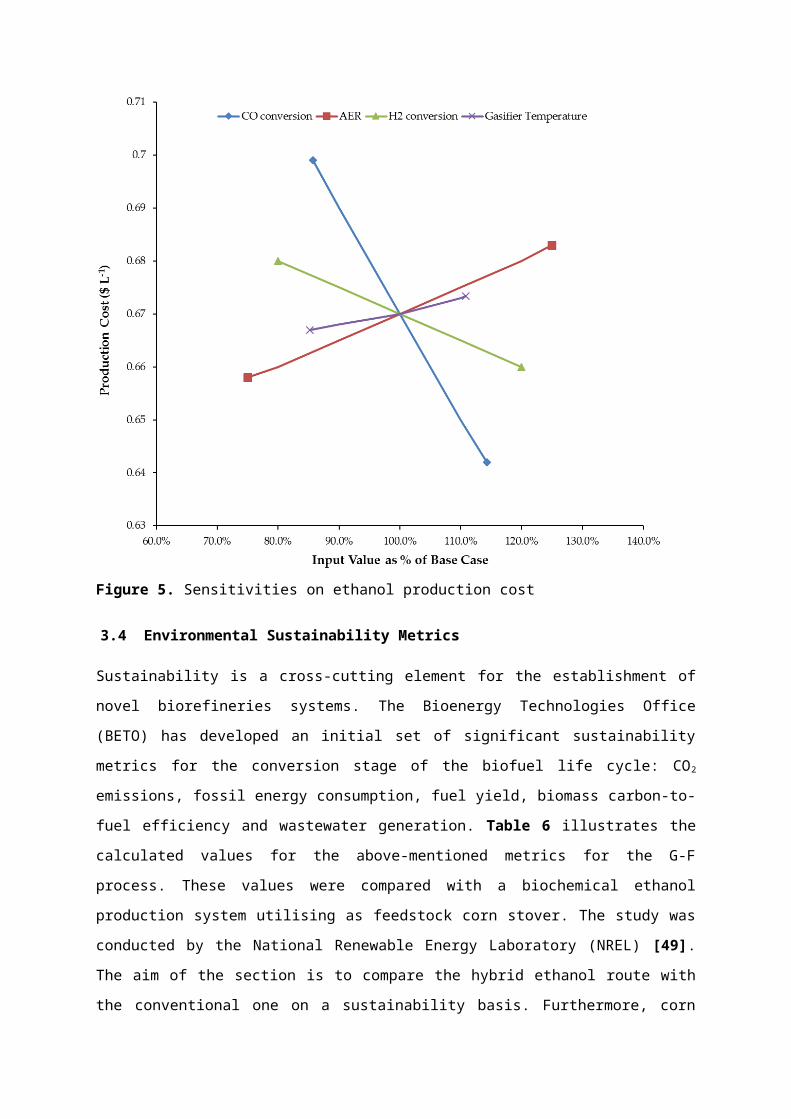
3.3 Sensitivity analysis
Parametric analysis on the ethanol production cost was carried out so as to identify the key process variables for the G-F process. As depicted in Figure 5, it was observed that the most vital process variables are the carbon monoxide conversion and the air equivalence ratio (AER). The higher ethanol productivity related to increased CO conversion lead to lower production costs, while by increasing the AER not only higher costs associated with the ASU unit are calculated but also the CO concentration at the exit of gasifier is reduced.
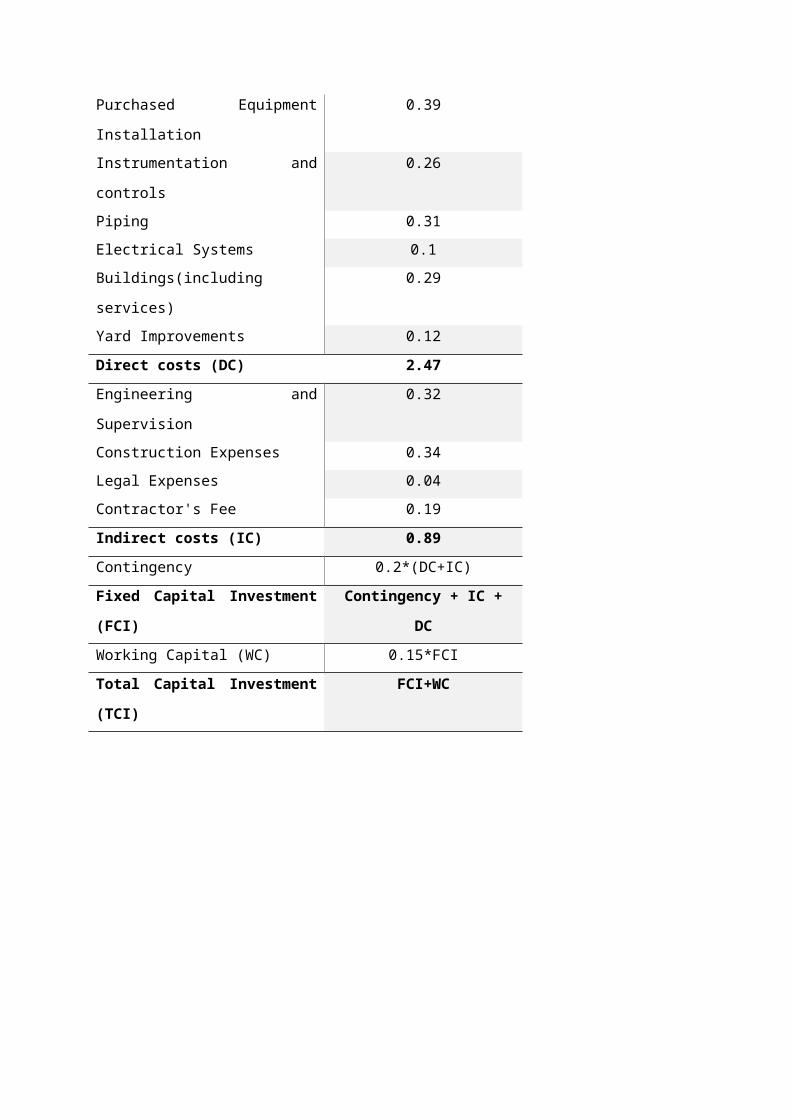
Figure 5. Sensitivities on ethanol production cost
3.4 Environmental Sustainability Metrics
Sustainability is a cross-cutting element for the establishment of novel biorefineries systems. The Bioenergy Technologies Office (BETO) has developed an initial set of significant sustainability metrics for the conversion stage of the biofuel life cycle: CO2 emissions, fossil energy consumption, fuel yield, biomass carbon-to-fuel efficiency and wastewater generation. Table 6 illustrates the calculated values for the above-mentioned metrics for the G-F process. These values were compared with a biochemical ethanol production system utilising as feedstock corn stover. The study was conducted by the National Renewable Energy Laboratory (NREL) [49]. The aim of the section is to compare the hybrid ethanol route with the conventional one on a sustainability basis. Furthermore, corn stover, like bagasse, is an agricultural lignocellulosic residue, and due to limited biomass availabilities and restrictions associated with overall supply chains, the identification of conversion biorefineries that lead to a specific product (e.g. ethanol) and establishment of optimal biofuel
value chains (e.g. one conversion route for lignocellulosics) are of high importance. The comparison shows that the biochemical route outplays the G-F process in all metrics apart from the wastewater generation. Both processes attain relatively low CO2 emissions compared to other biorefineries (e.g. hydrocarbons from wood pyrolysis emit 18.9 gCO2 MJ-1 [50]). It should be noted here that, in the calculations, the emissions related with producing steam and electricity from conventional sources were also included. Typical values are 0.201 kg-CO2 kWh-1 for raising steam and 0.537 kg-CO2 kWh-1 for generating electricity [40]. The CHP unit of the G-F emits less CO2 than the respective of the biochemical pathway but these savings are counterbalanced from the energy imports mainly associated with the air separation unit. Moreover, syngas conversion to ethanol is still challenging and as so productivities and carbon efficiencies for the G-F process are lower compared well-established biochemical conversion routes. A common drawback of any bioprocess is the usage (in almost every process step) and disposal of high amounts of bulk water. On the other hand, in the hybrid route wastewater is mostly generated in the purification zone (distillation columns). Overall, the G-F process attains moderately low carbon footprint but at the current technological status biochemical ethanol provides more benefits.
Table 6. Sustainability metrics for the G-F processSustainability Metric NREL model
[49]Present study
CO2 emissions (gCO2 per MJ fuel) 9.5 11.5
Fossil Energy Consumption (MJ fossil energy per MJ fuel product)
0.08 0.15
Total Fuel Yield (m3 per dry tonne feedstock) 0.33 0.28
Biomass Carbon-to-Fuel Efficiency (C in fuel per C in biomass)
29 27
Wastewater Generation (m3 per day) 3,100 1,555
3.5 Learning effect
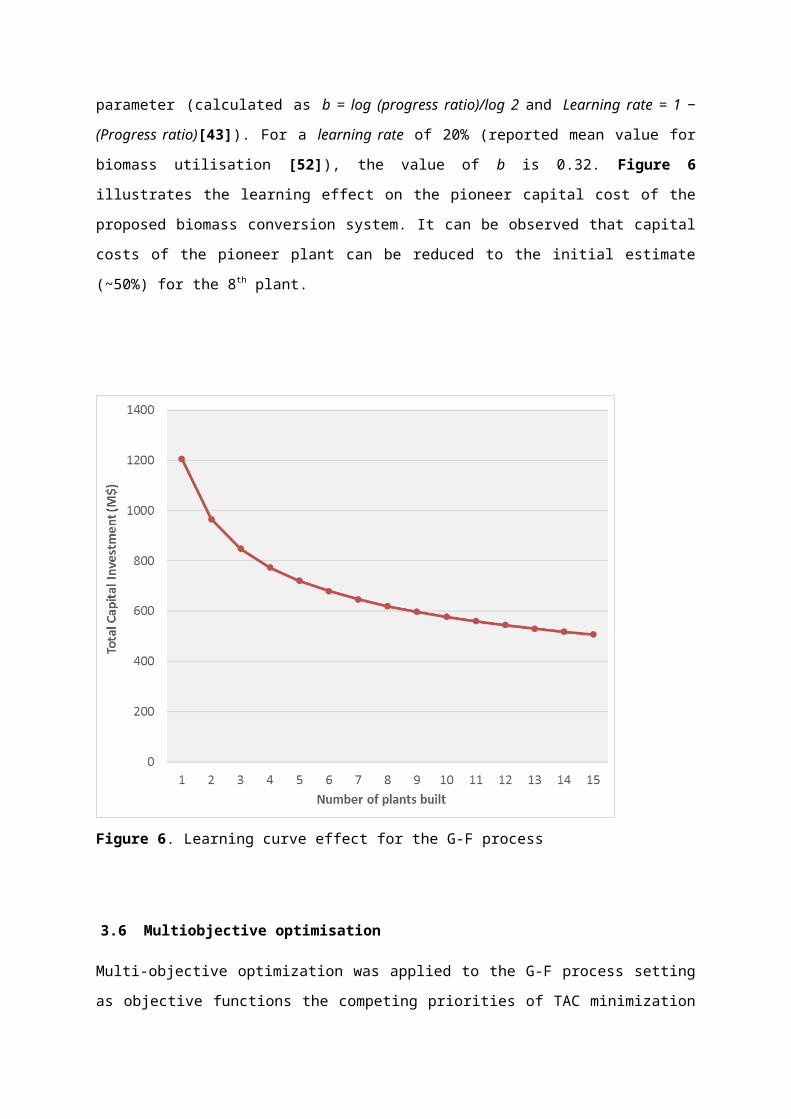
The technoeconomic analysis reported here uses what are known as “n th-plant” economics. The key assumption implied by n th-plant economics is that the analysis does not describe a pioneer plant; instead, several plants using the same technology have already been built and are operating. In other words, it
reflects a mature future in which a successful industry of n plants has been established. Because the technoeconomic model is primarily a tool for studying new process technologies or integration schemes the cost of the pioneer plant is also presented. The latter is calculated by dividing the TCI with a cost growth factor. Typical values are in the range of 0.4-0.6 for second generation biofuels [51] and in this study a value of 0.5 was assumed by considering that biomass gasification is an established technology while syngas fermentation is still at a premature level; consequently, the TCI increases to M$ 1206. Nevertheless, the cost of emerging technologies drops as more plants are constructed and productivity increases because of more experience gained by organisations. This effect is known as a learning curve or experience curve or progress curve or learning by doing effect. The trend of the learning curve can be described by Eq. (22).
y=a x−b
(22)
Where y is the capital cost of the xth unit, a is the capital cost of the first unit, x is the cumulative number of units and b is a parameter (calculated as b = log (progress ratio)/log 2 and Learning rate = 1 − (Progress ratio)[43]). For a learning rate of 20% (reported mean value for biomass utilisation [52]), the value of b is 0.32. Figure 6 illustrates the learning effect on the pioneer capital cost of the proposed biomass conversion system. It can be observed that capital costs of the pioneer plant can be reduced to the initial estimate (~50%) for the 8th plant.
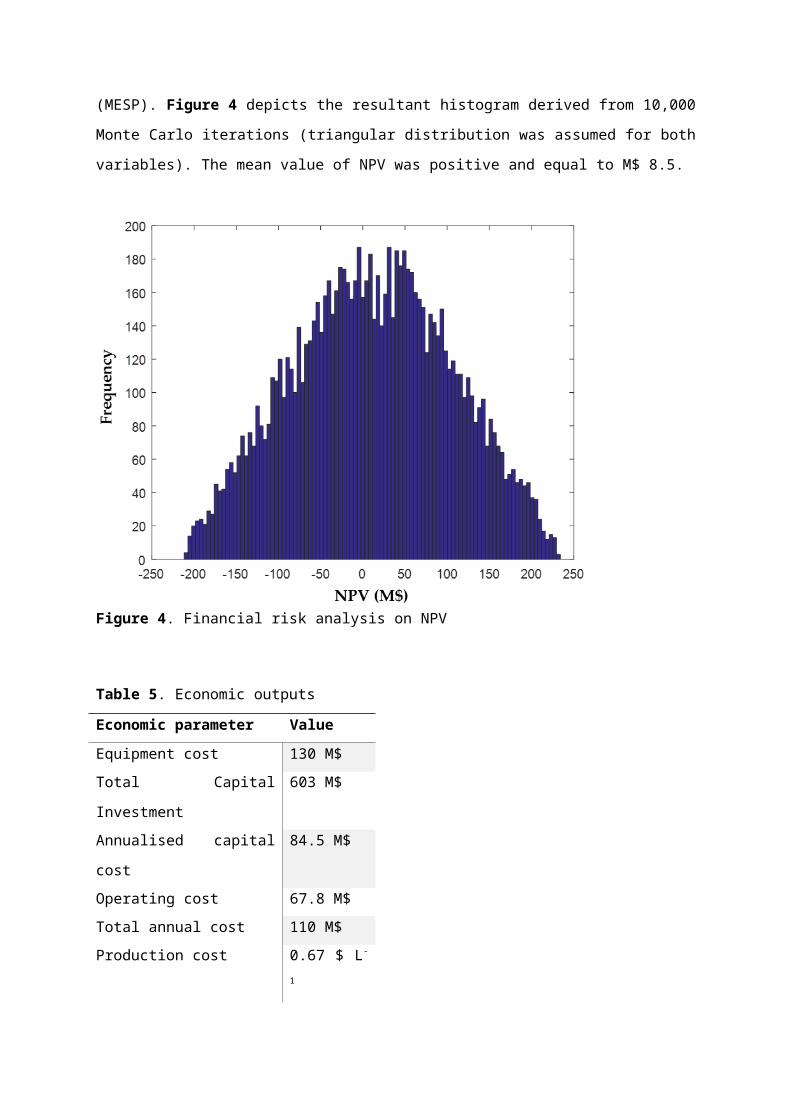
Figure 6. Learning curve effect for the G-F process
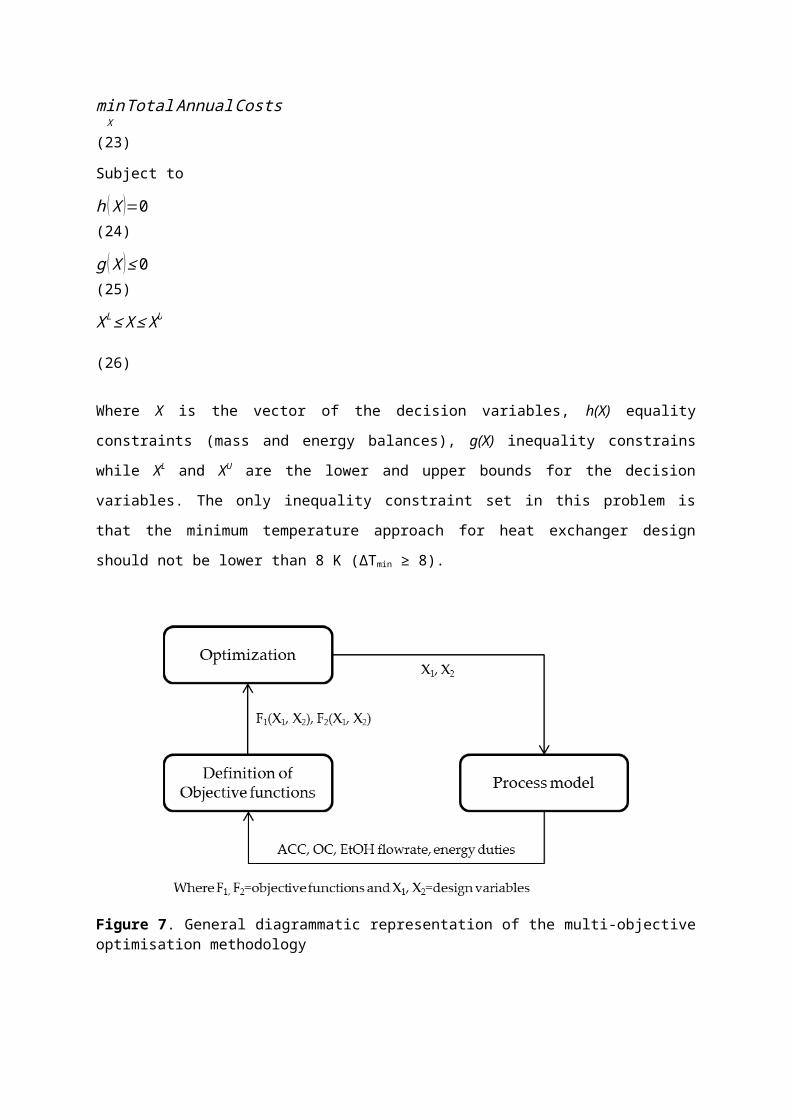
3.6 Multiobjective optimisation
Multi-objective optimization was applied to the G-F process setting as objective functions the competing priorities of TAC minimization and exergy efficiency maximization. In general, the higher the investment cost the higher the efficiency of a process. The decision variables that were examined in the present research are CO and H2 conversion to ethanol and are presented along with their bounds in Table 7. By increasing these conversions, higher efficiencies (due to higher ethanol production) can be achieved but at higher costs as larger volumes have to be implemented and higher energy supplies would be demanded throughout the entire process (mainly in the purification section). This trade-off between exergy efficiency and total cost has been previously reported as well in [53]. As formerly discussed, the TAC (first objective function) is calculated as the sum of ACC and OC while the exergy efficiency (second objective function) as the ratio of the exergy content of the ethanol produced (ethanol mass flow rate is needed) over the exergy input to the process (bagasse, heat and electricity duties).
Table 7 - Decision variables and their bounds for the multi-objective optimization problem
Variable Studied range UnitsCO conversion 40-95 %
H2 conversion 30-95 %
Typically, deterministic approaches to solve optimisation problems require problem’s analytical properties (e.g. convexity of the objective function) to be employed in order to generate a deterministic sequence of solutions within the search space. In addition, in all chemical processes, including biorefineries, complex mass and energy constraints are involved in the optimisation problem. If a deterministic method is to be utilised to solve these large scale non-linear problems, constraint equations should be integrated into the objective function (Lagrangian relaxation) [53]. Nevertheless, in this study, Aspen Plus is employed to simulate the biorefinery. This way, it is possible to take advantage of the nested mass and energy balances of Aspen Plus unit operations and, additionally, any constraints are satisfied when simulation is successfully converged. Moreover, as the process model consists of non-convex functions, most deterministic optimization techniques shall fail to find global optima. To this direction, a stochastic algorithm was applied to optimise the biorefinery. In fact, stochastic global optimisation techniques find the optimum point based on input-output data of the problem. Unlike deterministic methods, these methods are not based on rigorous mathematical formulations and they do not have need of manipulating the mathematical structure of the objective function and the constraints. In effect, the process model is treated by the optimizer as a black box. In view of these, the nested Matlab function ‘gamultiobj’ (based on genetic algorithms) was used to solve the optimization problem. An initial population of 100 cases was considered, and 2000 maximum evaluations were set as stopping criterion. The optimised decision variable values from Matlab are transferred to Aspen Plus where the process is simulated for these values (by utilising Microsoft’s COM technology for software interaction). The simulated results are then sent back to the optimiser to re-solve the objective function (see Figure 7). The mathematical formulation of the problem is depicted in Eq. (22-26). The
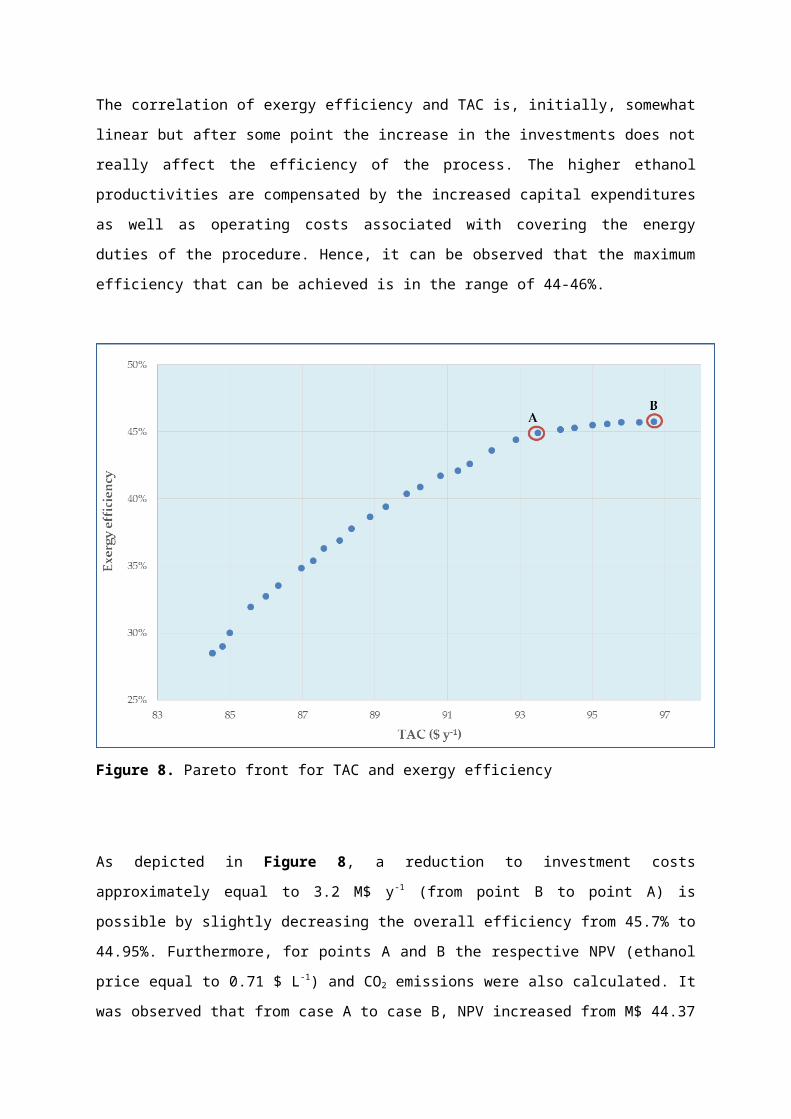
generated Pareto front for the bioethanol production process is depicted in Figure 8.
maxXExergy Efficiency
(22)
minXTotal AnnualCosts
(23)
Subject to
h (X )=0 (24)
g (X )≤0 (25)
X L≤ X ≤X U
(26)
Where X is the vector of the decision variables, h(X) equality constraints (mass and energy balances), g(X) inequality constrains while XL and XU are the lower and upper bounds for the decision variables. The only inequality constraint set in this problem is that the minimum temperature approach for heat exchanger design should not be lower than 8 K (ΔTmin ≥ 8).
Figure 7. General diagrammatic representation of the multi-objective optimisation methodology
The correlation of exergy efficiency and TAC is, initially, somewhat linear but after some point the increase in the investments does not really affect the efficiency of the process. The higher ethanol productivities are compensated by the increased capital expenditures as well as operating costs associated with covering the energy duties of the procedure. Hence, it can be observed that the maximum efficiency that can be achieved is in the range of 44-46%.
Figure 8. Pareto front for TAC and exergy efficiency
As depicted in Figure 8, a reduction to investment costs approximately equal to 3.2 M$ y-1 (from point B to point A) is possible by slightly decreasing the overall efficiency from 45.7% to 44.95%. Furthermore, for points A and B the respective NPV (ethanol price equal to 0.71 $ L-1) and CO2 emissions were also calculated. It was observed that from case A to case B, NPV increased from M$ 44.37 to M$ 44.94 while the emissions increased from 14.1 gCO2 MJ-1 to 14.9 gCO2 MJ-1. Thus, a 5.4% reduction to the emissions can be achieved by decreasing NPV by only 1.3%. In summary, multiobjective optimisation provides
flexibility to the user and the selection of the best solution depends on the user and the goals of the undertaken project.
4. Concluding remarks
A sustainability analysis was carried out regarding ethanol production in a hybrid gasification-fermentation process. Since the investment in unproven ventures carries high risk, technoeconomic analyses of up-and-coming technologies are essential to providing improved prediction of the associated expenditures and potential profits. For the base case scenario, an exergy efficiency of 39% is achieved and a MESP of 0.69 $ L -1. Furthermore, the study proposes a multiobjective optimisation methodology where a set of optimum solutions is generated and the selection of the best depends on user preferences and criteria (e.g. economic, environmental or technical). According to the present design, a 5.4% reduction to the CO2 emissions can be accomplished by decreasing NPV by only 1.3%. Environmental analysis suggest that CO2
emissions and fossil energy imports are higher compared to established ethanol biorefineries and carbon efficiency is, also, poor due to low CO conversion. Indeed, the main disadvantage of the G-F process is the low ethanol yields due to low solubility and mass transfer limitations of the CO and H2 gaseous substrates [54]. Nevertheless, recent advances, in this direction, include two stage continuous fermentation [55] that can achieve yields of 300-330 L t-1 of lignocellulosic biomass. In this way, syngas fermentation has the potential to match or even exceed the biochemical ethanol rates, i.e. 305 L t-1 [46].
REFERENCES
1. He, J., Zhang, W.: Techno-economic evaluation of thermo-chemical biomass-to-ethanol. Applied Energy 88(4), 1224-1232 (2011). doi:http://doi.org/10.1016/j.apenergy.2010.10.022
2. Naik, S.N., Goud, V.V., Rout, P.K., Dalai, A.K.: Production of first and second generation biofuels: A comprehensive review. Renewable and Sustainable Energy Reviews 14(2), 578-597 (2010). doi:http://doi.org/10.1016/j.rser.2009.10.003
3. Antizar-Ladislao, B., Turrion-Gomez, J.L.: Second-generation biofuels and local bioenergy systems. Biofuels, Bioproducts and Biorefining 2(5), 455-469 (2008). doi:10.1002/bbb.97
4. Mohr, A., Raman, S.: Lessons from first generation biofuels and implications for the sustainability appraisal of second generation biofuels. Energy Policy 63, 114-122 (2013). doi:http://doi.org/10.1016/j.enpol.2013.08.033
5. Gupta, A., Verma, J.P.: Sustainable bio-ethanol production from agro-residues: A review. Renewable and Sustainable Energy Reviews 41, 550-567 (2015). doi:http://doi.org/10.1016/j.rser.2014.08.032
6. Saini, J.K., Saini, R., Tewari, L.: Lignocellulosic agriculture wastes as biomass feedstocks for second-generation bioethanol production: concepts and recent developments. 3 Biotech 5(4), 337-353 (2015). doi:10.1007/s13205-014-0246-5
7. Srivastava, N., Rawat, R., Singh Oberoi, H., Ramteke, P.W.: A Review on Fuel Ethanol Production From Lignocellulosic Biomass. International Journal of Green Energy 12(9), 949-960 (2015). doi:10.1080/15435075.2014.890104
8. Liguori, R., Ventorino, V., Pepe, O., Faraco, V.: Bioreactors for lignocellulose conversion into fermentable sugars for production of high added value products. Applied Microbiology and Biotechnology 100, 597-611 (2016). doi:10.1007/s00253-015-7125-9
9. Fang, K., Li, D., Lin, M., Xiang, M., Wei, W., Sun, Y.: A short review of heterogeneous catalytic process for mixed alcohols synthesis via syngas. Catalysis Today 147(2), 133-138 (2009). doi:http://doi.org/10.1016/j.cattod.2009.01.038
10.Acharya, B., Roy, P., Dutta, A.: Review of syngas fermentation processes for bioethanol. Biofuels 5(5), 551-564 (2014). doi:10.1080/17597269.2014.1002996
11.Bertsch, J., Müller, V.: Bioenergetic constraints for conversion of syngas to biofuels in acetogenic bacteria. Biotechnology for Biofuels 8(1), 210 (2015). doi:10.1186/s13068-015-0393-x
12.Piccolo, C., Bezzo, F.: A techno-economic comparison between two technologies for bioethanol production from lignocellulose. Biomass and Bioenergy 33(3), 478-491 (2009). doi:http://doi.org/10.1016/j.biombioe.2008.08.008
13.Wagner, H., Kaltschmitt, M.: Biochemical and thermochemical conversion of wood to ethanol—simulation and analysis of different processes. Biomass Conversion and Biorefinery 3(2), 87-102 (2013). doi:10.1007/s13399-012-0064-0
14.Roy, P., Dutta, A., Deen, B.: Greenhouse gas emissions and production cost of ethanol produced from biosyngas fermentation process. Bioresource Technology 192, 185-191 (2015). doi:http://doi.org/10.1016/j.biortech.2015.05.056
15.Pandey, A., Soccol, C.R., Nigam, P., Soccol, V.T., Vandenberghe, L.P.S., Mohan, R.: Biotechnological potential of agro-industrial residues. II: cassava bagasse. Bioresource Technology 74(1), 81-87 (2000). doi:http://doi.org/10.1016/S0960-8524(99)00143-1
16.Zanin, G.M., Santana, C.C., Bon, E.P., Giordano, R.C., de Moraes, F.F., Andrietta, S.R., de Carvalho Neto, C.C., Macedo, I.C., Fo, D.L., Ramos, L.P., Fontana, J.D.: Brazilian bioethanol program. Appl Biochem Biotechnol 84-86, 1147-1161 (2000).
17.Zabed, H., Sahu, J.N., Boyce, A.N., Faruq, G.: Fuel ethanol production from lignocellulosic biomass: An overview on feedstocks and technological approaches. Renewable and Sustainable Energy Reviews 66, 751-774 (2016). doi:http://doi.org/10.1016/j.rser.2016.08.038
18.Balat, M., Balat, H.: Recent trends in global production and utilization of bio-ethanol fuel. Applied Energy 86(11), 2273-2282 (2009). doi:http://doi.org/10.1016/j.apenergy.2009.03.015
19.Ververis, C., Georghiou, K., Danielidis, D., Hatzinikolaou, D.G., Santas, P., Santas, R., Corleti, V.: Cellulose, hemicelluloses, lignin and ash content of some organic materials and their suitability for use as paper pulp supplements. Bioresource Technology 98(2), 296-301 (2007). doi:http://doi.org/10.1016/j.biortech.2006.01.007
20.Gao, Y., Xu, J., Zhang, Y., Yu, Q., Yuan, Z., Liu, Y.: Effects of different pretreatment methods on chemical composition of sugarcane bagasse and enzymatic hydrolysis. Bioresource Technology 144, 396-400 (2013). doi:http://doi.org/10.1016/j.biortech.2013.06.036
21.Bhatia, L., Johri, S., Ahmad, R.: An economic and ecological perspective of ethanol production from renewable agro waste: a review. AMB Express 2(1), 65 (2012). doi:10.1186/2191-0855-2-65
22.Isikgor, F.H., Becer, C.R.: Lignocellulosic biomass: a sustainable platform for the production of bio-based chemicals and polymers. Polymer Chemistry 6(25), 4497-4559 (2015). doi:10.1039/C5PY00263J
23.Mosier, N., Wyman, C., Dale, B., Elander, R., Lee, Y.Y., Holtzapple, M., Ladisch, M.: Features of promising technologies for pretreatment of lignocellulosic biomass. Bioresource Technology 96(6), 673-686 (2005). doi:http://doi.org/10.1016/j.biortech.2004.06.025
24.Gassner, M., Maréchal, F.: Thermo-economic process model for thermochemical production of Synthetic Natural Gas (SNG) from lignocellulosic biomass. Biomass and Bioenergy 33(11), 1587-1604 (2009). doi:http://doi.org/10.1016/j.biombioe.2009.08.004
25.Michailos, S., Parker, D., Webb, C.: Comparative Analysis of Synthetic Natural Gas versus Hydrogen Production from Bagasse. Chemical Engineering & Technology 40(3), 546-554 (2017). doi:10.1002/ceat.201600424
26.Farzad, S., Mandegari, M.A., Görgens, J.F.: A critical review on biomass gasification, co-gasification, and their environmental assessments. Biofuel Research Journal 3(4), 483-495 (2016). doi:10.18331/brj2016.3.4.3
27.Fu, Q., kansha, Y., Song, C., Liu, Y., Ishizuka, M., Tsutsumi, A.: An Advanced Cryogenic Air Separation Process Based on Self-heat Recuperation for CO2 Separation. Energy Procedia 61, 1673-1676 (2014). doi:http://dx.doi.org/10.1016/j.egypro.2014.12.189
28.Perrin, N., Dubettier, R., Lockwood, F., Tranier, J.-P., Bourhy-Weber, C., Terrien, P.: Oxycombustion for coal power plants: Advantages, solutions and projects. Applied Thermal Engineering 74, 75-82 (2015). doi:http://doi.org/10.1016/j.applthermaleng.2014.03.074
29.Trippe, F., Fröhling, M., Schultmann, F., Stahl, R., Henrich, E.: Techno-economic assessment of gasification as a process step within biomass-to-
liquid (BtL) fuel and chemicals production. Fuel Processing Technology 92(11), 2169-2184 (2011). doi:http://doi.org/10.1016/j.fuproc.2011.06.026
30.Sudiro, M., Bertucco, A.: Production of synthetic gasoline and diesel fuel by alternative processes using natural gas and coal: Process simulation and optimization. Energy 34(12), 2206-2214 (2009). doi:http://doi.org/10.1016/j.energy.2008.12.009
31.Panopoulos, K.D., Fryda, L.E., Karl, J., Poulou, S., Kakaras, E.: High temperature solid oxide fuel cell integrated with novel allothermal biomass gasification: Part I: Modelling and feasibility study. Journal of Power Sources 159(1), 570-585 (2006). doi:https://doi.org/10.1016/j.jpowsour.2005.12.024
32.Erlich, C., Fransson, T.H.: Downdraft gasification of pellets made of wood, palm-oil residues respective bagasse: Experimental study. Applied Energy 88(3), 899-908 (2011). doi:https://doi.org/10.1016/j.apenergy.2010.08.028.
33.Sreejith, C.C., Muraleedharan, C., Arun, P.: Thermo-Chemical Analysis of Biomass Gasification by Gibbs Free Energy Minimization Model-Part: II (Optimization of Biomass Feed and Steam to Biomass Ratio). International Journal of Green Energy 10(6), 610-639 (2013). doi:10.1080/15435075.2012.709203
34.Drzyzga, O., Revelles, O., Durante-Rodríguez, G., Díaz, E., García, J.L., Prieto, A.: New challenges for syngas fermentation: towards production of biopolymers. Journal of Chemical Technology & Biotechnology 90(10), 1735-1751 (2015). doi:10.1002/jctb.4721
35.D. Arora, R. Basu, F. S. Breshears, L. D. Gaines, K. S. Hays, J. R. Phillips, C. V. Wikstrom, E. C. Clausen, J. L. Gaddy. United States. Department of Energy. Office of Energy Efficiency and Renewable Energy., United States. Department of Energy. Albuquerque Operations Office., United States. Department of Energy. Office of Scientific and Technical Information.: Production of ethanol from refinery waste gases. Final report, April 1994--July 1997. United States. Dept. of Energy. Office of Energy Efficiency and Renewable Energy; distributed by the Office of Scientific and Technical Information, U.S. Dept. of Energy,. http://www.osti.gov/servlets/purl/565441-UPx17r/webviewable/ (1997)
36.De Kam, M.J., Vance Morey, R., Tiffany, D.G.: Biomass Integrated Gasification Combined Cycle for heat and power at ethanol plants. Energy Conversion and Management 50(7), 1682-1690 (2009). doi:http://doi.org/10.1016/j.enconman.2009.03.031
37.Williams, T.C., Shaddix*, C.R., Schefer, R.W.: Effect of Syngas Composition and CO2-Diluted Oxygen on Performance of a Premixed Swirl-Stabilized Combustor. Combustion Science and Technology 180(1), 64-88 (2007). doi:10.1080/00102200701487061
38.Tassios, D.P.: Extractive and Azeotropic Distillation, vol. 115. Advances in Chemistry, vol. 115. AMERICAN CHEMICAL SOCIETY, (1974)
39.Park, S.R., Pandey, A.K., Tyagi, V.V., Tyagi, S.K.: Energy and exergy analysis of typical renewable energy systems. Renewable and Sustainable Energy Reviews 30, 105-123 (2014). doi:http://doi.org/10.1016/j.rser.2013.09.011
40.Michailos, S., Parker, D., Webb, C.: A multicriteria comparison of utilizing sugar cane bagasse for methanol to gasoline and butanol production.
Biomass and Bioenergy 95, 436-448 (2016). doi:http://doi.org/10.1016/j.biombioe.2016.06.019
41.Bridgwater, A. V.:. Step counting methods for preliminary capital cost estimating. Cost Engineering 23(5), 293-302 (1981).
42.Lucia, A.: Chemical Engineering Design Principles, Practice, and Economics of Plant and Process Design By G. Towler and R. Sinnott. AIChE Journal 54(11), 3034-3035 (2008). doi:10.1002/aic.11633
43.Sadhukhan, J., Ng, K.S., Hernandez, E.M.: Economic Analysis. In: Biorefineries and Chemical Processes. pp. 43-61. John Wiley & Sons, Ltd, (2014)
44.Hamelinck, C.N., Hooijdonk, G.v., Faaij, A.P.C.: Ethanol from lignocellulosic biomass: techno-economic performance in short-, middle- and long-term. Biomass and Bioenergy 28(4), 384-410 (2005). doi:http://doi.org/10.1016/j.biombioe.2004.09.002
45.Caputo, A.C., Palumbo, M., Pelagagge, P.M., Scacchia, F.: Economics of biomass energy utilization in combustion and gasification plants: effects of logistic variables. Biomass and Bioenergy 28(1), 35-51 (2005). doi:http://doi.org/10.1016/j.biombioe.2004.04.009
46.Peters, M., Timmerhaus, K., West, R.: Plant Design and Economics for Chemical Engineers. McGraw-Hill Education, (2003)
47.Gubicza, K., Nieves, I.U., Sagues, W.J., Barta, Z., Shanmugam, K.T., Ingram, L.O.: Techno-economic analysis of ethanol production from sugarcane bagasse using a Liquefaction plus Simultaneous Saccharification and co-Fermentation process. Bioresource Technology 208, 42-48 (2016). doi:http://doi.org/10.1016/j.biortech.2016.01.093
48.UNICA – Brazilian Sugarcane Industry Association. Report. http://www.unicadata.com.br (accessed 4/02/2015).
49.Humbird, D., National Renewable Energy Laboratory (U.S.), Harris Group Inc.: Process design and economics for biochemical conversion of lignocellulosic biomass to ethanol : dilute-acid pretreatment and enzymatic hydrolysis of corn stover. National Renewable Energy Laboratory,. http://purl.fdlp.gov/GPO/gpo8034
50.Jones, S., Meyer, P., Snowden-Swan, L., Padmaperum, A., Tan, E., Dutta, A., Jacobson, J., Cafferty, K., Pacific Northwest National Laboratory (U.S.)., United States. Department of Energy., United States. Department of Energy. Office of Scientific and Technical Information.: Process Design and Economics for the Conversion of Lignocellulosic Biomass to Hydrocarbon Fuels Fast Pyrolysis and Hydrotreating Bio-Oil Pathway. United States. Department of Energy. ; distributed by the Office of Scientific and Technical Information, U.S. Department of Energy,. http://www.osti.gov/servlets/purl/1115839/ (2013).
51.de Jong, S., Hoefnagels, R., Faaij, A., Slade, R., Mawhood, R., Junginger, M.: The feasibility of short-term production strategies for renewable jet fuels – a comprehensive techno-economic comparison. Biofuels, Bioproducts and Biorefining 9(6), 778-800 (2015). doi:10.1002/bbb.1613
52.Rubin, E.S., Azevedo, I.M.L., Jaramillo, P., Yeh, S.: A review of learning rates for electricity supply technologies. Energy Policy 86(Supplement C), 198-218 (2015). doi:https://doi.org/10.1016/j.enpol.2015.06.011
53.Albarelli, J.Q., Onorati, S., Caliandro, P., Peduzzi, E., Meireles, M.A.A., Marechal, F., Ensinas, A.V.: Multi-objective optimization of a sugarcane biorefinery for integrated ethanol and methanol production. Energy (2015). doi:https://doi.org/10.1016/j.energy.2015.06.104
54.Geraili, A., Sharma, P., Romagnoli, J.A.: A modeling framework for design of nonlinear renewable energy systems through integrated simulation modeling and metaheuristic optimization: Applications to biorefineries. Computers & Chemical Engineering 61, 102-117 (2014). doi:http://doi.org/10.1016/j.compchemeng.2013.10.005
55.Devarapalli, M., Atiyeh, H.K.: A review of conversion processes for bioethanol production with a focus on syngas fermentation. Biofuel Research Journal 2(3), 268-280 (2015). doi:10.18331/brj2015.2.3.5
56.Richter, H., Martin, M., Angenent, L.: A Two-Stage Continuous Fermentation System for Conversion of Syngas into Ethanol. Energies 6(8), 3987 (2013).