Embed Size (px)
Citation preview
Bangalore Electricity Supply Company Limited MYT for 3rd control period (FY14 – FY16)
CHAPTER – 6
LOAD FORECAST
The Commission has issued guidelines for preparation of Load Forecast,
Power Procurement Plan & Power Procurement procedure through
regulations:
KERC (Conditions of License for ESCOMs) Regulations, 2004 dated 28.0.2004
KERC (Load Forecast) Regulations, 2009 dated 02.04.2009
As per the Technical Conditions prescribed by the Commission under
Chapter III of the first regulation,
The Licensee shall on an annual basis:
(a) forecast the demand for electricity within the Area of Supply in each of the
next succeeding 10 years;
(b) prepare and submit such forecasts to the Commission in accordance with the
guidelines issued by the Commission from time to time; and
(c) Co-operate with the STU in the preparation of electricity demand forecasts
for the state of Karnataka.
The Commission vide above Load Forecast regulations has directed the
Distribution Licensees to follow the Forecast methodology adopted by CEA
from time to time, so as to have a consistent methodology. Further, it is also
stated that the forecast as per the latest available EPS (Electric Power Survey
of India), under fulfillment of CEA’s obligation under Section 73(a) of
Electricity Act, 2003 would be the reference point.
The latest available CEA forecast is 17th EPS. Some of the Objectives and
Methodology of Forecast of 17th EPS brought out by CEA during March 2007
of the document is listed below:
Chapter 6 – Load Forecast Page 73
Bangalore Electricity Supply Company Limited MYT for 3rd control period (FY14 – FY16)
Objectives: Page No: 27
Access to electricity: Available for all house-holds in next five years.
Availability of Power: Demand to be fully met by 2012. Energy and
peaking shortages to be overcome and adequate spinning reserve (at
least 5%) to be available.
Per capita availability of electricity to be increased to over 1000 units
by 2012.
In order to reduce the requirement for capacity addition, the
difference between electrical demand during peak periods and off
peak periods would have to be reduced. Suitable load management
technique should be adopted for this purpose.
High voltage distribution system is an effective method for reduction
of technical losses, prevention of thefts, improved voltage profile &
better consumer service. It should be promoted to reduce LT/HT ratio
keeping in view the techno- economic consideration.
Methodology: Page Nos: 31 -34
Partial end use methodology ie., time series and end use method is
made use of.
For domestic and commercial category estimate is made on the basis
of number of electricity consumers (Mid year) and their specific
electrical energy consumption.( Average electricity consumption per
consumer)
The forecast of consumption for Public lighting and Public water
works has been made on estimated connected electric load(kW) and
average electricity consumption per kW of connected load(kWh/kW).
IP sets: The average capacity of pumpsets has been worked out by
studying the growth trend of midyear figures for both connected
electric load and the number of pumps sets in the past years. Based on
Chapter 6 – Load Forecast Page 74
Bangalore Electricity Supply Company Limited MYT for 3rd control period (FY14 – FY16)
these trends, the growth in average capacity of pump set for future
determined.
Industrial Category: The electricity requirement for the industrial
sector has been estimated for LT industries, HT industries each with a
demand less than 1 MW and HT industries each with a demand of 1
MW & above.
In the light of the above, an attempt has been made to forecast the energy sales under four different scenarios. The 4 scenarios are based on:
1. Per capita consumption2. 18th draft EPS3. Circle wise energy sales4. Compounded Annual Growth Rate (CAGR)
Scenario 1 : Energy Forecast on per Capita Electricity Consumption .
Under the provisions of Section 3(1) of the Electricity Act, 2003, the Central
Government has prepared the National Electricity Policy for development of
the power sector based on optimal utilization of resources. The Policy has
been evolved after extensive consultations with the States, other stake
holders, the Central Electricity Authority and after considering the advice of
the Central Electricity Regulatory Commission.
The National Electricity Policy is one of the key instruments for providing
policy guidance to the Electricity Regulatory Commissions in discharge of
their functions and to the Central Electricity Authority for preparation of the
National Electricity Plan. The Policy aims at accelerated development of the
power sector, providing supply of electricity to all areas and protecting
interests of consumers and other stakeholders keeping in view availability of
energy resources, technology available to exploit these resources, economics
of generation using different resources, and energy security issues.
Objectives of the Policy:
Chapter 6 – Load Forecast Page 75
Bangalore Electricity Supply Company Limited MYT for 3rd control period (FY14 – FY16)
Access to Electricity Available for all households in next five years.
Supply of Reliable and Quality Power of specified standards in an
efficient
manner and at reasonable rates.
Financial Turnaround and Commercial Viability of Electricity Sector.
Protection of consumer’s interests.
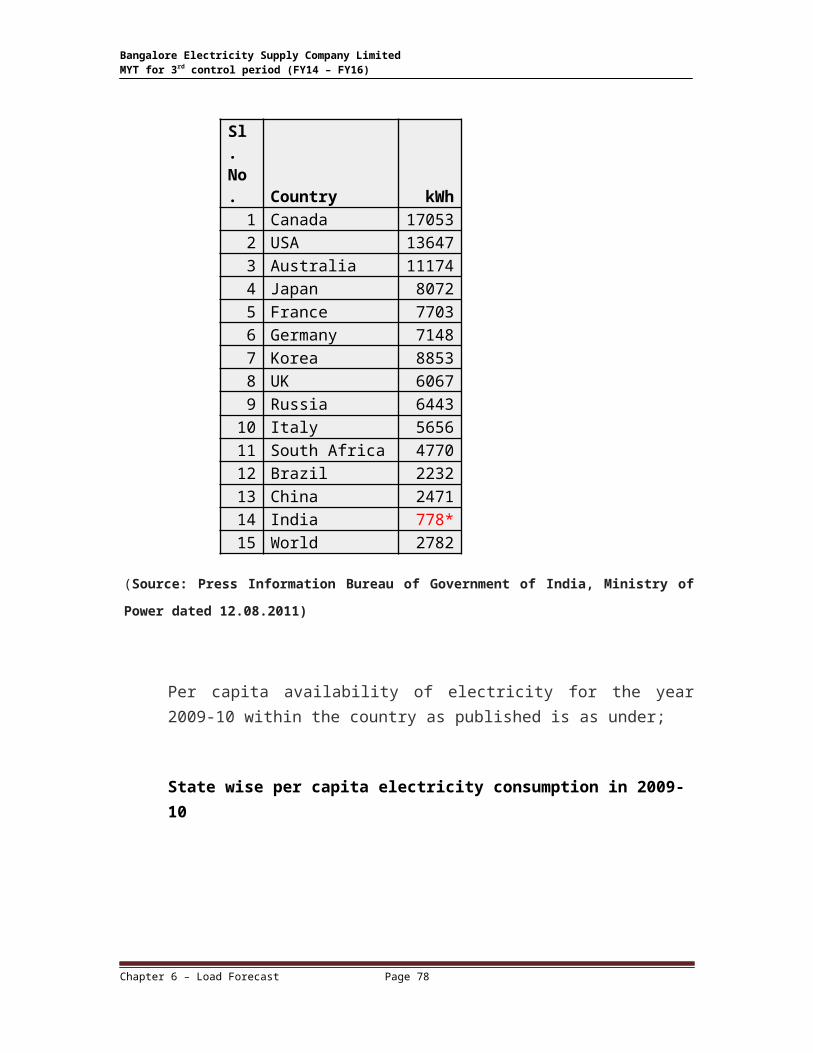
Per capita consumption of various countries is depicted in the table below.
Globally, in Asian continent China is placed one notch higher to that of India
on the list with per capita power consumption of 2,471 kWh. India’s per
capita power consumption is 778.71 kWh, three times lower than that of
China.
Per capita electricity consumption in 2010:
(Source: Press Information Bureau of Government of India, Ministry of Power dated
12.08.2011)
Chapter 6 – Load Forecast Page 76
Sl. No. Country kWh
1 Canada 170532 USA 136473 Australia 111744 Japan 80725 France 77036 Germany 71487 Korea 88538 UK 60679 Russia 6443
10 Italy 565611 South Africa 477012 Brazil 223213 China 247114 India 778*15 World 2782
Bangalore Electricity Supply Company Limited MYT for 3rd control period (FY14 – FY16)
Per capita availability of electricity for the year 2009-10 within the country as published is as under;
State wise per capita electricity consumption in 2009-10
(Source: Press Information Bureau of Government of India, Ministry of Power dated 12.08.2011)
From the above table, Delhi ranks the top with per capita consumption of 1,651.26
kWh, and Gujarat follows with 1,615.24 kWh. The State of Karnataka, in comparison,
stands at 12th place with 903.24 kWh. Adjacent States Andhra Pradesh with 966.99
Chapter 6 – Load Forecast Page 77
States / UTs kWhHaryana 1222.21Himachal Pradesh 1379.99Jammu & Kashmir 952.02Punjab 1526.86Rajasthan 736.2Uttar Pradesh 348.37Uttarakhand 1112.29Chandigarh 1340Delhi 1651.26Gujarat 1615.24Madhya Pradesh 602.07Chhattisgarh 1546.94Maharashtra 1028.22Goa 2263.63Daman & Diu 7118.23D & N Haveli 11863.64Andhra Pradesh 966.99Karnataka 903.24Kerala 525.25Tamil Nadu 1131.58Pondicherry 1743.37Lakshadweep 418.14Bihar 122.11Jharkhand 880.43Orissa 874.26West Bengal 550.16A & N Islands 493.98Sikkim 850Assam 204.8Manipur 240.22Meghalaya 675.19Nagaland 218.03Tripura 335.47Arunachal Pradesh 470Mizoram 376.99Total(All India) 778.71
Bangalore Electricity Supply Company Limited MYT for 3rd control period (FY14 – FY16)
kWh and Tamil Nadu with 1131.58 kWh are much better than that of
Karnataka.
Per capita GDP rising by about 8 percent per year during 2000–2010 and it is
expected to grow by 7.59 % during 2010–2020 based on 2011census report.
Contribution of electricity, water and gas to the GDP which is now at 2.25% is
expected to reach 4% and with this expansion, it is predicted that the existing
Indian per capita consumption would be doubled by 2020.
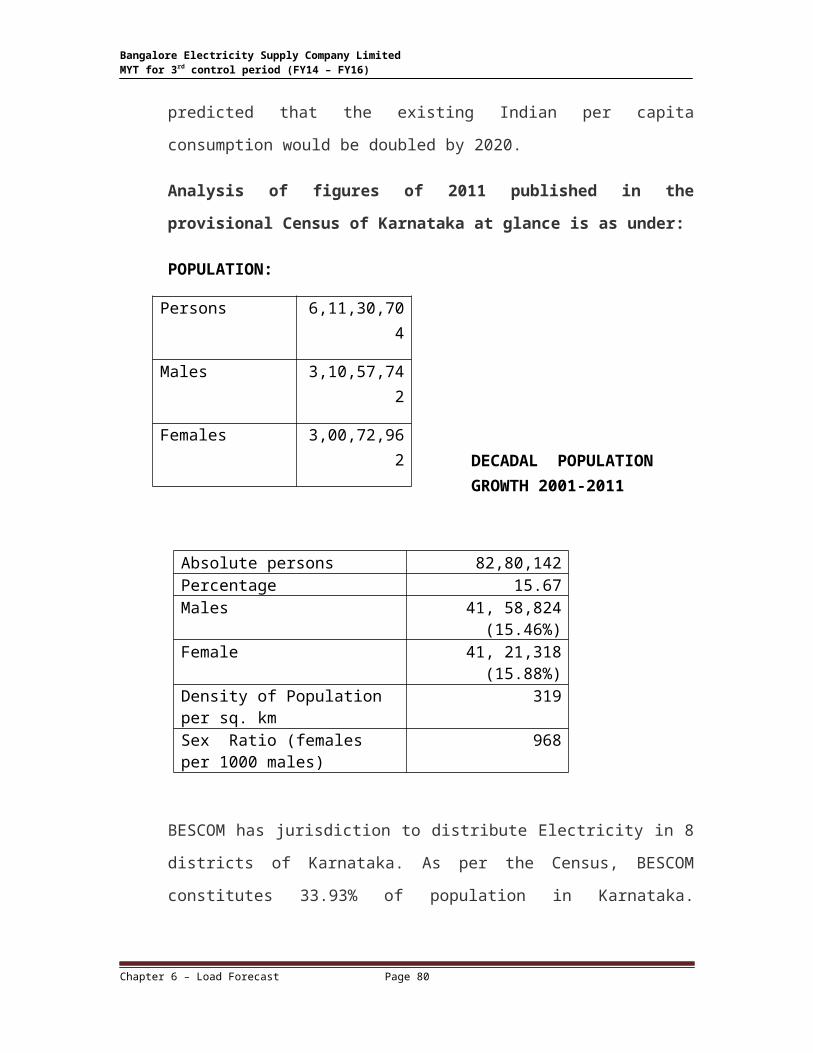
Analysis of figures of 2011 published in the provisional Census of
Karnataka at glance is as under:
POPULATION:
DECADAL POPULATION GROWTH 2001-2011
Absolute persons 82,80,142Percentage 15.67Males 41, 58,824 (15.46%)Female 41, 21,318 (15.88%)Density of Population per sq. km
319
Sex Ratio (females per 1000 males)
968
BESCOM has jurisdiction to distribute Electricity in 8 districts of Karnataka.
As per the Census, BESCOM constitutes 33.93% of population in Karnataka.
Percentage of population of Districts in BESCOM to that of total population of
the State is as under.
Chapter 6 – Load Forecast Page 78
Persons 6,11,30,704
Males 3,10,57,742
Females 3,00,72,962

Bangalore Electricity Supply Company Limited MYT for 3rd control period (FY14 – FY16)
Tumkur; 4.39
Bangalore; 15.69
Chitradurga; 2.72Davanagere; 3.18Kolar; 2.52
Chikkaballapura; 2.05Bangalore Rural; 1.61Ramanagara; 1.77000000000001
Sl.No District
Population as per 2011
census
Percentage decadal growth rate of
population
Projected growth rate of
population1999-2000
2000-2011 2012-2020
1 Bangalore-Urban 9588910 35.09 46.68 42.012 Bangalore-Rural 987257 18.6 16.02 14.423 Tumkur 2681449 12.1 3.74 3.374 Kolar 1540231 14.46 11.04 9.945 Chikkaballapur 1254377 14.33 9.17 8.256 Ramanagaram 1082739 7.84 5.06 4.557 Chitradurga 1660378 15.63 9.39 8.458 Davanagere 1946905 14.86 8.71 7.84 Total 2,07,42,246
Census data analysis states that the percentage decadal growth of population
in the inter-censual period 2001 - 2011 varied from a negative rate of -0.28
percent in Chikkamagaluru district to the highest of 46.68 % in Bangalore
district. The average decadal growth rate for the States stands at 15.67%.
There are seven districts including Bangalore, which have registered growth
rate above the Karnataka State average, whereas in the remaining 23
districts, the decadal population growth rate is below the State average of
15.67%. The change in percentage decadal growth rates between the
Chapter 6 – Load Forecast Page 79
Bangalore Electricity Supply Company Limited MYT for 3rd control period (FY14 – FY16)
decades 1991 - 2001 and 2001 - 2011 establishes the declining trend (except
Bangalore) in the decadal growth rates over the previous decade. It is stated
that the decadal growth rate for the Karnataka State has declined by 1.84 %.
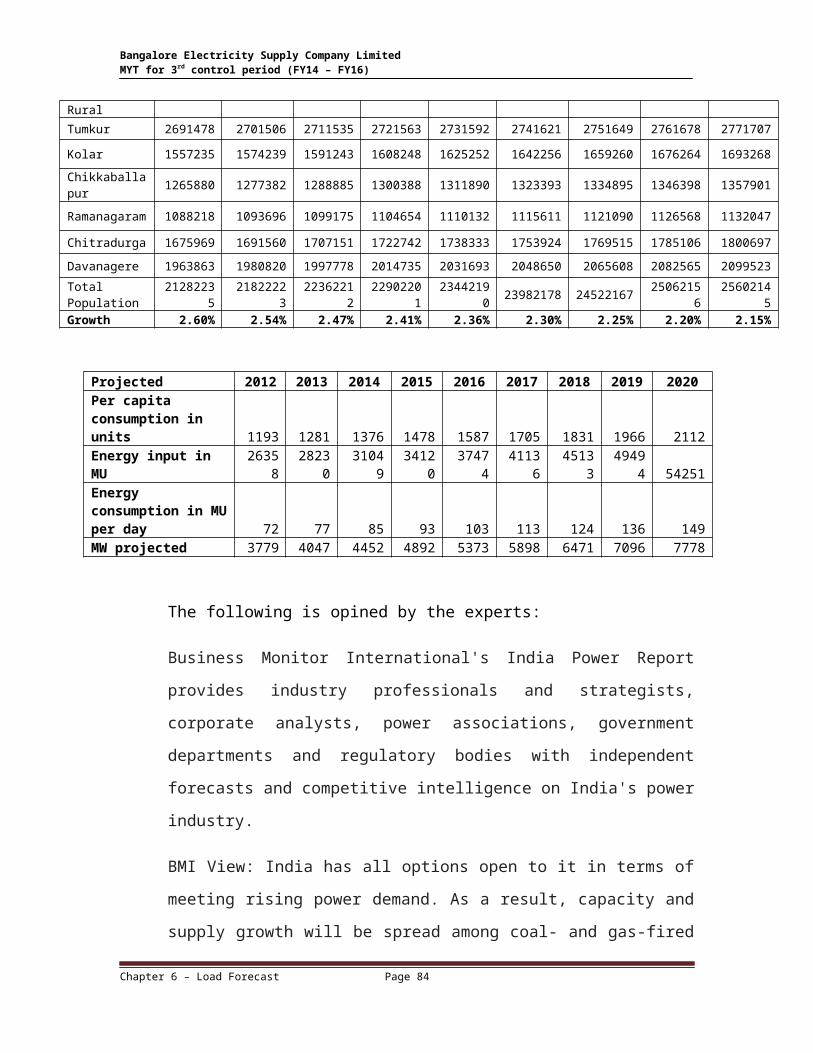
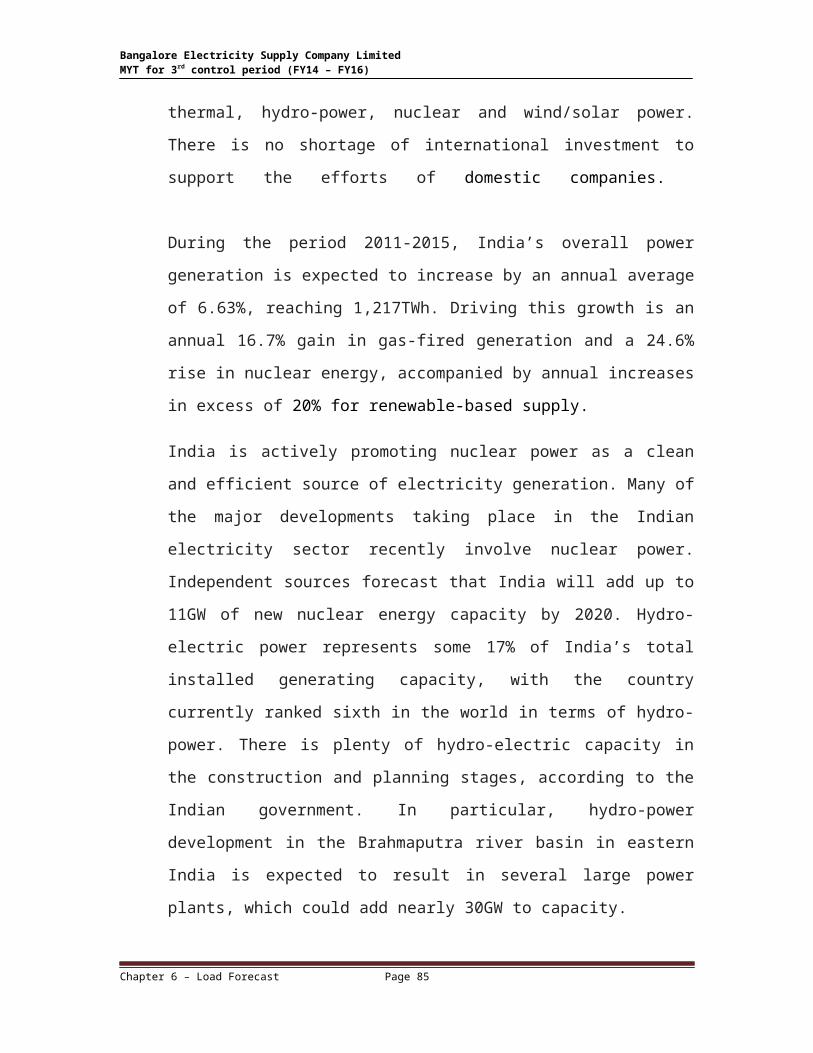
Considering the growth rate of the districts of BESCOM as depicted in the
above table, the population for the next period ie., from FY12 to FY 20 is
projected and the energy is projected by aiming per capita at 2112 units for
the year 2020 (Approximately double the per capita of 1055 units for 2010).
Detailed calculations are as under based on the following points.
Average growth rate of the population of each district is considered for
projecting the population.
Per capita consumption is considered as the energy requirement at the
generating points. It means the energy requirement is inclusive of
Transmission, Distribution and Commercial losses.
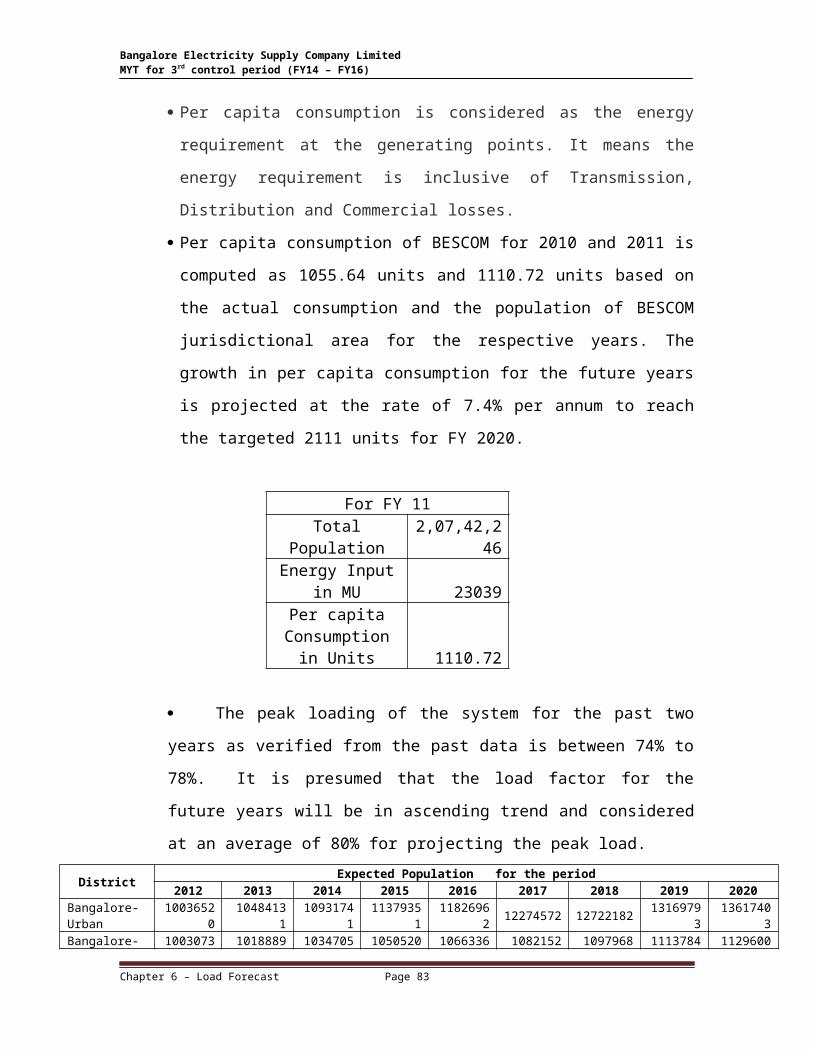
Per capita consumption of BESCOM for 2010 and 2011 is computed as
1055.64 units and 1110.72 units based on the actual consumption and the
population of BESCOM jurisdictional area for the respective years. The
growth in per capita consumption for the future years is projected at the
rate of 7.4% per annum to reach the targeted 2111 units for FY 2020.
For FY 11Total Population 2,07,42,246Energy Input in
MU 23039Per capita
Consumption in Units 1110.72
The peak loading of the system for the past two years as verified from
the past data is between 74% to 78%. It is presumed that the load factor for
the future years will be in ascending trend and considered at an average of
80% for projecting the peak load.
District Expected Population for the period
Chapter 6 – Load Forecast Page 80

Bangalore Electricity Supply Company Limited MYT for 3rd control period (FY14 – FY16)
2012 2013 2014 2015 2016 2017 2018 2019 2020Bangalore-Urban
10036520 10484131 10931741 11379351 11826962 12274572 12722182 13169793 13617403
Bangalore-Rural
1003073 1018889 1034705 1050520 1066336 1082152 1097968 1113784 1129600
Tumkur 2691478 2701506 2711535 2721563 2731592 2741621 2751649 2761678 2771707
Kolar 1557235 1574239 1591243 1608248 1625252 1642256 1659260 1676264 1693268
Chikkaballapur 1265880 1277382 1288885 1300388 1311890 1323393 1334895 1346398 1357901
Ramanagaram 1088218 1093696 1099175 1104654 1110132 1115611 1121090 1126568 1132047
Chitradurga 1675969 1691560 1707151 1722742 1738333 1753924 1769515 1785106 1800697
Davanagere 1963863 1980820 1997778 2014735 2031693 2048650 2065608 2082565 2099523
Total Population
21282235 21822223 22362212 22902201 23442190 23982178 24522167 25062156 25602145
Growth 2.60% 2.54% 2.47% 2.41% 2.36% 2.30% 2.25% 2.20% 2.15%
Projected 2012 2013 2014 2015 2016 2017 2018 2019 2020Per capita consumption in units 1193 1281 1376 1478 1587 1705 1831 1966 2112
Energy input in MU 26358
28230 31049
34120 37474
41136 45133
49494 54251
Energy consumption in MU per day 72 77 85 93 103 113 124 136 149MW projected 3779 4047 4452 4892 5373 5898 6471 7096 7778
The following is opined by the experts:
Business Monitor International's India Power Report provides industry
professionals and strategists, corporate analysts, power associations,
government departments and regulatory bodies with independent forecasts
and competitive intelligence on India's power industry.
BMI View: India has all options open to it in terms of meeting rising power
demand. As a result, capacity and supply growth will be spread among coal-
and gas-fired thermal, hydro-power, nuclear and wind/solar power. There is
no shortage of international investment to support the efforts of domestic
companies.
During the period 2011-2015, India’s overall power generation is expected to
increase by an annual average of 6.63%, reaching 1,217TWh. Driving this
Chapter 6 – Load Forecast Page 81
Bangalore Electricity Supply Company Limited MYT for 3rd control period (FY14 – FY16)
growth is an annual 16.7% gain in gas-fired generation and a 24.6% rise in
nuclear energy, accompanied by annual increases in excess of 20% for
renewable-based supply.
India is actively promoting nuclear power as a clean and efficient source of
electricity generation. Many of the major developments taking place in the
Indian electricity sector recently involve nuclear power. Independent
sources forecast that India will add up to 11GW of new nuclear energy
capacity by 2020. Hydro-electric power represents some 17% of India’s total
installed generating capacity, with the country currently ranked sixth in the
world in terms of hydro-power. There is plenty of hydro-electric capacity in
the construction and planning stages, according to the Indian government. In
particular, hydro-power development in the Brahmaputra river basin in
eastern India is expected to result in several large power plants, which could
add nearly 30GW to capacity.
India's theoretical solar potential is said to be about 5,000TWh per annum,
or some 600GW of potential installed capacity. This far exceeds forecast
demand, but solar generating costs are currently too high for rapid
expansion. However, solar is likely to form a key part of longer-term energy
policy. There is also wind power potential and some scope for biomass. India
hopes to double wind power generation capacity over the next decade. By
2022, the government is planning to have more than 20GW of wind
generating capacity.
Following an increase in 2011 real GDP of an estimated 7.56%, BMI forecasts
average annual growth of 7.65% between 2011 and 2020. The population is
expected to rise from the current level of 1.19bn to 1.32bn during the period
2011-2020, and net power consumption looks set to increase from 730TWh
to 945TWh by 2015, rising further to 1,321TWh by 2020. During the period
2011-2015, the average annual growth rate for electricity demand is forecast
Chapter 6 – Load Forecast Page 82
Bangalore Electricity Supply Company Limited MYT for 3rd control period (FY14 – FY16)
at 6.63%, but accelerating somewhat later in the decade to an average 6.94%
in 2016-2020.
According to the Indian government, massive energy investment is required
to achieve targeted economic expansion. To deliver sustained GDP growth of
8% until 2031-2032, primary energy supply needs to grow to up to four
times current consumption, installed electricity generating capacity needs to
increase six or sevenfold and the current coal requirement needs to triple.
(Source: India Power report Q4 2011 Business Monitor International,
dated October 2011)
Scenario 2: Energy Projection based on Energy Power Survey (EPS)
Report
An attempt has been made to project the sales based on the draft 18 th EPS
report duly considering the actual share of BESCOM for the figures indicated
in the 17th EPS report.
The 18th EPS report from CEA is awaited. A draft of the said report is
mentioned in the Shunglu Committee report.
An attempt has been made to compare the figures of 17 th EPS report with
actual figures of Karnataka State and BESCOM’s contribution for the period
from FY 04 to FY 12.
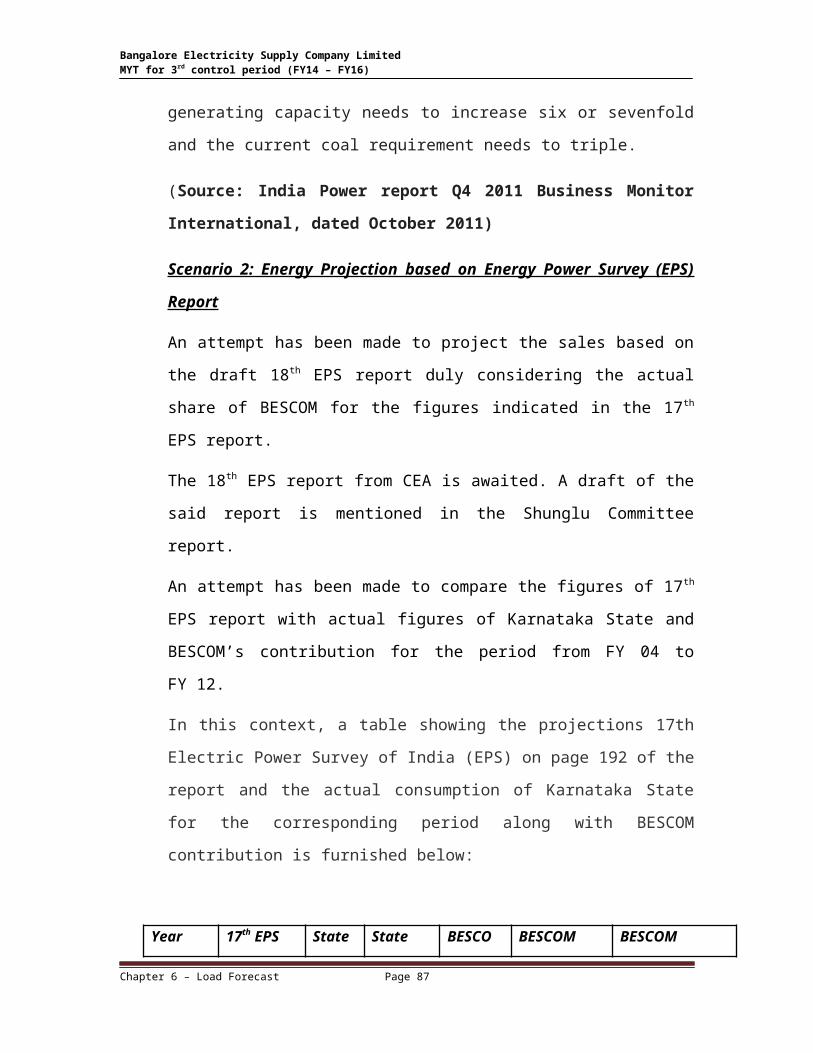
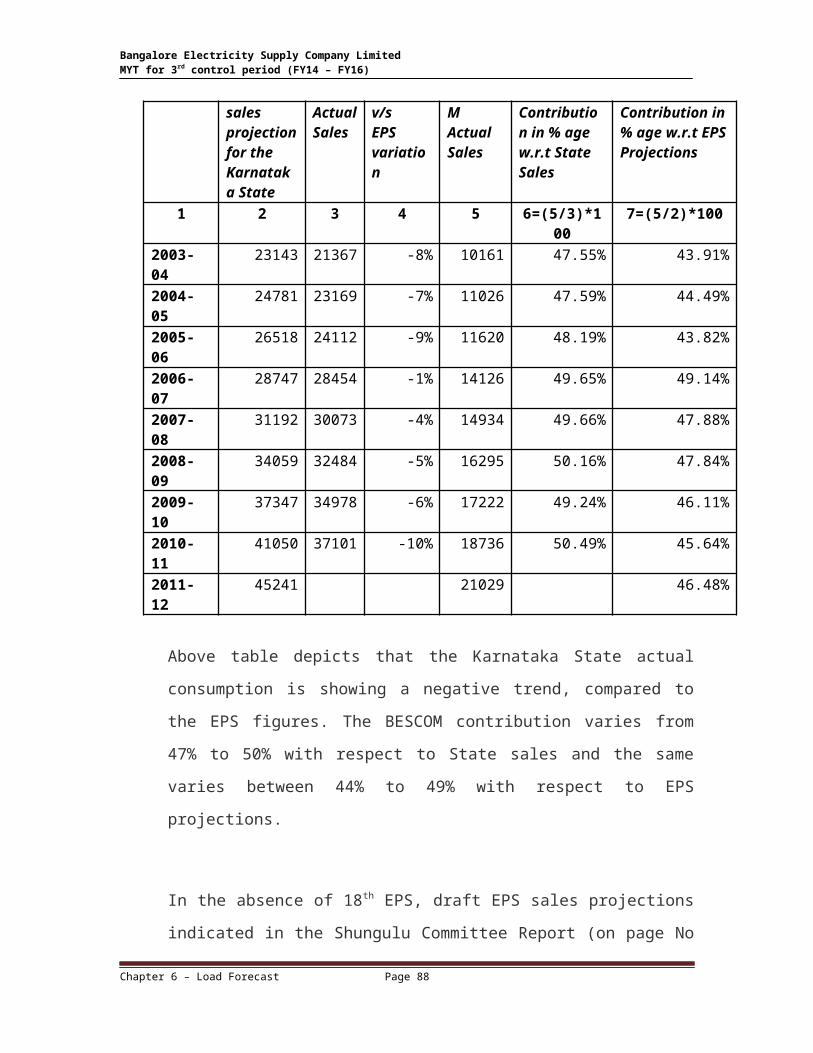
In this context, a table showing the projections 17th Electric Power Survey of
India (EPS) on page 192 of the report and the actual consumption of
Karnataka State for the corresponding period along with BESCOM
contribution is furnished below:
Year 17th EPS sales projection for the Karnataka
State Actual Sales
State v/s EPS variation
BESCOM Actual Sales
BESCOM Contribution in % age w.r.t State Sales
BESCOM Contribution in % age w.r.t EPS Projections
Chapter 6 – Load Forecast Page 83
Bangalore Electricity Supply Company Limited MYT for 3rd control period (FY14 – FY16)
State1 2 3 4 5 6=(5/3)*100 7=(5/2)*100
2003-04 23143 21367 -8% 10161 47.55% 43.91%
2004-05 24781 23169 -7% 11026 47.59% 44.49%
2005-06 26518 24112 -9% 11620 48.19% 43.82%
2006-07 28747 28454 -1% 14126 49.65% 49.14%
2007-08 31192 30073 -4% 14934 49.66% 47.88%
2008-09 34059 32484 -5% 16295 50.16% 47.84%
2009-10 37347 34978 -6% 17222 49.24% 46.11%
2010-11 41050 37101 -10% 18736 50.49% 45.64%
2011-12 45241 21029 46.48%
Above table depicts that the Karnataka State actual consumption is showing a
negative trend, compared to the EPS figures. The BESCOM contribution
varies from 47% to 50% with respect to State sales and the same varies
between 44% to 49% with respect to EPS projections.
In the absence of 18th EPS, draft EPS sales projections indicated in the
Shungulu Committee Report (on page No 35) to estimate the financial
viability of Utilities for the 12th plan is considered. The figures pertaining to
Karnataka in the draft report is considered.
Further, actual contribution of BESCOM with respect to the figures as
depicted in the 17th EPS is reckoned. (Reference table above) BESCOM energy
sales works out an average of 46.146% when compared to 17 th EPS figures
for the period from FY 03 to FY 12. Also in the 18 th draft EPS report on page
38 it is indicated that a growth rate of 8.1% is reckoned for the period from
FY 18 to FY 22. These two assumptions are considered in computing energy
sales projections for the period from FY 13 to FY 20. The same is depicted in
the table furnished below:
In MU
Chapter 6 – Load Forecast Page 84
Bangalore Electricity Supply Company Limited MYT for 3rd control period (FY14 – FY16)
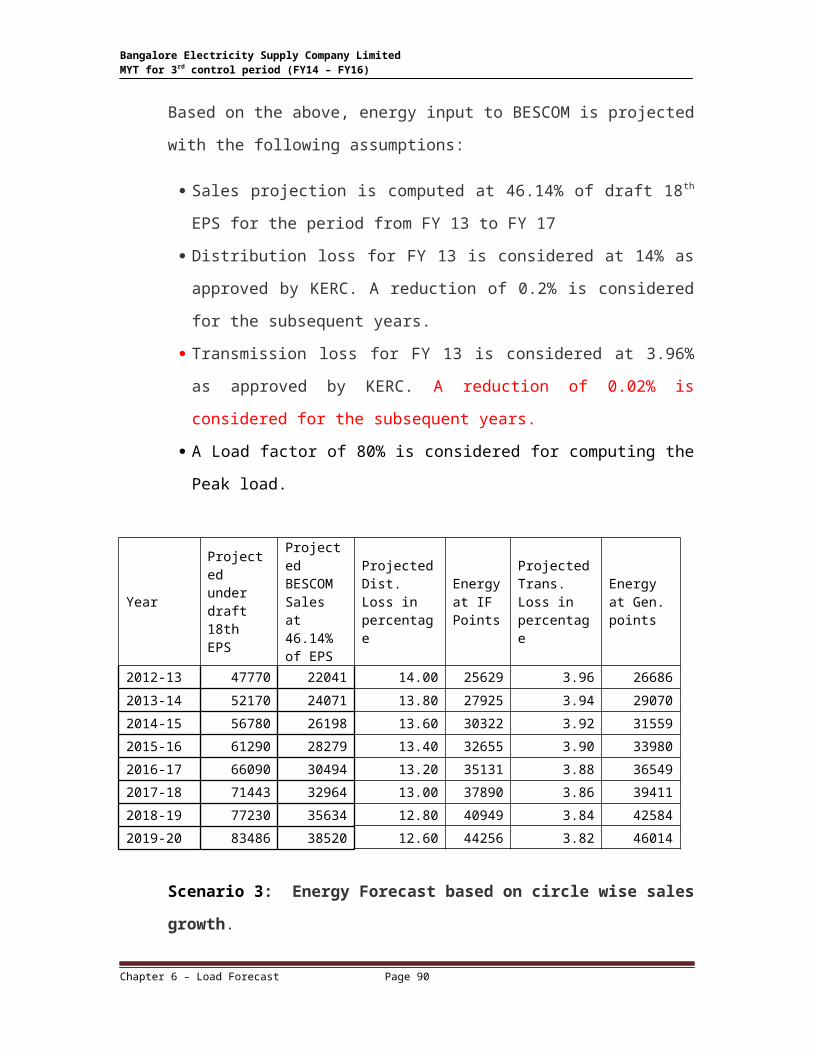
Based on the above, energy input to BESCOM is projected with the following
assumptions:
Sales projection is computed at 46.14% of draft 18th EPS for the period
from FY 13 to FY 17
Distribution loss for FY 13 is considered at 14% as approved by KERC. A
reduction of 0.2% is considered for the subsequent years.
Transmission loss for FY 13 is considered at 3.96% as approved by KERC.
A reduction of 0.02% is considered for the subsequent years.
A Load factor of 80% is considered for computing the Peak load.
Year
Projected under draft 18th EPS
Projected BESCOM Sales at 46.14% of EPS
Projected Dist. Loss in percentage
Energy at IF Points
Projected Trans. Loss in percentage
Energy at Gen. points
2012-13 47770 22041 14.00 25629 3.96 26686
2013-14 52170 24071 13.80 27925 3.94 29070
2014-15 56780 26198 13.60 30322 3.92 31559
2015-16 61290 28279 13.40 32655 3.90 33980
2016-17 66090 30494 13.20 35131 3.88 36549
2017-18 71443 32964 13.00 37890 3.86 39411
2018-19 77230 35634 12.80 40949 3.84 42584
2019-20 83486 38520 12.60 44256 3.82 46014
Chapter 6 – Load Forecast Page 85
Year Projected under draft 18th EPS
Projected BESCOM Sales at 46.14% of EPS
2012-13 47770 22041
2013-14 52170 24071
2014-15 56780 26198
2015-16 61290 28279
2016-17 66090 30494
2017-18 71443 32964
2018-19 77230 35634
2019-20 83486 38520
Bangalore Electricity Supply Company Limited MYT for 3rd control period (FY14 – FY16)
Scenario 3: Energy Forecast based on circle wise sales growth.
BESCOM has 3 Zones, one exclusively catering to Metropolitan Bangalore
city and other two are rural zones. There are 2 circles under Bangalore zone
and 2 circles each under rural zones, the details are tabulated as below:
Zone Circles
Bangalore Metro Politian Zone (BMAZ) Bangalore –NorthBangalore- South
Bangalore Rural Area Zone (BRAZ) Bangalore-RuralKolar
Chitradurga Area Zone (CTZ) TumkurDavanagere.
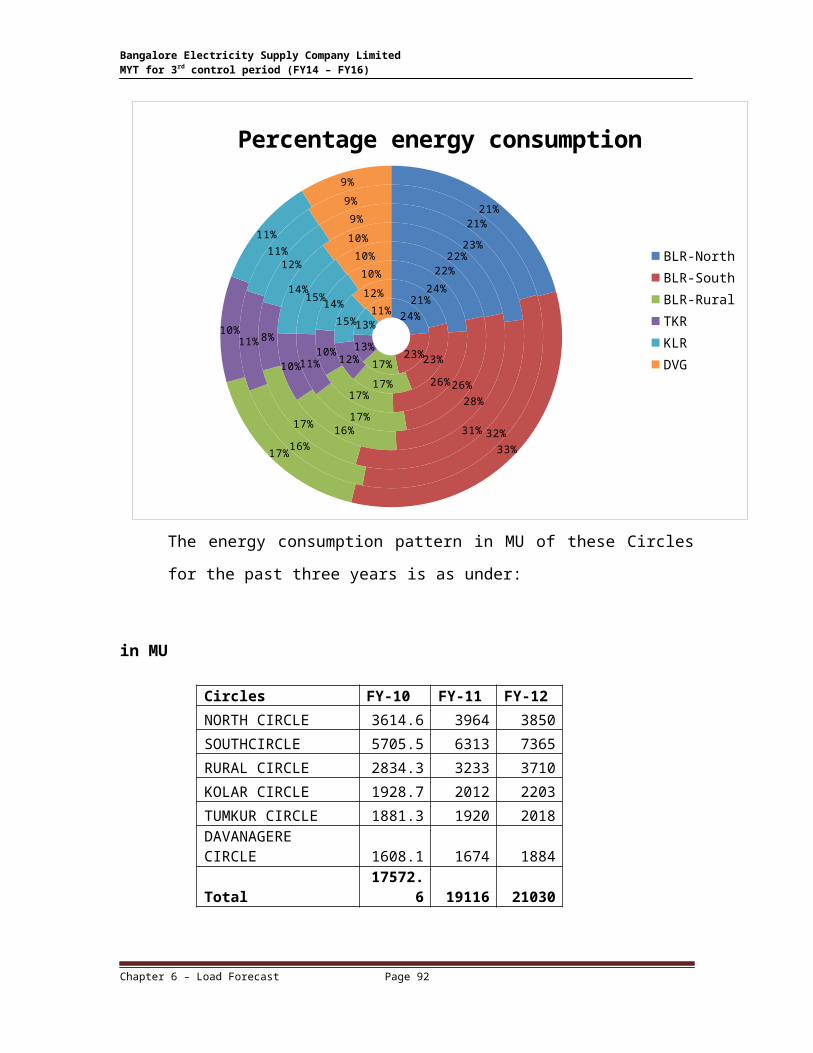
The diagram illustrates the circle wise energy consumption over the period
from FY 01 to FY 11. It is seen that south circle has registered a maximum
growth from 23% to 33% over the years. North circle has shown a slight
decline fron 23% to 21%. The Rural circle has maintained a constant growth
of 17%. The rural circles have shown a decling trend. Eventhough the
percentage appears to be small, the contribution in respect of MU is quite
significant as shown in the graph below.
Chapter 6 – Load Forecast Page 86
Bangalore Electricity Supply Company Limited MYT for 3rd control period (FY14 – FY16)
24%
23%17%
13%
13%11%
21%
23%
17%
12%
15%
12% 24%
26%17%
10%
14%
10% 22%
26%
17%
11%
15%
10% 22%
28%
16%
10%
14%
10% 23%
31%17%
8%
12%
9% 21%
32%16%
11%
11%
9%21%
33%17%
10%
11%
9%
Percentage energy consumption
BLR-NorthBLR-SouthBLR-RuralTKRKLRDVG
The energy consumption pattern in MU of these Circles for the past three
years is as under:
in MU
Circles FY-10 FY-11 FY-12
NORTH CIRCLE 3614.6 3964 3850
SOUTHCIRCLE 5705.5 6313 7365
RURAL CIRCLE 2834.3 3233 3710
KOLAR CIRCLE 1928.7 2012 2203
TUMKUR CIRCLE 1881.3 1920 2018
DAVANAGERE CIRCLE 1608.1 1674 1884Total 17572.6 19116 21030
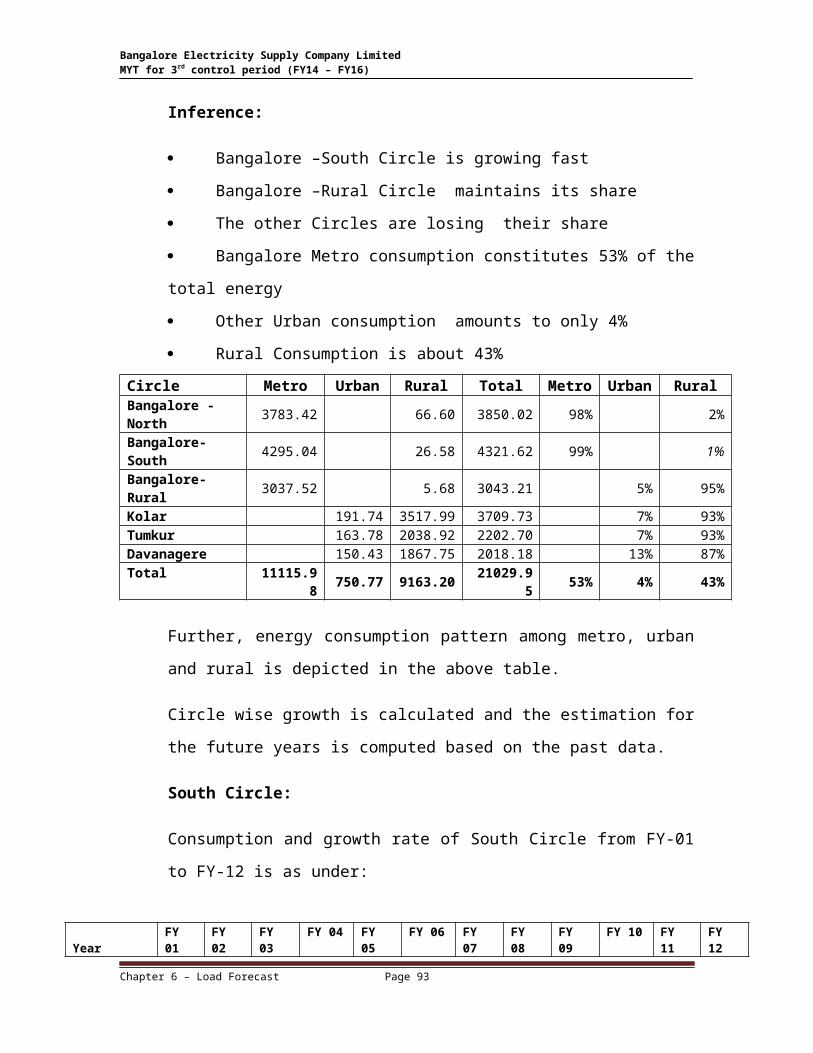
Inference:
Bangalore –South Circle is growing fast
Bangalore –Rural Circle maintains its share
Chapter 6 – Load Forecast Page 87
Bangalore Electricity Supply Company Limited MYT for 3rd control period (FY14 – FY16)
The other Circles are losing their share
Bangalore Metro consumption constitutes 53% of the total energy
Other Urban consumption amounts to only 4%
Rural Consumption is about 43%
Circle Metro Urban Rural Total Metro Urban RuralBangalore -North 3783.42 66.60 3850.02 98% 2%Bangalore-South 4295.04 26.58 4321.62 99% 1%Bangalore-Rural 3037.52 5.68 3043.21 5% 95%Kolar 191.74 3517.99 3709.73 7% 93%Tumkur 163.78 2038.92 2202.70 7% 93%Davanagere 150.43 1867.75 2018.18 13% 87%Total 11115.98 750.77 9163.20 21029.95 53% 4% 43%
Further, energy consumption pattern among metro, urban and rural is
depicted in the above table.
Circle wise growth is calculated and the estimation for the future years is
computed based on the past data.
South Circle:
Consumption and growth rate of South Circle from FY-01 to FY-12 is as
under:
Year FY 01 FY 02 FY 03 FY 04 FY 05 FY 06 FY 07 FY 08 FY 09 FY 10 FY 11 FY 12
Consumption in MU 1739 1974 2222 2617 3037 3639 4248 4974 5403 5705 6312 7950 Growth rate in % 13.47 12.55 17.79 16.08 19.80 16.74 17.08 8.63 5.60 10.63 25.95
Yearly growth rate of this Circle is not uniform. Economic slowdown during
FY-09 and FY-10 may be the cause for the dip in growth rate for FY-09 and
FY-10.
CAGR growth rate for the period from FY-2001 to FY-2012.
Chapter 6 – Load Forecast Page 88

Bangalore Electricity Supply Company Limited MYT for 3rd control period (FY14 – FY16)
LT231%
LT39%
LT-5
HT-13%
HT2a19%
HT2b30%
ht41%
LT2LT3LT-5HT-1HT2aHT2bht4
Years
11 years from
2001to 2012
10 years from
2002to 2012
9 years from
2003to 2012
8 years from
2004to 2012
7 years from
2005to 2012
6 years from
2006to 2012
5 years from
2007to 2012
4years from
2008to 2012
3years from
2009to 2012
2years from
2010to 2012
Yearly growth
rate from 2011 to
2012Growth rate in %
13 14 14 13 13 12 11 10 10 12 26
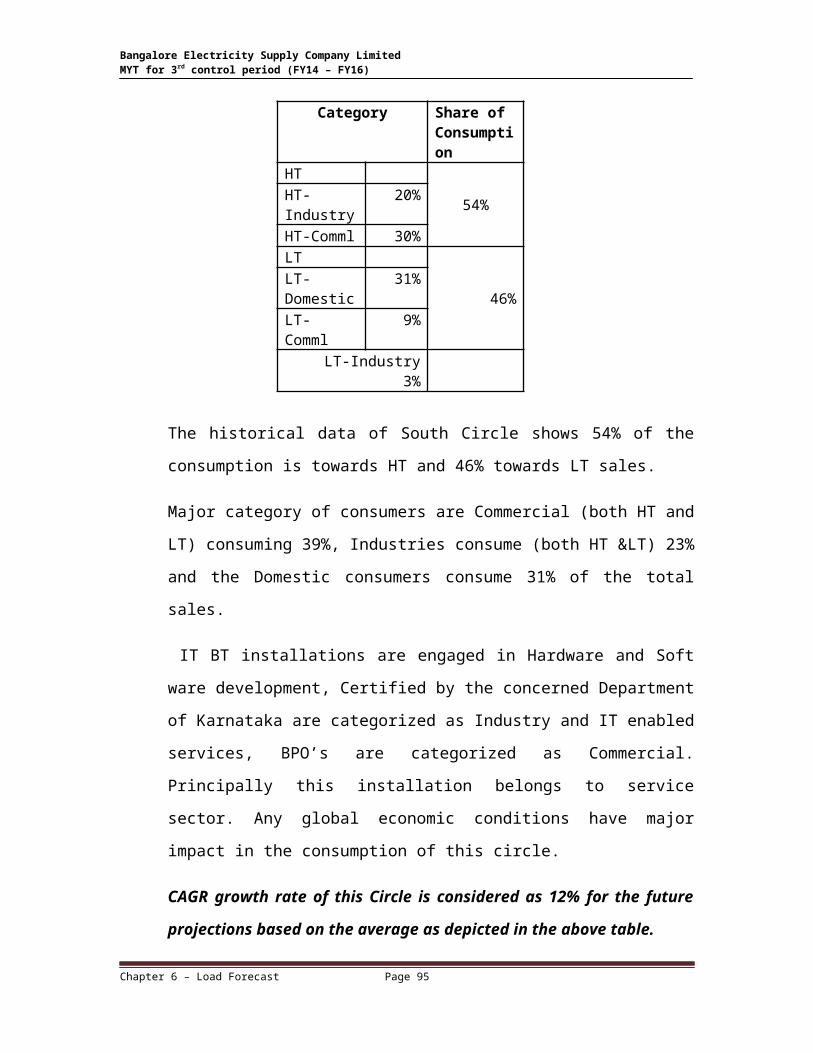
Category Share of Consumption
HT 54%HT-Industry 20%
HT-Comml 30%LT
46%LT-Domestic 31%LT- Comml 9% LT-Industry 3%
The historical data of South Circle shows 54% of the consumption is towards
HT and 46% towards LT sales.
Major category of consumers are Commercial (both HT and LT) consuming
39%, Industries consume (both HT <) 23% and the Domestic consumers
consume 31% of the total sales.
Chapter 6 – Load Forecast Page 89
Bangalore Electricity Supply Company Limited MYT for 3rd control period (FY14 – FY16)
IT BT installations are engaged in Hardware and Soft ware development,
Certified by the concerned Department of Karnataka are categorized as
Industry and IT enabled services, BPO’s are categorized as Commercial.
Principally this installation belongs to service sector. Any global economic
conditions have major impact in the consumption of this circle.
CAGR growth rate of this Circle is considered as 12% for the future
projections based on the average as depicted in the above table.
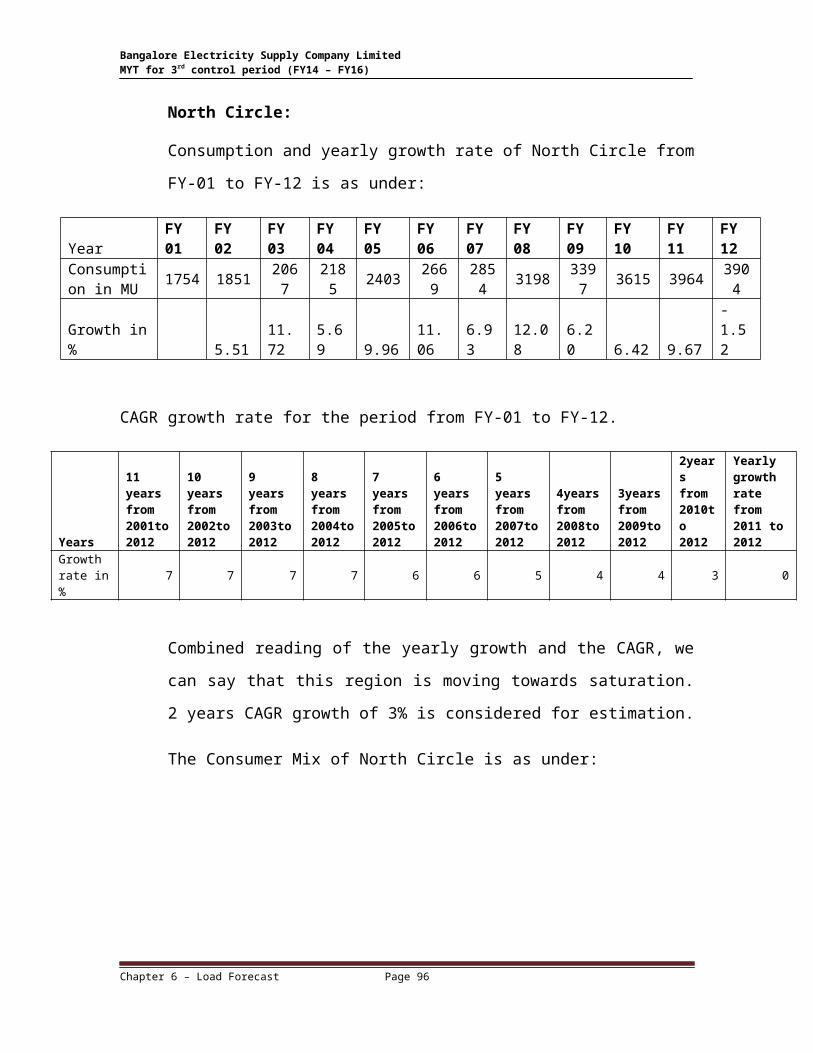
North Circle:
Consumption and yearly growth rate of North Circle from FY-01 to FY-12 is
as under:
Year FY 01
FY 02 FY 03
FY 04
FY 05 FY 06
FY 07
FY 08 FY 09
FY 10 FY 11 FY 12
Consumption in MU
1754 1851 2067 2185 2403 2669 2854 3198 3397 3615 3964 3904
Growth in % 5.5111.72 5.69 9.96
11.06 6.93 12.08 6.20 6.42 9.67 -1.52
CAGR growth rate for the period from FY-01 to FY-12.
Years
11 years from 2001to 2012
10 years from 2002to 2012
9 years from 2003to 2012
8 years from 2004to 2012
7 years from 2005to 2012
6 years from 2006to 2012
5 years from 2007to 2012
4years from 2008to 2012
3years from 2009to 2012
2years from 2010to 2012
Yearly growth rate from 2011 to 2012
Growth rate in %
7 7 7 7 6 6 5 4 4 3 0
Combined reading of the yearly growth and the CAGR, we can say that this
region is moving towards saturation. 2 years CAGR growth of 3% is
considered for estimation.
The Consumer Mix of North Circle is as under:
Chapter 6 – Load Forecast Page 90

Bangalore Electricity Supply Company Limited MYT for 3rd control period (FY14 – FY16)
36%
10%
1%
13%
3%2%1%
25%
8%
1%
LT2
LT3
LT-5
HT-1
HT2a
HT2b
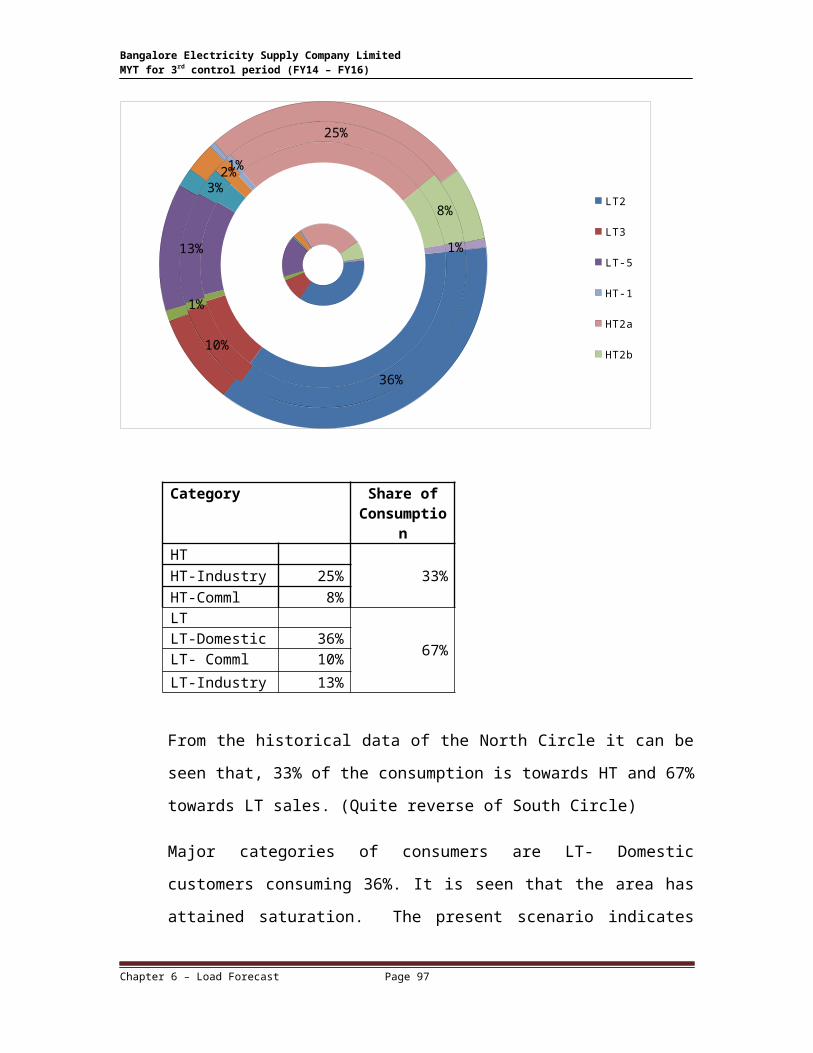
Category Share of Consumption
HT
33%HT-Industry 25%
HT-Comml 8%LT
67%LT-Domestic 36%LT- Comml 10%
LT-Industry 13%
From the historical data of the North Circle it can be seen that, 33% of the
consumption is towards HT and 67% towards LT sales. (Quite reverse of
South Circle)
Major categories of consumers are LT- Domestic customers consuming 36%.
It is seen that the area has attained saturation. The present scenario
indicates that the Industrial consumption is likely to be reduced or stagnated.
However, commercial consumption (both HT <) may increase due to
renovation/vertical growth.
Chapter 6 – Load Forecast Page 91
Bangalore Electricity Supply Company Limited MYT for 3rd control period (FY14 – FY16)
CAGR growth rate of this Circle is considered as 3% for the future
projections based on the 2 years CAGR growth as depicted in the above
table.
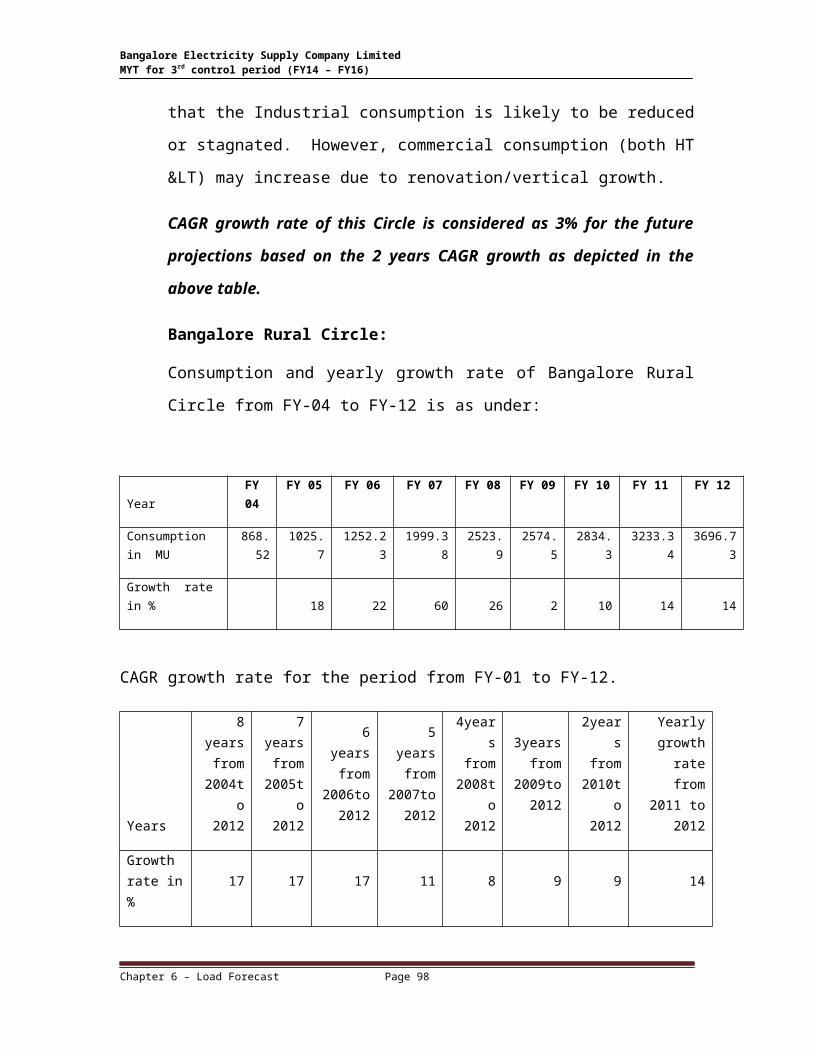
Bangalore Rural Circle:
Consumption and yearly growth rate of Bangalore Rural Circle from FY-04 to
FY-12 is as under:
Year FY 04 FY 05 FY 06 FY 07 FY 08 FY 09 FY 10 FY 11 FY 12
Consumption in MU
868.52 1025.7 1252.23 1999.38 2523.9 2574.5 2834.3 3233.34 3696.73
Growth rate in % 18 22 60 26 2 10 14 14
CAGR growth rate for the period from FY-01 to FY-12.
Years
8 years from
2004to 2012
7 years from
2005to 2012
6 years from
2006to 2012
5 years from
2007to 2012
4years from
2008to 2012
3years from
2009to 2012
2years from
2010to 2012
Yearly growth rate
from 2011 to 2012
Growth rate in %
17 17 17 11 8 9 9 14
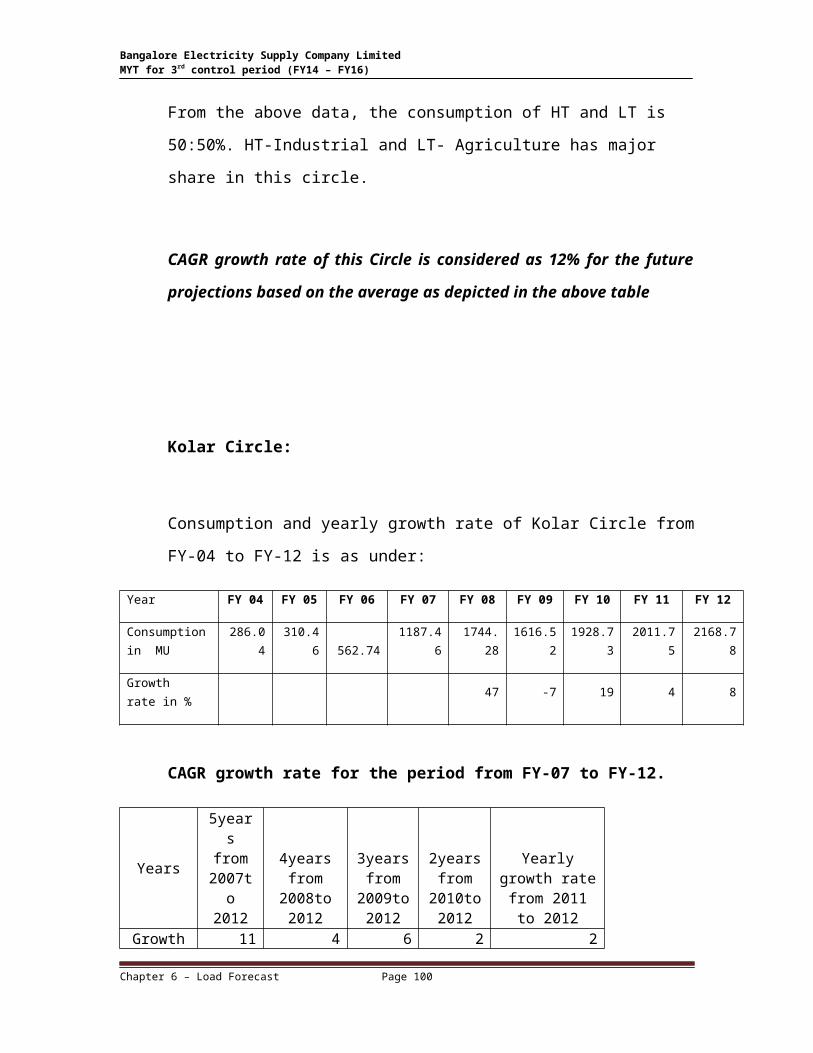
Combined reading of the Yearly growth and the CAGR, this Circle has potential for
growth. As the industrial belt is expanding vis-a vis, Bangalore International Airport,
Special Economic Zone projects etc, the CAGR growth rate of 12.00% is considered
for this circle.
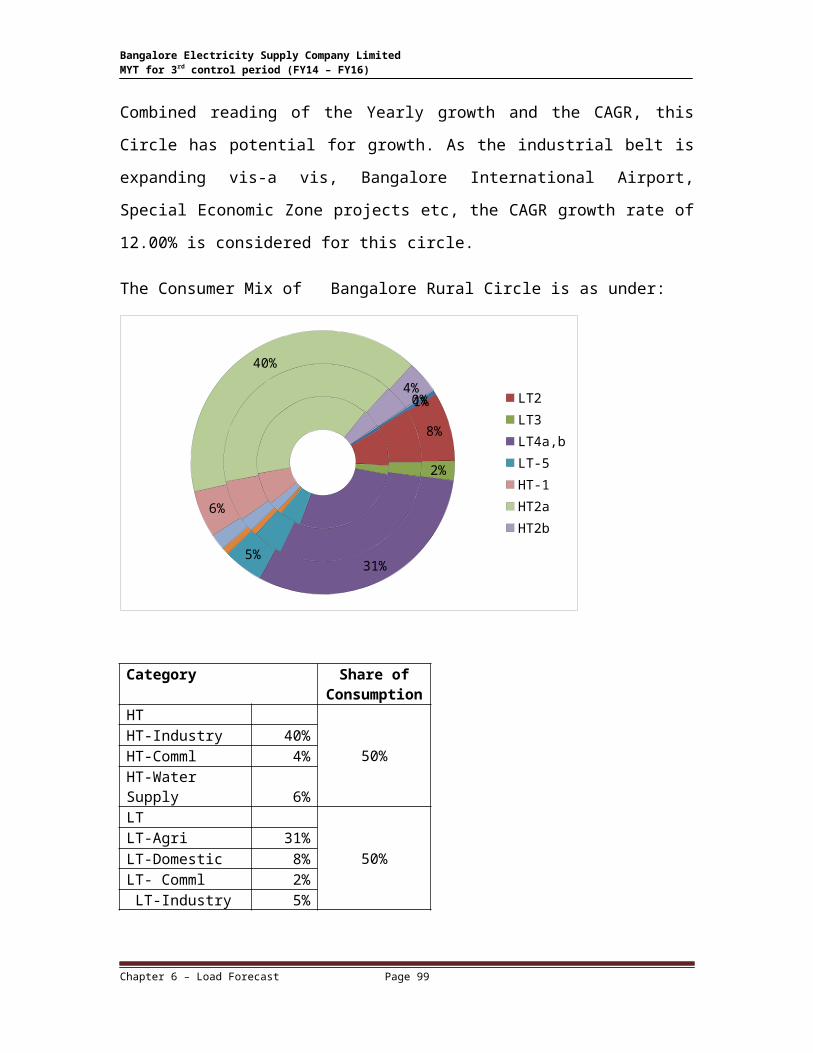
The Consumer Mix of Bangalore Rural Circle is as under:
Chapter 6 – Load Forecast Page 92
Bangalore Electricity Supply Company Limited MYT for 3rd control period (FY14 – FY16)
1%
8%
2%
31%5%
6%
40%
4%0%
LT2LT3LT4a,bLT-5HT-1HT2aHT2b
Category Share of Consumption
HT
50%HT-Industry 40%HT-Comml 4%HT-Water Supply 6%LT
50%LT-Agri 31%LT-Domestic 8%LT- Comml 2% LT-Industry 5%
From the above data, the consumption of HT and LT is 50:50%. HT-Industrial
and LT- Agriculture has major share in this circle.
CAGR growth rate of this Circle is considered as 12% for the future
projections based on the average as depicted in the above table
Chapter 6 – Load Forecast Page 93

Bangalore Electricity Supply Company Limited MYT for 3rd control period (FY14 – FY16)
Kolar Circle:
Consumption and yearly growth rate of Kolar Circle from FY-04 to FY-12 is as
under:
Year FY 04 FY 05 FY 06 FY 07 FY 08 FY 09 FY 10 FY 11 FY 12
Consumption in MU 286.04 310.46 562.74 1187.46 1744.28 1616.52 1928.73 2011.75 2168.78
Growth rate in %
47 -7 19 4 8
CAGR growth rate for the period from FY-07 to FY-12.
Years
5years from
2007to 2012
4years from
2008to 2012
3years from
2009to 2012
2years from
2010to 2012
Yearly growth rate from 2011
to 2012Growth
rate in % 11 4 6 2 2
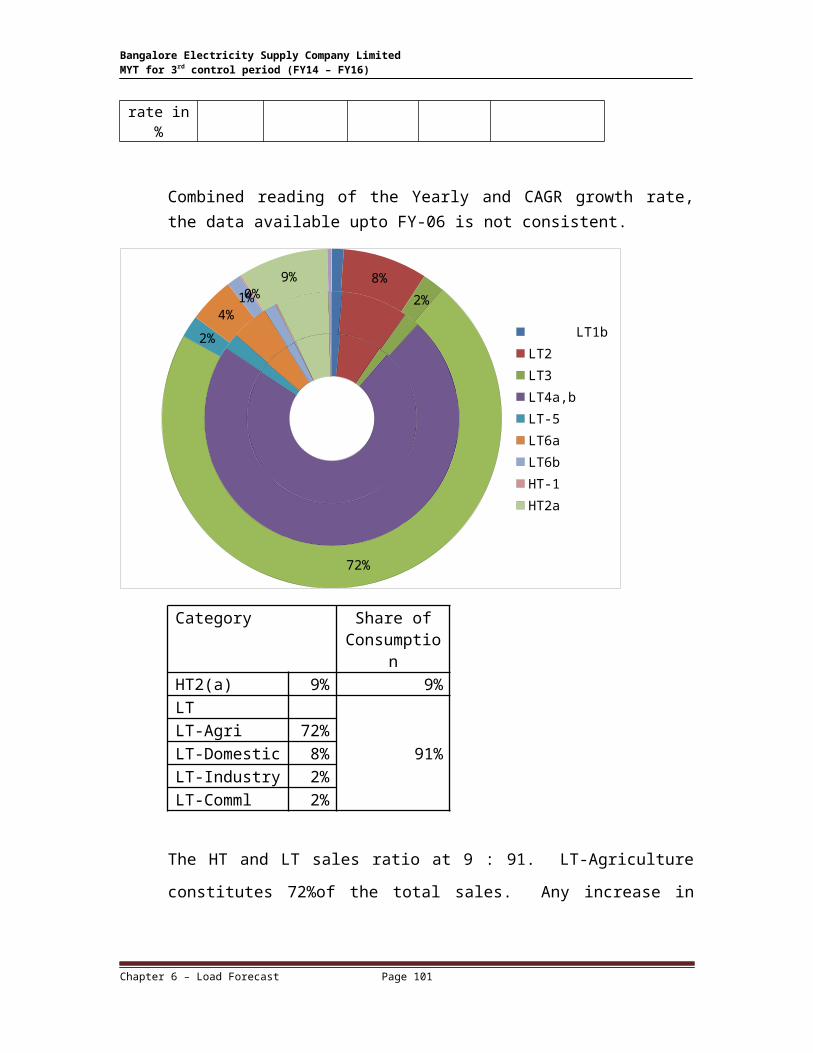
Combined reading of the Yearly and CAGR growth rate, the data available upto FY-06 is not consistent.
Chapter 6 – Load Forecast Page 94
Bangalore Electricity Supply Company Limited MYT for 3rd control period (FY14 – FY16)
8%
2%
72%
2%
4%1%0%
9%
LT1bLT2LT3LT4a,bLT-5LT6aLT6bHT-1HT2a
Category Share of Consumption
HT2(a) 9% 9%LT
91%LT-Agri 72%LT-Domestic 8%LT-Industry 2%LT-Comml 2%
The HT and LT sales ratio at 9 : 91. LT-Agriculture constitutes 72%of the
total sales. Any increase in availability of Supply will have impact on the
Circles consumption.
CAGR growth rate of this Circle is considered as 3% for the future
projections based on the 2 years CAGR growth as depicted in the above
table.
Chapter 6 – Load Forecast Page 95
Bangalore Electricity Supply Company Limited MYT for 3rd control period (FY14 – FY16)
Tumkur Circle:
Consumption and yearly growth rate of Tumkur Circle from FY-05 to FY-12 is
as under:
Year FY 05 FY 06 FY 07 FY 08 FY 09 FY 10 FY 11 FY 12
Consumption in MU
268.77
407.51 1031.93 1200.21702.5
41881.27 1920.04 1842.00
Growth rate in %
16.31 41.85 10.50 2.06 -4.06
CAGR Growth rate of Tumkur circle is:
Year 4years from 2008to 2012
3years from 2009to 2012
2years from 2010to 2012
Yearly growth rate from 2011 to 2012
Growth in %
9% 2% -1% 4.06
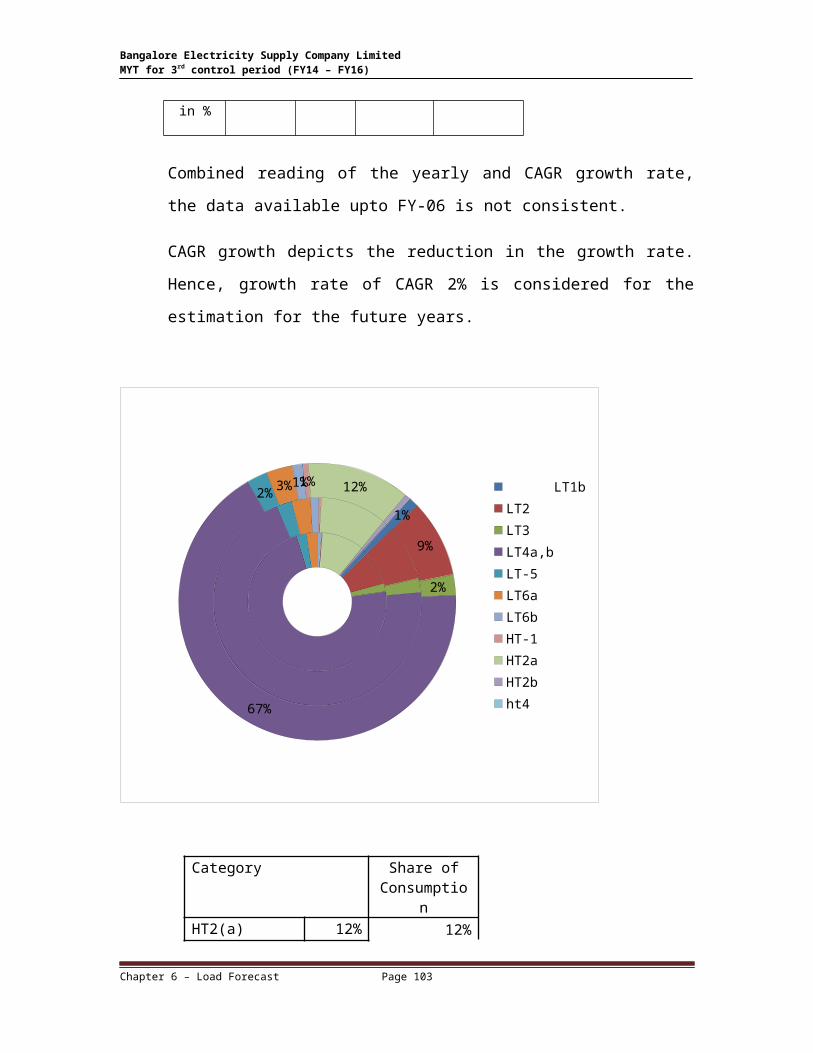
Combined reading of the yearly and CAGR growth rate, the data available
upto FY-06 is not consistent.
CAGR growth depicts the reduction in the growth rate. Hence, growth rate of
CAGR 2% is considered for the estimation for the future years.
Chapter 6 – Load Forecast Page 96
Bangalore Electricity Supply Company Limited MYT for 3rd control period (FY14 – FY16)
1%
9%
2%
67%
2% 3%1%1% 12%
LT1bLT2LT3LT4a,bLT-5LT6aLT6bHT-1HT2aHT2bht4
Category Share of Consumption
HT2(a) 12% 12%LT
88%LT-Agri 67%
LT-Domestic 9%
LT-Industry 2%LT-Comml 3%
The ratio of the HT and LT consumption is at 12 : 88. Predominant
consumption is attributable to LT agriculture.
CAGR growth rate of this Circle is considered as 2% for the future
projections based on the 3 years CAGR growth as depicted in the above
table.
Chapter 6 – Load Forecast Page 97
Bangalore Electricity Supply Company Limited MYT for 3rd control period (FY14 – FY16)
Davanagere Circle:
Consumption and yearly growth rate of Davanagere Circle from FY-07 to FY-
12 is as under:
Year FY 07 FY 08 FY 09 FY 10 FY 11 FY 12
Consumption in MU
1121.73 1275.59 1471.99 1608.15 1673.57 1780.17
Growth rate in % 14 15 9 4 6
CAGR Growth rate:
Year5years from 2007to 2012
4years from 2008to 2012
3years from 2009to 2012
2years from 2010to 2012
Yearly growth rate from 2011 to 2012
Growth in %
8% 7% 5% 3% 6%
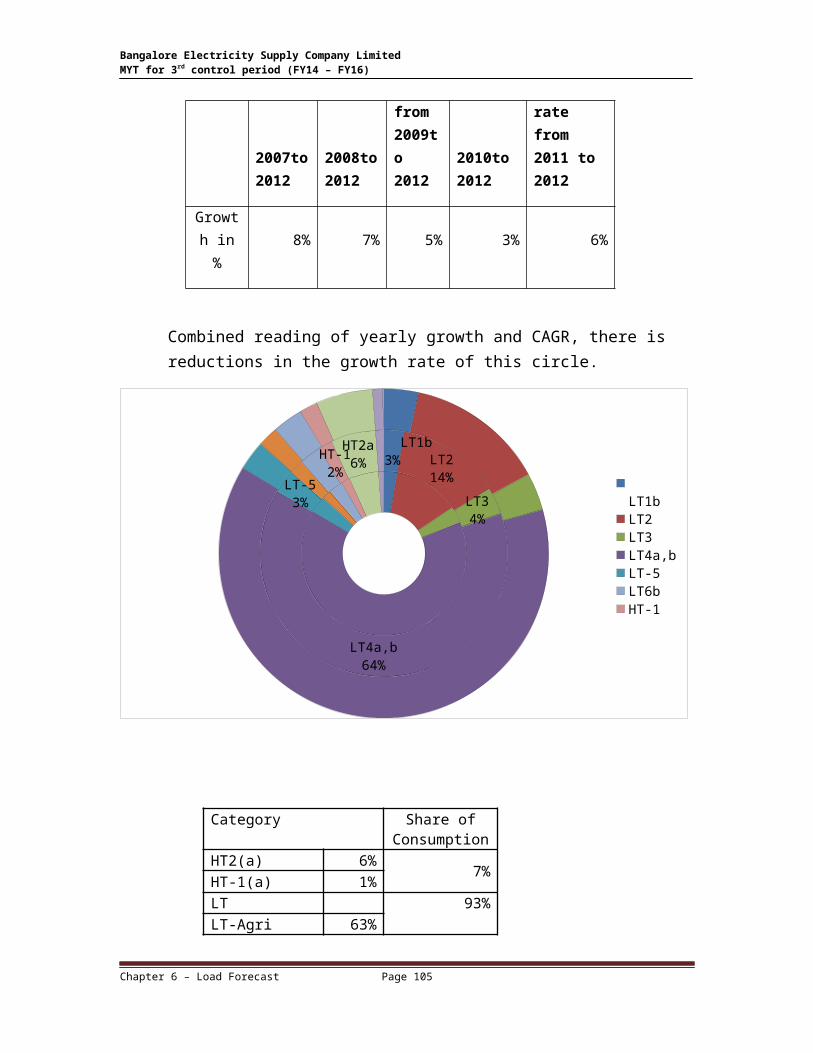
Combined reading of yearly growth and CAGR, there is reductions in the growth rate of this circle.
Chapter 6 – Load Forecast Page 98
Bangalore Electricity Supply Company Limited MYT for 3rd control period (FY14 – FY16)
LT1b3% LT2
14%
LT34%
LT4a,b64%
LT-53%
HT-12%
HT2a6%
LT1bLT2LT3LT4a,bLT-5LT6bHT-1HT2a
Category Share of Consumption
HT2(a) 6%7%
HT-1(a) 1%LT
93%
LT-Agri 63%LT-Domestic 14%
LT-BJ/KJ 3%LT-Industry 3%LT-Comml 3%
About 93% of energy is attributable to LT category , in which 63%
contributes to Irrigation.
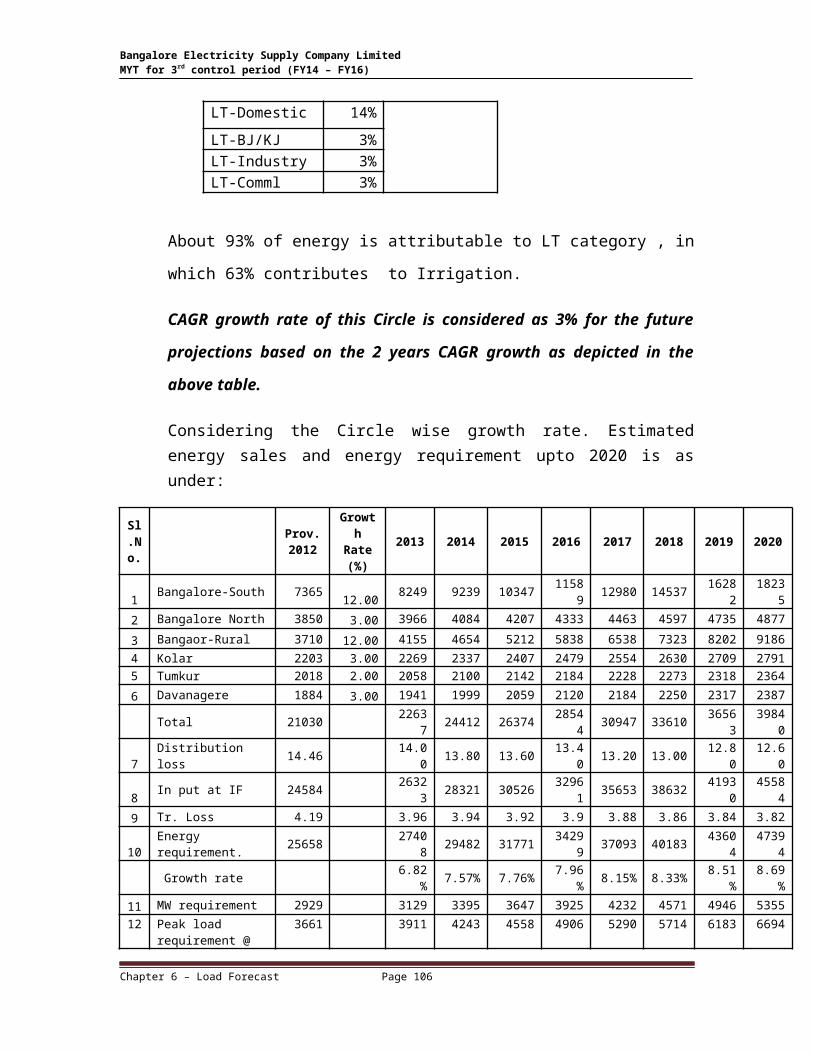
CAGR growth rate of this Circle is considered as 3% for the future
projections based on the 2 years CAGR growth as depicted in the above
table.
Considering the Circle wise growth rate. Estimated energy sales and energy requirement upto 2020 is as under:
Chapter 6 – Load Forecast Page 99
Bangalore Electricity Supply Company Limited MYT for 3rd control period (FY14 – FY16)
Sl.No
.
Prov. 2012
Growth Rate (%)
2013 2014 2015 2016 2017 2018 2019 2020
1 Bangalore-South 7365 12.00 8249 9239 10347 11589 12980 14537 16282 18235
2 Bangalore North 3850 3.00 3966 4084 4207 4333 4463 4597 4735 4877
3 Bangaor-Rural 3710 12.00 4155 4654 5212 5838 6538 7323 8202 9186
4 Kolar 2203 3.00 2269 2337 2407 2479 2554 2630 2709 27915 Tumkur 2018 2.00 2058 2100 2142 2184 2228 2273 2318 2364
6 Davanagere 1884 3.00 1941 1999 2059 2120 2184 2250 2317 2387
Total 21030 22637 24412 26374 28544 30947 33610 36563 39840
7 Distribution loss 14.46 14.00 13.80 13.60 13.40 13.20 13.00 12.80 12.60
8 In put at IF 24584 26323 28321 30526 32961 35653 38632 41930 45584
9 Tr. Loss 4.19 3.96 3.94 3.92 3.9 3.88 3.86 3.84 3.82
10 Energy requirement. 25658 27408 29482 31771 34299 37093 40183 43604 47394 Growth rate 6.82% 7.57% 7.76% 7.96% 8.15% 8.33% 8.51% 8.69%
11 MW requirement 2929 3129 3395 3647 3925 4232 4571 4946 5355
12
Peak load requirement @ LF of 80% (MW)
3661 3911 4243 4558 4906 5290 5714 6183 6694
It is to state that efforts have been made to collect all the historical data. It is
a fact that there may be some inconsistency crept in due to the following
reasons.
Formation of new subdivisions/divisions/circles.
Change in jurisdictional area of operation of respective
subdivisions/divisions/circles
Monitoring of data at Corporate Office at the level of divisions/circles.
The data for all the years is not captured, however the relevant data
for depicting the growth rate is duly considered.
For projection of circle wise sales, relevant data has been reckoned.
The pictorial representation is done on the data available.
Scenario 4 : Energy Forecast based on Compounded Annual Growth Rate
(CAGR) .
The sales projection for 3rd control period is projected on the following lines:
Chapter 6 – Load Forecast Page 100
Bangalore Electricity Supply Company Limited MYT for 3rd control period (FY14 – FY16)
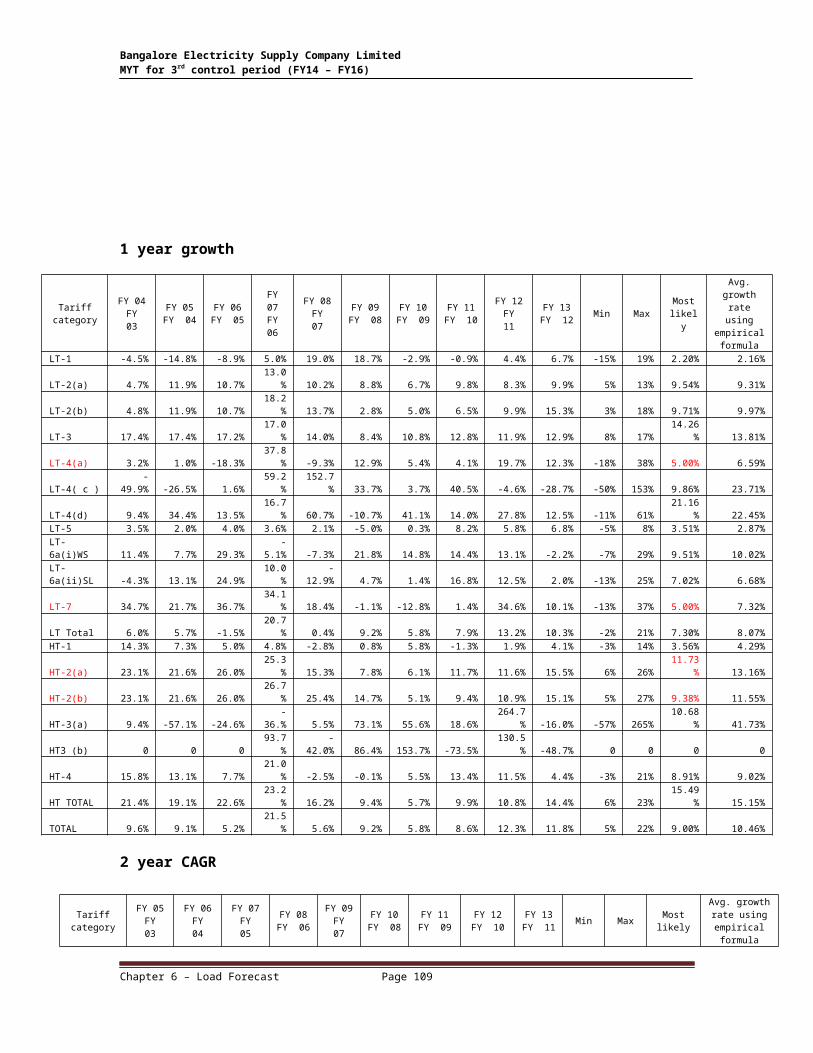
The historical data for past years is available. The CAGR for 7yrs, 6 yrs, 5 yrs,
4 yrs, 3 yrs, 2 yrs and one year growth is computed. Accordingly, 7 scenarios
of projections are obtained. An empherical formula is made use of.
The minima and maxima and most likely of all the CAGR years are worked
out - minima is considered as pessimistic and maxima is considered as
optimistic, the average of the rest is considered as most likely.
Statistical empirical formula is applied for all the scenarios
Average = (Optimistic+Pessimistic+4X Most Likely) 6
The growth rate in respect of all the four scenarios is shown in the table
below:
The Compounded Annual Growth Rate of energy Consumption computed is
shown below:
1 year growth
Tariff category
FY 04 FY 03
FY 05 FY 04
FY 06 FY 05
FY 07 FY 06
FY 08 FY 07
FY 09 FY 08
FY 10 FY 09
FY 11 FY 10
FY 12 FY 11
FY 13 FY 12
Min MaxMost likely
Avg. growth rate using empirical formula
LT-1 -4.5% -14.8% -8.9% 5.0% 19.0% 18.7% -2.9% -0.9% 4.4% 6.7% -15% 19% 2.20% 2.16%LT-2(a) 4.7% 11.9% 10.7% 13.0% 10.2% 8.8% 6.7% 9.8% 8.3% 9.9% 5% 13% 9.54% 9.31%LT-2(b) 4.8% 11.9% 10.7% 18.2% 13.7% 2.8% 5.0% 6.5% 9.9% 15.3% 3% 18% 9.71% 9.97%
Chapter 6 – Load Forecast Page 101

Bangalore Electricity Supply Company Limited MYT for 3rd control period (FY14 – FY16)
LT-3 17.4% 17.4% 17.2% 17.0% 14.0% 8.4% 10.8% 12.8% 11.9% 12.9% 8% 17% 14.26% 13.81%LT-4(a) 3.2% 1.0% -18.3% 37.8% -9.3% 12.9% 5.4% 4.1% 19.7% 12.3% -18% 38% 5.00% 6.59%LT-4( c ) -49.9% -26.5% 1.6% 59.2% 152.7% 33.7% 3.7% 40.5% -4.6% -28.7% -50% 153% 9.86% 23.71%LT-4(d) 9.4% 34.4% 13.5% 16.7% 60.7% -10.7% 41.1% 14.0% 27.8% 12.5% -11% 61% 21.16% 22.45%LT-5 3.5% 2.0% 4.0% 3.6% 2.1% -5.0% 0.3% 8.2% 5.8% 6.8% -5% 8% 3.51% 2.87%LT-6a(i)WS 11.4% 7.7% 29.3% -5.1% -7.3% 21.8% 14.8% 14.4% 13.1% -2.2% -7% 29% 9.51% 10.02%LT-6a(ii)SL -4.3% 13.1% 24.9% 10.0% -12.9% 4.7% 1.4% 16.8% 12.5% 2.0% -13% 25% 7.02% 6.68%LT-7 34.7% 21.7% 36.7% 34.1% 18.4% -1.1% -12.8% 1.4% 34.6% 10.1% -13% 37% 5.00% 7.32%LT Total 6.0% 5.7% -1.5% 20.7% 0.4% 9.2% 5.8% 7.9% 13.2% 10.3% -2% 21% 7.30% 8.07%HT-1 14.3% 7.3% 5.0% 4.8% -2.8% 0.8% 5.8% -1.3% 1.9% 4.1% -3% 14% 3.56% 4.29%HT-2(a) 23.1% 21.6% 26.0% 25.3% 15.3% 7.8% 6.1% 11.7% 11.6% 15.5% 6% 26% 11.73% 13.16%HT-2(b) 23.1% 21.6% 26.0% 26.7% 25.4% 14.7% 5.1% 9.4% 10.9% 15.1% 5% 27% 9.38% 11.55%HT-3(a) 9.4% -57.1% -24.6% -36.% 5.5% 73.1% 55.6% 18.6% 264.7% -16.0% -57% 265% 10.68% 41.73%HT3 (b) 0 0 0 93.7% -42.0% 86.4% 153.7% -73.5% 130.5% -48.7% 0 0 0 0HT-4 15.8% 13.1% 7.7% 21.0% -2.5% -0.1% 5.5% 13.4% 11.5% 4.4% -3% 21% 8.91% 9.02%HT TOTAL 21.4% 19.1% 22.6% 23.2% 16.2% 9.4% 5.7% 9.9% 10.8% 14.4% 6% 23% 15.49% 15.15%TOTAL 9.6% 9.1% 5.2% 21.5% 5.6% 9.2% 5.8% 8.6% 12.3% 11.8% 5% 22% 9.00% 10.46%
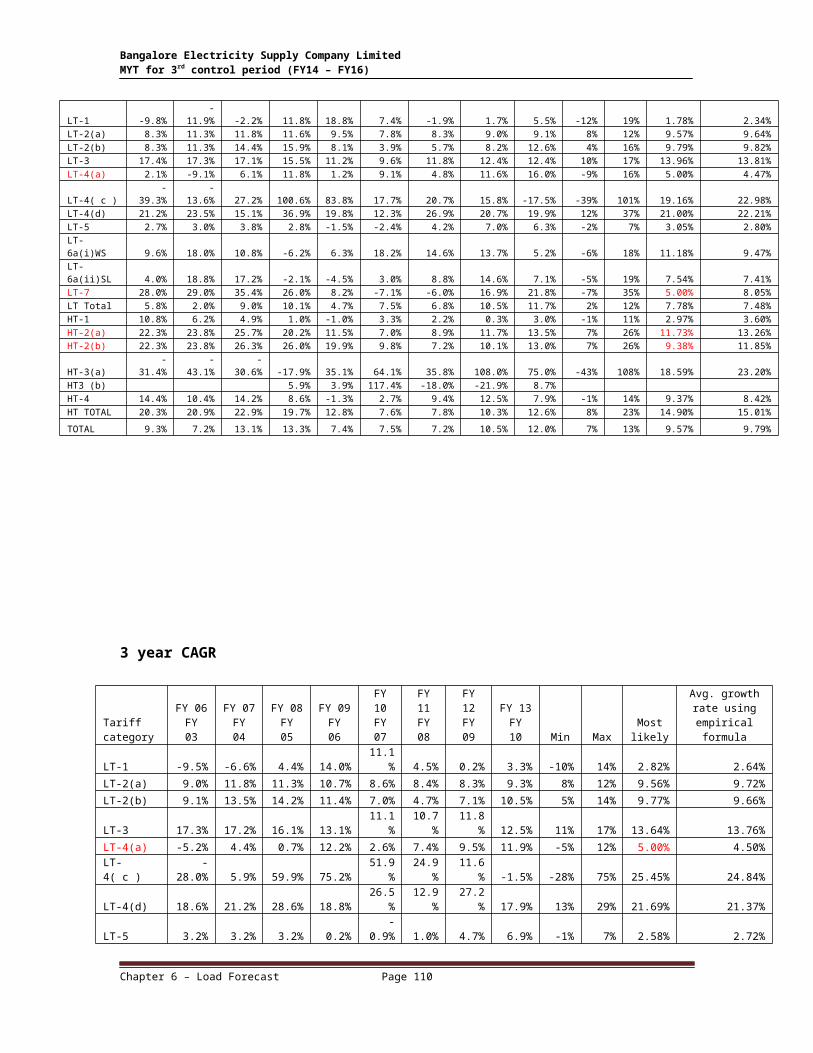
2 year CAGR
Tariff category
FY 05 FY 03
FY 06 FY 04
FY 07 FY 05
FY 08 FY 06
FY 09 FY 07
FY 10 FY 08
FY 11 FY 09
FY 12 FY 10
FY 13 FY 11
Min MaxMost likely
Avg. growth rate using empirical formula
LT-1 -9.8% -11.9% -2.2% 11.8% 18.8% 7.4% -1.9% 1.7% 5.5% -12% 19% 1.78% 2.34%LT-2(a) 8.3% 11.3% 11.8% 11.6% 9.5% 7.8% 8.3% 9.0% 9.1% 8% 12% 9.57% 9.64%LT-2(b) 8.3% 11.3% 14.4% 15.9% 8.1% 3.9% 5.7% 8.2% 12.6% 4% 16% 9.79% 9.82%LT-3 17.4% 17.3% 17.1% 15.5% 11.2% 9.6% 11.8% 12.4% 12.4% 10% 17% 13.96% 13.81%LT-4(a) 2.1% -9.1% 6.1% 11.8% 1.2% 9.1% 4.8% 11.6% 16.0% -9% 16% 5.00% 4.47%LT-4( c ) -39.3% -13.6% 27.2% 100.6% 83.8% 17.7% 20.7% 15.8% -17.5% -39% 101% 19.16% 22.98%LT-4(d) 21.2% 23.5% 15.1% 36.9% 19.8% 12.3% 26.9% 20.7% 19.9% 12% 37% 21.00% 22.21%LT-5 2.7% 3.0% 3.8% 2.8% -1.5% -2.4% 4.2% 7.0% 6.3% -2% 7% 3.05% 2.80%LT-6a(i)WS 9.6% 18.0% 10.8% -6.2% 6.3% 18.2% 14.6% 13.7% 5.2% -6% 18% 11.18% 9.47%LT-6a(ii)SL 4.0% 18.8% 17.2% -2.1% -4.5% 3.0% 8.8% 14.6% 7.1% -5% 19% 7.54% 7.41%LT-7 28.0% 29.0% 35.4% 26.0% 8.2% -7.1% -6.0% 16.9% 21.8% -7% 35% 5.00% 8.05%LT Total 5.8% 2.0% 9.0% 10.1% 4.7% 7.5% 6.8% 10.5% 11.7% 2% 12% 7.78% 7.48%HT-1 10.8% 6.2% 4.9% 1.0% -1.0% 3.3% 2.2% 0.3% 3.0% -1% 11% 2.97% 3.60%HT-2(a) 22.3% 23.8% 25.7% 20.2% 11.5% 7.0% 8.9% 11.7% 13.5% 7% 26% 11.73% 13.26%HT-2(b) 22.3% 23.8% 26.3% 26.0% 19.9% 9.8% 7.2% 10.1% 13.0% 7% 26% 9.38% 11.85%HT-3(a) -31.4% -43.1% -30.6% -17.9% 35.1% 64.1% 35.8% 108.0% 75.0% -43% 108% 18.59% 23.20%HT3 (b) 5.9% 3.9% 117.4% -18.0% -21.9% 8.7%HT-4 14.4% 10.4% 14.2% 8.6% -1.3% 2.7% 9.4% 12.5% 7.9% -1% 14% 9.37% 8.42%HT TOTAL 20.3% 20.9% 22.9% 19.7% 12.8% 7.6% 7.8% 10.3% 12.6% 8% 23% 14.90% 15.01%
TOTAL 9.3% 7.2% 13.1% 13.3% 7.4% 7.5% 7.2% 10.5% 12.0% 7% 13% 9.57% 9.79%
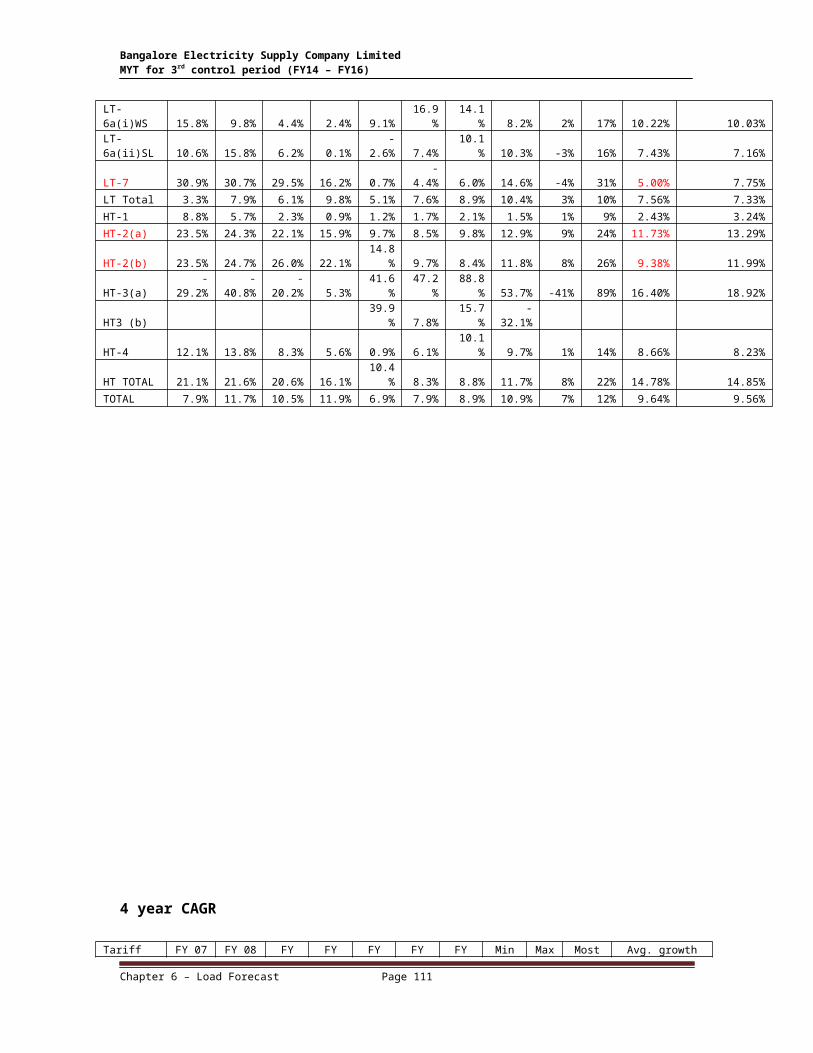
3 year CAGR
Tariff category
FY 06 FY 03
FY 07 FY 04
FY 08 FY 05
FY 09 FY 06
FY 10 FY 07
FY 11 FY 08
FY 12 FY 09
FY 13 FY 10 Min Max
Most likely
Avg. growth rate using empirical
formula
LT-1 -9.5% -6.6% 4.4% 14.0%11.1
% 4.5% 0.2% 3.3% -10% 14% 2.82% 2.64%
LT-2(a) 9.0% 11.8% 11.3% 10.7% 8.6% 8.4% 8.3% 9.3% 8% 12% 9.56% 9.72%
Chapter 6 – Load Forecast Page 102
Bangalore Electricity Supply Company Limited MYT for 3rd control period (FY14 – FY16)
LT-2(b) 9.1% 13.5% 14.2% 11.4% 7.0% 4.7% 7.1% 10.5% 5% 14% 9.77% 9.66%
LT-3 17.3% 17.2% 16.1% 13.1%11.1
%10.7
% 11.8% 12.5% 11% 17% 13.64% 13.76%
LT-4(a) -5.2% 4.4% 0.7% 12.2% 2.6% 7.4% 9.5% 11.9% -5% 12% 5.00% 4.50%
LT-4( c ) -28.0% 5.9% 59.9% 75.2%51.9
%24.9
% 11.6% -1.5% -28% 75% 25.45% 24.84%
LT-4(d) 18.6% 21.2% 28.6% 18.8%26.5
%12.9
% 27.2% 17.9% 13% 29% 21.69% 21.37%
LT-5 3.2% 3.2% 3.2% 0.2% -0.9% 1.0% 4.7% 6.9% -1% 7% 2.58% 2.72%
LT-6a(i)WS 15.8% 9.8% 4.4% 2.4% 9.1%16.9
% 14.1% 8.2% 2% 17% 10.22% 10.03%
LT-6a(ii)SL 10.6% 15.8% 6.2% 0.1% -2.6% 7.4% 10.1% 10.3% -3% 16% 7.43% 7.16%
LT-7 30.9% 30.7% 29.5% 16.2% 0.7% -4.4% 6.0% 14.6% -4% 31% 5.00% 7.75%
LT Total 3.3% 7.9% 6.1% 9.8% 5.1% 7.6% 8.9% 10.4% 3% 10% 7.56% 7.33%
HT-1 8.8% 5.7% 2.3% 0.9% 1.2% 1.7% 2.1% 1.5% 1% 9% 2.43% 3.24%
HT-2(a) 23.5% 24.3% 22.1% 15.9% 9.7% 8.5% 9.8% 12.9% 9% 24% 11.73% 13.29%
HT-2(b) 23.5% 24.7% 26.0% 22.1%14.8
% 9.7% 8.4% 11.8% 8% 26% 9.38% 11.99%
HT-3(a) -29.2% -40.8% -20.2% 5.3%41.6
%47.2
% 88.8% 53.7% -41% 89% 16.40% 18.92%
HT3 (b)39.9
% 7.8% 15.7% -32.1%
HT-4 12.1% 13.8% 8.3% 5.6% 0.9% 6.1% 10.1% 9.7% 1% 14% 8.66% 8.23%
HT TOTAL 21.1% 21.6% 20.6% 16.1%10.4
% 8.3% 8.8% 11.7% 8% 22% 14.78% 14.85%
TOTAL 7.9% 11.7% 10.5% 11.9% 6.9% 7.9% 8.9% 10.9% 7% 12% 9.64% 9.56%
4 year CAGR
Chapter 6 – Load Forecast Page 103

Bangalore Electricity Supply Company Limited MYT for 3rd control period (FY14 – FY16)
Tariff category
FY 07 FY 03
FY 08 FY 04
FY 09 FY 05
FY 10 FY 06
FY 11 FY 07
FY 12 FY 08
FY 13 FY 09 Min Max
Most likely
Avg. growth rate using empirical
formula
LT-1 -6.1% -0.8% 7.8% 9.5% 8.0% 4.5% 1.7% -6%10% 4.25% 3.41%
LT-2(a) 10.0% 11.4%10.7
% 9.7% 8.9% 8.4% 8.7% 8%11% 9.58% 9.69%
LT-2(b) 11.3% 13.6%11.2
% 9.7% 6.9% 6.0% 9.1% 6%14% 9.64% 9.69%
LT-3 17.3% 16.4%14.1
%12.5
%11.5
%11.0
%12.1
% 11%17%
13.33% 13.59%
LT-4(a) 4.1% 0.8% 3.6%10.5
% 3.0%10.4
%10.2
% 1%10% 5.27% 5.39%
LT-4( c ) -12.2% 31.7%52.9
%53.7
%49.0
%16.8
% -0.2% -12%54%
30.01% 26.93%
LT-4(d) 18.1% 30.0%17.4
%24.0
%23.3
%16.4
%23.3
% 16%30%
21.23% 21.90%
LT-5 3.3% 2.9% 1.1% 0.2% 1.3% 2.2% 5.2% 0% 5% 2.16% 2.34%
LT-6a(i)WS 10.2% 5.2% 8.5% 5.3%10.4
%16.0
% 9.8% 5%16% 8.84% 9.43%
LT-6a(ii)SL 10.4% 7.8% 5.8% 0.4% 1.9% 8.7% 8.0% 0%10% 6.45% 6.11%
LT-7 31.7% 27.5%21.1
% 8.2% 0.9% 4.2% 7.0% 1%32% 5.00% 8.76%
LT Total 7.4% 6.0% 6.8% 8.8% 5.8% 9.0% 9.3% 6% 9% 7.60% 7.57%HT-1 7.8% 3.5% 1.9% 2.1% 0.6% 1.8% 2.6% 1% 8% 2.38% 2.98%
HT-2(a) 24.0% 22.0%18.4
%13.4
%10.2
% 9.3%11.2
% 9%24%
11.73% 13.37%
HT-2(b) 24.3% 24.9%23.1
%17.6
%13.4
%10.0
%10.1
% 10%25% 9.38% 12.06%
HT-3(a) -31.0% -31.6% -3.2%16.1
%35.5
%84.7
%54.2
% -32%85%
14.31% 18.39%
HT-4 14.3% 9.5% 6.1% 5.6% 3.9% 7.5% 8.6% 4%14% 7.46% 8.01%
HT TOTAL 21.6% 20.3%17.7
%13.4
%10.3
% 8.9%10.2
% 9%22%
14.37% 14.67%
TOTAL 11.2% 10.2%10.2
%10.4
% 7.3% 9.0% 9.6% 7%11% 9.86% 9.66%
Chapter 6 – Load Forecast Page 104
Bangalore Electricity Supply Company Limited MYT for 3rd control period (FY14 – FY16)
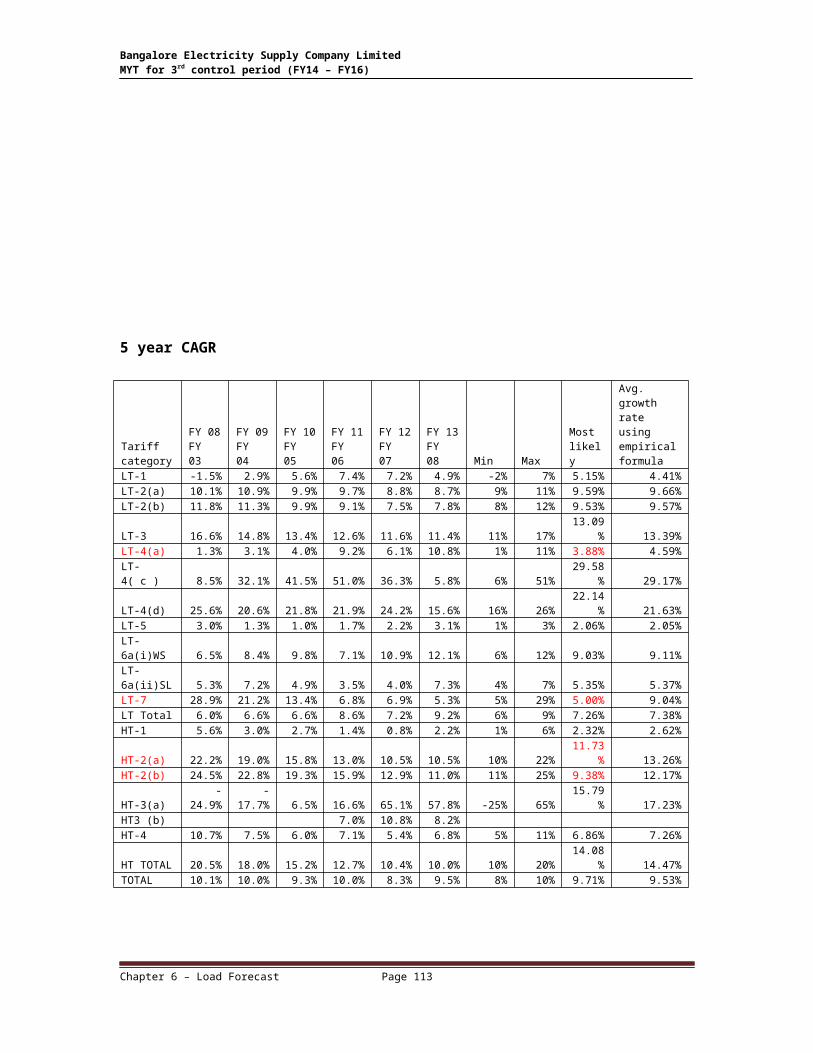
5 year CAGR
Tariff category
FY 08 FY 03
FY 09 FY 04
FY 10 FY 05
FY 11 FY 06
FY 12 FY 07
FY 13 FY 08 Min Max
Most likely
Avg. growth rate using empirical formula
LT-1 -1.5% 2.9% 5.6% 7.4% 7.2% 4.9% -2% 7% 5.15% 4.41%LT-2(a) 10.1% 10.9% 9.9% 9.7% 8.8% 8.7% 9% 11% 9.59% 9.66%LT-2(b) 11.8% 11.3% 9.9% 9.1% 7.5% 7.8% 8% 12% 9.53% 9.57%
LT-3 16.6% 14.8% 13.4% 12.6% 11.6% 11.4% 11% 17%13.09
% 13.39%LT-4(a) 1.3% 3.1% 4.0% 9.2% 6.1% 10.8% 1% 11% 3.88% 4.59%
LT-4( c ) 8.5% 32.1% 41.5% 51.0% 36.3% 5.8% 6% 51%29.58
% 29.17%
LT-4(d) 25.6% 20.6% 21.8% 21.9% 24.2% 15.6% 16% 26%22.14
% 21.63%LT-5 3.0% 1.3% 1.0% 1.7% 2.2% 3.1% 1% 3% 2.06% 2.05%LT-6a(i)WS 6.5% 8.4% 9.8% 7.1% 10.9% 12.1% 6% 12% 9.03% 9.11%LT-6a(ii)SL 5.3% 7.2% 4.9% 3.5% 4.0% 7.3% 4% 7% 5.35% 5.37%LT-7 28.9% 21.2% 13.4% 6.8% 6.9% 5.3% 5% 29% 5.00% 9.04%LT Total 6.0% 6.6% 6.6% 8.6% 7.2% 9.2% 6% 9% 7.26% 7.38%HT-1 5.6% 3.0% 2.7% 1.4% 0.8% 2.2% 1% 6% 2.32% 2.62%
HT-2(a) 22.2% 19.0% 15.8% 13.0% 10.5% 10.5% 10% 22%11.73
% 13.26%HT-2(b) 24.5% 22.8% 19.3% 15.9% 12.9% 11.0% 11% 25% 9.38% 12.17%
HT-3(a) -24.9% -17.7% 6.5% 16.6% 65.1% 57.8% -25% 65%15.79
% 17.23%HT3 (b) 7.0% 10.8% 8.2% HT-4 10.7% 7.5% 6.0% 7.1% 5.4% 6.8% 5% 11% 6.86% 7.26%
HT TOTAL 20.5% 18.0% 15.2% 12.7% 10.4% 10.0% 10% 20%14.08
% 14.47%TOTAL 10.1% 10.0% 9.3% 10.0% 8.3% 9.5% 8% 10% 9.71% 9.53%
Chapter 6 – Load Forecast Page 105
Bangalore Electricity Supply Company Limited MYT for 3rd control period (FY14 – FY16)
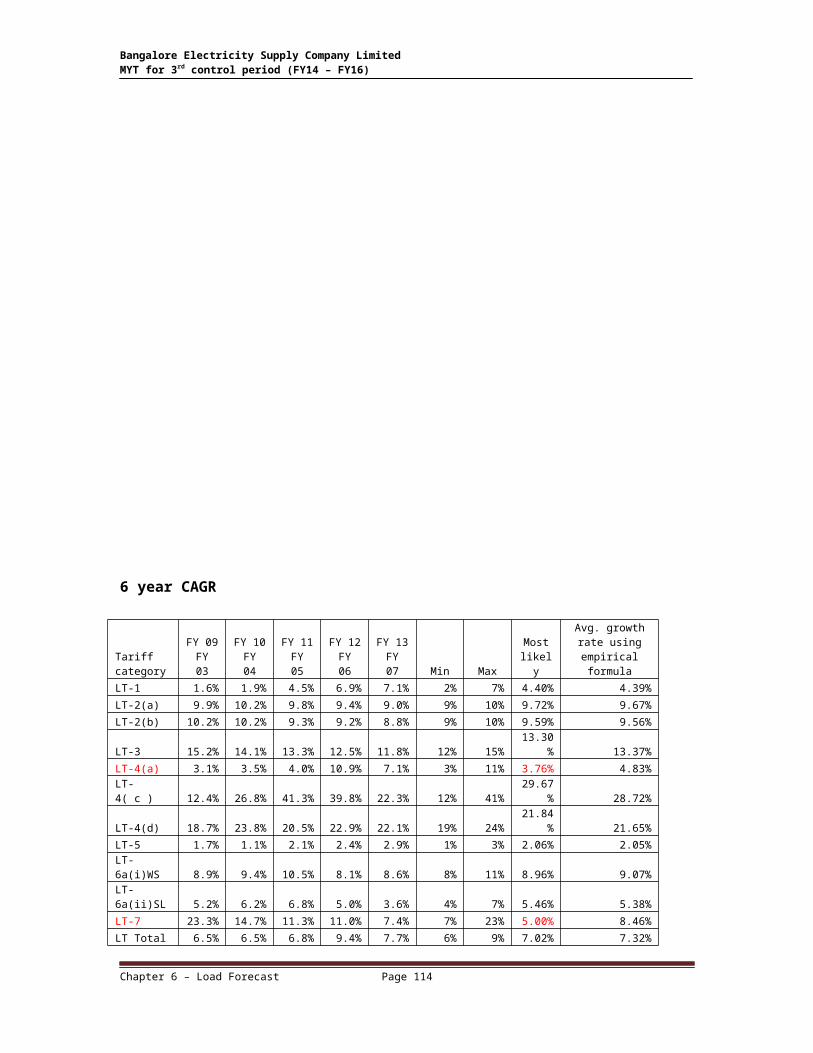
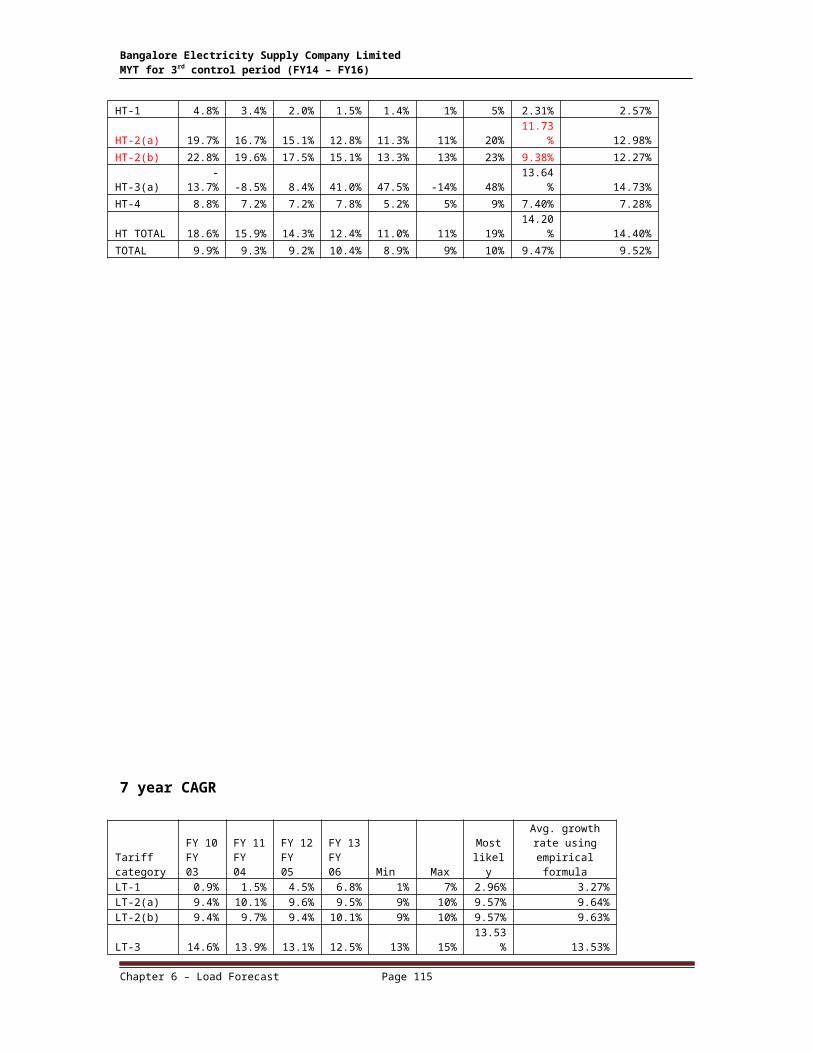
6 year CAGR
Tariff category
FY 09 FY 03
FY 10 FY 04
FY 11 FY 05
FY 12 FY 06
FY 13FY 07 Min Max
Most likely
Avg. growth rate using empirical
formula
LT-1 1.6% 1.9% 4.5% 6.9% 7.1% 2% 7% 4.40% 4.39%
LT-2(a) 9.9% 10.2% 9.8% 9.4% 9.0% 9% 10% 9.72% 9.67%
LT-2(b) 10.2% 10.2% 9.3% 9.2% 8.8% 9% 10% 9.59% 9.56%
LT-3 15.2% 14.1% 13.3% 12.5% 11.8% 12% 15%13.30
% 13.37%
LT-4(a) 3.1% 3.5% 4.0% 10.9% 7.1% 3% 11% 3.76% 4.83%
LT-4( c ) 12.4% 26.8% 41.3% 39.8% 22.3% 12% 41%29.67
% 28.72%
LT-4(d) 18.7% 23.8% 20.5% 22.9% 22.1% 19% 24%21.84
% 21.65%
LT-5 1.7% 1.1% 2.1% 2.4% 2.9% 1% 3% 2.06% 2.05%
LT-6a(i)WS 8.9% 9.4% 10.5% 8.1% 8.6% 8% 11% 8.96% 9.07%
LT-6a(ii)SL 5.2% 6.2% 6.8% 5.0% 3.6% 4% 7% 5.46% 5.38%
LT-7 23.3% 14.7% 11.3% 11.0% 7.4% 7% 23% 5.00% 8.46%
LT Total 6.5% 6.5% 6.8% 9.4% 7.7% 6% 9% 7.02% 7.32%
HT-1 4.8% 3.4% 2.0% 1.5% 1.4% 1% 5% 2.31% 2.57%
HT-2(a) 19.7% 16.7% 15.1% 12.8% 11.3% 11% 20%11.73
% 12.98%
HT-2(b) 22.8% 19.6% 17.5% 15.1% 13.3% 13% 23% 9.38% 12.27%
HT-3(a) -13.7% -8.5% 8.4% 41.0% 47.5% -14% 48%13.64
% 14.73%
HT-4 8.8% 7.2% 7.2% 7.8% 5.2% 5% 9% 7.40% 7.28%
HT TOTAL 18.6% 15.9% 14.3% 12.4% 11.0% 11% 19%14.20
% 14.40%
TOTAL 9.9% 9.3% 9.2% 10.4% 8.9% 9% 10% 9.47% 9.52%
Chapter 6 – Load Forecast Page 106

Bangalore Electricity Supply Company Limited MYT for 3rd control period (FY14 – FY16)
7 year CAGR
Tariff category
FY 10 FY 03
FY 11 FY 04
FY 12 FY 05
FY 13 FY 06 Min Max
Most likely
Avg. growth rate using empirical
formulaLT-1 0.9% 1.5% 4.5% 6.8% 1% 7% 2.96% 3.27%LT-2(a) 9.4% 10.1% 9.6% 9.5% 9% 10% 9.57% 9.64%LT-2(b) 9.4% 9.7% 9.4% 10.1% 9% 10% 9.57% 9.63%
LT-3 14.6% 13.9% 13.1% 12.5% 13% 15%13.53
% 13.53%LT-4(a) 3.5% 3.6% 6.1% 11.1% 3% 11% 4.85% 5.65%
LT-4( c ) 11.1% 28.7% 33.6% 27.0% 11% 34%27.86
% 26.02%
LT-4(d) 21.7% 22.4% 21.5% 21.3% 21% 22%21.58
% 21.67%
LT-5 1.5% 2.1% 2.6% 3.0% 1% 3% 2.37% 2.33%
LT-6a(i)WS 9.7% 10.1% 10.9% 6.5% 7% 11% 9.90% 9.51%
LT-6a(ii)SL 4.7% 7.7% 7.6% 4.5% 5% 8% 6.12% 6.12%
LT-7 17.4% 12.7% 14.4% 10.9% 11% 17% 5.00% 8.04%
LT Total 6.4% 6.7% 7.7% 9.5% 6% 9% 7.20% 7.45%
HT-1 4.9% 2.8% 2.0% 1.9% 2% 5% 2.37% 2.71%
HT-2(a) 17.6% 16.0% 14.6% 13.2% 13% 18%11.73
% 12.96%
HT-2(b) 20.1% 18.1% 16.6% 15.1% 15% 20% 9.38% 12.12%
HT-3(a) -6.1% -5.0% 28.9% 30.9% -6% 31%11.94
% 12.10%HT3 (b) 7.5%
HT-4 8.4% 8.0% 7.8% 7.3% 7% 8% 7.92% 7.90%
HT TOTAL 16.6% 15.0% 13.8% 12.7% 13% 17%14.40
% 14.49%
TOTAL 9.3% 9.2% 9.6% 10.6% 9% 11% 9.48% 9.61%
8 year CAGR
Tariff category
FY 11 FY 03
FY 12 FY 04
FY 13FY 05 Min Max
Most likely
Avg. growth rate using empirical
formulaLT-1 0.7% 1.8% 4.7% 1% 5% 1.83% 2.13%
LT-2(a) 9.4% 9.9% 9.7% 9% 10% 9.66% 9.66%LT-2(b) 9.1% 9.7% 10.1% 9% 10% 9.73% 9.69%
LT-3 14.3% 13.7% 13.1% 13% 14% 13.66% 13.68%
LT-4(a) 3.5% 5.5% 6.9% 4% 7% 5.47% 5.38%
Chapter 6 – Load Forecast Page 107
Bangalore Electricity Supply Company Limited MYT for 3rd control period (FY14 – FY16)
LT-4( c ) 14.4% 24.0% 23.5% 14% 24% 23.51% 22.07%
LT-4(d) 20.7% 23.0% 20.3% 20% 23% 20.67% 21.01%
LT-5 2.3% 2.6% 3.1% 2% 3% 2.56% 2.61%
LT-6a(i)WS 10.3% 10.5% 9.2% 9% 10% 10.27% 10.12%
LT-6a(ii)SL 6.1% 8.3% 6.9% 6% 8% 6.88% 6.98%
LT-7 15.3% 15.2% 13.8% 14% 15% 5.00% 8.18%
LT Total 6.6% 7.5% 8.0% 7% 8% 7.47% 7.42%
HT-1 4.1% 2.6% 2.3% 2% 4% 2.64% 2.83%
HT-2(a) 16.9% 15.5% 14.7% 15% 17% 11.73% 13.08%
HT-2(b) 18.7% 17.2% 16.4% 16% 19% 9.38% 12.11%
HT-3(a) -3.3% 12.4% 22.2% -3% 22% 12.37% 11.39%HT-4 9.0% 8.5% 7.4% 7% 9% 8.46% 8.37%
HT TOTAL 15.8% 14.5% 13.9% 14% 16% 14.46% 14.58%
TOTAL 9.2% 9.6% 9.9% 9% 10% 9.57% 9.57%
The Comparison of growth in consumption of the above scenarios are shown below:
Consumer Category
8 years CAGR
7 years CAGR
6 years CAGR
5 years CAGR
4 years CAGR
3 years CAGR
2 years CAGR
One year growth
LT-1 2.13% 3.27% 4.39% 4.41% 3.41% 2.64% 2.34% 2.16%LT-2(a) 9.66% 9.64% 9.67% 9.66% 9.69% 9.72% 9.64% 9.31%LT-2(b) 9.69% 9.63% 9.56% 9.57% 9.69% 9.66% 9.82% 9.97%LT-3 13.68% 13.53% 13.37% 13.39% 13.59% 13.76% 13.81% 13.81%LT-4(a) 5.38% 5.65% 4.83% 4.59% 5.39% 4.50% 4.47% 6.59%LT-4( c ) 22.07% 26.02% 28.72% 29.17% 26.93% 24.84% 22.98% 23.71%LT-4(d) 21.01% 21.67% 21.65% 21.63% 21.90% 21.37% 22.21% 22.45%LT-5 2.61% 2.33% 2.05% 2.05% 2.34% 2.72% 2.80% 2.87%LT-6a(i)WS 10.12% 9.51% 9.07% 9.11% 9.43% 10.03% 9.47% 10.02%LT-6a(ii)SL 6.98% 6.12% 5.38% 5.37% 6.11% 7.16% 7.41% 6.68%LT-7 8.18% 8.04% 8.46% 9.04% 8.76% 7.75% 8.05% 7.32%LT Total 7.42% 7.45% 7.32% 7.38% 7.57% 7.33% 7.48% 8.07%HT-1 2.83% 2.71% 2.57% 2.62% 2.98% 3.24% 3.60% 4.29%HT-2(a) 13.08% 12.96% 12.98% 13.26% 13.37% 13.29% 13.26% 13.16%HT-2(b) 12.11% 12.12% 12.27% 12.17% 12.06% 11.99% 11.85% 11.55%HT-3(a) 11.39% 12.10% 14.73% 17.23% 18.39% 18.92% 23.20% 41.73%HT-3(b) 0.00% 0.00% 0.00% 0.00% 0.00% 0.00% 0.00% 0.00%HT-4 8.37% 7.90% 7.28% 7.26% 8.01% 8.23% 8.42% 9.02%HT TOTAL 14.58% 14.49% 14.40% 14.47% 14.67% 14.85% 15.01% 15.15%TOTAL 9.57% 9.61% 9.52% 9.53% 9.66% 9.56% 9.79% 10.46%
Chapter 6 – Load Forecast Page 108
Bangalore Electricity Supply Company Limited MYT for 3rd control period (FY14 – FY16)
8 years CAGR
7 years CAGR
6 years CAGR
5 years CAGR
4 years CAGR
3 years CAGR
2 years CAGR
One year growth
0.00%
50.00%
100.00%
150.00%
200.00%
250.00%
LT-1 LT-2(a) LT-2(b) LT-3 LT-4(a) LT-4( b )LT-4(c) LT-5 LT-6WS LT-6SL LT-7 HT-1HT-2(a) HT-2(b) HT-3(a) HT-3(b) HT-4
A graph depicting the various scenarios is shown above. It is seen that the
various scenarios are showing more or less the consistent rate of growth. In
the event of the graph depicting consistent growth in all the scenarios, 4
years CAGR growth is considered for the sales forecast.
The CAGR projections from FY-14 to FY-20 are shown in the table below:
Consumer Category FY-13
4 years CAGR FY-14 FY-15 FY-16 FY-17 FY-18 FY-19 FY-20
LT-1 123.94 3.41% 128.17 132.54 137.06 141.74 146.58 151.58 156.75
LT-2(a) 4976.84 9.69% 5459.04 5987.95 6568.11 7204.48 7902.51 8668.17 9508.01
LT-2(b) 36.32 9.69% 39.84 43.71 47.94 52.59 57.69 63.28 69.41
LT-3 1505.36 13.59% 1709.99 1942.43 2206.47 2506.40 2847.10 3234.12 3673.74
LT-4(a) 6012.17 5.39% 6336.18 6677.65 7037.53 7416.80 7816.51 8237.76 8681.71
LT-4( c ) 4.60 26.93% 5.84 7.41 9.40 11.93 15.14 19.22 24.40
LT-4(d) 4.56 21.90% 5.55 6.77 8.25 10.06 12.26 14.94 18.22
LT-5 1114.74 2.34% 1140.84 1167.55 1194.88 1222.86 1251.49 1280.79 1310.77
LT-6WS 450.40 9.43% 492.87 539.35 590.21 645.86 706.77 773.41 846.34
LT-6SL 409.61 6.11% 434.63 461.17 489.33 519.22 550.93 584.57 620.28
LT-7 139.48 8.76% 151.70 164.98 179.43 195.15 212.25 230.84 251.06
HT-1 511.67 2.98% 526.94 542.66 558.86 575.53 592.70 610.39 628.61
HT-2(a) 5038.40 13.37% 5711.88 6475.37 7340.93 8322.17 9434.58 10695.69 12125.36
HT-2(b) 3046.46 12.06% 3413.97 3825.81 4287.34 4804.54 5384.13 6033.64 6761.51
HT-3(a) 5.09 18.39% 6.02 7.13 8.44 9.99 11.83 14.00 16.57
Chapter 6 – Load Forecast Page 109
Bangalore Electricity Supply Company Limited MYT for 3rd control period (FY14 – FY16)
HT-3(b) 0.16 0.00% 0.16 0.16 0.16 0.16 0.16 0.16 0.16
HT-4 123.38 8.01% 133.26 143.93 155.45 167.90 181.34 195.86 211.54
Total Sales 23503.18 9.66% 25696.87 28126.57 30819.80 33807.38 37123.96 40808.42 44904.43
% Growth 9.3% 9.5% 9.6% 9.7% 9.8% 9.9% 10.0%
Distribution Loss 14.00 13.80 13.60 13.40 13.20 13.00 12.80 12.60Energy Input @ IF point 27329.28 29810.75 32553.91 35588.68 38948.60 42671.22 46798.64 51378.07Transmission Loss 3.96 3.94 3.92 3.90 3.88 3.86 3.84 3.82Energy Input @ Gen point 28456.14 31033.47 33882.08 37032.97 40520.81 44384.46 48667.47 53418.66MW requirement 3248.42 3542.63 3867.82 4227.51 4625.66 5066.72 5555.65 6098.02Peak MW requirement 4060.52 4428.29 4834.77 5284.38 5782.08 6333.40 6944.56 7622.53
The above table depicts the sales projection based on 4 years CAGR growth.
The energy requirement at IF points and generating points have been
computed as per the projected figures for distribution and transmission loss
respectively. The corresponding peak loads have been arrived with a Load
factor of 80%.
Summary of different scenarios:
Methodology Projected 2012 2013 2014 2015 2016 2017 2018 2019 2020
Per Capita Consumption
Energy input in MU 25658 28585 31857 35516 39610 43156 47036 51283 55911 11.41 11.45 11.49 11.53 8.95 8.99 9.03 9.02Avg. MW projected 2929 3263 3637 4054 4522 4926 5369 5854 6383Peak MW projected 3661 4079 4546 5068 5652 6158 6712 7318 7978
EPS Projections
Energy input in MU 26686 29070 31559 33980 36549 39411 42584 46014 8.93 8.56 7.67 7.56 7.83 8.05 8.05Avg. MW projected 0 3046 3319 3603 3879 4172 4499 4861 5253Peak MW projected 0 3808 4148 4503 4849 5215 5624 6077 6566
Circle wise sales projections
Energy input in MU 25658 27415 29537 31888 34494 37385 40595 44163 48074 7.74 7.96 8.17 8.38 8.59 8.79 8.86Avg. MW projected 3130 3372 3640 3938 4268 4634 5041 5488Peak MW projected 3912 4215 4550 4922 5335 5793 6302 6860
CAGR Projections
Energy input in MU 25658 28456 31033 33882 37033 40521 44384 48768 53640 9.06 9.18 9.30 9.42 9.53 9.88 9.99Avg. MW projected 3248 3543 3868 4228 4626 5067 5567 6123Peak MW projected 4061 4428 4835 5284 5782 6333 6959 7654
Chapter 6 – Load Forecast Page 110
Bangalore Electricity Supply Company Limited MYT for 3rd control period (FY14 – FY16)
Graphical representation of the Peak load projections under different
scenarios are shown below:
2014 2015 2016 2017 2018 2019 20200
1000
2000
3000
4000
5000
6000
7000
8000
9000
Per Capita Consumption EPS ProjectionsCircle wise sales projections CAGR Projections
Graphical representation of the energy requirement projections under
different scenarios are shown below:
Chapter 6 – Load Forecast Page 111

Bangalore Electricity Supply Company Limited MYT for 3rd control period (FY14 – FY16)
2014 2015 2016 2017 2018 2019 20200
10000
20000
30000
40000
50000
60000
Per Capita Consumption EPS ProjectionsCircle wise sales projections CAGR Projections
Inference:
Per capita consumption: It is proposed to double the per capita
consumption of BESCOM from 1110 units (FY 11) to 2221units (FY 20),
which calls for a growth rate of 7.4%. Accordingly, the computed energy
requirement will be 54251 MU for FY 20, which is more than 100% when
compared to the provisional figures of 26358 MU for FY 12. This appears
to be an ambitious target. The projections computed under this scenario
may be considered as a goal. The stake holders may plan their investment
to reach the goal. The State can plan for investment in generation sector
accordingly. As quoted in earlier paras, this calls for massive energy
investment to achieve targeted expansion.
EPS Projections: The Commission has directed the Licensee to follow the
CEA guidelines in forecasting the energy projections. The 18th EPS is still
in draft stage. A cursory look at the 17th EPS indicates that the estimation
is on the higher side. The State energy sales recorded 37101MU for
FY 11against the estimated EPS figure of 41050 MU (-10%). The targeted
Chapter 6 – Load Forecast Page 112
Bangalore Electricity Supply Company Limited MYT for 3rd control period (FY14 – FY16)
energy projection has not been achieved due to the occurrence of
unpredictable events such as time over run of the projects, cost overrun
of the projects etc. It is to state that the BESCOM’s contribution to the
State energy sales is consistent around 50% and the same has been
reckoned for projections. The draft 18th EPS report is also referred for
estimation of sales. In the absence of final 18th EPS report and the
historical figures not matching with the estimates, it is difficult to
comment on this scenario.
Circle wise Projection: The total circle wise projection figures are done
on similar lines of CAGR projected figures. It is to state that efforts have
been made to segregate the historical data circle wise, tariff wise to arrive
at better estimation of sales. This exercise gave an indication about the
sales growth attributable to certain categories of consumers at the circle
level. It is noticed that the south circle has a major portion of service
sector (IT BT). Any economic crisis will have a direct effect on the sales
for this circle. The percentage of agricultural consumption in rural circles
is more than the other categories. Since the agricultural consumption is
assessed, the consumption / sales under this category is debatable. The
percentage of consumption under unmetered categories is more in rural
circles. Hence, projections made on the basis of circle wise consumption
may lead to increase in estimation of unmetered sales, which may not be
realistic.
CAGR projections: It is to state that this is a time tested scenario. The
projections are based on actual historical figures. The State in the past
has suffered from shortage power. Most of the time the projections were
made on the restricted hours of power supply to farming community.
Further, the hours of power supply to rural areas was also restricted as
per the directions of the State Government. Even now, the scenario has
Chapter 6 – Load Forecast Page 113
Bangalore Electricity Supply Company Limited MYT for 3rd control period (FY14 – FY16)
not changed much even though many power projects are envisaged. The
demand and supply gap is yet to be fully met. In the light of all this, it is
opined that all economic conditions, hours of power supply variations etc
are all taken care with CAGR projections. From the past data it can be
seen that the CAGR projections and actual sales values recorded are
nearer to the projections.
In view of the above the CAGR method has been reckoned for the purpose
of sales forecast for the 3rd control period for FY-14 to FY-16.
Limitations:
1. Planning for power system is essentially a projection of how the system
grows over a specific period of time. Any plan can become technically and
economically obsolete when new inventions in electrical utilization
equipments are taken up.
2. Unforeseen industrial, commercial or residential projects can change the
load forecast.
3. Breakthroughs in new generation and transmission technologies and un
expected inflation in equipment labor costs can take the plan in other
directions.
4. Reliability is one of the most important criteria which must be taken into
consideration during all phases of power system planning, design and
operation.
Chapter 6 – Load Forecast Page 114
Bangalore Electricity Supply Company Limited MYT for 3rd control period (FY14 – FY16)
Chapter 6 – Load Forecast Page 115