Embed Size (px)
Citation preview
AEDnet Exchange ProgrammePLEASE ENSURE YOU COMPLETE ALL SECTIONS OF THIS FORM
Please complete the form and return to [email protected] along with evidence of the duration of the secondment (e.g. copies of flight tickets) and a short written report outlining your findings whilst at the host University.
Researcher details:
First Name: Mary Clare
Last Name: Brown
Address: 19 Kilcredaun House, Ferry Court, Cardiff
Post code: CF11 0JG
Contact Number: 07951871496
Email Address: [email protected]
Gender: Female
Date of Birth: 08/06/1990
Nationality: British/Welsh
Passport Number: 208933943
Details of Secondment:
Home University: Welsh School of Pharmacy and Pharmaceutical Sciences
Cardiff University – Professor Les Baillie
Redwood Building, King Edward VII Avenue,
Cardiff CF10 3XF, Wales, UK
Host University: G. Eliava Institute of Bacteriophages, Microbiology and Virology
Address - 3, Gotua street, Tbilisi 0160, Georgia
Dates of secondment: 07/03/2016 - 06/04/2016
Description of activities and results
From the 07/03/16 to 06/04/16 I was hosted by the laboratory of Dr. Mzia Kutateladze in the G. Eliava Institute of Bacteriophages, Microbiology and Virology, Georgia. The research team’s main area of research was on the discovery, characterization and understanding of bacteriophages and their application as antibacterial agents in phage therapy and environmental decontamination. The bacteriophages I had been researching during my time in the Eliava Institute were specifically able to infect Bacillus anthracis.
Our research group in Cardiff has recently isolated phages that are also able infect B. anthracis from soil samples collected from various locations in Wales. B. anthracis is a spore forming pathogen and the etiological agent of anthrax, and is known to be well-suited to use as a biological weapon. It has the ability to form spores which are highly durable, making them resistant to degradation from heat, drying and many disinfectants which typical bacterial cells are intolerant to. These spores are also able to persist in soil for many years, and germinate into infectious vegetative cells when reintroduced into favourable conditions. Currently decontamination of B. anthracis spores in the environment uses harsh sporicidal chemicals which are harmful to humans, animals and plants, and also renders an area that it is used on (e.g. farmland) unusable for a time. It is therefore in our interest to characterize and further understand these phages to investigate whether they would be suitable to use as environmental decontamination agents as well as clinical bacteriocidal agents. In combination with germinants which would turn spores into metabolically active vegetative cells, bacteriophages could be used as decontaminants which would be specific to killing Bacillus anthracis, as well as being non-toxic and ecologically friendly.
The research team in the Eliava Institute exclusively work on bacteriophages and used methods that they had refined over many years. These methods proved to be more efficient than those currently used by our research group in Cardiff, and allow us to produce high titer stocks of bacteriophages quickly and in higher volume, and also to characterize them. I also learnt how to purify a solution that had a mixture of different phages, and how to use molecular techniques, that were previously unknown to me, to identify the number of different phages in a mixture as
well as which separated phages were the same. I was also shown how to characterize the biology of the phage including latency period, adsorption rate and burst size of a particular phage.
During my time in the Eliava Institute I conducted experiments to purify a mixture of phages that were able to infect B. anthracis. 5 purified bacteriophage solutions, containing only one type of phage, were produced by picking plaques that were different in morphology (N8, N12 small, N12 big, N15 small and N15 big). High titer phage stocks (>1x10¹⁰) were then produced using a top agar overlay method (described below) and the DNA was extracted from the phages using phenol/chloroform/isoamile method. The bacteriophage DNA samples were then analysed using basic gel electrophoresis and pulse-field gel electrophoresis to find out the concentration of DNA removed from each phage, and the purity of each phage solution. The DNA was then digested into fragments using various restriction enzymes to create a genetic profile and to compare each of the phages to see whether they were similar or genetically distinct.
After analysis of the results it was found that phages N8 and N12 big were genetically similar, N15 small and N15 big were genetically similar, and N8 was genetically distinct from all the other phages. This means that N8 and N12 are possibly the same phage and also N15 small and N15 big could also possibly be the same phage.
As a result of my secondment I have learned multiple techniques involving the purification, enumeration and identification of bacteriophages using molecular techniques. This knowledge will enhance our research at Cardiff University concerning the use of bacteriophages as environmental, bacterial decontaminants. I would like to thank Dr. Mzia Kutateladze and her colleagues for their hospitality during my time in Tbilisi and Prof. Les Baillie for the chance to study at the G. Eliava Institute.
Boarding passes
Methods and results
Purifying phage
Serial dilutions of phage were created (from 10-1 to 10-9) in 5ml LB broth. 1ml of each dilution was removed into separate tubes. 4.5ml of LB broth was added to host bacteria (grown for 16 hours) on slopes and vortexed to resuspend bacteria in broth, and 100µl of host bacteria was added to the 1ml dilutions. 4ml of TSB soft agar (0.5%) was added to each dilution and poured onto a TSB agar plate, and incubated for 16-20 hours. Single plaques were then picked using a sterile pipette tip, placed into 1ml of broth, and left for 15-30 minutes at room temperature to let phages diffuse into the broth.
Serial dilutions were created from the picked plaque broth and the process above was repeated for a total of three times to ensure phages was purified. This produced 5 different phage samples which were separated by their plaque morphology; N8, N12 small, N12 big, N15 small and N15 big.
Phage propagation and enumeration
Serial dilutions of phage were created (from 10-1 to 10-9) in 5ml LB broth. 1ml of each dilution were removed into separate tubes. 4.5ml of LB broth was added to host bacteria (grown for 16-20 hours) on slopes and vortexed to resuspend bacteria in broth, and 100µl of host bacteria (1x 10⁸) was added to the 1ml dilutions. 4ml of TSB soft agar (0.5%) was added to each dilution and poured onto a TSB agar plate, and incubated for 16-20 hours. The top agar on plates containing phage dilutions that had not completely lysed the bacteria (but single plaques were unable to be visualised) were scraped using spreaders into sterile tubes. 1ml of broth was added for each plate scraped and then vortexed to further homogenize the top agar layer. The tubes were then centrifuged for 20 minutes at 9000rpm and the phage-containing supernatant was removed and filtered.
Filtered supernatant was then serially diluted (from 10-1 to 10-9) and 1ml was removed from each tube into separate sterile tubes. 100µl of host bacteria (1x 10⁸) was added and 4ml of TSB top agar (0.5%). PFU were counted to determine the titre of the phage.
Phage DNA extraction
500µl of phage-containing broth was placed in a sterile 1.5ml Eppendorf tube. 1µl each of RNase A (20 mg/ml) and DNase I (20 mg/ml) was added to remove any bacterial nuclease contamination, and incubated at 37oC for 30 minutes. Protinase K was then added to a final concentration of 100 µg/ml and incubated at 56oC for 15 minutes. 50 µl of lysis buffer (100 µl of 10% SDS, 100 µl of 0.5mM EDTA, 800 µl of dH2O) and incubated for 30 minutes at Room temperature (RT).
Phenol was added at a 1/1 (vol/vol) to the sample and mixed by inverting the tube for 10 minutes, and centrifuged at 10,000g for 10 minutes. Supernatant was transferred into a new tube.
A 1/1 (vol/vol) phenol/chloroform/isoamile solution (25:24:1 vol/vol) was added and mixed by inverting for 10 minutes, and centrifuged at 10,000 xg for 10 minutes. Supernatant was transferred into a new tube.
A 1/1 (vol/vol) chloroform/isoamile solution (24:1 vol/vol) was added and mixed by inverting for 10 minutes, and centrifuged at 10,000 x g for 10 minutes. Supernatant was transferred into a new tube.
10 µl of 5M NaCl and 300µl of isopropanol was added to the DNA solution and mixed by inverting the tuber for 1 minute. Tubes were then incubated at -20oC for 5 minutes, and centrifuged at 10,000 xg for 10 minutes. Supernatant was then discarded.
Pellet was washed with 1ml 70% ethanol and centrifuged at 10,000 x g for 10 minutes. Supernatant was discarded and pellet was left to dry. Pellet was then resuspended in TE buffer (10mM Tris, 1mM EDTA).
20µl of each DNA sample was pipetted into separate wells in a 0.7% agarose gel prepared for gel electrophoresis and run at 80V and 120mA for 2 hours. Results are shown in Figure 1.
Figure 1: Southern blot of phage DNA. This experiment provided data which was used to determine volume of DNA needed in the subsequent restriction digest analyses in order to standardise DNA abundance and, subsequently, band density upon visualisation. The brighter the bands, the less DNA was needed; so 2µl of sample 1,3 and 4 was used, 3µl of sample 2 was used, and 6µl of sample 5 was used.
DNA Restriction Enzyme Digest
Solution Volume (ml)
DNA 2µl-6µl (depending on results shown above)
Restriction enzyme buffer 2µl
Restriction enzyme 1µ
Sterile deionized water Enough so final solution volume is 20µl
Final Volume : 20µl
Solutions were produced for each phage DNA sample using the components shown in the table above and incubated at 37oC for 16-20 hours. A drop of Bromophenol blue was added to each DNA. 20µl of each sample was then placed into the wells of an agarose gel prepared for electrophoresis (percentage of agarose dependant on what restriction enzyme was used). Gel was then run on 80V and 120mA for 2.5 hours. The gel was then stained with ethidium bromide and DNA bands were visualised under UV transillumination. Results are shown below in Figure 2.
1 2 3 4 5
1. N8
2. N12 SMALL
3. N12 BIG
4. N15 SMALL
5. N15 BIG
Figure 2: Multiple gel electrophoresis experiments performed with digested phage DNA using different restriction enzymes to generate a more accurate fragment profile between samples. The agarose gel used with the EcoRI and EcoRV digests was of 1% agarose concentration in 50% TBE buffer, the PvuII and XbaI digests was of 0.7% agarose concentration in 50% TBE buffer, and the BglI and KpnI digests was of 1% agarose concentration in 50% TBE buffer. By
1 2 3 4 5 6 7 8 9 10 1. N8 + BglI
2. N12 SMALL + BglI
3. N12 BIG + BglI
4. N15 SMALL + BglI
5. N15 BIG + BglI
6. N8 + KpnI
7. N12 SMALL + KpnI
8. N12 BIG + KpnI
9. N15 SMALL + KpnI
1. N8 + PvuII
2. N12 SMALL + PvuII
3. N12 BIG + PvuII
4. N15 SMALL + PvuII
5. N15 BIG + PvuII
6. N8 + XbaI
7. N12 SMALL + XbaI
8. N12 BIG + XbaI
J 1 2 3 4 5 6 7 8 9 10
1. N8 + EcoRI
2. N12 SMALL + EcoRI
3. N12 BIG + EcoRI
4. N15 SMALL + EcoRI
5. N15 BIG + EcoRI
6. N8 + EcoRV
7. N12 SMALL + EcoRV
8. N12 BIG + EcoRV
9. N15 SMALL + EcoRV
J 1 2 3 4 5 6 7 8 9 10
23,130 bp - 9,416 bp - 6,557 bp - 4,361 bp -
2,322 bp - 2,027 bp -
23,130 bp - 9,416 bp - 6,557 bp - 4,361 bp -
2,332 bp - 2,027 bp -
23,130 bp - 9,416 bp - 6,557 bp - 4,361 bp -
2,322 bp - 2,027 bp -
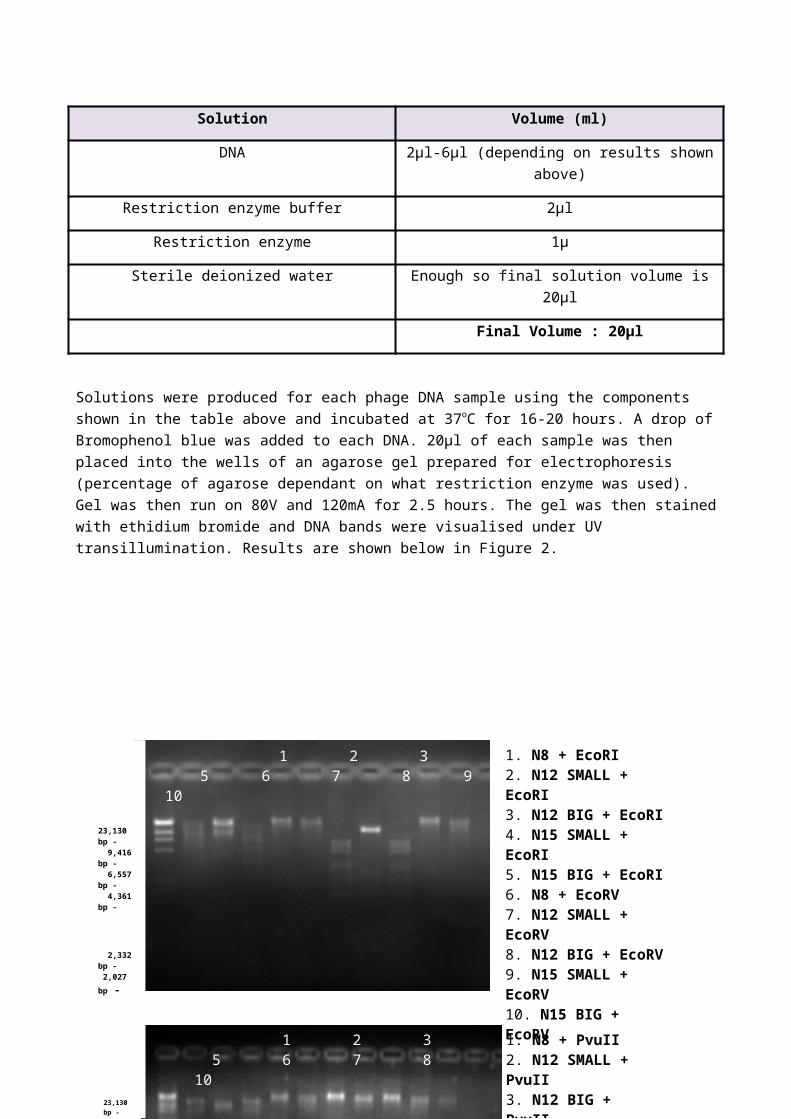
comparing the fragment profile of each sample when digested with each restriction enzyme it was possible to identify whether they were genetically similar or not. From these digests it can be seen that N8 and N12 big are genetically similar, N15 small and N15 big are genetically similar and N12 small is not genetically similar to any of the other DNA samples.
Pulse Field Gel Electrophoresis (PFGE)
1% Seakem gold agarose was prepared in 50% TBE buffer and stored at 50-54oC in a heating block whilst purified phage suspension was prepared. 50 µl of purified phage suspension was removed into a sterile tube and 450µl of the 1% Seakem gold agarose was added to it. Plug moulds were prepared using the phage/agarose solution which, when solidified, were transferred into 3ml of Lysis Buffer (0.5M EDTA pH8, 10mM Tris pH8, 1%SDS, 0.2mg/ml Proteinase K) and incubated overnight at 55oC. Plugs were then washed 5-6 times in TE buffer at room temperature and then loaded onto a 1% agarose gel in 50% TBE buffer at 14oC for 17 hours, using a Gene NavigatorTM system with pulse times of 12-50s, at 6V/cm (phase1 N/S 12s, E/W 12s for 10 hours; phase 2: N/S 50s, E/W 50s for 7hours). The gel was then stained with ethidium bromide and DNA bands were visualised under UV transillumination.
Results are shown in Figure 3.
Figure 3: This image was captured after PFGE on complete, undigested bacteriophage DNA samples. 1-5 are new samples whilst 6-10 are samples that had previously been tested, and are there for comparison. PFGE alternates the direction of the current applied, unlike conventional electrophoresis (southern blot) which runs in one direction, and therefore provides greater resolution of DNA bands over a longer time. From this image we can see that in the previous sample 6 and 8 were of similar size, sample 9 and 10 were of similar size, and sample 7 was contaminated since two differing bands of DNA were shown. From the work no band was shown for sample 2 meaning there was insufficient DNA in the sample and it is unknown if this sample is still contaminated. Sample 5 also had insufficient DNA. Samples 1 and 3 are genetically similar in size as shown previously.
1. N8
2. N12 SMALL
3. N12 BIG
4. N15 SMALL
5. N15 BIG
6. N8
7. N12 SMALL
8. N12 BIG
9. N15 SMALL
1 2 3 4 5 6 7 8 9 10