Embed Size (px)
Citation preview

EN EN
EUROPEAN COMMISSION
Brussels, 26.2.2016 SWD(2016) 86 final
COMMISSION STAFF WORKING DOCUMENT
Country Report Malta 2016
This document is a European Commission staff working document. It does not constitute the official position of the Commission, nor does it prejudge any such position.
Executive summary
1. Scene setter: Economic situation and outlook
2. Structural issues
2.1 Taxation, quality of public finances and long-term fiscal sustainability 132.2. Labour market, education and skills and social aspects2.3. Business environment and competitiveness
A. Overview Table
B. MIP scoreboard
C. Standard Tables
LIST OF TABLES1.1. Selected financial stability indicators for core domestic banks1.2. Key economic, financial and social indicators2.3.1. Key research and innovation intensity indicatorsB.1. MIP scoreboard - MaltaC.1. Financial market indicatorsC.2. Labour market and social indicatorsC.3. Labour market and social indicators (continued)C.4. Structural policy and business environment indicatorsC.5. Green growth
LIST OF GRAPHS1.1. Contributions to real GDP growth1.2. Sectoral contributions to growth of gross value added, 4-quarter moving sums1.3. Contributions to HICP inflation1.4. Harmonised unemployment rate, seasonally-adjusted1.5. Underlying current account balance1.6. Trade balance, selected items1.7. Breakdown of the rate of change of nominal unit labour costs1.8. Total assets of financial intermediaries2.1.1. VAT gap
CONTENTS

2.1.2. Use of payment instruments by volume2.1.3. Use of payment instruments by value2.1.4. Total primary expenditure at current prices, selected EU countries2.1.5. Current primary expenditure at current prices, selected EU countries2.1.6. Total expenditure at current prices by category2.1.7. Gross fixed capital formation, selected EU countries2.1.8. Other capital expenditure, including capital transfers, selected EU countries2.1.9. Components of total age-related expenditure2.1.10. Health care expenditure under different scenarios, 2013-20602.2.1. Activity rates in Malta and EU, aged 20-64, by gender2.2.2. Activity rates, % of population group2.2.3. Distribution of educational attainment among population aged 25-64, 20142.2.4. Forecast job opportunities by level of qualification 2013-20152.2.5. Distribution of teachers by age group at different education levels, 20122.2.6. Severe material deprivation2.2.7. Average monthly housing costs and severe material deprivation2.3.1. Electricity supply by source2.3.2. Electricity tariffs for medium-sized industries2.3.3. Responsiveness of the public administration to the needs of SMEs (standard
deviations, EU average = 0)2.3.4. Malta ranking in Doing Business report
LIST OF BOXES1.1. Investment challenges1.2. European structural and investment funds

This country report assesses Malta’s economy in light of the Commission’s Annual Growth Survey published on 26 November 2015. The survey recommends three priorities for the EU's economic and social policy in 2016: re-launching investment, pursuing structural reforms to modernise Member States’ economies, and responsible fiscal policies.
Economic performance has been robust over the recent years. The economy has demonstrated notable resilience in a challenging macroeconomic environment over the past several years. Real GDP growth recovered relatively quickly following the 2009 recession and in 2015 it exceeded the pre-crisis peak. Household consumption and net exports have been the main engines of growth. One-off large-scale projects in the energy sector and the finalisation of EU-funded projects boosted investment in 2014-2015, thus also contributing strongly to the expansion of the economy. Real GDP growth is projected to moderate somewhat after 2015, but to remain higher than the long-term average. As a result of the robust economic performance, Malta’s GDP per capita is projected to reach 97% of the EU average in 2017. Risks to the medium-term macroeconomic outlook are broadly balanced. Downside risks related to trade shocks are mitigated by competitiveness gains from the successful completion of ongoing structural reforms.
Growth has been job-rich and broad-based. Economic growth has been underpinned by the improved competitiveness of some traditional sectors as well as the emergence of new labour-intensive, export-oriented activities. As a result, the amount of new jobs generated in the post-crisis period is significantly higher than during the boom until 2008. This has been supported by policies targeted in particular towards attracting more women to the labour market. The process of diversification of the economy has reduced its capital and import intensity, contributing to a significant improvement in the external trade balance.
The favourable macroeconomic conditions have contributed to an improvement in public finances, although faster correction would reduce risks from the inherent vulnerabilities. The general government budget deficit has decreased in recent years thanks to strong revenue growth. However, current expenditure has been growing faster than potential growth, which could
create problems in case of shocks to tax revenues. Primary budgetary surpluses and strong economic growth helped the general government debt-to-GDP ratio to fall. However, moderation in economic growth would make further debt reduction more challenging. Sustainability challenges remain in view of the projected increase in age-related budgetary costs. The limited investor base for the government somehow shields it from volatility on international financial markets. However it also implies a lack of diversification and significant spillover risks between different domestic sectors.
Maintaining competitiveness to support the current growth momentum is a continuous challenge. The potential of human capital to contribute to economic growth remains to be fully tapped. Notwithstanding significant progress in recent years, labour market activity remains low, in particular among women. Education and training outcomes are still below targets, affecting the quality of labour supply. Furthermore, inefficiencies in network industries, the public administration and the judicial system hinder the business environment. Declining investment reflects the changing structure of the economy but also a still nascent research and innovation framework as well as limited access to finance for some parts of the economy.
Overall, some progress has been made in addressing the 2015 country-specific recommendations. The authorities have taken steps to improve the professional development of teachers. This is expected to contribute to raising basic skills levels and to reducing early-school leaving in the long-run, but it is too early to assess the results. A number of initiatives for access to finance have been offered to small and medium-sized enterprises, but access to non-bank instruments generally remains limited. While the authorities have recognised the need to ensure the long-term sustainability of the pensions system and indicated intentions to introduce measures to that effect, concrete steps have not yet been proposed.
Regarding the progress in reaching the national targets under the Europe 2020 Strategy, Malta has made good progress towards its targets on employment, reducing greenhouse gases, while more effort is needed on R&D expenditure, increasing renewable energy, improve energy
1
EXECUTIVE SUMMARY

efficiency, reduce early school leaving, increasing the tertiary education, and reducing poverty.
The main findings of the analysis in this report, and the related policy challenges, are as follows:
External sustainability has improved benefitting from the restructuring of the economy. The emergence of export-oriented services has boosted net external trade, resulting in a surplus in the current account balance. The net international investment position remains positive. Cost competiveness developments have also been favourable on the back of growing productivity and moderate wage growth.
The public debt ratio is lower than the euro area average and it is approaching the 60 %-of-GDP threshold, but the sustainability of public finances remains a challenge in the long run. The public debt ratio has been on a decreasing path since 2011 on the back of fiscal consolidation and high nominal GDP growth. There appear to be no significant risks in the short and medium term. Yet, long-term sustainability remains a challenge reflecting the budgetary impact of ageing costs, in particular pensions. The efforts by the authorities in containing the long-term expenditure growth in the pension and healthcare systems so far do not appear sufficient to address this risk. The growth of primary current expenditure, exceeding the increases in potential GDP, and the still high level of contingent liabilities present additional challenges to the sustainability of public finances.
There is still untapped potential in the labour market to foster economic growth. With one of the lowest unemployment rates in Europe, the Maltese labour market continues to perform strongly. However, in spite of the gains over the past years, activity rates continue to be among the lowest in the EU, particularly among women. The supply of skills has not fully adjusted to labour market requirements. To offset this, reliance on supply of skills through foreign labour has increased in recent years. The authorities have been investing significantly in the education and
training system in recent years. This notwithstanding, education and training outcomes are still below targets, perpetuating the low skills levels in the population.
Malta is still away from its 2020 poverty-reduction target. The risk of poverty and social exclusion increased from 2008 to 2013, most notably for children and the low skilled. Material deprivation has been on the rise and has contributed to the poverty and exclusion risks. New measures have been introduced in recent years to correct these trends.
Access to alternative sources of finance for SMEs is still limited. SMEs rely heavily on debt financing, with implications for the firm indebtedness in the economy. The availability of alternative sources of finance such as crowdfunding, venture capital, business angels is not developed. Since the beginning of 2014, the government put forward policies geared to the provision of equity and venture capital, but these measures appear to be relatively limited, concentrating on tax credits and small amounts for seed funding. Nevertheless, on the whole, SMEs benefit from a better financing environment than many EU peers.
Competitiveness could further benefit from the removal of structural bottlenecks in network industries and the public administration. The authorities aim to diversify the energy mix and bring an end to oil dependency in electricity generation. The reform, however, has yet to be finalised. Import dependency will remain a challenge in the absence of more focused efforts on boosting domestic production of renewable energy and raising energy efficiency. The transport system continues to be characterised by high economic costs caused by significant road traffic congestion. The authorities have yet to present their strategy to tackle the issue. The low efficiency of government administration and of the judicial system continues to pose challenges to Malta’s attractiveness to investors. A relatively young and underdeveloped framework for research and innovation constrains the potential for knowledge-driven growth.
2

Executive summary
Apart from one-off projects, investment has been muted reflecting structural changes in the economy and bottlenecks. Ongoing large-scale projects result in a significant boost to investment over the underlying trend. The increasing importance of less capital-intensive services sectors, however, lowers the investment needs of the economy going forward. Nevertheless, bottlenecks in the public administration, insufficient capacity to innovate and skills mismatches lower Malta’s attractiveness to foreign investors and hamper the ability of businesses to investment.
3

Economic growth and inflation
Economic growth is expected to accelerate further in 2015. After the rebound in 2010, real GDP growth has picked up in recent years. It rose from 2.1 % in 2011 to 3.5 % in 2014 and is projected to have increased further in 2015. The main drivers of growth are the strong upturn in machinery and equipment investment on the back of a number of large-scale projects, and investment in EU-funded projects. As a share of GDP, investment bounced back strongly in 2015 but is forecast to resume its downward trend thereafter and fall below its long-term average. Compared to the pre-crisis period, real growth increased from an average 2.7 % in the period 2004-2008 to 3.3 % in 2010-2014, and it is projected to pick up further to 4 % in 2015-2017.
Graph 1.1: Contributions to real GDP growth
-6
-4
-2
0
2
4
6
06 07 08 09 10 11 12 13 14 15f 16f 17f
pps
Output GapChanges in inventories / valuablesNet exportsDomestic demandReal GDP (y-o-y%)
forecast
Source: European Commission
Economic activity is increasingly reliant on the services sector. The share of industry in the gross value added has shrunk by around half since Malta joined the EU. The importance of construction activities has also declined considerably. These sectors have been replaced by activities such as gaming, financial services and legal and accounting services. These activities have become the new engine of growth in the Maltese economy, supported by the traditionally strong tourism and retail and wholesale trade sectors as well as public services (see Graph 1.2).
Potential growth has exceeded the levels of the period before the crisis, when potential output growth averaged 2.5 % between 2004 and 2008. According to the most recent estimate, based on the Commission’s 2016 winter forecast, potential growth is projected to exceed 4 % in 2015 and to average 3.9 % in 2015-2017, pushed by gains in total factor productivity and sustained increases in employment.
Graph 1.2: Sectoral contributions to growth of gross value added, 4-quarter moving sums
-2
-1
0
1
2
3
4
Indu
stry
, exc
l con
stru
ctio
n
Con
stru
ctio
n an
d re
al e
stat
e
Mar
keta
ble
serv
ices
, exc
l tra
de
Ret
ail a
nd w
hole
sale
trad
e
Pub
lic s
ervi
ces
pps
2001q1-2003q4 2004q1-2008q4 2010q1-2015q3
Source: European Commission
The macroeconomic risks are balanced in the medium-term. Being a very small and very open economy, Malta is naturally exposed to disruptions in the global macroeconomic and, in particular, the trade outlook. These inherent risks are to some extent mitigated by the increased reliance on exports of services, the demand for which has proven relatively resilient. The risk outlook is balanced by upside risks related to competitiveness gains that could result from the ongoing structural reforms, such as those in the energy sector (see Section 2.3), the labour market (section 2.2) and the judicial system (section 2.3). This underscores the importance of avoiding delays in the implementation of reforms in order to bolster the resilience of the domestic economy. Risks from tensions in international financial markets appear limited due to the relative insulation of the domestic financial system. The institutions that have international market exposure have limited
4
1. SCENE SETTER: ECONOMIC SITUATION AND OUTLOOK

1. Scene setter: Economic situation and outlook
links with the domestic economy. Nevertheless, ensuring the stability of the domestic financial system is crucial given that it is the main source of financing for the government and domestic businesses.
Deflationary pressures are not as pronounced as in the rest of the EU. Price inflation bottomed out at 0.8 % in 2014, reflecting the reduction in electricity tariffs, and has been gradually increasing since (see Graph 1.3). The harmonised index of consumer prices (HICP) in Malta outpaced that in the euro area in 2015 mainly due to higher growth in food prices. Overall inflation in Malta is projected to remain faster than in the rest of the euro area and reach 2.1 % in 2017, still below its long-term average.
Graph 1.3: Contributions to HICP inflation
-1
0
1
2
3
4
09 10 11 12 13 14 15f 16f 17f
pps
ServicesProcessed food (incl. beverages and tobacco)Unprocessed foodEnergyNon-energy industrial goodsHICPCore inflation
forecast
Source: European Commission
Labour market
The labour market has shown remarkable resilience throughout the crisis and is among the most dynamic in the EU. The pace of job creation remained sustained between 2010 and 2014 and reached 4.5 % in 2014, the highest in the Union. Employment expanded by 1.9 % year-on-year during the third quarter of 2015, following a 1.3 % increase in the previous quarter. The employment rate reached 69.2 % in the third quarter of 2015. The active population continues to grow steadily mainly thanks to increased female activity, but also reflecting the impact of foreign
labour (see Section 2.2). In the third quarter of 2015 the activity rate of women was at 57.8 %, which means an increase by 1 percentage point from the previous quarter and a 1.5 percentage points increase compared with the third quarter a year earlier. The resilience of the Maltese labour market during the European economic downturn can be attributed to a combination of economic and labour market policies and a prudent approach to wage-bargaining at company level, which helped to keep wage pressures contained and the employment rate growing. Moreover, social dialogue is well established with the Malta Council for Economic and Social Development facilitating discussion between the government, social partners and civil society on strategic documents, draft legislation and key issues related to policies and employment conditions. The outlook for employment growth over the coming years remains positive, though a slowdown in the pace of job creation is expected, in line with GDP projections.
The unemployment rate dropped to 5.1 % at the end of 2015, but low labour market participation and skills supply remain important issues. An increasing number of unemployed persons have made the transition to employment. Combined with a rising labour force, reflecting also an influx of foreign labour, this implies a job-rich growth pattern. As a result, the unemployment rate fell to record-low levels in 2015 (see Graph 1.4) and is expected to remain broadly unchanged in the coming years. Furthermore, the unemployment rate in Malta has remained notably lower and more stable than the euro-area average. Still, the overall activity rate remains low in a comparative perspective. The main reason is the low labour market participation of women which, despite continuous increases, remains far below the EU average. Moreover, the Maltese population is considerably less qualified than the EU average, which can result in skill shortages. In turn, this could present an obstacle to economic growth going forward. Low participation of women and low skills attainment are important factors of the risk of poverty in Malta. The risk of poverty of single earner households (medium work intensity) has increased from 14 % in 2008 to 20 % in 2014, while it remained stable for working households overall at around 5.5 %. The at-risk of poverty and social exclusion rate of the low skilled
5

1. Scene setter: Economic situation and outlook
increased from 23.6 % to 30.1 % during the same period.
Graph 1.4: Harmonised unemployment rate, seasonally-adjusted
0
2
4
6
8
10
12
14
Jan-
00Ja
n-01
Jan-
02Ja
n-03
Jan-
04Ja
n-05
Jan-
06Ja
n-07
Jan-
08Ja
n-09
Jan-
10Ja
n-11
Jan-
12Ja
n-13
Jan-
14Ja
n-15
%
EU Euro area Malta
Age 15 and overSource: European Commission
Sustainability of the external position
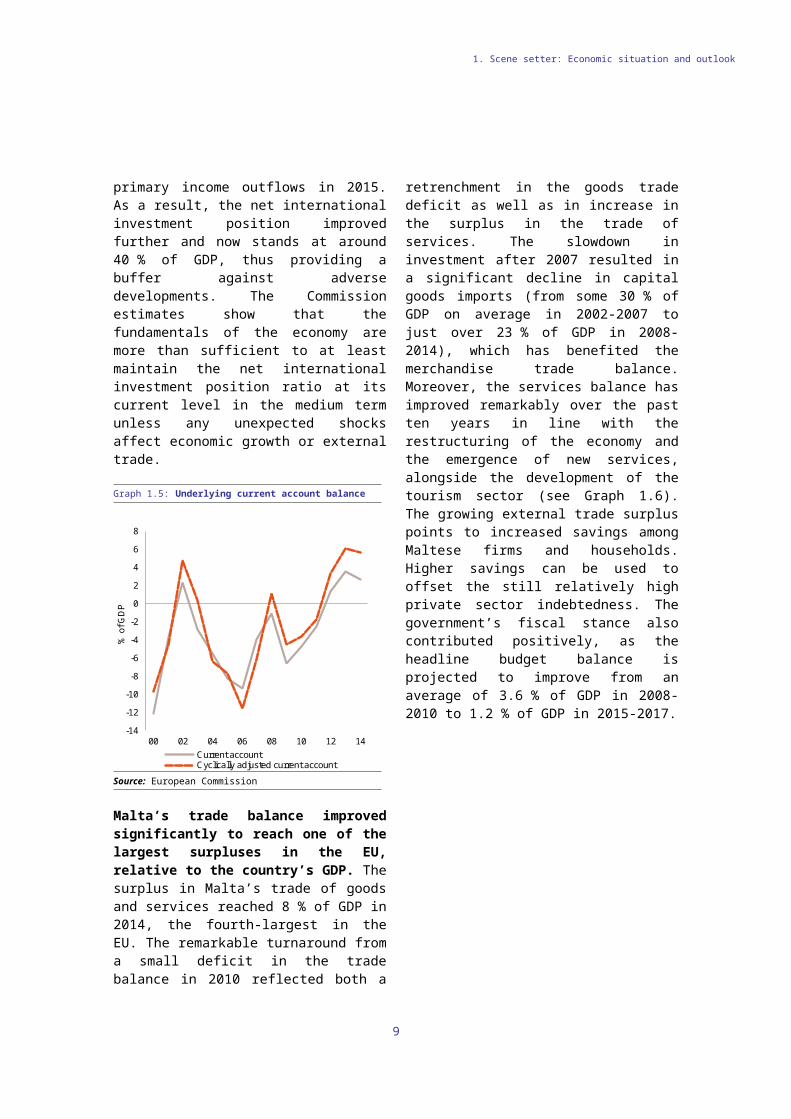
The current account balance has corrected sharply to a position of sizeable surplus. Following a period of persistent deficits, the current account balance has corrected sharply since 2011 to reach a surplus position of over 8 % of GDP for the 12 months ending in the third quarter of 2015. This sharp improvement is the result of significant gains in the services account, thanks in particular to positive developments in the gaming and tourism sectors. After adjusting for the effects of the cycle, Malta’s current account surplus is even higher (see Graph 1.5). The economy’s external balance was also positively affected by a significant retrenchment in primary income outflows in 2015. As a result, the net international investment position improved further and now stands at around 40 % of GDP, thus providing a buffer against adverse developments. The Commission estimates show that the fundamentals of the economy are more than sufficient to at least maintain the net international investment position ratio at its current level in the medium term unless
any unexpected shocks affect economic growth or external trade.
Graph 1.5: Underlying current account balance
-14
-12
-10
-8
-6
-4
-2
0
2
4
6
8
00 02 04 06 08 10 12 14
% o
f GD
P
Current accountCyclically adjusted current account
Source: European Commission
Malta’s trade balance improved significantly to reach one of the largest surpluses in the EU, relative to the country’s GDP. The surplus in Malta’s trade of goods and services reached 8 % of GDP in 2014, the fourth-largest in the EU. The remarkable turnaround from a small deficit in the trade balance in 2010 reflected both a retrenchment in the goods trade deficit as well as in increase in the surplus in the trade of services. The slowdown in investment after 2007 resulted in a significant decline in capital goods imports (from some 30 % of GDP on average in 2002-2007 to just over 23 % of GDP in 2008-2014), which has benefited the merchandise trade balance. Moreover, the services balance has improved remarkably over the past ten years in line with the restructuring of the economy and the emergence of new services, alongside the development of the tourism sector (see Graph 1.6). The growing external trade surplus points to increased savings among Maltese firms and households. Higher savings can be used to offset the still relatively high private sector indebtedness. The government’s fiscal stance also contributed positively, as the headline budget balance is projected to improve from an average of 3.6 % of GDP in 2008-2010 to 1.2 % of GDP in 2015-2017.
6

1. Scene setter: Economic situation and outlook
Graph 1.6: Trade balance, selected items
-30
-10
10
30
50
04 05 06 07 08 09 10 11 12 13 14
% o
f GD
P
Other servicesPersonal, cultural and recreationalOther business servicesFinancialTravelGoods and servicesServices
Source: National Statistical Office
Competitiveness
Cost competitiveness developments have been favourable. Wage growth was flat in 2013 and 2014, following several years of considerable growth. Thus, the wage level remains substantially lower than in the EU average. Growth in nominal unit labour costs has moderated and has moved in line with the euro area average in recent years (see Graph 1.7). Unit labour costs are projected to accelerate in 2016-2017 as productivity growth moderates, while the labour market tightness puts some upward pressure on wage developments. The ongoing shift and diversification of economic activities towards more labour-intensive activities increased the share of labour in total costs (1). This makes growth in unit labour costs more sensitive to wage developments rather than productivity. This has helped to offset the risks associated with the observed productivity slowdown in recent years. In line with this, overall the competitive strength of the Maltese economy has improved with a projected continuation of job growth, particularly in knowledge intensive sectors such as health, ICT and finance.
1 ()Micallef, B. (2015), Unit Labour Costs, Wages and Productivity in Malta: A Sectoral and Cross-Country Analysis. Central Bank of Malta, Policy Note: August 2015.
Graph 1.7: Breakdown of the rate of change of nominal unit labour costs
-10
-8
-6
-4
-2
0
2
4
6
8
00 01 02 03 04 05 06 07 08 09 10 11 12 13 14 15f 16f 17fR
ate
of c
hang
e y-
o-y
(%)
Inflation (GDP deflator growth)Real Compensation per EmployeeProductivity Contribution (negative sign)Nominal unit labour costULC in Euro Area
Source: European Commission
While economic activity has been strong, persistent structural weaknesses continue to hinder Malta’s growth potential. Significant traffic congestion increases the cost of doing businesses. The energy system was for a long time a drag on competitiveness arising from Malta’s isolation from mainland Europe. The near-full dependence on imported oil and network inefficiencies resulted in high electricity tariffs for the industry, while not fully reflecting costs and thus leading to the accumulation of significant debts at the state power utility company. Recent policy measures, however, have aimed to remedy these shortcomings. EY’s attractiveness survey (2) and the Global Competitiveness Report (3) both indicate excessive or inefficient public administration as the most problematic factor for doing business and investing. The inefficiency of the judicial system, particularly as regards insolvency procedures, is among the parts of the administration that warrant particular attention. These structural issues are explored in detail in Section 2.3.
Financial sector
The Maltese economy is characterised by the presence of a very large, mainly internationally-oriented financial sector. A defining 2 ()See http://www.ey.com/MT/en/Home/EY-2015-malta-
attractiveness-survey-malta-as-an-fdi-destination 3 ()See http://reports.weforum.org/global-competitiveness-
report-2015-2016/
7

1. Scene setter: Economic situation and outlook
characteristic of the Maltese financial sector is that only a small portion of its relatively large size provides services to resident economic agents, while the internationally-oriented institutions have minimal or no links with the domestic economy. The total assets held by commercial banks, insurance companies and investment funds peaked at 1 074 % of GDP in 2012 and have declined thereafter to EUR 73 billion, i.e. 861 % of GDP in June 2015 (see Graph 1.8). This mainly reflected developments in the banking sector, where the internationally-oriented banks have started to contract their balance sheets. Moreover, due to the negative developments on the international stock markets, investment funds’ assets have declined from 186 % of GDP in 2012 to 113 % in June 2015. These developments have been partly offset by growth in insurance corporations, which have increased in size, their assets reaching 160 % of GDP in mid-2015, in comparison to 144 % in 2012 (see Graph 1.8). Preparation for the entry into force of the Solvency II regime (4) in January 2016 has been a challenge for the industry, but the supervisor and market participants have indicated confidence in the general readiness of the sector (5).
Customer confidence in the core domestic banks remained strong, which has translated into increased levels of liquidity. Resident deposits have increased persistently over the last years and reached EUR 15.9 billion in October 2015, up from EUR 12 billion in December 2012. During the same period, the stock of loans to residents has remained practically flat. As a result, the loan-to-deposit ratio of the core domestic banks fell to below 60 %, well below the euro area average. The lack of credit expansion does not mean that credit to the private sector is constrained. In fact, flows of new credit are available, as otherwise the natural loan amortisation would have led to credit contraction. Nevertheless, increased risk perception and still-tight credit standards, in a context of low interest rates as a result of monetary policy, result in banks preferring not to lock their liquidity inflows to risky and longer-term projects. Asset quality presents a challenge, as the ratio of 4 ()Directive 2009/138/EC of the European Parliament and
of the Council of 25 November 2009 on the taking-up and pursuit of the business of Insurance and Reinsurance (Solvency II).
5 ()Malta Risk & Insurance Report 2015, Commercial Risk Europe.
non-performing loans remains high, resulting in high provisioning costs (6). As a result, banks’ profitability has gone down compared to 2011-2012. Nevertheless, the return on equity remains quite high, indicating that the core banks are still capable of generating robust profits (see Table 1.1). Banks’ profit generation capacity and their regulatory Tier 1 capital ratio provide a safety cushion against adverse developments, even if the ratio is not particularly high by international standards.
Graph 1.8: Total assets of financial intermediaries
0
10
20
30
40
50
60
10 11 12 13 14 Jun-15
billi
on E
UR
Insurance corporations Investment funds
Commercial banks
Source: Central Bank of Malta
Table 1.1: Selected financial stability indicators for core domestic banks
2011 2012 2013 2014 2015H1Return on assets 0.98 1.05 1.11 0.71 0.85Return on equity 15.08 15.46 15.27 9.83 11.99Non-performing loans to gross loans 7.10 7.75 8.95 9.05 8.61Tier I capital ratio 11.82 12.12 12.88 11.55 11.53
Source: Central Bank of Malta
6 ()Nevertheless, the improvement in Malta’s macroeconomic conditions caused the level of non-performing loans to decline in 2015.
8
1. Scene setter: Economic situation and outlook
Box 1.1: Investment challenges
Macroeconomic perspective
Total investment generally has been following a declining trend since 2007. Private investment declined more strongly than in the rest of the euro area, while government investment remained relatively stable. Private investment is projected to recover in 2015-2017 as the result of improving economic conditions in the euro area. A number of large one-off projects in the energy sector, as well as the finalisation of projects funded by the 2007-2013 EU financial framework give an additional boost to investment, in particular in 2015.
The decline in investment after 2008 reflected the slowdown of the residential construction sector, following a period of rapid growth. Moreover, the sector is still struggling with the legacy of elevated indebtedness and bad investments. In turn, the recovery in recent years has been driven by non-residential investment, in particular large-scale infrastructure projects by both the public and the private sectors. Historically, the share of construction investment in GDP has been lower than the euro-area average, reflecting the limited physical space on the Maltese islands. Investment in intellectual property products is also lower than in the rest of the euro area, although some convergence has been observed in recent years. At the same time, following a dip in 2008-2009, equipment investment remained resilient, exceeding the euro-area average.
Graph 1: Public and private investment as % of GDP, Malta and the euro area
Source: European Commission 2016 winter forecast
Investment activity in the Maltese economy is affected by structural changes in the economy. Market services have been gradually gaining importance over the past ten years at the expense of the industry and construction sectors. In particular, nearly half of the increase in gross value added since 2004 is accounted for by financial and insurance activities; professional, scientific and technical activities; administrative and support service activities; and arts entertainment and recreation (circled in Graph 3), which are among the least capital-intensive sectors in the economy.
Assessment of barriers to investment and ongoing reforms (1)
Despite improvements in recent years, certain barriers to investment persist (2). The friendliness of the business environment receives a mediocre score in the World Bank's Doing Business indicators, particularly
(1) http://ec.europa.eu/europe2020/pdf/2016/ags2016_challenges_ms_investment_environments_en.pdf (2) http://ec.europa.eu/europe2020/pdf/2016/ags2016_challenges_malta_en.pdf
Box (continued)
in the areas of starting a business, registering property, resolving insolvency and dealing with construction permits. Additional problems include difficulties in obtaining financing for research, development and innovation as well as skills bottlenecks. These barriers are explored in more detail in sections 2.2 and 2.3.
Graph 3: Public and private investment as % of GDP, Malta and the euro area The public administration still harbours
inefficiencies. Particular problems include the costs of enforcing contracts and the licensing and permit systems, government administration and lengthy insolvency procedures. In many areas the authorities have initiated measures to address inefficiencies, but they have still to be brought to fruition and their impact remains to be seen. In the area of construction, excessively long administrative procedures and difficult access to financing hinders investment in renewing the building stock.
Source: European Commission The insufficient capacity to innovate is seen as one of the most problematic factors in doing business and attracting investment. Key challenges to be tackled include a weak human resources base in science and technologies and the lack of critical mass in specific research areas. Strengthening linkages between the academic and the private sector for effective knowledge transfer is essential, as well as investing more in academic research. Another challenge is the lack of research and innovation investments to develop marketable products and services, and the need to improve the product market regulation (3). Intellectual property is recognised as key to innovation and reforms are currently ongoing in this area. The government has also approved amendments to patent legislation. Evidence from a recent study (4) suggests that there is some scope to reduce the fragmentation and overlap of R&D tax instruments. The capacity to innovate is hindered by lack of alternative forms of financing.
Vacancy bottlenecks have been identified across the entire skills spectrum. The inability to match certain job vacancies with available labour supply is particularly visible within the highly-skilled occupations, namely in the health care, the financial and the information, communication and technologies sectors. Within lower-skilled occupations, the hospitality and tourism sectors are the most affected. A substantial inflow of foreign workers is helping to fill in the gap. Malta is also introducing relevant measures to overcome the challenge and they may have a positive impact in a longer term. Work on establishing a Skills Council is ongoing and a more centralised comprehensive approach to skills forecasting is being developed. The provision of vocational education and training and the apprenticeship scheme are being strengthened. (3) Doing business. Measuring Regulatory Quality and Efficiency 2016, World Bank (4) CPB (2014) A Study on R&D Tax Incentives, Taxation Papers, Working Paper No 52 – 2014 European Commission
0%
10%
20%
30%
40%
50%
60%
-100% 0% 100% 200% 300% 400%
Economy average
Growth in gross value added
Inve
stm
enta
s %
of G
DP
9

1. Scene setter: Economic situation and outlook
Box 1.2: Contribution of the EU Budget to structural change
Malta is an important beneficiary of European Structural and Investment Funds (ESIF) with EUR 828 million available for the period 2014-2020. This is equivalent to 1.3% of GDP (on an annual basis) and 34.7% of the expected national public investment in areas supported by the ESIF.
A number of reforms had to be implemented to satisfy ex-ante conditionalities and ensure that the Cohesion policy contributes to an effective delivery of the Europe 2020 objectives and targets. Reforms in the transport sector are still pending, for which an action plan scheduled to be completed during 2015 is delayed and is now expected to be completed in 2016. Where ex-ante conditionalities are not fulfilled by end 2016, the Commission may suspend interim payment to the priorities of the programme concerned.
The programming of the Funds was based on priorities and challenges identified in recent years in the context of the European Semester, for instance in relation to CSRs on addressing the labour-market relevance of education and training, improving the labour-market participation of women and diversifying the energy mix by increasing the share of energy produced from renew able sources. Regular monitoring of implementation includes reporting in mid-2017 on the contribution of the funds to Europe 2020 objectives and progress in addressing relevant structural reforms to maximise the use of EU financing (notably in R&DI, climate change, labour market, education and social areas).
Financing under the new European Fund for Strategic Investments (EFSI), Horizon 2020, the Connecting Europe Facility and other directly managed EU funds would be additional to the ESIF. Following the projects under the Connecting Europe Facility, Malta has signed agreements for EUR 39 million for transport projects. For more information on the use of ESIF in Malta, see:
10

1. Scene setter: Economic situation and outlook
Table 1.2: Key economic, financial and social indicators
2003-2007 2008 2009 2010 2011 2012 2013 2014 2015 2016 2017Real GDP (y-o-y) 2.5 3.3 -2.5 3.5 2.0 2.9 4.0 4.1 4.9 3.9 3.4Private consumption (y-o-y) 3.5 -0.2 1.8 -0.2 3.0 -0.2 2.0 2.8 4.0 3.4 2.6Public consumption (y-o-y) 1.4 12.3 -3.3 1.6 3.8 6.3 0.2 7.8 2.5 4.9 6.3Gross fixed capital formation (y-o-y) 11.7 -9.2 -11.8 26.4 -18.3 1.4 -0.2 7.6 19.1 -2.6 1.0Exports of goods and services (y-o-y) 6.0 19.4 -0.4 6.9 2.3 6.7 0.8 0.0 2.7 4.5 4.8Imports of goods and services (y-o-y) 7.2 19.5 0.3 7.6 -0.2 5.2 -0.8 -0.1 3.7 3.5 4.7Output gap 0.5 2.2 -2.2 -1.3 -1.3 -1.0 -0.1 0.3 1.0 0.9 0.6Potential growth (y-o-y) 2.5 2.4 1.9 2.6 2.0 2.6 3.1 3.6 4.2 3.9 3.7
Contribution to GDP growth:Domestic demand (y-o-y) 4.0 0.0 -1.9 5.0 -1.5 1.4 1.2 4.4 6.1 2.2 2.8Inventories (y-o-y) -0.2 3.4 0.6 -0.2 -0.3 -1.1 0.2 -0.4 0.0 0.0 0.0Net exports (y-o-y) -1.3 0.0 -1.1 -1.2 3.8 2.7 2.6 0.1 -1.2 1.7 0.6
Contribution to potential GDP growth:Total Labour (hours) (y-o-y) 0.4 0.9 0.8 0.5 0.4 0.9 1.2 1.4 1.4 1.4 1.2Capital accumulation (y-o-y) 1.3 1.1 0.7 1.3 0.5 0.5 0.5 0.7 1.2 1.0 1.0Total factor productivity (y-o-y) 0.8 0.4 0.5 0.8 1.0 1.2 1.4 1.5 1.6 1.6 1.5
Current account balance (% of GDP), balance of payments -4.7 -1.1 -6.6 -4.7 -2.4 1.3 3.6 3.0 . . .
Trade balance (% of GDP), balance of payments -1.7 0.7 -1.2 -0.6 2.5 4.8 7.1 7.1 . . .Terms of trade of goods and services (y-o-y) 0.4 -0.5 -0.1 1.1 -0.1 -0.3 0.4 0.7 0.0 0.3 0.2Capital account balance (% of GDP) 2.3 0.4 1.2 2.0 1.2 1.9 1.7 1.7 . . .Net international investment position (% of GDP) 30.8 4.2 12.6 12.1 7.9 21.2 20.4 34.6 . . .Net marketable external debt (% of GDP)1 76.5 45.4 70.5 202.4 199.3 247.5 208.7 208.1 . . .Gross marketable external debt (% of GDP)1 454.0 724.3 717.9 679.0 701.8 690.9 665.6 706.1 . . .Export performance vs. advanced countries (% change over 5 years) . 23.4 58.1 49.1 27.7 24.6 6.2 -12.00 . . .Export market share, goods and services (y-o-y) -0.4 14.0 17.2 -11.0 -4.3 -1.7 -0.3 -1.3 . . .Net FDI flows (% of GDP) -155.4 14.4 -88.1 -68.3 -135.4 -126.6 -91.9 -84.4 . . .
Savings rate of households (net saving as percentage of net disposable income) . . . . . . . . . . .
Private credit flow (consolidated, % of GDP) 9.8 15.6 13.7 5.5 5.0 2.6 3.6 7.8 . . .Private sector debt, consolidated (% of GDP) 136.9 152.8 167.6 161.9 158.4 154.4 148.3 146.4 . . .
of which household debt, consolidated (% of GDP) 46.8 54.2 59.9 59.0 59.5 60.0 60.0 60.6 . . .of which non-financial corporate debt, consolidated (% of 90.1 98.6 107.7 102.9 98.9 94.4 88.3 85.8 . . .
Corporations, net lending (+) or net borrowing (-) (% of GDP) . . . . . . . . . . .
Corporations, gross operating surplus (% of GDP) 24.0 25.8 24.3 25.5 . . . . . . .Households, net lending (+) or net borrowing (-) (% of GDP) . . . . . . . . . . .
Deflated house price index (y-o-y) 13.9 7.2 -6.1 -1.1 -3.7 0.5 -1.5 2.6 . . .Residential investment (% of GDP) 6.8 5.6 4.3 3.4 3.4 3.0 2.8 2.6 . . .
GDP deflator (y-o-y) 2.4 3.0 2.7 3.8 2.3 2.0 1.9 1.8 2.4 2.5 2.6Harmonised index of consumer prices (HICP, y-o-y) 2.1 4.7 1.8 2.0 2.5 3.2 1.0 0.8 1.2 1.7 2.1Nominal compensation per employee (y-o-y) 3.7 4.0 3.0 2.0 3.3 3.7 1.3 0.6 3.1 3.4 3.4Labour productivity (real, person employed, y-o-y) 1.5 0.8 -2.5 1.8 -0.9 0.4 0.2 -0.9 . . .Unit labour costs (ULC, whole economy, y-o-y) 2.2 3.2 5.6 0.2 4.2 3.2 1.1 1.5 0.4 1.9 2.4Real unit labour costs (y-o-y) -0.2 0.2 2.8 -3.5 1.9 1.2 -0.8 -0.2 -2.0 -0.6 -0.2Real effective exchange rate (ULC, y-o-y) 2.6 2.7 1.3 -3.1 3.9 -0.6 2.5 1.0 -3.6 1.1 .Real effective exchange rate (HICP, y-o-y) 1.6 3.7 0.8 -5.0 -0.8 -1.9 1.4 0.5 -2.6 2.0 -0.1Tax wedge on labour for a single person earning the average wage (%) 17.9 16.9 16.5 16.9 18.1 19.2 19.8 19.1 . . .
Taxe wedge on labour for a single person earning 50% of the average wage (%) 8.4* 8.0 7.7 8.4 9.4 9.8 10.2 9.8 . . .
Total Financial Sector Liabilities, non-consolidated (y-o-y) 50.9 13.5 3.8 13.0 10.9 5.8 2.1 6.3 . . .
Tier 1 ratio (%)2 . 11.8 14.1 13.3 13.3 12.7 12.5 12.1 . . .Return on equity (%)3 . 6.3 11.7 12.1 5.8 14.1 9.8 4.6 . . .Gross non-performing debt (% of total debt instruments and total loans and advances) (4) . 1.3 1.7 1.6 1.5 1.7 2.0 3.2 . . .
Unemployment rate 7.0 6.0 6.9 6.9 6.4 6.3 6.4 5.8 5.4 5.3 5.3Long-term unemployment rate (% of active population) 3.1 2.5 2.9 3.1 3.1 3.1 2.9 2.7 . . .Youth unemployment rate (% of active population in the same age group) 15.8 11.7 14.5 13.2 13.3 14.1 13.0 11.7
12.1 . .Activity rate (15-64 year-olds) 58.2 59.1 59.4 60.4 61.8 63.1 65.0 66.3 . . .People at-risk poverty or social exclusion (% total 19.9 20.1 20.3 21.2 22.1 23.1 24.0 23.8 . . .Persons living in households with very low work intensity (% of total population aged below 60) 9.6 8.6 9.2 9.2 8.9 9.0 9.0 9.8 . . .
General government balance (% of GDP) -4.2 -4.2 -3.3 -3.2 -2.6 -3.6 -2.6 -2.1 -1.6 -1.1 -1.0Tax-to-GDP ratio (%) 32.5 33.4 33.8 32.5 33.2 33.3 33.6 35.0 34.6 34.5 34.3Structural budget balance (% of GDP) . . . -3.9 -2.5 -3.4 -2.6 -2.5 -2.2 -1.6 -1.3General government gross debt (% of GDP) 67.6 62.7 67.8 67.6 69.8 67.4 68.5 66.9 64.0 61.2 58.7
(1) Sum of portoflio debt instruments, other investment and (2,3) domestic banking groups and stand-alone banks.(4) domestic banking groups and stand alone banks, foreign (EU and non-EU) controlled subsidiaries and foreign (EU and non-EU) controlled branches.(*) Indicates BPM5 and/or ESA95Source: European Commission, winter forecast 2015; ECB
forecast
Source: European Commission, 2016 winter forecast; ECB
11

Taxation
The Maltese tax system is efficient when it comes to certain aspects of providing services to taxpayers. In terms of the time it takes to prepare, file and pay taxes, Malta performs well, ranking tenth in the EU with an average of 139 hours per year compared with a EU average of 185.6 hours (7). Administrative costs, which can reflect the complexity of the tax system, are relatively low, representing 0.95 % of net revenue collections (8). Malta offers pre-filled tax returns and various e-services, and was also the first EU country to introduce a tax receipts lottery aimed at providing consumers with an incentive to ask for a receipt, thus making it easier for the tax authorities to check VAT compliance.
Despite recent progress, there is scope to further improve the quality of the tax administration. Efforts to improve tax compliance and tackle tax evasion are important for securing tax revenues, achieving greater efficiency in tax collection, and promoting fairness. In spite of measures to strengthen its tax system in order to enhance compliance, Malta still faces challenges in this area. Nevertheless, there are some encouraging signs. While still high, the level of undisputed debt in relation to net revenue collections decreased by 0.7 percentage points in 2013, reaching 23.2 % (9). The gross closing balance of tax arrears (10) stood at 28 % of GDP in 2014, of which 14 % and 7.5 % of GDP respectively related to value added tax (VAT) and income tax arrears. Out of this balance,
7 ()World Bank. 2016. Doing Business 2016: Measuring Regulatory Quality and Efficiency. Washington, DC: World Bank.
8 ()OECD (2015) op cit.9 ()OECD (2015), Tax Administration 2015: Comparative
Information on OECD and Other Advanced and Emerging Economies, OECD Publishing, Paris.
10 ()Based on data from the National Audit Office, ‘Report by the Auditor General on the Public Accounts 2014’.
around 6.1 % of GDP was considered as collectable, with collectable VAT arrears representing only 0.9 % of GDP. While the VAT gap is relatively high in comparison with other Member States, a strong revenue performance helped to move it downwards in 2013. The gap, which represents the difference between the amount of VAT actually collected and the amount that is theoretically collectable based on VAT legislation, declined from 31 % of the total liability in 2012 to 26 % in 2013 due to a 9.3 % increase in VAT revenues (Graph 2.1.1) (11). Between 2011 and 2013, the amount of revenue collected from tax verification activities (audit, controls, checks etc.) also increased, with the value of assessments rising from 0.7 % of total net revenue collections in 2011 to 1.6 % in 2013 (12).
11 ()CASE/CPB, ‘Study to Quantify and Analyse the VAT Gap in the EU Member States, 2015 Report’.
12 ()OECD (2015) op cit.
12
2. STRUCTURAL ISSUESThis section provides an analysis of main structural economic and social challenges for Malta. Focusing on the policy areas covered in the 2015 country-specific recommendations, this section analyses issues related to taxation, the quality and sustainability of public finances, labour market, education and social policies, inefficiencies in network industries, the business-friendliness of public administration, the environment for access to finance for SMEs, the research and innovation framework and the justice system.
2.1. TAXATION, QUALITY OF PUBLIC FINANCES AND LONG-TERM FISCAL SUSTAINABILITY

2.1. Taxation, quality of public finances and long-term fiscal sustainability
Graph 2.1.1: VAT gap
0%
5%
10%
15%
20%
25%
30%
35%
0
100
200
300
400
500
600
700
09 10 11 12 13%
of liabilitymill
ion
EU
R
VAT revenues (lhs) VAT gap (rhs)
Source: Eurostat, 2013 Update Report to the Study to quantify and Analyse the VAT Gap in 26 EU Member States, CASE and CPB Netherlands Bureau for Economic Policy Analysis, Warsaw, May 2015
In addition, electronic payments remain under-used. Malta still lags behind in the use of electronic payment instruments. In 2014, such payments amounted to EUR 264 200 per capita compared with an EU average of EUR 484 720. Cash is the most popular medium in the country, representing 88 % of payments made in volume terms and 54 % in value terms (13) (see Graphs 2.1.2 and 2.1.3) as there are no limits to cash payments in Malta. After cash, internet banking accounted for 17 % of transactions in terms of value but only 1.3 % in volume, implying that this medium tends to be used for higher value payments (14). Promoting the wider use of electronic payments can reduce the opportunities for underreporting of income and tax evasion.
13 ()Central Bank of Malta (2015), ‘An Analysis of Maltese Payment Habits’ (published in the Annual Report 2014, pp. 125-130).
14 ()Source: European Central Bank. Figures cover credit transfers, direct debits and card payments.
Graph 2.1.2: Use of payment instruments by volume
88%
2%4%
4%1% 1%
Cash Cheque Debit card
Credit card Internet banking Other
Source: Central Bank of Malta calculations
Graph 2.1.3: Use of payment instruments by value
54%
12%
7%
7%
17%
3%
Cash Cheque Debit card
Credit card Internet banking Other
Source: Central Bank of Malta calculations
A number of relevant measures have been taken to improve tax compliance and tackle tax evasion. The government has launched a national strategy for electronic payments which aims at a smooth transition towards such means of payment. It has been announced that a steering committee has been tasked to make recommendations towards increasing electronic payments and is due to present its report in 2016. This work will include a study on the potential impact of introducing a limit to the use of cash. A survey of payment habits
13

2.1. Taxation, quality of public finances and long-term fiscal sustainability
carried out by the Central Bank of Malta has also been published (15), and provides useful evidence which seems to support the government strategy to expand electronic payments and should help to feed into the design of future policy. Some property-related measures have also been introduced which aim to simplify the tax system and reduce tax avoidance and evasion. The previous capital gains tax system, which allowed those selling an immovable property to choose between paying 12 % on the value of the property or 35 % on the capital gain from the sale, was replaced in 2015 by a simplified final withholding tax based on the value of the property. In the 2016 budget it was announced that Malta is working on introducing the concept of fiscal consolidation for companies. This should allow groups of companies with the same owners to submit their revenue in an aggregate manner as if they were a single company, thus simplifying the computation of revenue and the declaration of income for the companies concerned and for the Department of Inland Revenue. Efforts have also been made to raise public awareness about the use of public funds, and hence improve taxpayers’ compliance, through the launch of an educational campaign which shows how tax revenues collected are used for infrastructure, services, health, education, and social security. Other measures such as the automation of the debt collection process across tax types are planned to be implemented in the medium term.
The project to merge the various revenue departments into a single organisation is still ongoing. Such a merger aims to improve services to taxpayers, reduce bureaucracy, and collect revenues more efficiently and effectively. This complex project was launched in 2012 and is planned to be implemented over several years. Advice has also been obtained from IMF experts. The amalgamation will necessitate legislative, organisational, and logistical changes, including the redesign of information technology systems. It is currently planned that completion will be around 2017. However, as yet, little information is available on the impact of these changes so far.
15 ()Central Bank of Malta (2015) op cit.
Several features of the tax system can be used in structures of aggressive tax planning (16). In particular, the absence of anti-abuse rules (17) is relevant. Furthermore, the absence of deemed income from interest-free loans (18) and the tax exemption for intellectual property income (19) can prompt or facilitate aggressive tax planning in the absence of sufficient safeguards. In addition, while Malta’s corporate income tax rate is one of the highest in the EU (35 %), its full imputation tax system and associated refunds can reduce the effective tax rate to as low as around 5 %. The level of inward and outward foreign direct investment stock amounted to approximately 1750 % and 750 % of GDP in 2014 (20). Around 95 % of these positions was held by so-called special purpose entities (21) suggesting that Malta is used by multinational companies to channel tax-driven financial flows to other jurisdictions.
Quality of public finances
Public expenditure as a share of GDP was below the euro-area average in 2014. In 2014, public expenditure net of one-offs stood at 43.9 % of GDP, well below the euro area and EU average of 48.9 % and 48.0 % of GDP respectively. This
16 ()For an overview of the most common structures of aggressive tax planning and the provisions (or lack thereof) necessary for these structures to work, see Ramboll Management Consulting and Corit Advisory (2016), Study on Structures of Aggressive Tax Planning and Indicators, European Commission Taxation Paper n°61. It should be noted that country-specific information provided in the study gives the state of play at May/June 2015.
17 ()For example, the lack of controlled foreign companies rules, of thin capitalisation or interest-deduction-limitation rules, of rules whereby the deductibility of interest depends on the tax treatment in the creditor’s state, or of rules to counter mismatches in tax qualification of domestic companies or partnerships and those of a foreign state.
18 ()The above-mentioned study refers to the fact that the deemed income on interest free loans is not taxable. This can give rise to aggressive tax planning structures if, meanwhile, the borrowing company is allowed to claim a tax deduction regardless of the fact that no such interest accrues or is paid. However, it is also reported that transactions should be executed on an arm’s-length basis, and accordingly such a transaction may be challenged by the authorities.
19 ()It should be noted that it is reported that in practice, this exemption provision has not yet started to be implemented.
20 ()Source: Eurostat21 ()A special purpose entity is a legal entity that has little or
no employment, operations or physical presence in the jurisdiction where it is located. It is related to another corporation, often as its subsidiary, and is typically located in another jurisdiction.
14

2.1. Taxation, quality of public finances and long-term fiscal sustainability
seems to be confirmed also when excluding the cost of servicing public debt, with Malta’s primary expenditure at 41 % of GDP against an euro area and EU average of 46.2 % and 45.5 % of GDP respectively. Malta was among the Member States that benefited from the reduction in nominal yields that followed the adoption of the euro (entailing an overall contraction in the cost of servicing debt by 2.5 % over 2004-2014). When comparing with small Member States (i.e. Croatia, Cyprus, Luxembourg, Portugal and Slovenia), primary expenditure in Malta seems to remain among the lowest.
Primary expenditure has increased rapidly since joining the EU. Between 2004 and 2014, primary expenditure net of one-offs grew on average by 4.7 % at current prices and by 2.3 % in real terms, one of the highest increases among small Member States (see Graph 2.1.4). As a share of potential GDP, primary expenditure increased by 1.9 percentage points, reaching 41.2 % in 2014.
Graph 2.1.4: Total primary expenditure at current prices, selected EU countries
90
100
110
120
130
140
150
160
170
180
04 05 06 07 08 09 10 11 12 13 14
2004
= 1
00
HR CY LU MT
PT SI EA-19 EU-28
Source: European Commission
Graph 2.1.5: Current primary expenditure at current prices, selected EU countries
80
100
120
140
160
180
200
04 05 06 07 08 09 10 11 12 13 1420
04 =
100
HR CY LU MT
PT SI EA-19 EU-28
Source: European Commission
Primary current expenditure grew at a pace above potential GDP growth. During the pre-crisis years 2004-2007, current primary expenditure grew in nominal terms at 5.1 % per year on average, above the euro area and EU average (3.7 % and 4.5 % respectively). In the post-crisis period (2008-2014) primary current expenditure increased on average by 5.8 % (see Graph 2.1.5). In particular, in 2012-2014, despite the fiscal consolidation needed to correct the excessive deficit, primary current expenditure started growing at a pace of 6.7 % per year, well above both the euro area and EU average (1.8 % and 2.3 % respectively). Overall, as a share of potential GDP, primary current expenditure increased by 1.8 percentage points between 2004 and 2014, reaching 36.2 %. This reflects a rise at a pace above potential GDP growth, in particular in recent years.
15

2.1. Taxation, quality of public finances and long-term fiscal sustainability
Graph 2.1.6: Total expenditure at current prices by category
60
110
160
210
04 05 06 07 08 09 10 11 12 13 14
2004
= 1
00
Intermediate consumptionCompensation of employeesSubsidiesSocial benefitsInterestOther current expenditureTotal current expenditureTotal capital expenditureTotal expenditure
Source: European Commission
During the post-crisis years, the increase in some components of current expenditure has been particularly strong. Starting from 2012, some current expenditure items have grown strongly after a more moderate trend in the years following EU accession (see Graph 2.1.6). In particular, compensation of employees increased on average over 2012-2014 by 6.1 % due to both higher average wages and higher employment in both the health and education sector. This increase includes the impact of the sectoral and public service collective agreements which were finalised in 2012, and occurred despite the repeated commitment to restrain public wages. Despite the restraint in 2013, intermediate consumption increased on average by 7.2 % between 2012 and 2014 as the result of higher expenditure on medicines and on residential care for elderly people. The average increase of current subsidies was above 28 % due to increasing subsides to the energy sector and subsidies to the public transport system, while other current expenditure grew on average by 14.8 %.
Primary expenditure dynamics have been impacted by a significant increase in capital expenditure in recent years. Public investment also contributed quite significantly to the fiscal restraint needed to correct the excessive deficit in 2004-2010 (see Graph 2.1.7). It was thus one of the few expenditure items to record a negative
growth over that period. In the period 2011-2014, public investment started speeding up, driven both by EU funds of the 2007-2013 programming period and higher investments by central government (namely the Extra Budgetary Units). Capital transfers exhibited a mixed trend, starting to increase in 2012 due to subsidies granted to Air Malta as part of the restructuring plan (see Graph 2.1.8).
State-owned enterprises are a source of potential risks to the state budget. Overall, total subsidies (both current and capital) to the economy increased from 2.0 % of GDP in 2004 to 2.5 % of GDP in 2014. After some moderation in 2009-2011, when they averaged 1.7 % of GDP, subsidies increased again reaching 2.5 % of GDP in 2014. While Malta has been comparatively less affected by the tensions in financial markets and no government rescue operations took place following the financial crisis, the level of subsides to state-owned enterprises has increased in recent years. The ongoing restructuring of state-owned enterprises (such as Enemalta and Air Malta) and the privatisation of the public transport service are critical to contain fiscal risks. The state is the largest employer and its involvement in the economy has had significant fiscal and economic implications. It is therefore important to manage risks to public finances from state-owned enterprises in a comprehensive manner.
16

2.1. Taxation, quality of public finances and long-term fiscal sustainability
Graph 2.1.7: Gross fixed capital formation, selected EU countries
1
2
3
4
5
6
7
04 05 06 07 08 09 10 11 12 13 14
% o
f GD
P
HR LU MT PT
SI CY EA-19 EU-28
Source: European Commission
Graph 2.1.8: Other capital expenditure, including capital transfers, selected EU countries
0
0.5
1
1.5
2
2.5
3
3.5
4
04 05 06 07 08 09 10 11 12 13 14
% o
f GD
P
HR LU MT
PT EA-19 EU-28
Source: European Commission
Fiscal framework
The Fiscal Responsibility Act was adopted by the Maltese Parliament in July 2014, with a view to transposing the requirements of Directive 85/2011/EU on budgetary frameworks and the Fiscal Compact. It introduced a balanced-budget rule in structural terms and a debt rule as well as a three-year rolling budgetary framework
(National Medium-Term Fiscal Plan) which should improve the predictability of the budgetary planning. All three elements encompass the whole general government. Moreover, the Act provided for the establishment of the Malta Fiscal Advisory Council whose duties include endorsing the government’s official macroeconomic and fiscal forecasts as well as ex ante and ex post monitoring of compliance with fiscal rules.
The Malta Fiscal Advisory Council has been operational since the beginning of 2015. The members of the Malta Fiscal Advisory Council were appointed in January 2015. According to the latest information reported in the Draft Budgetary Plan for 2016, the supporting bureau has been set up and the intended numbers of permanent staff have been recruited. While still relying on external consultants, the plan is to reduce their involvement in the Council’s activities in 2016. The Council holds regular meetings with the main stakeholders (the Economic Policy Department and the Budgetary Affairs Office of the Ministry for Finance, the National Statistics Office, the Treasury and the National Audit Office) and receives regular reports and data on fiscal issues. Since it started work, the Council has published three reports. In 2015, the Council carried out an assessment and an endorsement of the government’s macroeconomic and fiscal projections as published in the Update of the Stability Programme and in the Draft Budgetary Plan for 2016, respectively. In September, the Council issued an Assessment of the Medium-Term Fiscal Strategy 2015-2018, Annual Report 2014 and Half-Yearly Report 2015 (previously published by the Ministry of Finance).
Long-term fiscal sustainability
Malta does not appear to face debt sustainability risks in the short and medium term. The government debt-to-GDP ratio is lower than the euro area average and it is rapidly approaching the 60 % of GDP threshold. Over the short term, Malta does not appear to face significant risks of stress arising from the fiscal side of the economy. Furthermore, the structure of public debt financing, in terms of maturity, creditor base (residents versus non-residents) and currency denomination, does not give rise to short-term risks. Looking to the medium term, public
17

2.1. Taxation, quality of public finances and long-term fiscal sustainability
debt appears to decrease further. Under a normal fiscal policy scenario (22), the debt-to-GDP ratio is projected to fall below the critical threshold of 60 % as early as in 2018 and to around 50 % in 2026. In addition, further improvements may be achieved if compliance with the preventive arm of the Stability and Growth Pact is achieved, since public debt would decrease more substantially than in the baseline projections, going below 40 % of GDP in 2026. Therefore, no significant sustainability risks appear over the medium term.
Graph 2.1.9: Components of total age-related expenditure
0
5
10
15
20
25
30
2013 MT 2013 EU28 2060 MT 2060 EU28
% o
f GD
P
Pensions Health careLong-term care EducationUnemployment benefits
Source: European Commission, 2015 Ageing report
In the long term, however, sustainability risks do appear. Malta appears to be at medium risk due to a relatively high value of the required long-term fiscal adjustment (4.4 percentage points of GDP) needed to put its debt on a sustainable path over the long-term. The projections of implicit liabilities related to the cost of ageing reflect the long-term challenges in terms of an ageing population. The steep increase in projected age-related expenditure is related in particular to pension expenditure (3.2 percentage points of GDP) but also healthcare and long-term care expenditure (2.1 percentage points and 1.2 percentage points respectively) (23).
22 ()Namely, under the hypothesis that the structural primary balance remains constant at 0.9 % of GDP as of the last Commission forecast year (2017) until 2026.
23 ()2015 Ageing Report.
Pension system
The pension system faces the double problem of achieving sustainability while ensuring adequate retirement incomes. Pension expenditure was lower than the EU average in 2013, at 9.6 % of GDP, but it is projected to increase to 12.8 % by 2060 (24), one of the highest in the EU. The pay-as-you-go ‘two thirds pension’ is capped at a rather low level, while the guaranteed national minimum pension level currently stands at two thirds of the national minimum wage (four fifths for married couples). The relative income ratio of people aged over 65 compared to the working-age population is 0.78 (the EU average is 0.93).
Malta scores slightly worse on average than the rest of the EU in terms of poverty prevention, and important coverage gaps exist. The share of older people who are at risk of poverty is higher than the general population (17.2 % against 15.9 %), and 3.9 percentage points higher than the EU average (13.3 %). Women over 65 years of age are at a higher risk of poverty due to the fact that they are more likely to live longer, are less likely to receive their own pensions, and the level of their pension benefits is generally lower than that for men. The gender pension gap (for people aged 65-79) in Malta stands at 25.6 and is lower than the EU average of 40.2 (25). However, the gender gap in the non-coverage rate (26) is significantly higher at 36.5 compared to a much lower one of 6.8 for the EU average. This is because, despite recent progress in increasing female employment, Maltese women continue to have the shortest employment careers in the EU (25 years compared with 32.5). Due to insufficient contribution periods, women are often not entitled to their own contributory old-age benefits, and are more likely to depend on their spouses’ pensions or survivors’ benefits, or receive a non-contributory (means-tested) old-age pension.
The authorities plan to put forward several measures in the near future to address the sustainability of the pension system. These measures follow the proposals of the Pension
24 ()2015 Ageing Report.25 ()Survey on Income and Living Conditions 2012.26 ()Percentage point difference between women and men in
the rate of those not covered by any pension (age 65-79).
18

2.1. Taxation, quality of public finances and long-term fiscal sustainability
Strategy Group (27). The government is notably seeking to improve the balance between the years spent in work and those in retirement by extending the number of required contribution years from 40 to 41. In effect, this would require individuals to work one more year in order to get the full pension, and otherwise proportionally reduce the generosity of pension benefits. The relevant legislation has yet to be introduced and therefore the potential impact of this measure has not yet been quantified. It remains to be seen how this would work in practice if individuals were required to work beyond the statutory retirement age. To ensure this measure is effective, additional policy efforts to safeguard the employability of the people affected may be useful. Nevertheless, measures concentrated on improving the activity rates of older workers are not expected to be sufficient to ensure the long-term sustainability of the pension system (28).
The authorities plan to put forward measures to raise the adequacy of pensions. The contributory guaranteed national minimum pension continues to evolve in 2016 with a view to reach 60 % of the median income by 2020 and to extend the coverage. Moreover, the level of the non-contributory means-tested ‘old-age’ pension is also set to increase. In 2016, further care credits will be introduced, including for periods spent caring for children, which is expected to help improve pension coverage for women who often do not build up sufficient contributions because of breaks in their careers due to care for children. Credits will also be introduced for periods of education, with greater credits awarded for greater levels of educational attainment, in order to encourage human capital formation.
Malta has recently introduced a framework for voluntary third pillar private complementary pensions, which will be further developed and its incentives extended. However, information on
27 ()A Strategy for an Adequate and Sustainable Maltese Pension System presented on 17 June 2015.
28 ()According to simulations in the 2015 Ageing Report, linking the retirement age to changes in life expectancy is expected to reduce the projected increase in pension expenditure by more than one third (1.2% of GDP out of 3.2% of GDP). Achieving the same gains by targeting labour-market measures alone would require reaching a 24 pps. increase in the overall employment rate over the baseline.
the take-up of these measures is not yet available (29). Though such a third pillar could help to promote the build-up of supplementary incomes for the future, it is not yet clear whether these will have wide coverage, especially for lower-income earners who have a reduced propensity to save. No measures have been taken so far to implement second-pillar occupational pensions, which could provide more uniform coverage of the labour force.
Health care system
Health care expenditure is projected to increase significantly in the long term reflecting demographic trends. The Maltese population enjoys one of the highest life expectancies in Europe, although there are areas where the health care services appear to underperform such as cardio/cerebro mortality and ischaemic heart disease. Public expenditure on health care in 2013 amounted to 5.7 % of GDP, which was below the EU average (6.9 % of GDP). In recent years the public share of total health expenditure followed a stable pattern, with inpatient expenditure absorbing the largest share of public health expenditure. However, public expenditure on health is projected to increase significantly to 7.8 % of GDP in 2060, reaching the projected EU average (30). The projected increase is one of the highest in the EU, reflecting also demographic trends. When taking into account the impact of non-demographic drivers on future spending growth (31), health care expenditure is expected to increase by 4.2 percentage points of GDP between 2013 and 2060. In terms of the provision of adequate access to services, the authorities have made progress in reducing waiting times on various procedures and examinations.
The fiscal impact of the healthcare policy initiatives is still uncertain. Following the
29 ()Country Reports 2014 and 2015.30 ()2015 Ageing Report.31 ()The "non-demographic determinants scenario" highlights
the potential impact of non-demographic drivers on health care expenditure, such as innovations in medical technology, institutional settings and individual behaviour. Such upward risk on the future evolution of public expenditure on health care is not captured by the ageing factor. Ignoring the effect of non-demographic drivers on health care expenditure would imply making the assumption that past trends of health care expenditure related to these drivers will disappear in the future.
19

2.1. Taxation, quality of public finances and long-term fiscal sustainability
finalisation and launch in 2014 of the National Health Systems Strategy aimed at achieving sustainable healthcare, a detailed action plan and a cost-benefit analysis were completed in January 2015. A health systems performance assessment was also completed in 2015. The assessment demonstrates the baseline results and interpretation of the selected indicators and will be repeated every two years. It is, however, still uncertain whether the strategy is sufficient to cope with the challenge of future spending growth. In addition, currently there is no comprehensive system to monitor health service outcomes and quality of care.
Graph 2.1.10: Health care expenditure under different scenarios, 2013-2060
0123456789
10
MT
AW
G re
fere
nce
scen
ario
Dem
ogra
phic
Hig
h Li
fe E
xpec
tanc
yC
onst
ant H
ealth
Inco
me
elas
ticity
Cos
t con
verg
ence
Labo
ur in
sten
sity
Sec
tor-
spec
ific
inde
xatio
nN
on-d
emog
raph
ic d
river
sA
WG
risk
sce
nario
TFP
risk
sce
nario
EU
28A
WG
refe
renc
e sc
enar
ioD
emog
raph
icH
igh
Life
Exp
ecta
ncy
Con
stan
t Hea
lthIn
com
e el
astic
ityC
ost c
onve
rgen
ceLa
bour
inst
ensi
tyS
ecto
r-sp
ecifi
c in
dexa
tion
Non
-dem
ogra
phic
driv
ers
AW
G ri
sk s
cena
rioTF
P ri
sk s
cena
rio
pps of GDP
2013 2060 under different scenarios
Source: European Commission, 2015 Ageing report
Long-term care
The demand for long-term care has increased as a result of population ageing as well as the reduced role of extended family and the increased labour market participation of women. Public expenditure on long-term care, which amounted to 1.1 % of GDP in 2013 (against 1.6 % of GDP in the EU), is projected to increase to 2.1 % in 2060 (32). Informal care still plays an important role in Maltese society due to the traditional strong role of the family. Most care givers are women aged between 40-59 years (33). Over the last few
32 ()2015 Ageing Report.33 ()Social Protection Committee (2014) Long Term Care in
Ageing Societies.
years, the government expanded residential care places and community-based services including day care centres. The government has set up contracts with private homes for providing long-term care services, but private care institutions are not always affordable for pensioners. A number of initiatives have been undertaken to encourage independent living and the 2016 budget has announced additional measures for at-home care. However, the long-term fiscal impact of these measures has not been estimated. Moreover, preventive strategies that target older people with the aim of preventing frailty and dependency are not fully in place. Enhancing the provision of formal long-term care services, in addition to improving the availability of care to those who need it, could further complement recent work-life balance measures taken to reduce obstacles to women’s participation in the labour market because of care responsibilities.
20

Labour market
Notwithstanding the favourable economic and labour market outlook significant challenges remain. The resilience of the economy is reflected in the continuously improving labour-market performance. Both activity rates and employment rates have been increasing, particularly due to the growing female participation and foreign labour force inflow. Nevertheless, the overall activity rate remains low (72.5 % for the group aged 20-64 vs the EU average of 77.2 % in the third quarter of 2015), reflecting one of the lowest female activity rate in the EU. Despite recent progress among younger cohorts, reconciliation of work and family life (especially in the private sector), the design of the benefits system, and the skill level of older women remain key factors inhibiting a further increase in female activity rates. The Maltese population is considerably less qualified than the EU average, but economic growth requires an adequate supply of labour which matches the labour market needs. Thus persons with low or outdated skills are likely to find it more difficult to integrate into the labour market. In addition, the low reported activity rate may be due to a high share of undeclared work.
Labour supply
Overall, activity and employment rates increased but are still below the EU average, notably for women and older workers. The activity rate stood at 70.1 % in 2014 for the 20-64 age group; higher rates were observed throughout 2015. Increasing activity rate is associated with a strong increase in employment, with the exception of the elderly cohorts for which rising activity rates are associated with higher exits to unemployment. The employment rate has kept increasing (to 69.2% in the third quarter of 2015), but was still below the EU average, reflecting low employment rates for women (55.4%) and older workers (at 42.1% in the third quarter of 2015). In particular, the employment of older women was still very low, with 24.1% in the third quarter of 2015.
Female activity rates remain substantially lower than the EU average, reflecting a combination of factors i.e. traditional society’s support to one and male earner households, insufficient work-life balance arrangements (i.e. flexible working
arrangements in the private sector) linked with care responsibilities, and a lack of necessary skills (i.e. a gap in educational and job acquired skills for older generations), which were referred to extensively in the 2015 country report.
The female activity rate (aged 20-64) has registered by far the highest increase in the EU since 2008. The gap with the EU in terms of activity rate has decreased and reached its narrowest level of about 16 percentage points in 2014 (see Graph 2.2.1). Activity rates among the youngest female cohorts (i.e. 15-24 years and 25-29 years) surpass the EU average and are on the rise, whereas no significant respective increases have been observed at EU level (34). Activity rates tend to fall below the EU average as of age 30, and substantially so for women 50-64 years old. Nevertheless, sharp and continuous increases have been noted for the 50+ cohorts too and have contributed to the observed increase in full-time employment as well as part-time employment. The share of women working part time is considerably higher in comparison with men (26.6% vs. 6.3% in the third quarter of 2015, aged 20-64).
Graph 2.2.1: Activity rates in Malta and EU, aged 20-64, by gender
35
45
55
65
75
85
08 09 10 11 12 13 14
%
Women EU28 Women MTMen EU28 Men MTTotal, EU28 Total, MT
Source: European Commission
Malta is currently implementing a number of making-work-pay measures that seek to 34 ()The female participation rate in Malta increased by 11.7
percentage points between 2008 and 2014, by far the highest increase registered among EU countries.
21
2.2. LABOUR MARKET, EDUCATION AND SKILLS AND SOCIAL ASPECTS

2.2. Labour market, education and skills and social aspects
increase the participation of women in the labour market. In particular, they include providing free childcare services, in-work benefits, tax rebates, establishing a maternity leave fund and promoting flexible and reduced-hours arrangements. In 2014 Malta introduced free childcare for children 0-3 years old for families where parents are in employment, in education or actively seeking a job, in order to remove barriers for parents, especially women, entering or remaining in employment (35). This reform has contributed to a significant increase in the number of children enrolled in childcare centres (36). Latest data (2014) shows that 21 % of children up to 3 years old are enrolled in formal childcare, but the take up is still below the Barcelona targets (37) for this age group as well as the EU average (27 %). Enrolment in childcare from 3 to mandatory school age is at 92 % (10 percentage points above the EU average and above the Barcelona target of 90 %), largely due to the availability of free pre-primary education for children from age 3. Nevertheless, from a longer-term perspective, efforts to retain older women in the labour market have so far been less successful when compared with developments in other EU economies partially due to their low overall skills levels. The current pension reform (see Section 2.1), in conjunction with additional targeted fiscal measures could, however, contribute to encouraging older women to remain active over the coming years. The package of ’make work pay’ measures is being further extended under the 2016 Budget and is expected to contribute further to the rising activity of women.
Despite low levels of youth unemployment and an overall low level of young people neither in employment nor in education or training (NEETs) in Malta, the share of the inactive among people in this group is high. Among those people neither in employment nor in education or training, there is clearly a high proportion of the
35 ()Though inactive parents are not eligible to benefit from this scheme, separate targeted support measures for these families exist.
36 ()According to the national data, between April and December 2014, the number of children attending childcare increased from 1800 to 2917. Peer Review on ‘Making work pay for mothers’, 18-19 May 2015, Malta.
37 ()In 2002, the Barcelona European Council set objectives in this area. See http://www.consilium.europa.eu/uedocs/cms_data/docs/pressdata/en/ec/71025.pdf. The Commission is monitoring the targets also after 2010.
low skilled and very young people (below 20 years old), in line with the high number of early school leavers. A breakdown of the group of people neither in employment nor in education or training reveals, inter alia, that the group is very heterogeneous with a high share of inactive. Among those inactive, the share of women is higher than men, with family responsibilities being the key driver of this difference (38). The efforts of the authorities under the Youth Guarantee have targeted potential school dropouts but also aimed to activate this population through a combined programme of mentoring and traineeships. The updated Youth Guarantee Implementation Plan puts emphasis on the issue of the quality of offers. However, there is still room for improving the scope of offers. A census carried out on people neither in employment nor in education or training (39) is expected to contribute to a better understanding of their needs and help define more tailored measures.
A large share of the unemployed does not receive unemployment benefits or are not registered in the Public Employment Services. The coverage of unemployment benefits among the short-term unemployed was estimated to be 17 percentage points lower than the EU average at 20 % in 2014. This may reflect the limited duration of entitlements (156 days) as well as relatively strict eligibility conditions (such as in 2015 a qualifying period of around 50 weeks of which at least 20 in the last two years). In addition, net replacement rates are slightly lower than in most EU countries.
The lack of coverage could hamper the effectiveness of policy action, notably efforts to upgrade the skills of the unemployed. The Employment and Training Corporation (ETC) has been undergoing a reorganisation in order to effectively adjust its capacity to the new challenges, including the challenge of skills matching, job-search assistance, training provision and individualised support. While sanctions (non-
38 ()Eurofound (2016) – Exploring the diversity of NEETs – Publication Office of the European Union – Luxembourg – forthcoming.
39 ()The results of the NEETs census carried out by the Maltese authorities confirm that the group is very heterogeneous and that a part considerable proportion of them might have engaged in undeclared work.
22

2.2. Labour market, education and skills and social aspects
payment of benefits) are planned to be introduced for jobseekers who are not willing to participate in such schemes, increasing the coverage of Public Employment Services registration remains a challenge. Only 60% of the long-term unemployed are registered. A scheme to contract out private service provision (with a payment-by-results model) for placements to long-term unemployed (40) – the Work Programme – is being introduced. The results need to be seen in terms of effectiveness of job search support and in terms of coordination between employment services and social assistance, because a more effective partnership approach and possibly a single point of contact could help improve the services, in particular those provided to the long-term unemployed.
The inflow of foreigners - both EU citizens and third country nationals - taking up jobs in Malta has been increasing. The total registered number of foreign workers reached 22 000 people in 2014. Since 2008, the increase has been nearly three-fold. This flow (41) is driven by the lack of sufficient supply of domestic labour force and skills to meet an increasing demand. About 70 % of the foreign labour force were EU citizens in 2014, pointing to an increased influx since 2008 when they constituted only about half of the foreign labour force. The influx of foreign workers is more pronounced in certain sectors, such as in entertainment & recreation (where they amount to nearly 29 % of the workforce), professional services & administrative support (23 %) and hotels & restaurants (21 %) in 2014 (42). These have also been among the most dynamic sectors of the economy. At the same time, the labour force in industry is dominated by the Maltese population.
EU residents and third-country nationals are overall well integrated in the labour market.
40 ()Whilst the long-term unemployment rate is low (2.4 percentage points lower than the EU average) and is seen to be declining, it appears that around 4000 out of a total of 5200 registered jobseekers were long-term unemployed in 2015. The very long-term unemployment rate decreased to 1.5% in 2014, 1.6 percentage points below the EU average.
41 ()In 2014, about 6 % of total population or close to 25 000 people were foreign citizens. Close to 10 % of total population or about 40 000 thousand people were born in a foreign country.
42 ()Grech, A. (2015). Understanding the Macroeconomic Impact of Migration in Malta. Central Bank of Malta Policy note, December 2015.
The employment rate of foreigners is at similar levels as those of nationals with activity rates steadily increasing across age and gender dimensions (see Graph 2.2.2). The available survey data however allows capturing only major performance patterns of those in formal working arrangements. Given signs of informal employment, the Employment and Training Corporation is currently exploring measures to curb irregular and precarious employment in relation to parts of the foreign labour force, notably third-country nationals in low skilled professions.
Education and skills
Skills supply and governance
Malta’s workforce remains relatively low-skilled, despite recent improvements. In terms of educational attainment Malta has the highest shares of low-skilled workers in the EU for almost all age brackets as 57.8 % of population aged between 25 and 64 has at best a level of education equivalent to lower secondary education ISCED 0-2 (see Graph 2.2.3). In addition, 22.7 % of the same population group has an upper secondary or post-secondary non-tertiary level of education in the EU (ISCED 3-4), while 19.5 % has a tertiary qualification (ISCED 5-8). However, these figures represent an improvement since 2000 when 81.9 % had at best an ISCED 0-2 qualification. The improvement in overall educational level is also partially driven by an increasing share of foreign population, which has a relatively higher share of people with tertiary qualifications and a smaller share of people with lower secondary education.
23

2.2. Labour market, education and skills and social aspects
Graph 2.2.2: Activity rates, % of population group
0
25
50
75
100
Y20-64 Y20-64 Y25-49 Y50-59 Y20-64 Y25-49 Y50-59
Total Men Women
EU countries
2012 2013 2014
0
25
50
75
100
Y20-64 Y20-64 Y25-49 Y50-59 Y20-64 Y25-49 Y50-59
Total Men Women
Non-EU countries
2012 2013 2014
0
25
50
75
100
Y20-64 Y20-64 Y25-49 Y50-59 Y20-64 Y25-49 Y50-59
Total Men Women
Nationals
2012 2013 2014
Nationals, Other EU28; Non-EU28; distinction by country of birthSource: European CommissionGraph 2.2.3: Distribution of educational attainment
among population aged 25-64, 2014
0%
10%
20%
30%
40%
50%
60%
70%
80%
90%
100%
LT CZ
EE
SK PL
LV DE FI SI
AT
SE
HU
HR LU BG DK
UK IE CY
FRE
U-2
8N
LB
ER
O EL IT ES PT
MT
ISCED 0-2 ISCED 3-4 ISCED 5-8
Source: European Commission
Vacancy bottlenecks have emerged and are identified across the entire skills spectrum. The greatest recruitment difficulties appear within the highly-skilled occupations, namely in the health care, financial and ICT sectors. With regards to unskilled occupations, the hospitality and tourism sector appears to be the most affected (43). In response, a substantial increase in foreign workers has been recorded. Future employment growth in Malta is forecast to concentrate in business services and the distribution and transport sectors, while, in the primary and manufacturing sectors it
43 ()European Commission (2013), Mapping and analysing bottleneck vacancies on EU Labour Markets - Bottleneck vacancies in Malta.
would continue to fall. Most job opportunities (see Graph 2.2.4) are projected to require tertiary education, but there will also be significant proportions of job opportunities for medium-level qualifications (44).
Graph 2.2.4: Forecast job opportunities by level of qualification 2013-2015
0%
10%
20%
30%
40%
50%
60%
LowMedium
High
9.53%
40.23%
50.25%
12.47%
41.25% 46.28%
MT EU-28
Source: European Commission calculations based on Cedefop skills forecast (2015)
The existing instruments for skills forecasting and anticipation at national level are still not sufficient to assess labour market and skills needs. Several institutions produce statistics indicating trends in education and labour market but still do not give a comprehensive outlook. There also remains scope for strengthening governance and partnerships between providers and employers. Among a number of measures, the government plans to set up an agency, ’Education Malta’, as part of the strategy to establish Malta as an international educational hub. A Skills Council will be set up in 2016 as a general national policy board to advise the government on adjusting skills policies.
The supply and quality of apprenticeships is still too limited. The minimum share of the on-the-job training in the overall apprenticeship programme is not set in the legislation. Apprenticeship programmes with separate 44 ()Cedefop (2015), Country forecasts - Malta skills supply
and demand up to 2025. According to Cedefop’s forecast, most job opportunities will be for professionals, service and sales workers in the business and other service sectors.
24

2.2. Labour market, education and skills and social aspects
provision of off-the-job and on-the-job learning has often resulted in learning experience disconnected one from another (45). An adequate supply of apprenticeships is an appropriate way to accelerate the adjustment of skills supply to specific labour market demand, thereby equipping graduates with relevant occupational skills. Malta has made efforts to reform and strengthen the apprenticeship governance (46) and to create a ‘culture’ for apprenticeships aimed at attracting large number of both students (including foreign students) and employers. The government acknowledges that there is scope to expand the supply as regards sectors and qualifications levels and to develop their quality and labour market relevance (47). The authorities intend to develop a harmonised legal framework on apprenticeships which would also define the employment status of apprentices. Further measures are announced in the 2016 budget, i.e. "Job Practice" to offer students a chance to increase their skills portfolio, but the extent to which they will meet the challenge remains to be assessed.
Education
Malta is among the worst EU performers as regards early school leaving and basic skills. After falling by almost 10 percentage points between 2007 and 2013, the early school leaving rate stagnated between 2013 (20.5 %) and 2014 (20.3 %). It is still the second highest in the EU and well above the 2020 national target. Earlier surveys showed that the basic skills attainment (48) was rather low (49). This was coupled with the largest gender gap among EU countries, with girls strongly outperforming boys in all fields tested, which highlights the potential that an increased female labour force participation would have for the economy. 45 ()Cedefop (2015), Apprenticeship Review – Malta.46 ()See the 2015 Country Report.47 ()National Commission for Further and Higher Education
(2014), Apprenticeship-type schemes and structured work-based learning programmes – Malta.
48 ()Basic skills attainment measures cognitive skills, not qualifications.
49 ()See the OECD Programme for International Student Assessment (PISA) 2009+ tests (http://www.oecd.org/pisa/keyfindings/pisa2009key findings.htm. Malta did not participate in PISA 2012) where Malta was among the worst performers in the EU; the 2011 Progress in International Reading Literacy Study (PIRLS); and the Trends in International Mathematics and Science Study (TIMSS) (http://timssandpirls.bc.edu/).
Continuous professional development of Maltese teachers has been identified as a key policy area for further progress in early school leaving and basic skill attainment. Recent research underscores the central role of quality teaching in determining student outcomes (50). Some major changes have been introduced in the education system (i.e. the introduction of mixed ability classes, benchmarking examination and e-learning tools), which necessitates high-quality initial teacher education and continuous professional development so as to promote student-centred learning. A legal notice establishing an institute for continuous professional development of teachers (the Institute for Education) was approved in 2015. The main objectives of the Institute are to: (i) provide teachers with skills to be utilised in their daily professional activities; (ii) act as a hub for educators to meet and share common experiences; (iii) promote educational leadership. The Institute is now becoming operational and is expected to become the main driver in addressing teachers' professional development needs. The government also plans to reform initial teacher education by introducing a two-year Master’s degree in Teaching and Learning (51). Lasting commitment and a strategic approach in the coming years will be important, as measures to improve the quality of teaching require a long-term policy perspective. The fact that the teaching force is quite young may facilitate the task (see Graph 2.2.5).
50 ()See Chetty R., Friedman J. N. and Rockoff J. (2014), "Measuring the impacts of teachers II: Teacher value-added and student outcomes in adulthood", American Economic Review, vol.104, n.9, pp.2633-79; and Hanushek E. A. and Rivkin S. G. (2012), "The distribution of teacher quality and implications for policy", Annual Review of Economics, vol.4, pp.131-57.
51 ()The current initial teacher training involves a Bachelor of Education degree in Primary Education for primary teachers. For secondary level teachers, there are currently two routes: a Bachelor of Education degree over four years or a one-year postgraduate Certificate in Education (still level 6 on the Malta Qualifications Framework) following a Bachelor’s degree in the subject area.
25

2.2. Labour market, education and skills and social aspects
Graph 2.2.5: Distribution of teachers by age group at different education levels, 2012
0%
10%
20%
30%
40%
50%
60%
70%
80%
90%
100%
MT EU(*) MT EU(*)
Primary Lower and uppersecondary
<30 30-39 40-49 50+
(*) Un-weighted averageSource: European Commission calculations based on Eurostat data
The government has been making efforts to address bottlenecks in the education system by implementing strategic frameworks in the area of early school leaving and literacy. An innovative Alternative Learning Programme in operation since 2014 is providing students who are at risk of leaving education without qualifications, with work experience and literacy, numeracy and information technology skills. Bringing different initiatives under a single National Literacy Agency has been a positive move, as it helps to consolidate the work already done and makes the strategic approach more comprehensive.
Lifelong learning
Participation in lifelong programmes is still limited. Adult participation in lifelong learning is quite low (7.1 % compared to an EU average of 10.7 % in 2014). This is due to the very low participation among people with low educational attainment (2.8 %), who still represent the majority of the Maltese adult population (52). Malta is making some efforts to increase second chance education to those with no formal secondary education certificate through the Foundation College of the Malta College of Arts, Science and Technology but the course aimed at adults with
52 ()European Commission (2015), Education and training monitor 2015 – Malta.
low skills is still limited. Further upskilling of the adult population with low qualifications could boost Malta’s labour force and respond to some of the skills shortages.
The delivery of adult learning courses is fragmented and the capacity of training providers is not sufficient. Evidence points to an overlap in the training offer by public and private providers. ICT, Business and Commerce and courses in Human Resources tend to be the most popular among local students (53). Adult career guidance to cater for the lifelong career needs of the population is not yet sufficiently developed within the Public Employment Services, particularly for low skilled and older persons. Although there are relevant policy responses within the Lifelong Learning Strategy, the results need to be seen over a longer perspective.
Social Policy
Despite positive economic outcomes, Malta is far from its 2020 poverty target. The number of people at risk of poverty and social exclusion has been increasing over recent years, in particular for children and persons with low education attainment. It reached its peak in 2013 (24 % in the total population) and remained stable in 2014, with 90 000 people still at risk. The relative at-risk-of-poverty rate stood at 15.9 %, increasing marginally compared to 2013. It remains particularly high among children, standing at 24.1 %. The monetary poverty rate of the elderly increased by 2 percentage points in 2014, reaching 16.9 %, which exceeded the EU average (13.8 %). Among the adult population, the unemployed were most at risk of poverty (49.6 %), followed by inactive persons (22.2 %). Although decreasing, the at-risk-of-poverty rate was considerably higher for households renting their accommodation (24.4 %) than those living in their own property (14.3 %). (54)
53 ()Ministry for Education and Employment - MCAST (2015), The National Vocational Education and Training Policy.
54 ()Malta National Statistical Office data.
26

2.2. Labour market, education and skills and social aspects
Graph 2.2.6: Material deprivation
2
6
10
14
05 06 07 08 09 10 11 12 13 14
% o
f pop
ulat
ion
TotalHouseholds without dependent childrenHouseholds with dependent children
0
10
20
30
40
50
05 06 07 08 09 10 11 12 13 14%
of p
opul
atio
n Single parent2 adults, 3+ childrenTenant, reduced or free rentUnemployed
Source: European CommissionMaterial deprivation has been on the rise over the ten years, which and has contributed to poverty and social exclusion outcome. In particular, material deprivation55 increased by 0.7 pp to 10.2 % in 2014 (see Graph 2.2.6). This is particularly driven by some vulnerable groups, such as single-parent households, unemployed and households with low-work intensity. This highlights the increased financial difficulties among those with fragile labour market situations, especially at the presence of dependent children. Incomes of households, for which social transfers is an important source, did not increase at the same pace as those of other household types. Neither did they increase in line with changes in living costs, such as housing costs. Severe material deprivation is also strongly related to education attainment. It is markedly higher for persons with only basic educational attainment (18.6 % for persons with ISCED 0-2 level) in comparison to these with tertiary attainment (3 %). Low skills also substantially contributes to the overall risk of poverty and social exclusion. The latter has been on the rise since 2008 and reached 30.1% for person with ISCED 0-2. Low skills are also important factors in the generational transmission
55 ( ) Material deprivation is defined as the inability to afford a selection of items that are considered to be necessary or desirable. Data mentioned here are based on the latest available Eurostat statistics, namely the Survey of Living Conditions (SILC) 2014, which is based on reference data for 2013 and hence do not take account of the impact of measures introduced since then.
of poverty. As a result, child poverty has particularly increased for children whose parents have only basic educational attainment (from 30.1% in 2008 to 43% in 2014). Work intensity is another important factor in the poverty outcome as the poverty risk is much higher for the single-earner households, pointing out the need to increase labour-market participation of the second earners.
Social protection
Malta has recently undertaken several reforms to step up activating and enabling social policies. These translated into additional budgetary efforts. In particular, expenditure has increased for child day care, education and, to a lesser extent, for primarily active unemployment measures (56). Malta also has a large provision of in-kind benefits and services including, health care, social housing and childcare. However, as the value of these benefits is not taken into consideration when assessing income, this can potentially affect the cross-country comparability of these values. In order to improve the efficiency and effectiveness of social protection, several measures are being introduced including the gradual tapering of benefits for those entering into employment as well as in-work benefits. These measures are expected to have a positive impact on reducing poverty and improving living standards for low income households, especially those with children. Facilitating beneficiaries' (re)entry into the labour market activation can be expected to have further positive outcomes in terms of poverty alleviation; however, special attention must be paid to the most vulnerable households. Nevertheless, it needs to be assessed whether housing subsidies that are delivered by social assistance in order to alleviate the budget constraints of people in need are sufficient. In the case of social housing, long waiting lists are reported (57) and the reassessment
56 ()Malta has several types of means-tested minimum income benefits, notably the Social Assistance Benefit as well as Unemployment Assistance, which is a means-tested benefit available to those whose contribution based unemployment benefit has been exhausted.
57 ()According to the unofficial information, about 3000 applications still need to be processed. There is a priority list of about 500 people (such as those with a disability, domestic violence victims, former institutionalised people, and the homeless).
27

2.2. Labour market, education and skills and social aspects
system on whether the beneficiary still qualifies to receive it is not fully in place.
Graph 2.2.7: Average monthly housing costs and severe material deprivation
0
10
20
30
40
100
140
180
220
260
11 12 13 11 12 13 11 12 13 11 12 13
Households,no children
Households,with children
Single parent Largefamilies
%
EU
R
Housing costs (lhs) Severe material deprivation (rhs)
Source: European Commission calculations on National Statistics Office Malta data
28
Energy
Ending the energy network’s isolation and the near-full reliance on oil imports has been a priority for the Maltese authorities. Establishing links to mainland Europe’s energy systems brings the benefits of increased energy security and providing access to potentially cheaper energy. The electricity interconnection with Italy was inaugurated in April 2015 and brought Malta’s level of interconnection from 0 % to approximately 35 % of the installed generation capacities. Available data indicates that imports through the interconnector already play an important role in the electricity supply in Malta (see Graph 2.3.1). At the same time, ongoing investments in a new gas-fired power plant, the conversion of an existing plant to run on natural gas and a liquefied natural gas terminal aim to further reduce the reliance on oil imports as a primary energy source and decrease pollution from electricity generation. Further in the same vein, the connection to the European Gas Network (gas pipeline with Italy at Gela and Floating LNG Storage and Regasification Unit/FSRU) received the status of Project of Common Interest in 2013 and has been included in the second list of Projects of Common Interest, adopted on 18 November 2015.
Graph 2.3.1: Electricity supply by source
0
50
100
150
200
250
300
Jan-
12A
pr-1
2Ju
l-12
Oct
-12
Jan-
13A
pr-1
3Ju
l-13
Oct
-13
Jan-
14A
pr-1
4Ju
l-14
Oct
-14
Jan-
15A
pr-1
5Ju
l-15
Oct
-15
giga
wat
t-hou
rs (G
Wh)
Imports Gross electricity generation
Source: European Commission
Ongoing efforts need to be sustained in the coming years in order to meet the national 2020 target for renewable energy. The promotion of renewable energy is one of the few available options to exploit domestic energy sources. After focusing on wind energy projects, which were ultimately not implemented, emphasis has been put on the promotion of solar energy. Furthermore, heat pumps are used to cover heat demand in winter and alternative fuels are used in transport. Starting from a very low level, Malta thus succeeded in increasing its renewable energy share to 4.7 % in 2014. This is in line with the indicative trajectory towards the 2020 target but significant further deployment is needed to achieve the target. Analysis by the authorities has shown that the domestic potential for renewable energy is limited (58). Therefore, the use of cooperation mechanisms with other Member States (such as importing ‘green power’ through the interconnector) could be considered to help the country achieve its renewable energy target.
Despite the progress achieved, additional efforts would be needed to reach the energy efficiency target. In 2014 the authorities notified a new indicative 2020 target for energy consumption of 0.726 million tonnes of oil equivalent (Mtoe) expressed in terms of primary consumption. This target was more ambitious than the previous one. However, in terms of final energy consumption, the new target of 0.547 Mtoe was less ambitious than the previous one. Malta has made considerable efforts to improve its energy efficiency and to diversify its energy mix. Primary energy intensity has decreased since 2005 at a faster pace than for the EU as a whole, and is now lower than the EU average. Indeed, energy consumption in industry in terms of its ratio to the sector’s gross value added is lower than for the EU. However, this also reflects the absence of very energy-intensive, large industrial activities. At the same time, electricity tariffs for medium-sized industries remain the highest in the EU, despite the reduction introduced in 2015 (see Graph 2.3.2). High tariffs for medium-sized companies reflect a lack of competition on the retail markets. Moreover, regulated prices are set at levels that
58 ()Preliminary technical and economic assessment of Malta’s effective renewable energy potential post 2020, Ministry for Energy and Health, August 2015.
29
2.3. BUSINESS ENVIRONMENT AND COMPETITIVENESS
2.3. Business environment and competitiveness
create electricity tariff deficits, resulting in the accumulation of debt in the state power company. Furthermore, the final energy consumption in the transport sector and the energy consumption per capita increased on average in the period 2005-2013. These trends increase the economy’s fuel imports bill and hamper its competitiveness. Current efforts would need to be stepped up in order to reach the 2020 target expressed in final energy consumption. This would help consumers to exploit the full benefits of energy efficiency and to lower their energy bills.
Graph 2.3.2: Electricity tariffs for medium-sized industries
0.00 0.05 0.10 0.15 0.20
DKSEFI
BGRO
SINLATEEFRCZHUDELTPLLUHREUBELVIT
PTELSKESIE
CYUKMT
2015
2010
Source: European Commission
Transport
Compared to the EU average, peak hour congestion constitutes a major problem. The authorities have not made sufficient progress in addressing this issue. The costs of congestion are significant (EU average estimated at 1-2 % of GDP, with indications that Malta is at the higher end), which at the same time causes high levels of air pollution, a major cause of environmental and health disbenefits (with consequences in term of worker sickness and increased healthcare costs, in addition to creating impacts on agriculture). Despite the severity of the problem, several issues remain to be further addressed. These include inducing better use of available infrastructure, addressing inefficiencies in public transport and developing of alternative modes of transport.
EU funded investments in the transport sector could provide a strong incentive. The transport and logistical infrastructure is the most unattractive element of the Maltese environment for foreign investors (59). Tackling this element is crucial, as investors indicate it to be among the most important factors in choosing an investment destination (60). The development of the National Transport Strategy is an ex ante condition to accessing EU structural and innovation funds (2014-2020) in order to co-fund transport investments. Nevertheless, while the deadline for completion was set at September 2015, it is now not expected before June 2016.
Environment
The complete dependence on imported fossil fuel for transport has a negative impact on the environment. Concrete measures to reduce this dependency are too limited in scale and scope. This is particularly pressing in road transport, considering the high modal share of private cars, the aged car fleet, and the fact that transport is the largest greenhouse-gas emitting sector outside the Emissions Trading System. The authorities have yet to tackle those issues.
The potential of achieving a circular economy and improving resource efficiency remains to be tapped. In terms of resource productivity, Malta is around 30 % below the EU average (with 1.34 EUR/kg compared with an EU average of 1.95 in 2014) (61). Moreover, Malta ranks only 17th within the EU (2013) on the eco-innovation scoreboard (62). While revenues from environmental taxes are relatively high (2.9 % of GDP compared to 2.5 % of GDP for the EU in 2014), energy taxes are comparatively low. Certain characteristics of the tax system hinder its potential fiscal and environmental impact, such as the subsidies on company cars and the lack of indexation for environmental taxes.
59 ()See EY’s Attractiveness Survey: Malta 2015.60 ()Idem.61 ()Source: http://ec.europa.eu/eurostat/web/europe-2020-
indicators/resource-efficient-europe62 ()Source:
http://www.eco-innovation.eu/images/stories/Reports/EIO_Country_Brief_2013_Malta.pdf
30

2.3. Business environment and competitiveness
Public administration and business environment
Despite registering some progress, there is potential to further improve the efficiency of public administration. According to the World Bank 2015 Worldwide Governance Indicators, Malta scores below EU average on the government effectiveness indicator, which captures the perceptions of the quality of public services, the capacity of the civil service and its independence from political pressures, and the quality of policy formulation. Data reveal that while the governance score for government effectiveness had increased from 0.83 in 2004 to 1.17 in 2009, it has worsened to 1.03 in 2014 (63). The EU average scores were 1.23 (2004), 1.14 (2009) and 1.13 (2014).
Overall, Malta presents a mixed record regarding the environment for business. The World Bank’s 2016 Doing Business survey ranks Malta 80 out of 189 economies in the ease of doing business. A detailed look in the different areas of the survey shows a mixed record: relative strengths in terms of paying taxes, protecting minority investors and trading across borders are offset by problems in starting a business in particular (see Graph 2.3.4). According to the 2015 Small Business Act Fact Sheet (64), time to start a business, the cost of enforcing contracts and the licences and permit systems score well below the EU average and remain major obstacles to doing business, especially for SMEs (see Graph 2.3.3).
63 ()The governance score denotes the estimate of governance measured on a scale from approximately -2.5 to 2.5. Higher values correspond to better governance. The percentile ranks of Malta among all 215 countries covered by the Worldwide Governance Indicators are 77.07 (2004), 84.21 (2009) and 80.77 (2014) respectively.
64 ()2015 SBA Fact Sheet for Malta available at: http://ec.europa.eu/growth/smes/business-friendly-environment/performance-review/files/countries-sheets/2015/malta_en.pdf
Graph 2.3.3: Responsiveness of the public administration to the needs of SMEs (standard deviations, EU average = 0)
-2.0 -1.5 -1.0 -0.5 0.0 0.5 1.0 1.5 2.0
13
12
11
10
9
8
7
6
5
4
3
2
1
Data bars pointing right show better performance than the EU average; data bars pointing left show weaker performance.1 – Burden 2 – Licenses and permit systems3 – SMEs interacting online with public authorities4 – Complex administrative procedures are a problem 5 – Fast changing legislation and policies is a problem6 – Cost of enforcing contracts7 – Time it takes to pay taxes8 – Number of tax payments9 – Cost required to transfer property10 – Time required to transfer property11 – Paid-in minimum capital12 – Cost of starting a business13 – Time to start a businessSource: 2015 SBA Fact Sheet Malta
Graph 2.3.4: Malta ranking in Doing Business report
13283
86
96174
36
25
39
61
83
StartingBusiness
Dealing withConstruction
Permits
GettingElectricity
RegisteringProperty
Getting Credit
ProtectingMinority
Investors
Paying Taxes
Trading AcrossBorders
EnforcingContracts
ResolvingInsolvency
MT EU average
Numbers show Malta's ranking out of 189 participants in each categorySource: World Bank 2016 Doing Business report
31

2.3. Business environment and competitiveness
Policy action since 2008 has been in the right direction. Start-up times have been reduced by two days and costs have been cut. In the 2016 budget, the government committed to further simplifications. As regards the cost of enforcing contracts and the licencing and permit system, in 2014 the Malta Environment and Planning Authority launched a collection of measures aimed at improving service delivery to the private sector and addressing issues such as excessive costs, inefficiency, permit time and unnecessary bureaucracy. The government has recently appointed a group of professionals to address the shortcomings in the legislation on insolvency and bankruptcy. In an effort to reduce administrative red tape in Malta, the Commissioner for simplification has carried out a number of initiatives since March 2014. These include the organisation of stakeholder meetings so as to identify specific burden-reduction measures, a recent ‘Repeal Day’ on which the abolishment of a number of laws and regulations was announced, and the adoption of the ‘one in — one out’ principle in legislation. Around 200 pieces of legislation have been identified as possible target for simplification. Nevertheless, there remains significant room for improvement. In the 2015-2016 World Economic Forum’s Global Competitiveness Report, the inefficiency of government administration is still identified as the most problematic factor for doing business in Malta (65).
Malta has made good progress in implementing the Small Business Act (SBA). It now features a balanced SBA profile (66). With the 2011 national SBA plan and the SBA Implementation Unit, it has created instruments that go a long way to ensuring a systematic application of the policy agenda. However, implementation frequently took longer than previously announced. As a result there are still a number of measures which await implementation.
SMEs' access to finance
SMEs appear to benefit from a better financing environment than many EU peers. SMEs rely heavily on debt financing, including bank lending,
65 ()World Economic Forum. Global Competitiveness Report 2015-2016, page 252.
66 ()Idem.
credit lines, overdrafts and trade credit (67). In particular, bank lending remained the most important source of external financing for 74 % of Maltese SMEs in 2015. The share of SMEs that applied for a bank loan and received the whole amount has increased and is higher than the EU average. On the other hand, access to equity finance is still limited: only 4 % of SMEs consider it as their preferred option. Maltese SMEs report significantly higher confidence than EU peers in talking about financing with both banks and equity investors and that they will obtain the desired funding.
Nevertheless, some persistent problems suggest that the environment for start-ups is a concern. More than one fourth of Maltese SMEs consider that the high interest rates or price are the most important limiting factor to obtaining external financing, followed by insufficient availability of collateral or guarantee. A recent survey (68) concluded that there is scope for simplifying and reducing bank charges relating to loans. In particular, there is a need for a review of charges for incoming and outgoing bank payments. Moreover, whereas there appears to be adequate competition with respect of home loans, there is not enough in business loans. Few alternatives to traditional forms of financing are available for SMEs. Maltese enterprises are among the highest users of retained earnings and sale of assets as a source of internal equity financing. These features support a landscape of more well-established enterprises and fewer start-ups. At the same time the availability of alternatives, such as financial leasing, factoring and external equity financing, is not sufficient.
A number of financial instruments have been made available to help enterprises cover investments and operational expenses. These instruments, namely JEREMIE (69), MicroInvest, MicroCredit, and European Regional Development Fund start-up grant schemes, provide SMEs with tax credits, grants or financial guarantees and are
67 ()2015 Survey on the Access to Finance of Enterprises (SAFE) conducted by the Commission and the European Central Bank.
68 ()The survey was conducted by Malta Financial Services Authority and the Malta Competition and Consumer Affairs Authority.
69 ()Joint European Resources for Micro to Medium Enterprises.
32

2.3. Business environment and competitiveness
financed through a combination of local and EU funds. In particular, the JEREMIE (70) scheme and the MicroGuarantee Scheme are widely considered as positive experiences. However, stakeholder feedback suggests that loans to SMEs in Malta still have a heavy interest mark-up. This seems to be the result of a still limited level of competition among financial intermediaries. There are also reports by stakeholders of continuing bureaucratic obstacles in applying for support. This instrument has been utilised to the benefit of most sectors of the Maltese economy: until 2014, the number of SMEs financed through JEREMIE amounted to 650. Major commercial banks have offered other tailor-made support schemes for SMEs.
Progress is underway to establish a Development Bank in Malta. A key element of the process will be the compatibility of the proposed draft Malta Development Bank Act with EU State aid rules. Moreover, it will be important to ensure that the new institution has sufficient risk management capacities to protect it from mopping up low-quality projects.
The authorities have undertaken initiatives to address the insufficient availability of alternative sources of finance. Since the beginning of 2014, the government has put forward policies geared to providing equity and venture capital, which had been identified as a bottleneck in recent years. However, these measures do not appear sufficient to bring about a lasting solution, concentrating on tax credits and limited amounts for seed funding. Some additional structural measures that are expected to come into force in the near future include the setting up of a central credit register and the launching by the Malta Stock Exchange of a platform designed specifically to help SMEs raise funds through the capital market. The central credit register aims to enhance transparency and to facilitate SMEs' access to funding from banks. It is planned that the register will go live in early 2016, conditional to the legislative proposals passing through Parliament and the success of the pilot run. The availability of alternative sources of finance such 70 ()Under JEREMIE, the First Loss Portfolio Guarantee
instrument helped SMEs to get a lower interest rate that they would have otherwise been subjected to, together with a reduced need for collateral. The programme has been an effective instrument in aiding access to finance by enterprise.
as crowdfunding, venture capital and business angels is still not developed in Malta.
Overall, some progress could be reported in the access to finance situation for SMEs in Malta. Together with the planned Malta Development Bank, the described start-up capita initiatives are useful measures in addressing Malta's issues in this area. It is important that they are swiftly implemented and flanked by other measures aimed at facilitating the start-up of businesses.
Services and professions
Malta experiences subdued market dynamics and low competition in important business services sectors. Market entry rates and churn rates stand significantly below EU averages. Removing barriers would create new opportunities for service providers to enter the market. Malta is among the Member States with the highest regulatory barriers in services. Particular problems in business services stem from restrictive authorisation requirements, compulsory chamber membership requirements, severe restrictions on legal form, shareholding and multidisciplinary activities; insurance requirements; and tariff restrictions. In spite of some progress towards eliminating discriminatory pricing in the transport, telecom and utilities sectors, some discriminatory practices in pricing and/or different treatment towards non-Maltese nationals are still reported. In that respect, the Maltese authorities pledged to approve an Administrative Guide on non-discrimination of service recipients, drafted by the Competition Authority. A draft was presented to the Commission at the beginning 2015, but no developments have been reported since.
Research and innovation
Several structural challenges continue to hamper the country’s growth potential as a very small open economy. Malta made some progress over the period 2007-2014 in terms of research and development (R&D) intensity, which increased from 0.55 % GDP in 2007 to 0.85 % of GDP in 2014, although the level remains rather low in EU terms and is still far away from its national target (2 %). Several bottlenecks continue to hamper the country’s knowledge-driven growth potential, such as meagre public spending (0.34 %
33

2.3. Business environment and competitiveness
GDP in 2014 versus an EU average of 0.72 %), a low level of scientific excellence (linked to a lack of critical mass in specific research areas), a weak human resources base in sciences and technology, and the declining innovation performance of the private sector (71), with the strongest relative weakness in patent applications. Declining performance is also observed for licence and patent revenues from abroad and the sales share of new innovations. Still, performance on some indicators has improved, in particular in non-R&D innovation expenditures; community designs and trademarks; linkages and entrepreneurship; and open, excellent and attractive research systems. In addition, business enterprise expenditure on research and development, at 0.51 % of GDP, constitutes more than half of Malta’s R&D intensity. Finally, establishing adequate framework conditions for firms remains a key challenge for competitiveness as shown by the performance in the overall ease of doing business indicator (72), where Malta is ranked in the lowest EU performers with Greece and Luxembourg. Moreover, Malta remains in the ‘moderate innovator’ group (73), although its ranking has improved (from 22nd in 2014 to 18th in 2015) and overall innovation performance has recovered strongly, reaching 71 % of the EU average and up from 57 % in 2012.
Several instruments are in place to stimulate research and development and innovation projects. The National R&I Strategy for 2020 (adopted in February 2014) set the goal to stimulate knowledge-driven growth. This strategy complements the Smart Specialisation Strategy, which will help to guide investments to be made through the European Structural and Investment Funds, and the Innovation Strategy for Smart Specialisation (adopted in 2014) which contains tailor-made measures (i.e. actions, tools, platforms, incentives) in seven selected areas in order to develop the research and innovation ecosystem (74). Furthermore, Malta offers R&D tax incentives, targeting industrial projects aimed at developing innovative products and solutions, 71 ()Innovation Union Scoreboard 2015.72 ()Doing Business Report, World Bank, June 2015.73 ()Innovation Union Scoreboard 2015.74 ()Notably, tourism, maritime services, aviation & aero-
space, healthy living & active ageing & e-health, resource-efficient buildings, high value-added manufacturing and aquaculture.
which have become an important tool for supporting private R&D. Evidence from a recent study (75) suggests that there is some scope for Malta to reduce the fragmentation and overlap of instruments. In addition, the evaluation of the impact of these measures could be usefully enhanced. Intellectual Property Right incentives in the form of tax exemptions on income from patents are also available (76) and, in the 2016 budget the government announced a tax credit to facilitate research and innovation for enterprises. A new scheme was launched in 2015 to improve the quality of the science base. Furthermore, several infrastructural projects are expected to have a positive impact on the science base as well as to support research and development in health (pharmaceuticals) and information and communication technologies. A number of new initiatives to improve access to finance by leveraging private sector investments in start-ups and SMEs were introduced in 2015. These aim to complement several existing, albeit not very successful, ones. Finally, in March 2015, the Operational Programme I (2014-2020) under European Regional Development Fund and the Operational Programme II (2014-2015) under European Social Fund, which contains relevant measures to support research and innovation, were officially launched.
Justice system
The efficiency of the justice system continues to demonstrate shortcomings, but the implementation of the ongoing judicial reforms programme has prompted some positive trends. While the time needed to resolve civil, commercial and administrative cases in first instance courts was the highest in the EU in 2013, there was notable improvement in 2014. The rate of resolving administrative cases also improved substantially in 2014, although there remains room for improvement as this rate was still the lowest in
75 ()CPB (2014) A Study on R&D Tax Incentives , Taxation Papers, Working Paper No 52 - 2014 European Commission
76 ()Although there is evidence that such measures may prompt or facilitate aggressive tax planning in the absence of sufficient safeguards (see Ramboll Management Consulting and Corit Advisory (2016), Study on Structures of Aggressive Tax Planning and Indicators, European Commission Taxation Paper n°61).
34

2.3. Business environment and competitiveness
the EU in 2013 (77).The tools in place to evaluate the judicial system are limited, since there is no regular evaluation system or performance and quality indicators of courts’ activities. Targeted measures related to the reform of the judicial system started to be implemented in 2014. Their aim was to substantially improve the quality and the efficiency of the judicial system. Regarding the quality of the judicial system, a number of new technological and procedural systems have been introduced to reduce bureaucracy and delays in the civil courts, namely the extensive use of mobile telephone applications, e-filing and the online exchange of information. The recent appointments to the judiciary made by the government have also substantially increased female representation in the judiciary (with the representation increasing to 43 %). With respect to efficiency, in January 2016, Parliament approved a bill which implements another set of proposals from the Justice Reform Commission report focusing on simplifying civil procedures.
The judicial system still faces challenges in relation to insolvency procedures. It takes 3 years to resolve insolvency cases in Malta, compared to an EU average of 2.01 years. The government has recently appointed a group of professionals to address the shortcomings in Malta’s legislation on insolvency and bankruptcy. The group is currently chaired by the Governor of the Central Bank and is meeting regularly. It explores ways of streamlining the justice process. This includes contributing to the updating of insolvency legislation and to providing mechanisms to expedite insolvency and allow parties to receive a second chance. These are still at drafting stage with more detailed information is expected later this year. As regards training, Malta is one of the few Member States where there is currently no compulsory pre-service or in-service training for judges. Alternative dispute-resolution methods and mediation are still under-used in Malta. However, efforts to promote mediation by the Mediation Centre and the University of Malta, including by creating a Master’s of Arts in Mediation which started in October 2015, are expected to produce positive effects.
77 ()EU Justice Scoreboard 2016
35

2.3. Business environment and competitiveness
Table 2.3.1: Key research and innovation intensity indicatorsCompound EU Rank
annual average (2) within
growth EU
2007-2014 (1)
R&D Intensity (% of GDP) 0.85 6.4 2.03 22
Public expenditure on R&D (GOVERD + HERD) as % of GDP 0.38 (10) 9.1 0.72 25
Business enterprise expenditure on R&D, % of GDP 0.51 4.9 1.30 20
Scientific publications within the top 10% most cited scientific publications worldwide as % of total scientific publications of the country
: -0.1 (3) 11.41 20
Share of population aged 30-34 who have successfully completed tertiary education (%)
26.0 2.8 37.9 26
Public-private scientific co-publications per million population : 23.9 50.3 24
Public expenditure on R&D financed by business enterprise (national) as % of GDP
: 94.9 0.051 27
New graduates in science and engineering per thousand population aged 25-34
14.8 (10) 12.6 16.3 17
Barriers to entrepreneurship 2.18 (10) : 1.69 (4) 28 (5)
Starting a business 75.67 (10) 0.0 89.0 (4) 28
Business enterprise expenditure on R&D (BERD) financed by the public sector (national and abroad) as % of GDP
: 134.6 0.099 23
Value added in high-tech manufacturing as % of total value added (6) 2.0 -12.1 1.75 (7) 3 (7)
Value added in high-tech knowledge-intensive services as % of total value added
5.47 2.4 5.05 (7) 6 (7)
Share of employment in high-growth enterprises : -7.2 9.14 (8) 15 (8)
Innovative high-growth enterprises: DYN 16.94 (10) 5.7 18.80 7
Malta 2014
(1) Compound annual growth refers to growth between the earliest available year and the latest available year for which compatible data are available over the period 2007-14(2) EU average for the latest available year.(3) Compound annual growth refers to the period 2005-2010.(4) EU average is the unweighted average of the Member States' scores.(5) The values for this indicator were ranked from lowest to highest.(6) MT: High-tech value added for MT was derived by DG RTD.(7) Value added: EU does not include HR. HR was not included in the EU ranking.(8) EU does not include EL. EL was not included in the EU ranking.(9) Values in italics are estimated or provisional.(10) Values refer to 2013 dataSource: European Commission
36

ANNEX AOverview TableCommitments Summary assessment78
2015 Country-specific recommendations
CSR 1:
Following correction of the excessive deficit, achieve a fiscal adjustment of 0.6 % of GDP towards the medium-term budgetary objective in 2015 and 2016.
CSRs related to compliance with the Stability and Growth Pact will be assessed in spring once the final data will be available.
CSR 2:
Take measures to improve basic skills and further reduce early school-leaving by promoting the continuous professional development of teachers.
Malta has made some progress in addressing CSR 2:
Malta has made some progress in promoting the continuous professional development of teachers.
An institute for continuous professional development of teachers was set up.
CSR 3:
To ensure the long-term sustainability of public finances, continue the ongoing pension reform, such as by accelerating the already enacted increase in the statutory retirement age and by consecutively linking it to changes in life expectancy.
Malta has made limited progress in addressing CSR 3:
Malta has made limited progress on the pensions system reform. Some new measures aiming to address both sustainability and adequacy concerns were proposed by the government in the 2016 Budget, following recommendations made by a Pension Strategy Group; however they haven't yet been reflected in the legislation.
CSR 4: Malta has made some progress in addressing
78 The following categories are used to assess progress in implementing the 2015 CSRs:No progress: The Member State (MS) has neither announced nor adopted measures to address the CSR. This category also applies if
the MS has commissioned a study group to evaluate possible measures.Limited progress: The MS has announced some measures to address the CSR, but these appear insufficient and/or their
adoption/implementation is at risk.Some progress: The MS has announced or adopted measures to address the CSR. These are promising, but not all of them have been
implemented and it is not certain that all will be.Substantial progress: The MS has adopted measures, most of which have been implemented. They go a long way towards
addressing the CSR.Fully implemented: The MS has adopted and implemented measures that address the CSR appropriately
37

A. Overview Table
Improve small and micro-enterprises' access to finance, in particular through non-bank instruments.
CSR 4:
Malta has made some progress to improve SMEs and micro-enterprises’ access to finance. Measures to support SMEs access to non-bank financing should be further encouraged, including through more co-investment schemes with venture capital and business angels, by encouraging market uptake of crowdfunding and by taking advantage of the opportunities offered by EU funding programmes.
Europe 2020 (national targets and progress)
Policy field target Progress achieved
National employment target (70 %) With the employment rate growing from 66.4 % in 2014 to 67.8 % in the first three quarters of 2015, Malta is progressing towards the new national target.
National target for expenditure on research & development (2 % of GDP)
Malta's R&D intensity in 2014 stands at 0.85 % of GDP, which remains very low in comparison to the EU average of 2.03 %, and is still far away from the 2 % of GDP national target.
National target for reducing greenhouse-gas emissions falling under sectors outside the scope of the Emissions Trading Scheme (+5 % compared to 2005 level)
According to the latest national projections, and taking into account existing measures, it is expected that the target will be achieved. The level of emissions in 2020 is projected to decrease by 16% compared to the 2005 level (margin of 11 percentage points).
Renewable energy target (10%) Malta's renewable energy share has recently increased, reaching 4.7 % in 2014, above the indicative trajectory towards the 2020 target. However, significant renewables deployment is needed in view of the steep trajectory towards 2020. Use of cooperation mechanisms with other Member States could be considered to facilitate the achievement of the renewable energy target.
With a 4.7 % share of renewable energy in transport in 2014, Malta has improved its performance but is still less than halfway in reaching the 10% renewable energy target in transport.
National energy efficiency target (reducing primary energy consumption to 0.726 Mtoe and final
The target for 2020 expressed in final energy consumption was increased from 0.493 Mtoe to
38

A. Overview Table
consumption to 0.547 Mtoe) 0.547 Mtoe due to economic growth, which means that the target became less ambitious. Malta would need to increase its current efforts to reach the 2020 target expressed in final energy consumption.
National early-school-leaving target (10 %) 22.7 % in 2011, 21.1 % in 2012, 20.8 % in 2013, 20.3 % in 2014.
National target for tertiary-education attainment (33 %)
23.4 % in 2011, 24.9 % in 2012, 26 % in 2013, 26.5 % in 2014.
National poverty target (lifting 6,560 individuals from the risk of poverty or social exclusion)
Malta committed to reduce by 6,560 the number of people at risk of poverty or social exclusion. The number in 2014 stood at the same level as in 2013 – 99,000. There has been no progress towards achieving the target.
39
ANNEX BMIP scoreboardTable B.1: MIP scoreboard - Malta
Thresholds 2009 2010 2011 2012 2013 2014Current account balance, (% of GDP) 3 year average -4%/6% -3.1 -4.1 -4.5 -1.9 0.9 2.6
-35% 12.6 12.1 7.9 21.3 20.8 39.5
Real effective exchange rate - 42 trading partners, HICP deflator
3 years % change ±5% & ±11% 5.8 -0.7 -5.0 -7.6 -1.3 0.0
Export market share - % of world exports 5 years % change -6% 46.1 38.5 22.3 12.8 -2.2 -18.2
Nominal unit labour cost index (2010=100) 3 years % change 9% & 12% 11.2 9.2 10.2 8.2 10.1 7.0
6% -6.2 -1.0 -3.7 0.5 -1.5 2.6
14% 13.6 5.6 5.1 2.6 3.6 7.8
133% 167.5 161.9 158.4 154.4 148.3 146.4
60% 67.8 67.6 69.8 67.6 69.6 68.3
Unemployment rate 3 year average 10% 6.5 6.6 6.7 6.5 6.4 6.2
16.5% 4.4 12.4 10.9 6.4 1.9 5.8
-0.2% 1.5 1.6 2.7 3.7 4.6 4.5
0.5% 0.2 0.4 0.6 0.2 -0.2 -0.4
2% -1.0 -0.3 1.6 -0.4 -0.2 -1.5
External imbalances and competitiveness
New employment indicators
Net international investment position (% of GDP)
Deflated house prices (% y-o-y change)
Total financial sector liabilities (% y-o-y change)
Private sector credit flow as % of GDP, consolidated
Private sector debt as % of GDP, consolidated
General government sector debt as % of GDP
Activity rate - % of total population aged 15-64 (3 years change in p.p)
Long-term unemployment rate - % of active population aged 15-74 (3 years change in p.p)
Youth unemployment rate - % of active population aged 15-24 (3 years change in p.p)
Internal imbalances
Note: Figures highlighted are those falling outside the threshold established in the European Commission's Alert Mechanism Report. For REER and ULC, the first threshold applies to euro area Member States.Source: European Commission
40

ANNEX CStandard TablesTable C.1: Financial market indicators
2010 2011 2012 2013 2014 2015Total assets of the banking sector (% of GDP) 760.0 744.9 742.9 668.1 664.0 559.0Share of assets of the five largest banks (% of total assets) 71.3 72.0 74.4 76.5 81.5 -Foreign ownership of banking system (% of total assets) 34.9 33.1 30.9 24.3 17.6 -Financial soundness indicators: - non-performing loans (% of total loans)1) 7.0 7.1 7.8 8.9 9.0 8.6 - capital adequacy ratio (%)1) 14.8 15.5 16.1 16.5 14.7 13.9 - return on equity (%)1) 19.8 17.9 18.7 18.4 14.6 18.1Bank loans to the private sector (year-on-year % change) 2.9 3.0 3.5 -7.4 10.0 0.6Lending for house purchase (year-on-year % change) 8.6 8.6 6.8 6.2 9.6 8.7Loan to deposit ratio 103.8 94.5 89.8 73.7 66.4 63.0Central Bank liquidity as % of liabilities 3.8 2.6 2.5 1.9 0.9 0.3Private debt (% of GDP) 161.9 158.5 153.9 145.9 143.4 -Gross external debt (% of GDP)2) - public 5.7 6.1 8.2 8.7 7.4 7.0
- private 650.9 698.0 707.9 719.1 726.2 722.5Long-term interest rate spread versus Bund (basis points)* 144.4 188.1 263.1 179.3 144.8 99.2Credit default swap spreads for sovereign securities (5-year)* 149.5 253.2 346.2 215.8 208.5 208.51) Latest data Q2 2015.2) Latest data September 2015. Monetary authorities, monetary and financial institutions are not included.* Measured in basis points.Source: IMF (financial soundness indicators); European Commission (long-term interest rates); World Bank (gross external debt); Eurostat (private debt); ECB (all other indicators).
41

C. Standard Tables
Table C.2: Labour market and social indicators2010 2011 2012 2013 2014 2015 (4)
Employment rate(% of population aged 20-64) 60.1 61.6 63.1 64.8 66.4 67.8
Employment growth (% change from previous year) 1.7 3.0 2.5 3.7 5.0 2.5
Employment rate of women(% of female population aged 20-64) 41.6 43.8 46.6 49.8 52.0 53.7
Employment rate of men (% of male population aged 20-64) 78.2 79.0 79.2 79.4 80.4 81.4
Employment rate of older workers (% of population aged 55-64) 31.9 33.2 34.7 36.3 37.8 40.4
Part-time employment (% of total employment, aged 15 years and over) 12.4 13.4 14.1 15.2 16.6 15.7
Fixed term employment (% of employees with a fixed term contract, aged 15 years and over) 5.4 6.6 6.8 7.5 7.8 7.6
Transitions from temporary to permanent employment 10.0 67.2 2.2 25.4 10.6 -Unemployment rate(1) (% active population, age group 15-74)
6.9 6.4 6.3 6.4 5.8 5.5
Long-term unemployment rate(2) (% of labour force) 3.1 3.1 3.1 2.9 2.7 2.5Youth unemployment rate (% active population aged 15-24) 13.2 13.3 14.1 13.0 11.7 12.1
Youth NEET(3) rate (% of population aged 15-24) 9.5 10.2 10.6 9.9 10.5 -Early leavers from education and training (% of pop. aged 18-24 with at most lower sec. educ. and not in further education or training)
23.8 22.7 21.1 20.5 20.3 -
Tertiary educational attainment (% of population aged 30-34 having successfully completed tertiary education) 22.1 23.4 24.9 26.0 26.5 -
Formal childcare (30 hours or over; % of population aged less than 3 years) 3.0 4.0 1.0 3.0 - -
1) Unemployed persons are all those who were not employed but had actively sought work and were ready to begin working immediately or within two weeks. 2) Long-term unemployed are peoples who have been unemployed for at least 12 months. 3) Not in Education Employment or Training. 4) Average of first three quarters of 2015. Data for total unemployment and youth unemployment rates are seasonally adjusted.Source: European Commission (EU Labour Force Survey)
42

C. Standard Tables
Table C.3: Labour market and social indicators (continued)Expenditure on social protection benefits (% of GDP) 2009 2010 2011 2012 2013 2014
Sickness/healthcare 5.8 5.4 5.3 5.4 5.7 -Invalidity 0.9 0.8 0.7 0.7 0.7 -Old age and survivors 9.8 10.2 9.8 10.1 9.9 -Family/children 1.2 1.2 1.2 1.1 1.2 -Unemployment 0.6 0.5 0.5 0.5 0.6 -Housing and social exclusion n.e.c. 0.2 0.2 0.2 0.1 0.1 -Total 18.7 18.5 18.0 18.3 18.5 -of which: means-tested benefits 2.5 2.5 2.5 2.4 2.4 -
Social inclusion indicators 2009 2010 2011 2012 2013 2014
People at risk of poverty or social exclusion(1)
(% of total population)20.3 21.2 22.1 23.1 24.0 23.8
Children at risk of poverty or social exclusion (% of people aged 0-17) 26.5 26.7 27.8 31.0 32.0 31.3
At-risk-of-poverty rate(2) (% of total population) 14.9 15.5 15.6 15.1 15.7 15.9
Severe material deprivation rate(3) (% of total population) 5.0 6.5 6.6 9.2 9.5 10.2Proportion of people living in low work intensity households(4)
(% of people aged 0-59)9.2 9.2 8.9 9.0 9.0 9.8
In-work at-risk-of-poverty rate (% of persons employed) 5.4 5.9 6.1 5.2 5.9 5.7
Impact of social transfers (excluding pensions) on reducing poverty 34.9 34.0 32.8 37.1 32.6 33.2
Poverty thresholds, expressed in national currency at constant prices(5) 5979 5832 5949 6117 6260 6554
Gross disposable income (households; growth %) - - - - - -Inequality of income distribution (S80/S20 income quintile share ratio) 4.0 4.3 4.0 3.9 4.1 4.0
1) People at risk of poverty or social exclusion (AROPE): individuals who are at risk of poverty (AROP) and/or suffering from severe material deprivation (SMD) and/or living in households with zero or very low work intensity (LWI). 2) At-risk-of-poverty rate (AROP): proportion of people with an equivalised disposable income below 60 % of the national equivalised median income. 3) Proportion of people who experience at least four of the following forms of deprivation: not being able to afford to i) pay their rent or utility bills, ii) keep their home adequately warm, iii) face unexpected expenses, iv) eat meat, fish or a protein equivalent every second day, v) enjoy a week of holiday away from home once a year, vi) have a car, vii) have a washing machine, viii) have a colour TV, or ix) have a telephone. 4) People living in households with very low work intensity: proportion of people aged 0-59 living in households where the adults (excluding dependent children) worked less than 20 % of their total work-time potential in the previous 12 months. 5) For EE, CY, MT, SI and SK, thresholds in nominal values in euros; harmonised index of consumer prices (HICP) = 100 in 2006 (2007 survey refers to 2006 incomes)Source: For expenditure for social protection benefits ESSPROS; for social inclusion EU-SILC.
43

C. Standard Tables
Table C.4: Structural policy and business environment indicatorsPerformance indicators 2009 2010 2011 2012 2013 2014Labour productivity (real, per person employed, y-o-y)
Labour productivity in industry na na na na na naLabour productivity in construction na na na na na naLabour productivity in market services na na na na na na
Unit labour costs (ULC) (whole economy, y-o-y)ULC in industry na na na na na naULC in construction na na na na na naULC in market services na na na na na na
Business environment 2009 2010 2011 2012 2013 2014
Time needed to enforce contracts(1) (days) na na na 505 505 505
Time needed to start a business(1) (days) na na na 38.5 38.5 38.5
Outcome of applications by SMEs for bank loans(2) 0.59 na 0.69 na 0.68 0.58
Research and innovation 2009 2010 2011 2012 2013 2014
R&D intensity 0.52 0.64 0.69 0.86 0.85 0.85
Total public expenditure on education as % of GDP, for all levels of education combined 5.32 6.74 7.96 6.76 na na
Number of science & technology people employed as % of total employment 33 33 36 37 38 37
Population having completed tertiary education(3) 13 14 15 16 17 18
Young people with upper secondary level education(4) 70 73 74 76 77 76Trade balance of high technology products as % of GDP -0.94 0.64 0.03 1.81 -1.10 -3.63Product and service markets and competition 2003 2008 2013
OECD product market regulation (PMR)(5), overall na na 1.57
OECD PMR(5), retail na na 1.09
OECD PMR(5), professional services na na 1.66
OECD PMR(5), network industries(6) na na 2.28
1) The methodologies, including the assumptions, for this indicator are shown in detail here: http://www.doingbusiness.org/methodology. 2) Average of the answer to question Q7B_a. "[Bank loan]: If you applied and tried to negotiate for this type of financing over the past six months, what was the outcome?". Answers were codified as follows: zero if received everything, one if received most of it, two if only received a limited part of it, three if refused or rejected and treated as missing values if the application is still pending or don't know. 3) Percentage population aged 15-64 having completed tertiary education. 4) Percentage population aged 20-24 having attained at least upper secondary education. 5) Index: 0 = not regulated; 6 = most regulated. The methodologies of the OECD product market regulation indicators are shown in detail here: http://www.oecd.org/competition/reform/indicatorsofproductmarketregulationhomepage.htm
6) Aggregate OECD indicators of regulation in energy, transport and communications (ETCR).Source: European Commission; World Bank — Doing Business (for enforcing contracts and time to start a business); OECD (for the product market regulationindicators); SAFE (for outcome of SMEs' applications for bank loans).
44
C. Standard Tables
Table C.5: Green growthGreen growth performance 2009 2010 2011 2012 2013 2014
MacroeconomicEnergy intensity kgoe / € 0.16 0.17 0.16 0.17 0.14 -Carbon intensity kg / € 0.55 0.53 0.53 0.53 0.46 -Resource intensity (reciprocal of resource productivity) kg / € 0.62 0.52 0.66 0.74 0.70 0.86Waste intensity kg / € - 0.24 - 0.24 - -Energy balance of trade % GDP -0.1 1.1 -2.8 -12.1 -9.3 -15.8Weighting of energy in HICP % 6.48 6.28 6.65 7.31 7.57 8.05Difference between energy price change and inflation % 9.9 27.1 0.4 -2.0 -1.6 -17.0
Real unit of energy cost % of value added 17.1 17.1 17.1 - - -
Ratio of labour taxes to environmental taxes ratio 3.4 3.5 3.6 3.9 4.2 4.0 Environmental taxes % GDP 3.2 2.9 3.0 2.8 2.7 2.9
Sectoral Industry energy intensity kgoe / € - - - - - -
Real unit energy cost for manufacturing industry % of value added 8.7 8.7 8.7 - - -
Share of energy-intensive industries in the economy % GDP - - - - - -Electricity prices for medium-sized industrial users € / kWh 0.14 0.18 0.18 0.18 0.18 0.18Gas prices for medium-sized industrial users € / kWh - - - - - -Public R&D for energy % GDP 0.00 0.00 0.00 0.00 0.00 0.00Public R&D for environment % GDP 0.00 0.00 0.00 0.00 0.00 0.00Municipal waste recycling rate % 3.4 5.2 12.7 12.6 10.8 -Share of GHG emissions covered by ETS* % 63.4 62.7 63.8 65.4 60.9 60.7Transport energy intensity kgoe / € - - - - - -Transport carbon intensity kg / € - - - - - -
Security of energy supplyEnergy import dependency % 99.9 99.0 101.3 101.0 104.1 -Aggregated supplier concentration index HHI 0.0 0.0 0.0 0.0 - -Diversification of energy mix HHI 1.00 0.99 0.98 0.98 - -
General explanation of the table items: All macro intensity indicators are expressed as a ratio of a physical quantity to GDP (in 2005 prices) Energy intensity: gross inland energy consumption (in kgoe) divided by GDP (in EUR) Carbon intensity: greenhouse gas emissions (in kg CO2 equivalents) divided by GDP (in EUR) Resource intensity: domestic material consumption (in kg) divided by GDP (in EUR) Waste intensity: waste (in kg) divided by GDP (in EUR) Energy balance of trade: the balance of energy exports and imports, expressed as % of GDP Weighting of energy in HICP: the proportion of "energy" items in the consumption basket used for the construction of the HICP. Difference between energy price change and inflation: energy component of HICP, and total HICP inflation (annual % change). Real unit energy cost: real energy costs as a percentage of total value added for the economy Environmental taxes over labour taxes and GDP: from European Commission's database, ‘Taxation trends in the European Union’ Industry energy intensity: final energy consumption of industry (in kgoe) divided by gross value added of industry (in 2005 EUR) Real unit energy costs for manufacturing industry: real costs as a percentage of value added for manufacturing sectors Share of energy-intensive industries in the economy: share of gross value added of the energy-intensive industries in GDP Electricity and gas prices for medium-sized industrial users: consumption band 500–20 00MWh and 10 000–100 000 GJ; figures excl. VAT. Municipal waste recycling rate: ratio of recycled municipal waste to total municipal waste Public R&D for energy or for the environment: government spending on R&D (GBAORD) for these categories as % of GDP Proportion of greenhouse gas (GHG) emissions covered by EU Emission Trading System (ETS): based on greenhouse gas emissions (excl land use, land use change and forestry) as reported by Member States to the European Environment Agency) Transport energy intensity: final energy consumption of transport activity (kgoe) divided by transport industry gross value added (in 2005 EUR) Transport carbon intensity: greenhouse gas emissions in transport activity divided by gross value added of the transport sector Energy import dependency: net energy imports divided by gross inland energy consumption incl. consumption of international bunker fuels Aggregated supplier concentration index: covers oil, gas and coal. Smaller values indicate larger diversification and hence lower risk. Diversification of the energy mix: Herfindahl index over natural gas, total petrol products, nuclear heat, renewable energies and solid fuels; * European Commission and European Environment AgencySource: European Commission (Eurostat) unless indicated otherwise
45