Embed Size (px)
Citation preview
Infrastructure at your Service.
WebLogic Monitoring using RESTful Interface

Infrastructure at your Service.
09/10/2016WLS RESTful monitoringPage 2
About me
Pascal Brand
Consultant
+41 79 796 43 59

Experts At Your Service
> Over 45 specialists in IT infrastructure
> Certified, experienced, passionate
Based In Switzerland
> 100% self-financed Swiss company
> Over CHF6 mio. turnover
Leading In Infrastructure Services
> More than 120 customers in CH, D, & F
> Over 40 SLAs dbi FlexService contracted
09/10/2016
dbi servicesWho we are
Page 3
WLS RESTful monitoring

Agenda
1.Introduction
2.Monitoring
3.Conclusion
09/10/2016Page 4
WLS RESTful monitoring

> Subtitle 1 – not mandatory
> Subtitle 2 – not mandatory
> Subtitle 3 – not mandatory
09/10/2016
Introduction
> RESTful General Concepts
> WebLogic RESTful General Concepts
> Monitoring
WLS RESTful monitoring

REST – Representational state transfer
> "It is an architectural style used for web development. Systems and sites designed using this style aim for fast performance, reliability and the ability to scale”
> Uses HTTP(S) Protocol for data communication
> Every component is a resource
> A resource is accessed by a common interface using HTTP standard methods
RESTful General Concepts
09/10/2016
Introduction
Page 6
WLS RESTful monitoring
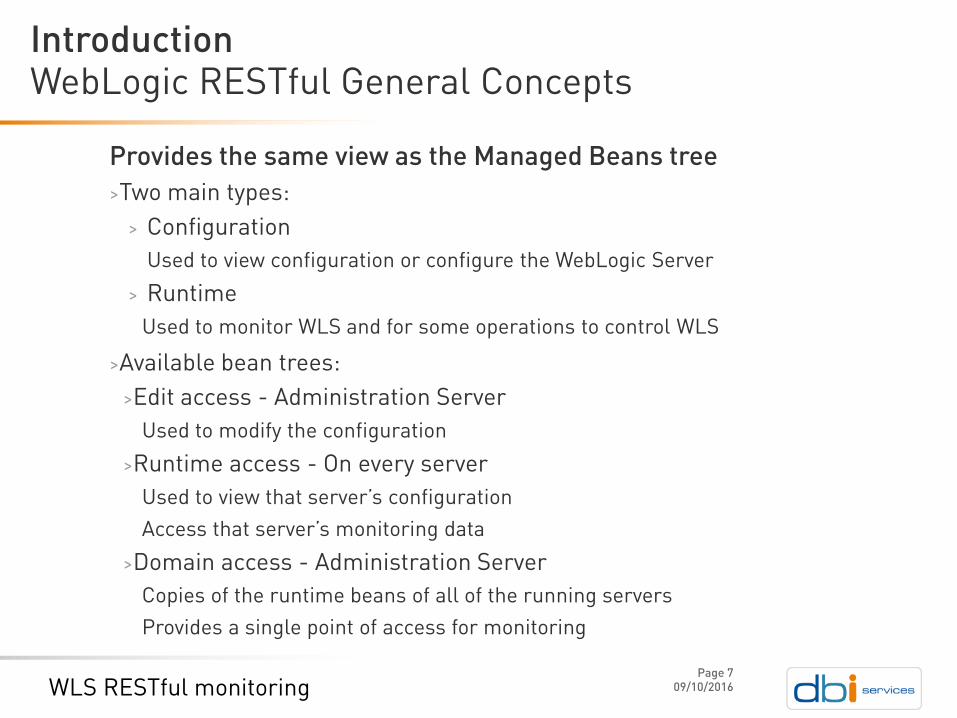
Provides the same view as the Managed Beans tree
>Two main types:
> Configuration
Used to view configuration or configure the WebLogic Server
> Runtime
Used to monitor WLS and for some operations to control WLS
WebLogic RESTful General Concepts
09/10/2016
Introduction
Page 7
WLS RESTful monitoring
>Available bean trees:
>Edit access - Administration Server
Used to modify the configuration
>Runtime access - On every server
Used to view that server’s configuration
Access that server’s monitoring data
>Domain access - Administration Server
Copies of the runtime beans of all of the running servers
Provides a single point of access for monitoring
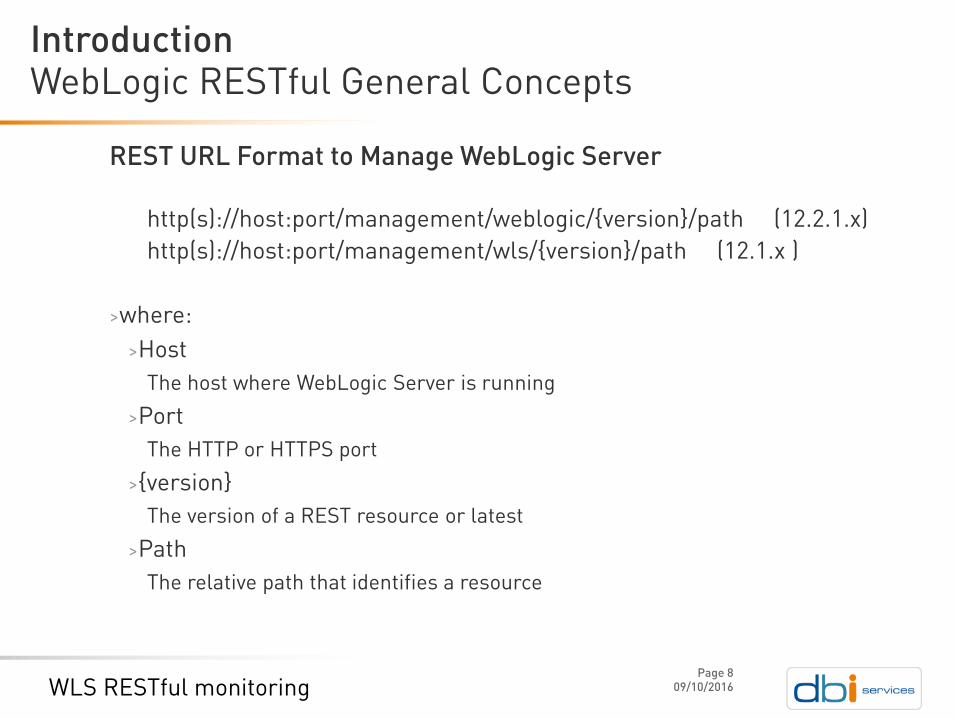
REST URL Format to Manage WebLogic Server
http(s)://host:port/management/weblogic/{version}/path (12.2.1.x)
http(s)://host:port/management/wls/{version}/path (12.1.x )
WebLogic RESTful General Concepts
09/10/2016
Introduction
Page 8
WLS RESTful monitoring
>where:
>Host
The host where WebLogic Server is running
>Port
The HTTP or HTTPS port
>{version}
The version of a REST resource or latest
>Path
The relative path that identifies a resource

REST interfaces for accessing resources:
> Configuration
> monitoring
WebLogic RESTful General ConceptsIntroduction
09/10/2016WLS RESTful monitoringPage 9
Rest Method Task
GET Retrieve data for an object in the tree
POST Add an object to the tree
POST Update an object in the tree
POST Issue a search
DELETE Delete an object from the tree

REST Resource
WebLogic RESTful General Concepts
09/10/2016
Introduction
Page 10
WLS RESTful monitoring
>Items:
>Properties
>Links:
>Parent
>Self
>Childs
>Operations
>Create Forms
>Others

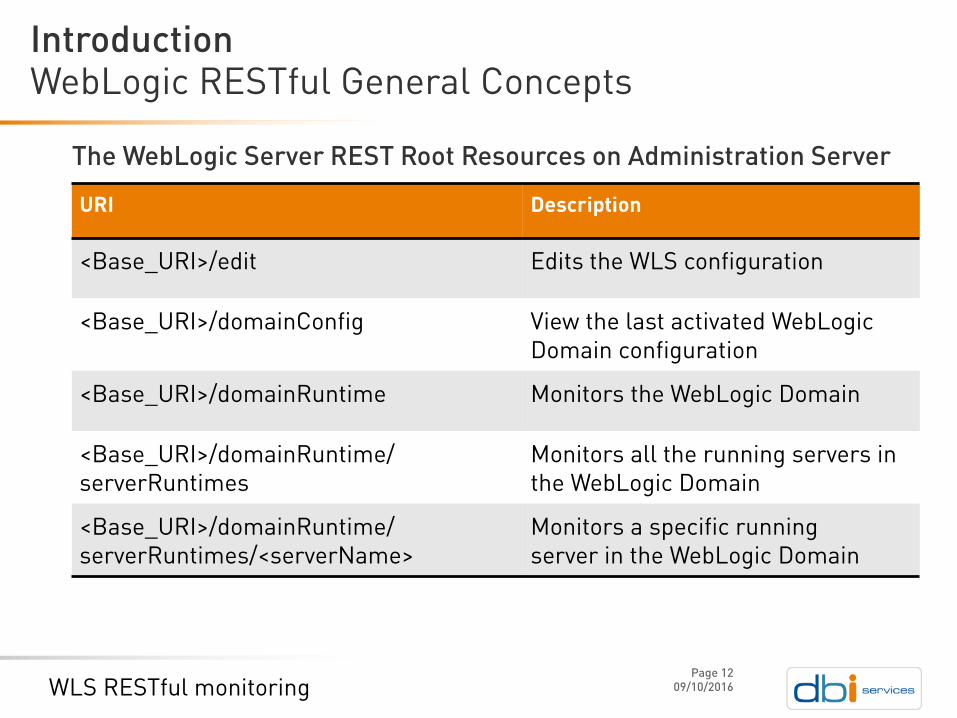
The WebLogic Server REST Root Resources on Administration Server
WebLogic RESTful General ConceptsIntroduction
09/10/2016WLS RESTful monitoringPage 11
URI Description
/management/weblogic/<version> Base URI For WebLogic 12.2.1.x REST Accesses
<Base_URI>/serverConfig View the Administration Servercurrently running configuration
<Base_URI>/serverRuntime Monitors the AdministrationServer
/management/lifecycle Life cycle management (LCM)REST resources
/management/wls 12.1.3 (legacy) WLS REST resources
The WebLogic Server REST Root Resources on Administration Server
WebLogic RESTful General ConceptsIntroduction
09/10/2016WLS RESTful monitoringPage 12
URI Description
<Base_URI>/edit Edits the WLS configuration
<Base_URI>/domainConfig View the last activated WebLogic Domain configuration
<Base_URI>/domainRuntime Monitors the WebLogic Domain
<Base_URI>/domainRuntime/serverRuntimes
Monitors all the running servers in the WebLogic Domain
<Base_URI>/domainRuntime/serverRuntimes/<serverName>
Monitors a specific runningserver in the WebLogic Domain
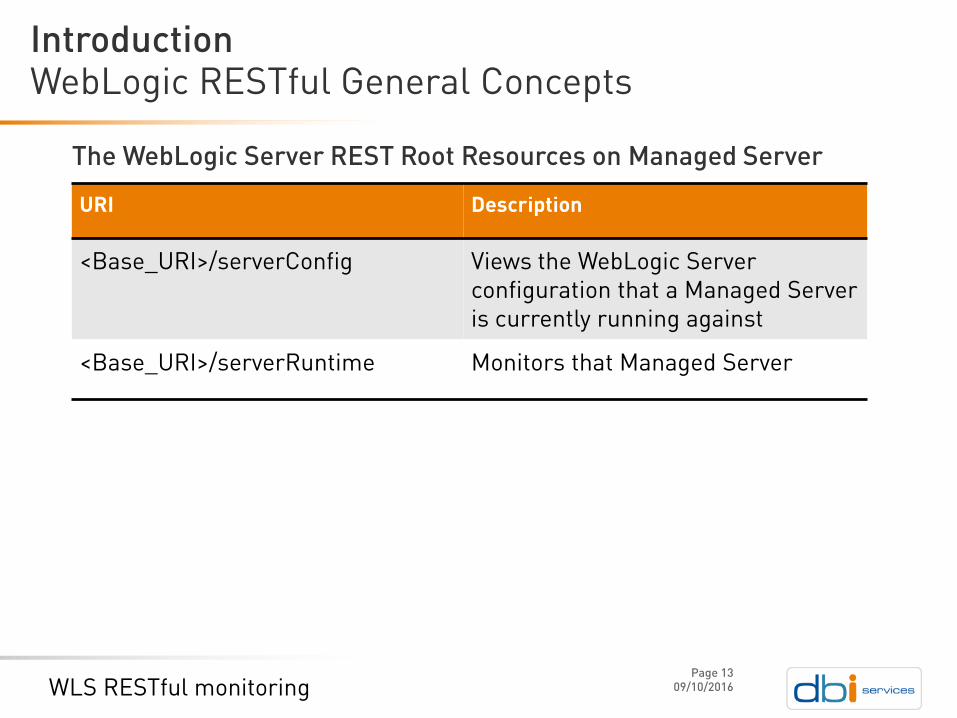
The WebLogic Server REST Root Resources on Managed Server
WebLogic RESTful General ConceptsIntroduction
09/10/2016WLS RESTful monitoringPage 13
URI Description
<Base_URI>/serverConfig Views the WebLogic Server configuration that a Managed Server is currently running against
<Base_URI>/serverRuntime Monitors that Managed Server
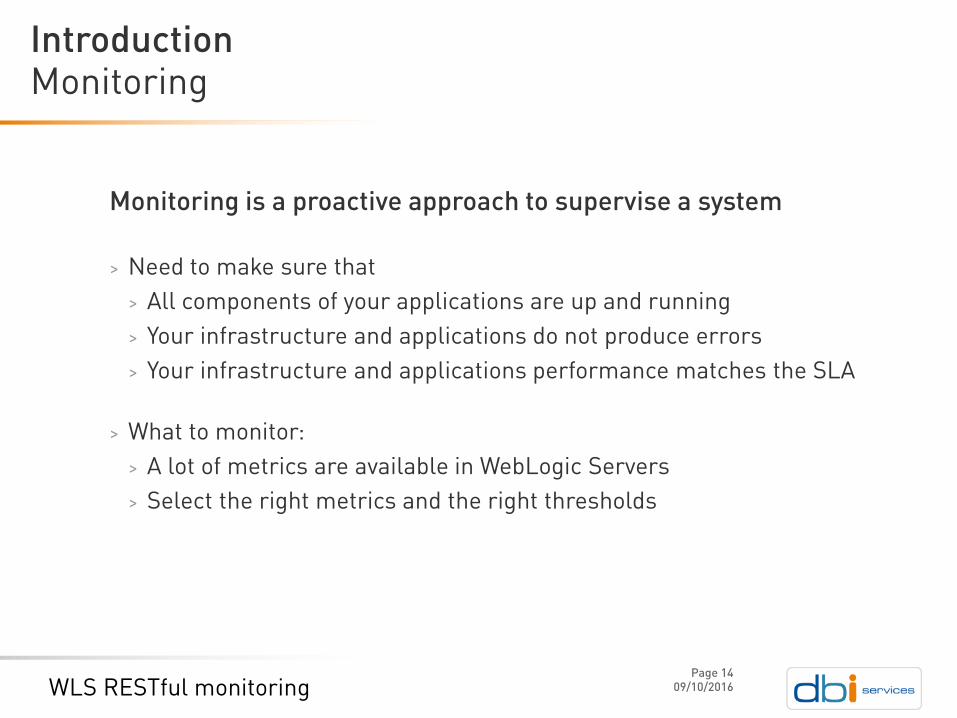
Monitoring is a proactive approach to supervise a system
> Need to make sure that
> All components of your applications are up and running
> Your infrastructure and applications do not produce errors
> Your infrastructure and applications performance matches the SLA
> What to monitor:
> A lot of metrics are available in WebLogic Servers
> Select the right metrics and the right thresholds
Monitoring Introduction
09/10/2016WLS RESTful monitoringPage 14

Why using RESTful for monitoring ?
> Is lightweight and fast retrieving data for an object in the beans tree
> All you send is a URL request to get the desired WebLogic Server metrics
> The interface is available on administration server and managed servers
> Full support for all WebLogic resources
> Can be used from any programming language
> UNIX curl, Python, Java, etc..
> No need to run WLST script or JMX on the client side
> No additional Software installation
> No need to run a WLST locally on the WebLogic Server host
> No additional resources used
Monitoring ?Introduction
09/10/2016WLS RESTful monitoringPage 15

The WebLogic Server REST interfaces allows to filter the results
> No additional development needed
Why using RESTful for monitoring ?Introduction
09/10/2016WLS RESTful monitoringPage 16
Parameter Name Description
fields Only return these properties
excludeFields Return all properties except for these properties
links Only return links with these names
excludeLinks Return all links except for the ones with these names

> Subtitle 1 – not mandatory
> Subtitle 2 – not mandatory
> Subtitle 3 – not mandatory
09/10/2016
Monitoring
> General health key metric
> JVM key metrics
> Threads key metrics
> JDBC key metrics
> Applications key metrics
> Security Concerns
> Monitoring tools
WLS RESTful monitoring
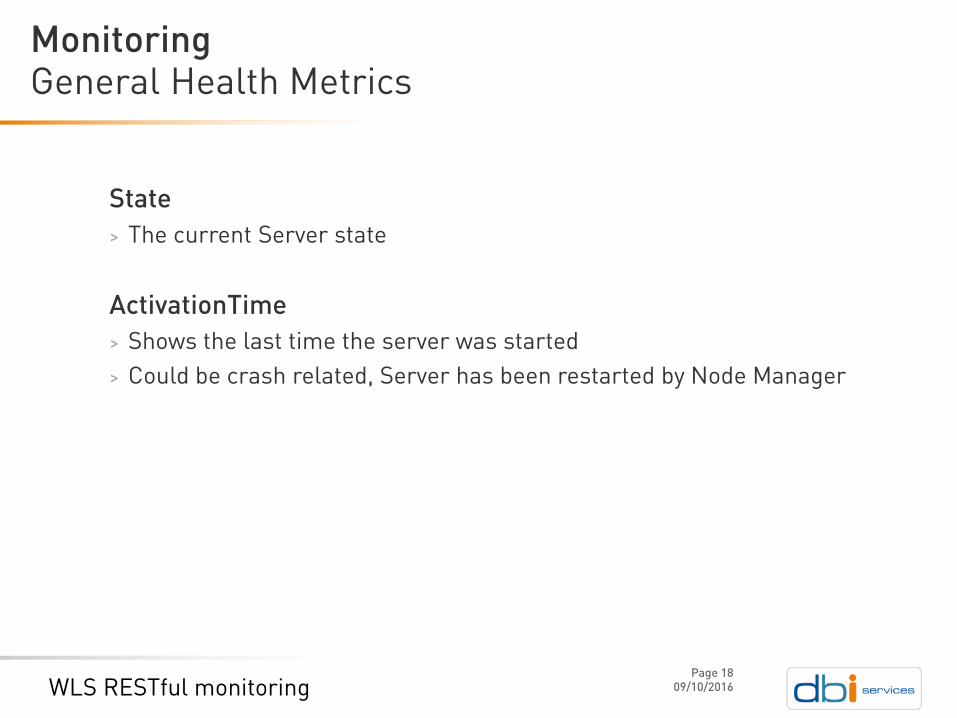
State
> The current Server state
ActivationTime
> Shows the last time the server was started
> Could be crash related, Server has been restarted by Node Manager
General Health MetricsMonitoring
09/10/2016WLS RESTful monitoringPage 18

Get a WebLogic Server General health metrics using WLST
General Health MetricsMonitoring
09/10/2016WLS RESTful monitoringPage 19
userConfig='/app/nagios/etc/objects/scripts/TST_configfile.secure‘
userKey='/app/nagios/etc/objects/scripts/TST_keyfile.secure‘
address=‘host01.example.com‘
port=‘7002‘
servername=‘server1‘
connect (userConfigFile=userConfig, userKeyFile=userKey, url='t3s://'
+ address + ':' + port)
domainRuntime()
cd('/ServerRuntimes/' + servername )
print ' ‘
print 'wl_Health_OUT',
get('State'),
get('ActivationTime')
disconnect()
exit()

Get a WebLogic Server General health Key Metrics using 12.2.1 RESTful
General Health MetricsMonitoring
09/10/2016WLS RESTful monitoringPage 20
https://host01:7002/management/weblogic/latest/domainRuntime/serverRun
times/server1?fields=state,activationTime&links=none
{
"state": "RUNNING",
"activationTime": 1470982524188
}

Get a WebLogic Domain General health Key Metrics using WLST
General Health MetricsMonitoring
09/10/2016WLS RESTful monitoringPage 21
userConfig='/app/nagios/etc/objects/scripts/TST_configfile.secure‘
userKey='/app/nagios/etc/objects/scripts/TST_keyfile.secure‘
address=‘host01.example.com‘
port=‘7002‘
connect (userConfigFile=userConfig, userKeyFile=userKey, url='t3s://'
+ address + ':' + port)
domainConfig()
cd('/')
serverNames = cmo.getServers()
domainRuntime()
for serverName in serverNames:
state(serverName.name,'Server')
disconnect()
exit()

Get a WebLogic Domain General health Key Metrics using 12.2.1 RESTful
General Health MetricsMonitoring
09/10/2016WLS RESTful monitoringPage 22
https://host01:7002/management/weblogic/latest/domainRuntime/serverRun
times?fields=name,state,activationTime&links=none
{
"name": "AdminServer",
"state": "RUNNING",
"activationTime": 1473234973467
},
{
"name": "server2",
"state": "RUNNING",
"activationTime": 1473235510682
},
{
"name": "server1",
"state": "RUNNING",
"activationTime": 1473235506258
}

The memory management is not a task of WebLogic server, this is the work of the Java Virtual Machine
heapSizeCurrent
> The current size (in bytes) of the JVM heap
heapFreeCurrent
> The current amount of memory (in bytes) that is available in the JVM heap
heapSizeMax
> The maximum memory configured for this JVM
heapFreePercent
> Percentage of the maximum memory that is free
JVM Key MetricsMonitoring
09/10/2016WLS RESTful monitoringPage 23

Get JVM Key Metrics using WLST
JVM Key MetricsMonitoring
09/10/2016WLS RESTful monitoringPage 24
userConfig='/app/nagios/etc/objects/scripts/TST_configfile.secure‘
userKey='/app/nagios/etc/objects/scripts/TST_keyfile.secure‘
address=‘host01.example.com‘
port=‘7002‘
servername=‘server1‘
connect (userConfigFile=userConfig, userKeyFile=userKey, url='t3s://‘
+ address + ':' + port)
domainRuntime ()
cd('/ServerRuntimes/' + servername + '/JVMRuntime/' +
server.getName())
print 'heapfree_' + servername + '_OUT',
get('HeapFreeCurrent'),
get('HeapSizeCurrent'),
get(‘heapSizeMax’),
get('HeapFreePercent')
disconnect ()
exit()

Get JVM Key Metrics using 12.2.1 RESTful
JVM Key MetricsMonitoring
09/10/2016WLS RESTful monitoringPage 25
https://host01:7002/management/weblogic/latest/domainRuntime/serverRun
times/server1/JVMRuntime?links=none&fields=heapSizeCurrent,heapFreeCur
rent,heapFreePercent,heapSizeMax
{
"heapSizeCurrent": 259588096,
"heapFreeCurrent": 101962840,
"heapSizeMax": 518979584,
"heapFreePercent": 72
}

ExecuteThreadTotalCount
> This count does not include standby threads and stuck threads.
> The count indicates threads that are ready to pick up new work when it arrives
HoggingThreadCount
> Hogging threads are candidates for stuck threads.
> Might become stuck after StuckThreadMaxTimeoutseconds(default 600secs)
PendingUserRequestCount
> The number of pending user requests in the priority queue. The priority queue contains requests from internal subsystems and users.
Threads Key MetricsMonitoring
09/10/2016WLS RESTful monitoringPage 26

CompletedRequestCount
> The number of completed requests in the priority queue
Throughput
> The mean number of requests completed per second
HealthState
> The health state of this Threads pool
Threads Key MetricsMonitoring
09/10/2016WLS RESTful monitoringPage 27

Get Threads Key Metrics using WLST
Threads Key MetricsMonitoring
09/10/2016WLS RESTful monitoringPage 28
userConfig='/app/nagios/etc/objects/scripts/TST_configfile.secure‘
userKey='/app/nagios/etc/objects/scripts/TST_keyfile.secure‘
address=‘host01.example.com‘
port=‘7002‘
servername=‘server1‘
connect (userConfigFile=userConfig, userKeyFile=userKey, url='t3s://'
+ address + ':' + port)
domainRuntime ()
cd('/ServerRuntimes/'+ servername +
'/ThreadPoolRuntime/ThreadPoolRuntime')
print ' ‘
print 'wl_threadpool_OUT',
get('ExecuteThreadTotalCount'),get('HoggingThreadCount'),
get('PendingUserRequestCount'),get('CompletedRequestCount'),
get('Throughput'),get('HealthState')
disconnect ()
exit()
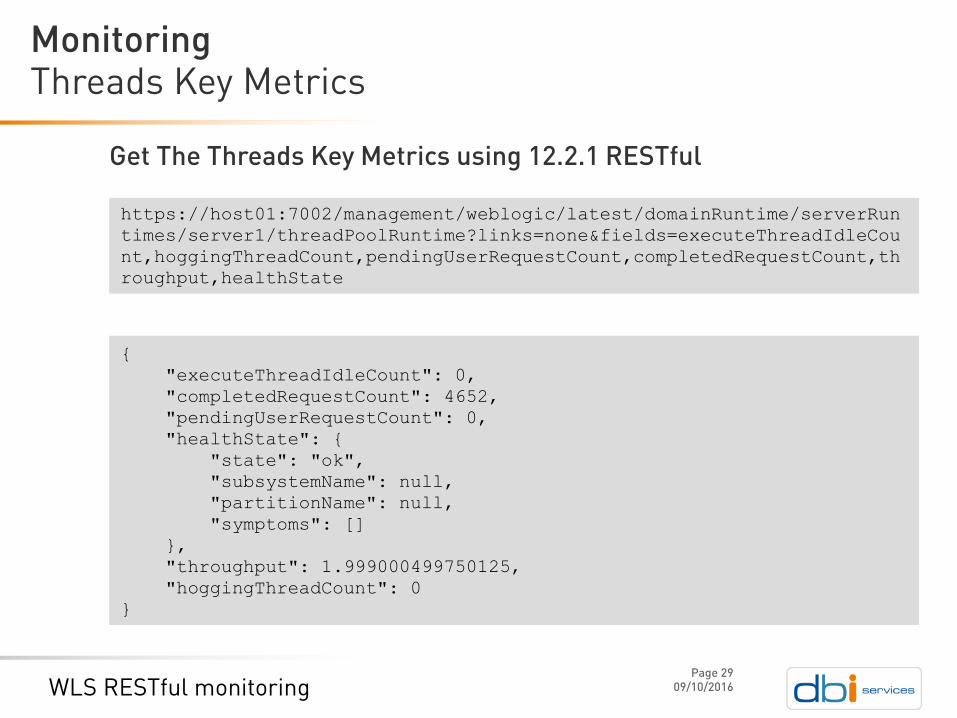
Get The Threads Key Metrics using 12.2.1 RESTful
Threads Key MetricsMonitoring
09/10/2016WLS RESTful monitoringPage 29
https://host01:7002/management/weblogic/latest/domainRuntime/serverRun
times/server1/threadPoolRuntime?links=none&fields=executeThreadIdleCou
nt,hoggingThreadCount,pendingUserRequestCount,completedRequestCount,th
roughput,healthState
{
"executeThreadIdleCount": 0,
"completedRequestCount": 4652,
"pendingUserRequestCount": 0,
"healthState": {
"state": "ok",
"subsystemName": null,
"partitionName": null,
"symptoms": []
},
"throughput": 1.999000499750125,
"hoggingThreadCount": 0
}

activeConnectionsCurrentCount
> The number of connections currently in use by applications
activeConnectionsHighCount
> Highest number of active database connections in this instance of the data source since the data source was instantiated
waitingForConnectionHighCount
> Highest number of application requests concurrently waiting for a connection from this instance of the data source
waitSecondsHighCount
> The longest connection reserve wait time in seconds
waitingForConnectionFailureTotal
> The cumulative, running count of requests for a connection from this data source that failed to get a connection
JDBC Key MetricsMonitoring
09/10/2016WLS RESTful monitoringPage 30

Get JDBC Runtime Metrics using WLST
JDBC Key MetricsMonitoring
09/10/2016WLS RESTful monitoringPage 31
userConfig='/app/nagios/etc/objects/scripts/TST_configfile.secure‘
userKey='/app/nagios/etc/objects/scripts/TST_keyfile.secure‘
address=‘host01.example.com‘
port=‘7002‘
servername=‘server1‘
DSname='myDS‘
connect (userConfigFile=userConfig, userKeyFile=userKey, url='t3s://'
+ address + ':' + port)
domainRuntime ()
cd (’/ServerRuntimes/’ + servername + ’/JDBCServiceRuntime/' +
servername + ’/JDBCDataSourceRuntimeMBeans/’ + DSname)
print ' ‘
print 'wl_DS_OUT‘,get(‘Name'),
get(‘ActiveConnectionsCurrentCount'),
get(‘ActiveConnectionsHighCount'),
get(‘WaitingForConnectionHighCount'),
get(‘WaitSecondsHighCount'),
get(‘WaitingForConnectionFailure')
disconnect ()
exit()

Get JDBC Runtime Metrics using 12.2.1 RESTful
JDBC Key MetricsMonitoring
09/10/2016WLS RESTful monitoringPage 32
https://host01:7002/management/weblogic/12.2.1.0/domainRuntime/serverR
untimes/server1/JDBCServiceRuntime/JDBCDataSourceRuntimeMBeans/myDS?li
nks=none&fields=name,activeConnectionsCurrentCount,activeConnectionsHi
ghCount,waitingForConnectionHighCount,waitSecondsHighCount,waitingForC
onnectionFailure
{
"name": “myDS",
"state": "Running",
"waitingForConnectionFailureTotal": 0,
"activeConnectionsHighCount": 3,
"waitingForConnectionHighCount": 0,
"waitSecondsHighCount": 0,
"activeConnectionsCurrentCount": 0
}

OpenSessionsCurrentCount
> The current number of opened sessions
SessionsOpenedTotalCount
> The number of sessions handled since the Application start
OpenSessionsHighCount
> Provides the high water mark of the total number of open sessions for this Application
Application Key MetricsMonitoring
09/10/2016WLS RESTful monitoringPage 33
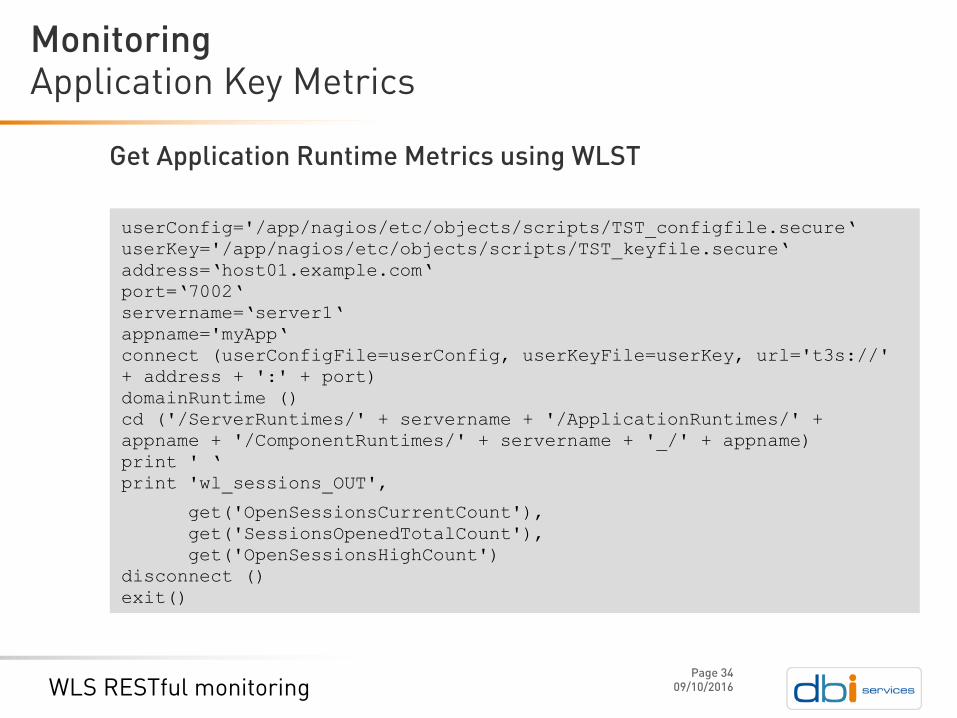
Get Application Runtime Metrics using WLST
Application Key MetricsMonitoring
09/10/2016WLS RESTful monitoringPage 34
userConfig='/app/nagios/etc/objects/scripts/TST_configfile.secure‘
userKey='/app/nagios/etc/objects/scripts/TST_keyfile.secure‘
address=‘host01.example.com‘
port=‘7002‘
servername=‘server1‘
appname='myApp‘
connect (userConfigFile=userConfig, userKeyFile=userKey, url='t3s://'
+ address + ':' + port)
domainRuntime ()
cd ('/ServerRuntimes/' + servername + '/ApplicationRuntimes/' +
appname + '/ComponentRuntimes/' + servername + '_/' + appname)
print ' ‘
print 'wl_sessions_OUT',
get('OpenSessionsCurrentCount'),
get('SessionsOpenedTotalCount'),
get('OpenSessionsHighCount')
disconnect ()
exit()

Get Application Runtime Metrics using 12.2.1 RESTful
Application Key MetricsMonitoring
09/10/2016WLS RESTful monitoringPage 35
https://host01:7002/management/weblogic/latest/domainRuntime/serverRun
times/server1/applicationRuntimes/SimpleAuctionWebAppDb/componentRunti
mes?fields=openSessionsCurrentCount,sessionsOpenedTotalCount,openSessi
onsHighCount&links=none
{
"openSessionsCurrentCount": 12,
"sessionsOpenedTotalCount": 255,
"openSessionsHighCount": 15
}

Username & Password provided in the RESTful HTTP Request
> Anyone able to intercept your HTTP traffic will be able to recover the password by simply using an online BASE64 converter
> Curl command line visible in history
> username and password provided in the curl command line
Security ConcernsMonitoring
09/10/2016WLS RESTful monitoringPage 36
Solutions: - Don’t provide the password, curl will request it without echoing it- Use a encrypted password file
Solutions: - Use HTTPS for RESTful requests- Configure the Administration Port- Run the scripts locally on the Server- Use a specific user created for monitoring (no editing privileges)

> Subtitle 1 – not mandatory
> Subtitle 2 – not mandatory
> Subtitle 3 – not mandatory
09/10/2016
Monitoring
> General health key metric
> JVM key metrics
> Threads key metrics
> JDBC key metrics
> Applications key metrics
> Security Concerns
> Monitoring tools
WLS RESTful monitoring

Nagios
> Our customers are not running WebLogic 12.2.1.x as their applications are not certified or supported
>Prototype state: Developed little java code
> username and password provided in encrypted files
> Bunch of scripts run locally on the machine where the WebLogic Admin Server runs
> Use https connection
> See sample call below
Tools
09/10/2016
Monitoring
[wls@host01 REST]$ java monitoring.rest.WebLogicRest \
https://host01:7002/management/weblogic/latest/domainRuntime/serverRun
times/server1/JVMRuntime?links=none\&fields=heapSizeCurrent,heapFreeCu
rrent,heapFreePercent
Page 38
WLS RESTful monitoring
./server/default/deploy/jboss-web.deployer/server.xml
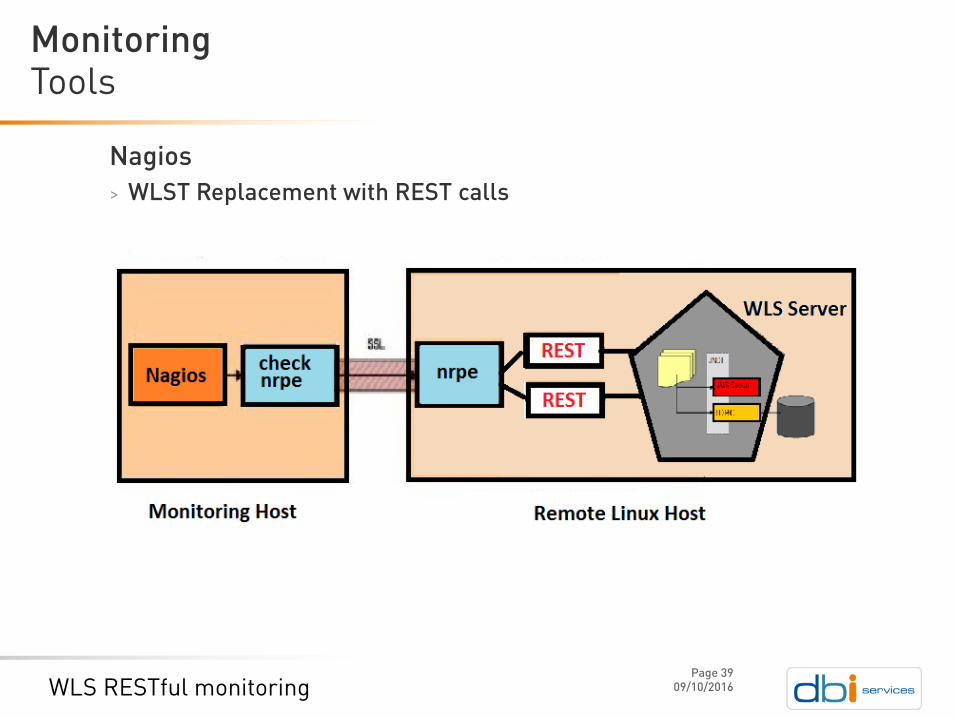
Nagios
> WLST Replacement with REST calls
Tools
09/10/2016
Monitoring
Page 39
WLS RESTful monitoring

dbi monitoring tool
> Our customers are not running WebLogic 12.2.1.x as their applications are not certified or supported
> Based on Metric definitions created using a GUI interface
> Services type
> Target
> Thresholds
> Hostnames
ToolsMonitoring
09/10/2016WLS RESTful monitoringPage 40
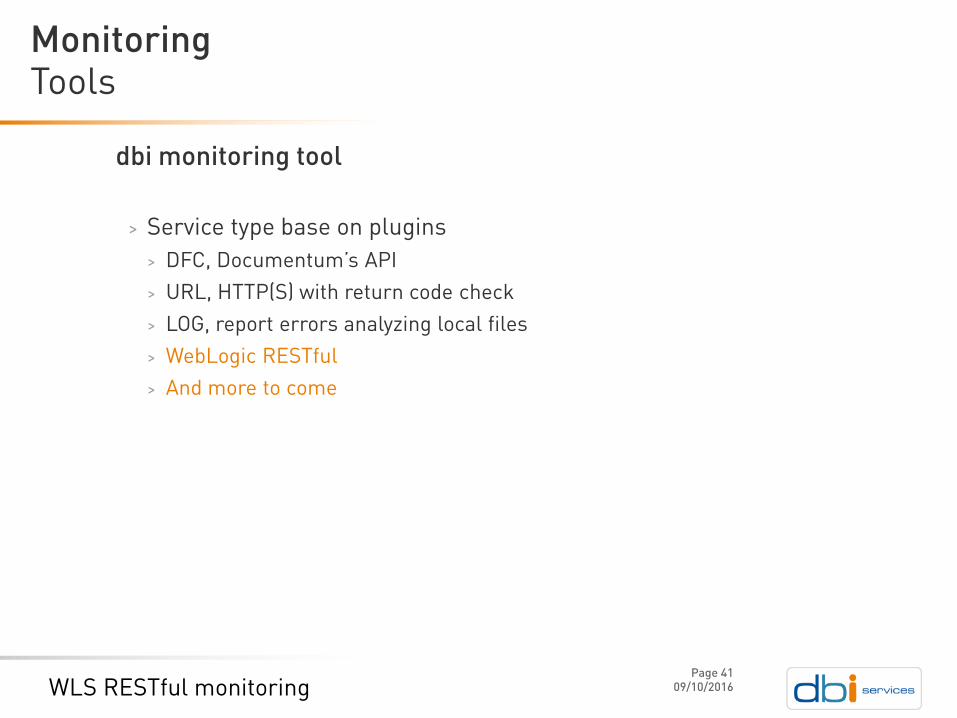
dbi monitoring tool
> Service type base on plugins
> DFC, Documentum’s API
> URL, HTTP(S) with return code check
> LOG, report errors analyzing local files
> WebLogic RESTful
> And more to come
ToolsMonitoring
09/10/2016WLS RESTful monitoringPage 41

dbi monitoring tool
> Target
ToolsMonitoring
09/10/2016WLS RESTful monitoringPage 42

dbi monitoring tool
> Threshold
ToolsMonitoring
09/10/2016WLS RESTful monitoringPage 43
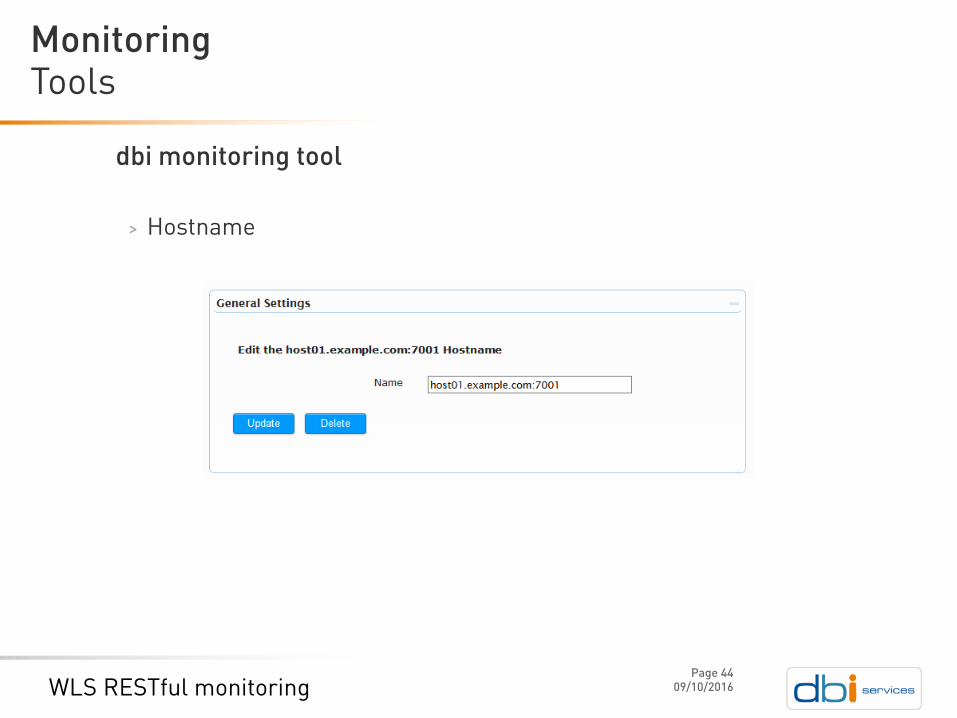
dbi monitoring tool
> Hostname
ToolsMonitoring
09/10/2016WLS RESTful monitoringPage 44

dbi monitoring tool
> Metrics
ToolsMonitoring
09/10/2016WLS RESTful monitoringPage 45

> Subtitle 1 – not mandatory
> Subtitle 2 – not mandatory
> Subtitle 3 – not mandatory
09/10/2016
Demonstration
> Demonstration
WLS RESTful monitoring

> Subtitle 1 – not mandatory
> Subtitle 2 – not mandatory
> Subtitle 3 – not mandatory
09/10/2016
Conclusion
> Conclusion
WLS RESTful monitoring

> Lightweight and fast
> No additional software installation
> Easy to integrate with third party software
> No need to start a JVM to run WLST script or run JMX on the client side
Pro & contra
09/10/2016
Conclusion
> Security Concerns
> Base64 username password encoding in HTTP Request
> Not fully available before WebLogic 12.2.1.x version
Page 48
WLS RESTful monitoring

WebLogic RESTful management is simple and fast
> Easy to interface with monitoring tools
No need for additional development (UNIX curl)
> But if desired can be used from any programming language (Python, Java, etc.. )
SummaryConclusion
09/10/2016WLS RESTful monitoringPage 49

Infrastructure at your Service.
09/10/2016
We look forward to working with you!
Page 50
WLS RESTful monitoring
Pascal BrandConsultant
+41 79 796 43 59
Any questions? Please do ask
![Oracle Fusion Middleware Developing and Securing RESTful ... · [1]Oracle® Fusion Middleware Developing and Securing RESTful Web Services for Oracle WebLogic Server 12c (12.2.1)](https://img.pdfslide.net/doc/110x75/5f72200028864d0236096945/oracle-fusion-middleware-developing-and-securing-restful-1oracle-fusion.jpg)
![[1]Oracle® Fusion Middleware RESTful …[1]Oracle® Fusion Middleware RESTful Management Interface Reference for Oracle WebLogic Server (Legacy) 12c (12.2.1.3.0) E80381-01 August](https://img.pdfslide.net/doc/110x75/5f32d7ee506c34272b6340ec/1oracle-fusion-middleware-restful-1oracle-fusion-middleware-restful-management.jpg)


![[1]Oracle® Fusion Middleware RESTful Domain …RESTful Domain Runtime Reference for Oracle WebLogic Server 12c (12.2.1) E64956-02 November 2015 This reference describes the RESTful](https://img.pdfslide.net/doc/110x75/5f32d841eee2383e766a57c8/1oracle-fusion-middleware-restful-domain-restful-domain-runtime-reference-for.jpg)


![[1]Oracle® Fusion Middleware RESTful Domain …[1]Oracle® Fusion Middleware RESTful Domain Runtime Reference for Oracle WebLogic Server 12c (12.2.1.2.0) E78014-01 September 2016](https://img.pdfslide.net/doc/110x75/5f1ec92ce643d55459458567/1oracle-fusion-middleware-restful-domain-1oracle-fusion-middleware-restful.jpg)