Embed Size (px)
Citation preview

WEBSTER REPORTSSECOND QUARTER 2021 EARNINGS OF $1.01 PER DILUTED SHARE
WATERBURY, Conn., July 22, 2021 - Webster Financial Corporation (NYSE: WBS), the holding company for Webster Bank, N.A. and its HSA Bank division, today announced earnings applicable to common shareholders of $91.6 million, or $1.01 per diluted share, for the quarter ended June 30, 2021, compared to $50.7 million, or $0.57 per diluted share, for the quarter ended June 30, 2020. Earnings per diluted share would have been $1.21 for the quarter ended June 30, 2021, adjusting for $18.2 million ($17.6 million after tax) of charges related to merger and strategic optimization initiatives.
“We generated strong business performance in the quarter, led by loan growth of 3.2% excluding PPP and an increase in loan originations of $0.5 billion or 26%,” said John R. Ciulla, chairman and chief executive officer. “We are making significant progress planning for the integration of two great banking organizations, Webster and Sterling, by working together to deliver for customers, communities, bankers and shareholders.”
Highlights for the second quarter of 2021:
• Revenue of $293.6 million.• Loan growth of 3.2 percent linked quarter, excluding Paycheck Protection Program (PPP)
loans, led by commercial and commercial real estate which increased 3.8 percent.• Originated $2.4 billion in loans, up 26.4 percent linked quarter. Excluding PPP loans,
originations totaled $2.3 billion, up 71.5 percent linked quarter.• Current Expected Credit Loss (CECL) benefit of $21.5 million with a reserve decrease of
$20.4 million compared to the prior quarter, resulting in an allowance coverage of 1.43 percent, or 1.49 percent excluding $0.8 billion of PPP loans.
• Deposit growth of $2.5 billion, or 9.5 percent from a year ago, with growth of $557.6 million in demand deposits and $536.6 million in HSA deposits.
• Charges related to merger and strategic optimization initiatives totaled $18.2 million.• Net interest margin of 2.82 percent.• Efficiency ratio (non-GAAP) of 56.6 percent.
“In the quarter, credit trends continue to be favorable, resulting in a reserve decrease of $20.4 million,” said Glenn MacInnes, executive vice president and chief financial officer. “During the quarter, we continued to make progress on our strategic initiatives and remain on track to deliver an 8% to 10% reduction in run rate core non-interest expense by the end of the fourth quarter 2021.”

Line of Business performance compared to the second quarter of 2020Commercial Banking
Webster’s Commercial Banking segment serves businesses that have more than $2 million of revenue through our business banking, middle market, asset-based lending, equipment finance, commercial real estate, sponsor finance, and treasury services business units. Additionally, our Wealth group provides wealth management solutions to business owners, operators, and consumers within our targeted markets and retail footprint. As of June 30, 2021, Commercial Banking had $14.7 billion in loans and leases and $8.8 billion in deposit balances.
Commercial Banking Operating Results:Percent
Three months ended June 30, Favorable/(In thousands) 2021 2020 (Unfavorable)Net interest income $141,124 $128,123 10.1 %Non-interest income 25,713 21,849 17.7 Operating revenue 166,837 149,972 11.2 Non-interest expense 61,445 61,261 (0.3) Pre-tax, pre-provision net revenue $105,392 $88,711 18.8
PercentAt June 30, Increase/
(In millions) 2021 2020 (Decrease)Loans and leases $14,654 $14,394 1.8 %Deposits 8,844 7,747 14.2 AUA / AUM (off balance sheet) 7,061 5,739 23.0
Pre-tax, pre-provision net revenue increased $16.7 million to $105.4 million in the quarter as compared to prior year. Net interest income increased $13.0 million to $141.1 million, primarily driven by PPP loan fee acceleration associated with PPP loan forgiveness, loan rates, and deposit growth. Non-interest income increased $3.9 million to $25.7 million driven by higher trust and investment service fees. Non-interest expense increased $0.2 million to $61.4 million.
2

HSA Bank
Webster’s HSA Bank division offers a comprehensive consumer-directed healthcare solution that includes health savings accounts, health reimbursement arrangements, flexible spending accounts and commuter benefits. Health savings accounts are distributed nationwide directly to employers and individual consumers, as well as through national and regional insurance carriers, benefit consultants and financial advisors. As of June 30, 2021, HSA Bank had $10.7 billion in total footings comprising $7.3 billion in deposit balances and $3.4 billion in assets under administration through linked investment accounts.
HSA Bank Operating Results:Percent
Three months ended June 30, Favorable/(In thousands) 2021 2020 (Unfavorable)Net interest income $42,193 $39,334 7.3 %Non-interest income 26,554 23,103 14.9 Operating revenue 68,747 62,437 10.1 Non-interest expense 32,792 34,020 3.6 Pre-tax, net revenue $35,955 $28,417 26.5
PercentAt June 30, Increase/
(Dollars in millions) 2021 2020 (Decrease)Number of accounts (thousands) 2,995 2,996 — %
Deposits $7,323 $6,787 7.9 Linked investment accounts (off balance sheet) 3,384 2,249 50.4 Total footings $10,707 $9,036 18.5
Pre-tax net revenue increased $7.5 million to $36.0 million in the quarter as compared to prior year. Net interest income increased $2.9 million to $42.2 million, due to a 7.9 percent growth in deposits, partially offset by a decline in deposit spreads. Non-interest income increased $3.5 million to $26.6 million, due primarily to increases in interchange, investment, and notional account fees. Non-interest expense decreased $1.2 million to $32.8 million, primarily due to reduced compensation expenses.
3

Retail Banking
Retail Banking serves consumer and business banking customers primarily throughout southern New England and into Westchester County, New York. Retail Banking is comprised of the Consumer Lending and Small Business Banking business units, as well as a distribution network consisting of 130 banking centers and 253 ATMs, a customer care center, and a full range of web and mobile-based banking services. As of June 30, 2021, Retail Banking had $6.8 billion in loans and $12.7 billion in deposit balances.
Retail Banking Operating Results:Percent
Three months ended June 30, Favorable/(In thousands) 2021 2020 (Unfavorable)Net interest income $92,540 $81,609 13.4 %Non-interest income 16,763 16,281 3.0 Operating revenue 109,303 97,890 11.7 Non-interest expense 72,346 77,119 6.2 Pre-tax, pre-provision net revenue $36,957 $20,771 77.9
PercentAt June 30, Increase/
(In millions) 2021 2020 (Decrease)Loans $6,821 $7,409 (7.9) %Deposits 12,680 11,826 7.2
Pre-tax, pre-provision net revenue increased $16.2 million to $37.0 million in the quarter as compared to prior year. Net interest income increased $10.9 million to $92.5 million, driven by PPP loan fee acceleration associated with PPP loan forgiveness and deposit growth, partially offset by lower consumer loan balances. Non-interest income increased $0.5 million to $16.8 million driven by higher deposit-related service fees and loan servicing fee income, partially offset by lower fee income from mortgage banking activities. Non-interest expense decreased $4.8 million to $72.3 million driven by lower employee-related, occupancy, and marketing expenses.
4

Consolidated financial performance:
Quarterly net interest income compared to the second quarter of 2020:
• Net interest income was $220.9 million compared to $224.4 million.
• Net interest margin was 2.82 percent compared to 2.99 percent. The yield on interest-earning assets declined by 40 basis points, and the cost of interest-bearing liabilities declined by 25 basis points.
• Average interest-earning assets totaled $31.6 billion and grew by $1.2 billion, or 3.9 percent.
• Average loans totaled $21.4 billion and declined by $0.2 billion, or 0.9 percent.
• Average deposits totaled $28.7 billion and grew by $2.8 billion, or 10.7 percent.
Quarterly provision for credit losses:
• The provision for credit losses reflects a $21.5 million benefit in the quarter, contributing to a $20.4 million decrease in the allowance for credit losses on loans and leases. The decrease in the allowance reflects improvements to the forecasted economic outlook and favorable credit trends resulting in a release of reserves. The provision for credit losses reflected a $25.8 million benefit in the prior quarter compared to an expense of $40.0 million a year ago.
• Net recoveries were $1.2 million, compared to net charge-offs of $5.3 million in the prior quarter and $16.4 million a year ago. The ratio of net charge-offs (recoveries) to average loans on an annualized basis was (0.02) percent, compared to 0.10 percent in the prior quarter and 0.30 percent a year ago.
• The allowance for credit losses on loans and leases represented 1.43 percent of total loans at June 30, 2021, compared to 1.54 percent at March 31, 2021 and 1.64 percent at June 30, 2020. Excluding $0.8 billion of risk free PPP loans, the coverage ratio was 1.49 percent at June 30, 2021, compared to 1.64 percent at March 31, 2021 excluding $1.3 billion of risk free PPP loans, and 1.75 percent at June 30, 2020 excluding $1.3 billion of risk free PPP loans. The allowance represented 255 percent of nonperforming loans at June 30, 2021 compared to 218 percent at March 31, 2021 and 207 percent at June 30, 2020.
Quarterly non-interest income compared to the second quarter of 2020:
• Total non-interest income was $72.7 million compared to $60.1 million, an increase of $12.6 million. This primarily reflects an increase of $5.3 million due to fair value adjustments; $3.4 million in HSA fee income driven primarily by higher interchange and account service fees; $3.0 million in wealth and investment services primarily due to increase investment activity; and $2.9 million in deposit service fees driven by higher overdraft, interchange, and cash management fees. These increases were partially offset by a $2.9 million decrease in mortgage banking activities due to lower volume and spreads on loans originated for sale.
5

Quarterly non-interest expense compared to the second quarter of 2020:
• Total non-interest expense was $187.0 million compared to $176.6 million, an increase of $10.4 million. This primarily reflects $18.2 million of charges related to merger and strategic optimization initiatives, partially offset by a $2.0 million decrease in compensation and benefits primarily due to the effects of the strategic initiatives and a $1.3 million decrease in deposit insurance.
Quarterly income taxes compared to the second quarter of 2020:
• Income tax expense was $34.0 million compared to $14.8 million and the effective tax rate was 26.6 percent compared to 21.8 percent.
• The higher effective tax rate in the quarter reflects the effects of merger related expenses recognized during the period estimated to be nondeductible for tax purposes and increased pre-tax income in 2021 compared to 2020, partially offset by the recognition of discrete tax benefits during the quarter.
Investment securities:
• Total investment securities were $8.9 billion, compared to $8.9 billion at March 31, 2021 and $8.7 billion at June 30, 2020. The carrying value of the available-for-sale portfolio included $49.3 million of net unrealized gains, compared to $51.3 million at March 31, 2021 and $87.2 million at June 30, 2020. The carrying value of the held-to-maturity portfolio does not reflect $170.5 million of net unrealized gains, compared to $162.6 million at March 31, 2021 and $268.4 million at June 30, 2020.
Loans:
• Total loans were $21.5 billion, compared to $21.3 billion at March 31, 2021 and $21.8 billion at June 30, 2020. Compared to March 31, 2021, commercial real estate loans increased by $72.6 million while commercial loans decreased by $19.8 million, residential mortgages increased by $187.4 million, and consumer loans decreased by $66.6 million.
• Compared to a year ago, commercial real estate loans increased by $203.4 million and commercial loans (excluding PPP loans) increased by $341.9 million, while consumer loans decreased by $336.6 million and residential mortgages decreased by $65.3 million. PPP loans totaled $0.8 billion at June 30, 2021.
• Loan originations for the portfolio were $2.333 billion ($2.269 billion excluding PPP loan originations), compared to $1.807 billion ($1.274 billion excluding PPP loan originations) in the prior quarter and $2.817 billion ($1.413 billion excluding PPP loan originations) a year ago. In addition, $55 million of residential loans were originated for sale in the quarter, compared to $81 million in the prior quarter and $115 million a year ago.
6

Asset quality:
• Total nonperforming loans were $120.7 million, or 0.56 percent of total loans, compared to $150.4 million, or 0.71 percent of total loans, at March 31, 2021 and $173.1 million, or 0.79 percent of total loans, at June 30, 2020. As of June 30, 2021, $52.8 million of nonperforming loans were contractually current.
• Past due loans were $18.4 million, compared to $20.4 million at March 31, 2021 and $39.8 million at June 30, 2020.
Deposits and borrowings:
• Total deposits were $28.8 billion, compared to $28.5 billion at March 31, 2021 and $26.4 billion at June 30, 2020. Core deposits to total deposits were 93.0 percent, compared to 92.2 percent at March 31, 2021 and 89.9 percent at June 30, 2020. The loan to deposit ratio was 74.4 percent, compared to 74.8 percent at March 31, 2021 and 82.7 percent at June 30, 2020.
• Total borrowings were $1.2 billion, compared to $1.2 billion at March 31, 2021 and $2.8 billion at June 30, 2020.
Capital:
• The return on average common shareholders’ equity and the return on average tangible common shareholders’ equity were 11.63 percent and 14.26 percent, respectively, compared to 6.79 percent and 8.47 percent, respectively, in the second quarter of 2020.
• The tangible equity and tangible common equity ratios were 8.35 percent and 7.91 percent, respectively, compared to 8.14 percent and 7.69 percent, respectively, at June 30, 2020. The common equity tier 1 risk-based capital ratio was 11.65 percent, compared to 11.17 percent at June 30, 2020.
• Book value and tangible book value per common share were $35.15 and $28.99, respectively, compared to $33.59 and $27.40, respectively, at June 30, 2020.
7

***
Webster Financial Corporation is the holding company for Webster Bank, National Association and its HSA Bank division. With $33.8 billion in assets, Webster provides business and consumer banking, mortgage, financial planning, trust, and investment services through 130 banking centers and 253 ATMs. Webster also provides mobile and Internet banking. Webster Bank owns the asset-based lending firm Webster Business Credit Corporation; the equipment finance firm Webster Capital Finance Corporation; and HSA Bank, a division of Webster Bank, which provides health savings account trustee and administrative services. Webster Bank is a member of the FDIC and an equal housing lender. For more information about Webster, including past press releases and the latest annual report, visit the Webster website at www.websterbank.com.
Conference Call
A conference call covering Webster’s second quarter 2021 earnings announcement will be held today, Thursday, July 22, 2021 at 9:00 a.m. Eastern Time. To listen to the live call, please dial 877-407-8289, or 201-689-8341 for international callers. The webcast, along with related slides, will be available on the Webster website (www.wbst.com). A replay of the conference call will be available for one week via the website listed above, beginning at approximately 11:00 a.m. (Eastern) on July 22, 2021. To access the replay, dial 877-660-6853, or 201-612-7415 for international callers. The replay conference ID number is 13720459.
Media ContactAlice Ferreira, [email protected]
Investor ContactKristen Manginelli, [email protected]
8

Forward-Looking Statements
This release contains “forward-looking statements” within the meaning of the Private Securities Litigation Reform Act of 1995 (the “Act”). Forward-looking statements can be identified by words such as “believes,” “anticipates,” “expects,” “intends,” “targeted,” “continue,” “remain,” “will,” “should,” “may,” “plans,” “estimates,” and similar references to future periods; however, such words are not the exclusive means of identifying such statements. Examples of forward-looking statements include, but are not limited to: (i) projections of revenues, expenses, income or loss, earnings or loss per share, and other financial items; (ii) statements of plans, objectives, and expectations of Webster or its management or Board of Directors; (iii) statements of future economic performance; and (iv) statements of assumptions underlying such statements. Forward-looking statements are based on Webster’s current expectations and assumptions regarding its business, the economy, and other future conditions. Because forward-looking statements relate to the future, they are subject to inherent uncertainties, risks, and changes in circumstances that are difficult to predict. Webster’s actual results may differ materially from those contemplated by the forward-looking statements, which are neither statements of historical fact nor guarantees or assurances of future performance. Factors that could cause actual results to differ from those discussed in the forward-looking statements include, but are not limited to: (1) our ability to complete the acquisition of Sterling Bancorp and realize the anticipated benefits of the merger; (2) our ability to successfully execute our business plan and strategic initiatives, and manage any risks or uncertainties; (3) our ability to successfully achieve the anticipated cost reductions and operating efficiencies from our completed branch consolidations and other strategic initiatives, including process automation, organization simplification, and spending reductions, and avoid any higher than anticipated costs or delays in the ongoing implementation; (4) local, regional, national, and international economic conditions and the impact they may have on us and our customers; (5) volatility and disruption in national and international financial markets; (6) the potential adverse effects of the ongoing novel coronavirus (COVID-19) pandemic and any governmental or societal responses thereto, or other unusual and infrequently occurring events; (7) changes in the level of nonperforming assets and charge-offs; (8) changes in estimates of future reserve requirements based upon the periodic review thereof under relevant regulatory and accounting requirements; (9) adverse conditions in the securities markets that lead to impairment in the value of our investment securities; (10) inflation, changes in interest rates (including the replacement of LIBOR as an interest rate benchmark), and monetary fluctuations; (11) the timely development and acceptance of new products and services and the perceived value of those products and services by customers; (12) changes in deposit flows, consumer spending, borrowings, and savings habits; (13) our ability to implement new technologies and maintain secure and reliable technology systems; (14) the effects of any cyber threats, attacks or events or fraudulent activity; (15) performance by our counterparties and vendors; (16) our ability to increase market share and control expenses; (17) changes in the competitive environment among banks, financial holding companies, and other financial services providers; (18) changes in laws and regulations (including those concerning banking, taxes, dividends, securities, insurance, and healthcare) with which we and our subsidiaries must comply; (19) the effect of changes in accounting policies and practices applicable to us, including impacts of recently adopted accounting guidance; (20) legal and regulatory developments including the resolution of legal proceedings or regulatory or other governmental inquiries and the results of regulatory examinations or reviews; (21) our ability to appropriately address social, environmental, and sustainability concerns that may arise from our business activities; and (22) the other factors that are described in the Company’s Annual Report on Form 10-K and Quarterly Reports on Form 10-Q under the headings “Risk Factors” and “Management Discussion and Analysis of Financial Condition and Results of Operation.” Any forward-looking statement made by the Company in this release speaks only as of the date on which it is made. Factors or events that could cause the Company’s actual results to differ may emerge from time to time, and it is not possible for the Company to predict all of them. The Company undertakes no obligation to publicly update any forward-looking statement, whether as a result of new information, future developments or otherwise, except as may be required by law.
9

Non-GAAP Financial Measures
In addition to results presented in accordance with GAAP, this press release contains certain non-GAAP financial measures. A reconciliation of net income and other performance ratios, as adjusted, is included in the accompanying selected financial highlights table.
We believe that providing certain non-GAAP financial measures provides investors with information useful in understanding our financial performance, our performance trends and financial position. We utilize these measures for internal planning and forecasting purposes. We, as well as securities analysts, investors, and other interested parties, also use these measures to compare peer company operating performance. We believe that our presentation and discussion, together with the accompanying reconciliations, provides a complete understanding of factors and trends affecting our business and allows investors to view performance in a manner similar to management. These non-GAAP measures should not be considered a substitute for GAAP basis measures and results, and we strongly encourage investors to review our consolidated financial statements in their entirety and not to rely on any single financial measure. Because non-GAAP financial measures are not standardized, it may not be possible to compare these financial measures with other companies’ non-GAAP financial measures having the same or similar names.
10
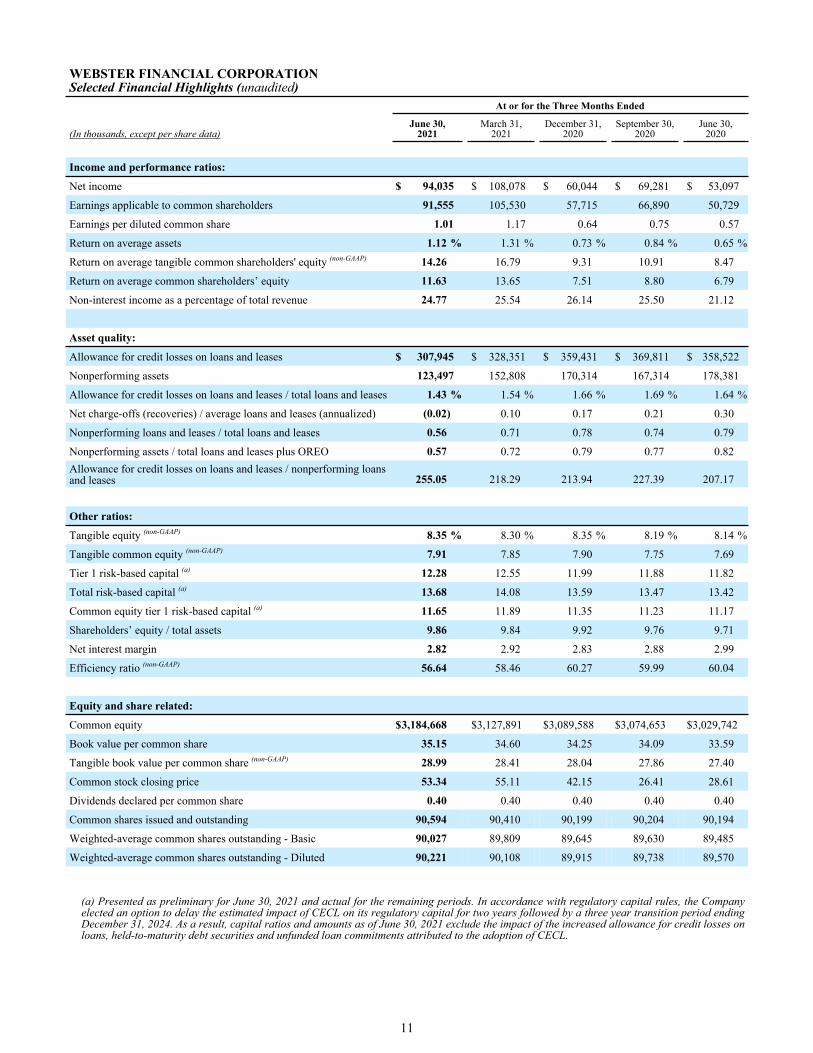
WEBSTER FINANCIAL CORPORATIONSelected Financial Highlights (unaudited) At or for the Three Months Ended
(In thousands, except per share data)June 30,
2021March 31,
2021December 31,
2020September 30,
2020June 30,
2020
Income and performance ratios:
Net income $ 94,035 $ 108,078 $ 60,044 $ 69,281 $ 53,097
Earnings applicable to common shareholders 91,555 105,530 57,715 66,890 50,729
Earnings per diluted common share 1.01 1.17 0.64 0.75 0.57
Return on average assets 1.12 % 1.31 % 0.73 % 0.84 % 0.65 %
Return on average tangible common shareholders' equity (non-GAAP) 14.26 16.79 9.31 10.91 8.47
Return on average common shareholders’ equity 11.63 13.65 7.51 8.80 6.79
Non-interest income as a percentage of total revenue 24.77 25.54 26.14 25.50 21.12
Asset quality:
Allowance for credit losses on loans and leases $ 307,945 $ 328,351 $ 359,431 $ 369,811 $ 358,522
Nonperforming assets 123,497 152,808 170,314 167,314 178,381
Allowance for credit losses on loans and leases / total loans and leases 1.43 % 1.54 % 1.66 % 1.69 % 1.64 %
Net charge-offs (recoveries) / average loans and leases (annualized) (0.02) 0.10 0.17 0.21 0.30
Nonperforming loans and leases / total loans and leases 0.56 0.71 0.78 0.74 0.79
Nonperforming assets / total loans and leases plus OREO 0.57 0.72 0.79 0.77 0.82 Allowance for credit losses on loans and leases / nonperforming loans and leases 255.05 218.29 213.94 227.39 207.17
Other ratios:
Tangible equity (non-GAAP) 8.35 % 8.30 % 8.35 % 8.19 % 8.14 %
Tangible common equity (non-GAAP) 7.91 7.85 7.90 7.75 7.69
Tier 1 risk-based capital (a) 12.28 12.55 11.99 11.88 11.82
Total risk-based capital (a) 13.68 14.08 13.59 13.47 13.42
Common equity tier 1 risk-based capital (a) 11.65 11.89 11.35 11.23 11.17
Shareholders’ equity / total assets 9.86 9.84 9.92 9.76 9.71
Net interest margin 2.82 2.92 2.83 2.88 2.99
Efficiency ratio (non-GAAP) 56.64 58.46 60.27 59.99 60.04
Equity and share related:
Common equity $ 3,184,668 $ 3,127,891 $ 3,089,588 $ 3,074,653 $ 3,029,742
Book value per common share 35.15 34.60 34.25 34.09 33.59
Tangible book value per common share (non-GAAP) 28.99 28.41 28.04 27.86 27.40
Common stock closing price 53.34 55.11 42.15 26.41 28.61
Dividends declared per common share 0.40 0.40 0.40 0.40 0.40
Common shares issued and outstanding 90,594 90,410 90,199 90,204 90,194
Weighted-average common shares outstanding - Basic 90,027 89,809 89,645 89,630 89,485
Weighted-average common shares outstanding - Diluted 90,221 90,108 89,915 89,738 89,570
(a) Presented as preliminary for June 30, 2021 and actual for the remaining periods. In accordance with regulatory capital rules, the Company elected an option to delay the estimated impact of CECL on its regulatory capital for two years followed by a three year transition period ending December 31, 2024. As a result, capital ratios and amounts as of June 30, 2021 exclude the impact of the increased allowance for credit losses on loans, held-to-maturity debt securities and unfunded loan commitments attributed to the adoption of CECL.
11

WEBSTER FINANCIAL CORPORATIONConsolidated Balance Sheets (unaudited)
(In thousands)June 30,
2021March 31,
2021June 30,
2020Assets:Cash and due from banks $ 193,430 $ 160,703 $ 198,680 Interest-bearing deposits 1,386,463 1,210,958 104,444 Securities:
Available for sale 3,262,893 3,313,980 3,183,624 Held to maturity, net 5,623,243 5,567,785 5,476,817 Total securities, net 8,886,136 8,881,765 8,660,441
Loans held for sale 4,335 17,262 46,446 Loans and Leases:
Commercial 8,417,719 8,437,487 8,546,769 Commercial real estate 6,410,672 6,338,056 6,207,314 Residential mortgages 4,856,302 4,668,945 4,921,573 Consumer 1,790,308 1,856,895 2,126,861 Total loans and leases 21,475,001 21,301,383 21,802,517
Allowance for credit losses on loans and leases (307,945) (328,351) (358,522) Loans and leases, net 21,167,056 20,973,032 21,443,995
Federal Home Loan Bank and Federal Reserve Bank stock 76,874 77,674 94,495 Premises and equipment, net 215,716 220,982 258,392 Goodwill and other intangible assets, net 558,485 559,617 558,367 Cash surrender value of life insurance policies 570,380 567,298 557,325 Deferred tax asset, net 78,268 80,235 77,145 Accrued interest receivable and other assets 616,609 509,511 708,887 Total Assets $ 33,753,752 $ 33,259,037 $ 32,708,617
Liabilities and Shareholders' Equity:Deposits:
Demand $ 6,751,373 $ 6,680,114 $ 6,193,757 Health savings accounts 7,323,421 7,455,181 6,786,845 Interest-bearing checking 3,843,725 3,792,309 3,280,125 Money market 3,442,319 3,015,565 2,686,650 Savings 5,471,584 5,304,532 4,742,573 Certificates of deposit 2,014,544 2,234,133 2,666,047 Total deposits 28,846,966 28,481,834 26,355,997
Securities sold under agreements to repurchase and other borrowings 507,124 498,378 1,688,805 Federal Home Loan Bank advances 138,444 138,554 523,321 Long-term debt 565,297 566,480 570,029 Accrued expenses and other liabilities 366,216 300,863 395,686
Total liabilities 30,424,047 29,986,109 29,533,838 Preferred stock 145,037 145,037 145,037 Common shareholders' equity 3,184,668 3,127,891 3,029,742
Total shareholders’ equity 3,329,705 3,272,928 3,174,779 Total Liabilities and Shareholders' Equity $ 33,753,752 $ 33,259,037 $ 32,708,617
12

WEBSTER FINANCIAL CORPORATIONConsolidated Statements of Income (unaudited)
Three Months Ended June 30,
Six Months Ended June 30,
(In thousands, except per share data) 2021 2020 2021 2020Interest income:Interest and fees on loans and leases $ 185,919 $ 196,521 $ 376,455 $ 412,708 Interest and dividends on securities 45,586 55,570 90,533 113,678 Loans held for sale 53 184 144 359
Total interest income 231,558 252,275 467,132 526,745 Interest expense:Deposits 5,094 18,805 11,533 46,648 Borrowings 5,612 9,063 10,983 24,889
Total interest expense 10,706 27,868 22,516 71,537 Net interest income 220,852 224,407 444,616 455,208
Provision for credit losses (21,500) 40,000 (47,250) 116,000 Net interest income after provision for loan and lease losses 242,352 184,407 491,866 339,208
Non-interest income:Deposit service fees 41,439 35,839 81,908 78,409 Loan and lease related fees 7,862 6,968 16,175 13,464 Wealth and investment services 10,087 7,102 19,490 15,841 Mortgage banking activities 1,319 4,205 3,961 7,098 Increase in cash surrender value of life insurance policies 3,603 3,624 7,136 7,204 Gain on investment securities, net — — — 8 Other income 8,392 2,338 20,789 11,430
Total non-interest income 72,702 60,076 149,459 133,454 Non-interest expense:Compensation and benefits 97,754 99,731 205,354 201,618 Occupancy 14,010 14,245 29,660 28,730 Technology and equipment 27,124 27,468 55,640 55,305 Marketing 3,227 3,286 5,731 6,788 Professional and outside services 21,025 6,158 30,801 11,821 Intangible assets amortization 1,132 962 2,271 1,924 Loan workout expenses 327 392 721 885 Deposit insurance 3,749 5,015 7,705 9,740 Other expenses 18,680 19,327 37,127 38,609
Total non-interest expense 187,028 176,584 375,010 355,420 Income before income taxes 128,026 67,899 266,315 117,242 Income tax expense 33,991 14,802 64,202 25,946
Net income 94,035 53,097 202,113 91,296 Preferred stock dividends and other (2,480) (2,368) (5,028) (4,530) Earnings applicable to common shareholders $ 91,555 $ 50,729 $ 197,085 $ 86,766
Weighted-average common shares outstanding - Diluted 90,221 89,570 90,164 90,391
Earnings per common share:Basic $ 1.02 $ 0.57 $ 2.19 $ 0.96 Diluted 1.01 0.57 2.19 0.96
13

WEBSTER FINANCIAL CORPORATIONFive Quarter Consolidated Statements of Income (unaudited) Three Months Ended
(In thousands, except per share data)June 30,
2021March 31,
2021December 31,
2020September 30,
2020June 30,
2020
Interest income:Interest and fees on loans and leases $ 185,919 $ 190,536 $ 189,010 $ 188,001 $ 196,521 Interest and dividends on securities 45,586 44,947 46,874 51,009 55,570 Loans held for sale 53 91 181 229 184
Total interest income 231,558 235,574 236,065 239,239 252,275 Interest expense:Deposits 5,094 6,439 8,651 12,598 18,805 Borrowings 5,612 5,371 10,485 7,385 9,063
Total interest expense 10,706 11,810 19,136 19,983 27,868 Net interest income 220,852 223,764 216,929 219,256 224,407
Provision for credit losses (21,500) (25,750) (1,000) 22,750 40,000 Net interest income after provision for loan and lease losses 242,352 249,514 217,929 196,506 184,407
Non-interest income:Deposit service fees 41,439 40,469 38,345 39,278 35,839 Loan and lease related fees 7,862 8,313 9,095 6,568 6,968 Wealth and investment services 10,087 9,403 8,820 8,255 7,102 Mortgage banking activities 1,319 2,642 4,110 7,087 4,205 Increase in cash surrender value of life insurance policies 3,603 3,533 3,662 3,695 3,624 Other income 8,392 12,397 12,731 10,177 2,338
Total non-interest income 72,702 76,757 76,763 75,060 60,076 Non-interest expense:Compensation and benefits 97,754 107,600 122,754 104,019 99,731 Occupancy 14,010 15,650 28,024 14,275 14,245 Technology and equipment 27,124 28,516 29,122 27,846 27,468 Marketing 3,227 2,504 3,485 3,852 3,286 Professional and outside services 21,025 9,776 11,380 9,223 6,158 Intangible assets amortization 1,132 1,139 1,147 1,089 962 Loan workout expenses 327 394 261 612 392 Deposit insurance 3,749 3,956 4,372 4,204 5,015 Other expenses 18,680 18,447 18,985 18,876 19,327
Total non-interest expense 187,028 187,982 219,530 183,996 176,584 Income before income taxes 128,026 138,289 75,162 87,570 67,899 Income tax expense 33,991 30,211 15,118 18,289 14,802
Net income 94,035 108,078 60,044 69,281 53,097 Preferred stock dividends and other (2,480) (2,548) (2,329) (2,391) (2,368) Earnings applicable to common shareholders $ 91,555 $ 105,530 $ 57,715 $ 66,890 $ 50,729
Weighted-average common shares outstanding - Diluted 90,221 90,108 89,915 89,738 89,570
Earnings per common share:Basic $ 1.02 $ 1.18 $ 0.64 $ 0.75 $ 0.57 Diluted 1.01 1.17 0.64 0.75 0.57
14

WEBSTER FINANCIAL CORPORATIONConsolidated Average Balances, Interest, Yields and Rates, and Net Interest Margin on a Fully Tax-equivalent Basis (unaudited)
Three Months Ended June 30,
2021 2020
(Dollars in thousands)Averagebalance Interest Yield/rate
Averagebalance Interest Yield/rate
Assets:
Interest-earning assets:
Loans and leases $ 21,413,439 $ 186,681 3.46 % $ 21,608,914 $ 197,317 3.63 %
Investment securities (a) 8,834,859 46,582 2.13 8,579,213 56,465 2.69
Federal Home Loan and Federal Reserve Bank stock 77,292 382 1.98 108,962 865 3.19
Interest-bearing deposits (b) 1,270,121 347 0.11 99,467 5 0.02
Loans held for sale 8,898 53 2.37 24,266 184 3.03
Total interest-earning assets 31,604,609 $ 234,045 2.95 % 30,420,822 $ 254,836 3.35 %
Non-interest-earning assets 1,901,412 2,062,534
Total Assets $ 33,506,021 $ 32,483,356
Liabilities and Shareholders' Equity:
Interest-bearing liabilities:
Demand deposits $ 6,774,206 $ — — % $ 5,823,655 $ — — %
Health savings accounts 7,446,735 1,650 0.09 6,846,210 2,604 0.15
Interest-bearing checking, money market and savings 12,365,074 1,603 0.05 10,390,143 6,462 0.25
Certificates of deposit 2,114,889 1,841 0.35 2,869,471 9,739 1.36
Total deposits 28,700,904 5,094 0.07 25,929,479 18,805 0.29
Securities sold under agreements to repurchase and other borrowings 500,638 860 0.68 1,577,881 980 0.25
Federal Home Loan Bank advances 138,483 534 1.52 839,830 3,748 1.77
Long-term debt (a) 565,874 4,218 3.22 570,679 4,335 3.31
Total borrowings 1,204,995 5,612 1.93 2,988,390 9,063 1.23
Total interest-bearing liabilities 29,905,899 $ 10,706 0.14 % 28,917,869 $ 27,868 0.39 %
Non-interest-bearing liabilities 288,716 410,119
Total liabilities 30,194,615 29,327,988
Preferred stock 145,037 145,037
Common shareholders' equity 3,166,369 3,010,331
Total shareholders' equity 3,311,406 3,155,368
Total Liabilities and Shareholders' Equity $ 33,506,021 $ 32,483,356
Tax-equivalent net interest income 223,339 226,968
Less: tax-equivalent adjustments (2,487) (2,561)
Net interest income $ 220,852 $ 224,407
Net interest margin 2.82 % 2.99 %
(a) For purposes of yield/rate computation, unrealized gain (loss) balances on securities available for sale and senior fixed-rate notes hedges are excluded.
(b) Interest-bearing deposits is a component of cash and cash equivalents.
15

WEBSTER FINANCIAL CORPORATIONConsolidated Average Balances, Interest, Yields and Rates, and Net Interest Margin on a Fully Tax-equivalent Basis (unaudited)
Six Months Ended June 30,
2021 2020
(Dollars in thousands)Averagebalance Interest Yield/rate
Averagebalance Interest Yield/rate
Assets:
Interest-earning assets:
Loans and leases $ 21,447,192 $ 377,969 3.51 % $ 20,966,857 $ 414,235 3.93 %
Investment securities (a) 8,862,314 92,859 2.13 8,449,480 114,873 2.77
Federal Home Loan and Federal Reserve Bank stock 77,461 619 1.61 117,663 2,116 3.62
Interest-bearing deposits (b) 976,873 523 0.11 83,887 196 0.46
Loans held for sale 11,610 144 2.48 23,281 359 3.08
Total interest-earning assets 31,375,450 $ 472,114 3.01 % 29,641,168 $ 531,779 3.59 %
Non-interest-earning assets 1,941,640 1,996,765
Total Assets $ 33,317,090 $ 31,637,933
Liabilities and Shareholders' Equity:
Interest-bearing liabilities:
Demand deposits $ 6,606,464 $ — — % $ 5,170,280 $ — — %
Health savings accounts 7,448,943 3,257 0.09 6,803,784 5,900 0.17
Interest-bearing checking, money market and savings 12,181,295 3,323 0.06 10,053,559 18,865 0.38
Certificates of deposit 2,242,250 4,953 0.45 2,968,514 21,883 1.48
Total deposits 28,478,952 11,533 0.08 24,996,137 46,648 0.38
Securities sold under agreements to repurchase and other borrowings 511,622 1,495 0.58 1,437,403 4,710 0.65
Federal Home Loan Bank advances 137,143 1,047 1.52 1,082,865 10,617 1.94
Long-term debt (a) 566,462 8,441 3.22 560,964 9,562 3.66
Total borrowings 1,215,227 10,983 1.87 3,081,232 24,889 1.62
Total interest-bearing liabilities 29,694,179 $ 22,516 0.15 % 28,077,369 $ 71,537 0.51 %
Non-interest-bearing liabilities 339,949 386,118
Total liabilities 30,034,128 28,463,487
Preferred stock 145,037 145,037
Common shareholders' equity 3,137,925 3,029,409
Total shareholders' equity 3,282,962 3,174,446
Total Liabilities and Shareholders' Equity $ 33,317,090 $ 31,637,933
Tax-equivalent net interest income 449,598 460,242
Less: tax-equivalent adjustments (4,982) (5,034)
Net interest income $ 444,616 $ 455,208
Net interest margin 2.87 % 3.11 %
(a) For purposes of yield/rate computation, unrealized gain (loss) balances on securities available for sale and senior fixed-rate notes hedges are excluded.
(b) Interest-bearing deposits is a component of cash and cash equivalents.
16

WEBSTER FINANCIAL CORPORATION Five Quarter Loan and Lease Balances (unaudited)
(Dollars in thousands)June 30,
2021March 31,
2021December 31,
2020September 30,
2020June 30,
2020
Loan and Lease Balances (actual):Commercial non-mortgage $ 7,473,758 $ 7,530,066 $ 7,687,300 $ 7,722,838 $ 7,606,245 Asset-based lending 943,961 907,421 890,598 889,711 940,524 Commercial real estate 6,410,672 6,338,056 6,322,637 6,307,567 6,207,314 Residential mortgages 4,856,302 4,668,945 4,782,016 4,885,821 4,921,573 Consumer 1,790,308 1,856,895 1,958,664 2,046,086 2,126,861
Total Loan and Lease Balances 21,475,001 21,301,383 21,641,215 21,852,023 21,802,517 Allowance for credit losses on loans and leases (307,945) (328,351) (359,431) (369,811) (358,522) Loans and Leases, net $ 21,167,056 $ 20,973,032 $ 21,281,784 $ 21,482,212 $ 21,443,995
Loan and Lease Balances (average):Commercial non-mortgage $ 7,545,398 $ 7,650,367 $ 7,662,828 $ 7,683,879 $ 7,318,814 Asset-based lending 937,580 896,093 874,221 922,653 1,030,928 Commercial real estate 6,365,830 6,303,765 6,363,776 6,260,114 6,136,091 Residential mortgages 4,738,859 4,720,703 4,821,199 4,914,368 4,946,746 Consumer 1,825,772 1,910,392 2,007,226 2,089,726 2,176,335
Total Loan and Lease Balances 21,413,439 21,481,320 21,729,250 21,870,740 21,608,914 Allowance for credit losses on loans and leases (332,522) (364,358) (375,080) (363,552) (340,050) Loans and Leases, net $ 21,080,917 $ 21,116,962 $ 21,354,170 $ 21,507,188 $ 21,268,864
17

WEBSTER FINANCIAL CORPORATIONFive Quarter Nonperforming Assets and Past Due Loans and Leases (unaudited)
(Dollars in thousands)June 30,
2021March 31,
2021December 31,
2020September 30,
2020June 30,
2020
Nonperforming loans and leases:Commercial non-mortgage $ 57,831 $ 60,103 $ 71,499 $ 75,080 $ 75,340 Asset-based lending 2,403 2,430 2,622 3,789 138 Commercial real estate 12,687 13,743 21,222 8,784 15,889 Residential mortgages 21,467 42,708 41,033 41,498 46,500 Consumer 26,353 31,437 31,629 33,485 35,187
Total nonperforming loans and leases $ 120,741 $ 150,421 $ 168,005 $ 162,636 $ 173,054
Other real estate owned and repossessed assets:Commercial non-mortgage $ — $ 102 $ 175 $ 175 $ 272 Residential mortgages 1,934 1,695 1,544 3,899 3,081 Consumer 822 590 590 604 1,974
Total other real estate owned and repossessed assets $ 2,756 $ 2,387 $ 2,309 $ 4,678 $ 5,327 Total nonperforming assets $ 123,497 $ 152,808 $ 170,314 $ 167,314 $ 178,381
Past due 30-89 days:Commercial non-mortgage $ 3,154 $ 7,395 $ 8,918 $ 3,821 $ 13,959 Asset-based lending — — 1,175 — — Commercial real estate 1,679 699 3,003 329 2,363 Residential mortgages 4,690 5,241 10,623 9,291 15,445 Consumer 8,829 7,036 8,720 8,349 7,857
Total past due 30-89 days 18,352 20,371 32,439 21,790 39,624 Past due 90 days or more and accruing 25 50 445 — 198 Total past due loans and leases $ 18,377 $ 20,421 $ 32,884 $ 21,790 $ 39,822
Five Quarter Changes in the Allowance for Credit Losses on Loans and Leases (unaudited)For the Three Months Ended
(Dollars in thousands)June 30,
2021March 31,
2021December 31,
2020September 30,
2020June 30,
2020
Beginning balance $ 328,351 $ 359,431 $ 369,811 $ 358,522 $ 334,931 Provision (21,574) (25,759) (992) 22,753 40,003 Charge-offs:Commercial non-mortgage 431 1,164 7,876 12,085 15,294 Asset-based lending — — — 10 — Commercial real estate 163 5,157 688 1,399 — Residential mortgages 1,105 380 105 546 194 Consumer 1,703 2,594 2,673 1,717 2,586
Total charge-offs 3,402 9,295 11,342 15,757 18,074 Recoveries:Commercial non-mortgage 824 209 232 1,978 271 Asset-based lending 2 1,424 33 — 10 Commercial real estate 10 3 3 47 2 Residential mortgages 782 1,158 190 521 83 Consumer 2,952 1,180 1,496 1,747 1,296
Total recoveries 4,570 3,974 1,954 4,293 1,662 Total net charge-offs (recoveries) (1,168) 5,321 9,388 11,464 16,412
Ending balance $ 307,945 $ 328,351 $ 359,431 $ 369,811 $ 358,522
18

WEBSTER FINANCIAL CORPORATIONReconciliations to GAAP Financial Measures
The Company evaluates its business based on certain ratios that utilize non-GAAP financial measures. The Company believes the use of these non-GAAP financial measures provides additional clarity in assessing the results and financial position of the Company. Other companies may define or calculate supplemental financial data differently.
The efficiency ratio, which measures the costs expended to generate a dollar of revenue, is calculated excluding certain non-operational items. Return on average tangible common shareholders' equity measures the Company’s net income available to common shareholders, adjusted for the tax-effected amortization of intangible assets, as a percentage of average shareholders’ equity less average preferred stock and average goodwill and intangible assets. The tangible equity ratio represents shareholders’ equity less goodwill and intangible assets divided by total assets less goodwill and intangible assets. The tangible common equity ratio represents shareholders’ equity less preferred stock and goodwill and intangible assets divided by total assets less goodwill and intangible assets. Tangible book value per common share represents shareholders’ equity less preferred stock and goodwill and intangible assets divided by common shares outstanding at the end of the period. Core deposits express total deposits less time deposits, including brokered time deposits. Adjusted diluted earnings per share (EPS) is calculated by excluding after tax non-operational items from reported earnings applicable to common shareholders. See the tables below for reconciliations of these non-GAAP financial measures with financial measures defined by GAAP.
At or for the Three Months Ended
(In thousands, except per share data)June 30,
2021March 31,
2021December 31,
2020September 30,
2020June 30,
2020
Efficiency ratio:
Non-interest expense (GAAP) $ 187,028 $ 187,982 $ 219,530 $ 183,996 $ 176,584
Less: Foreclosed property activity (GAAP) (137) 91 (836) (201) (217)
Intangible assets amortization (GAAP) 1,132 1,139 1,147 1,089 962
Strategic initiatives (non-GAAP) 1,138 9,441 38,265 4,786 —
Merger related (non-GAAP) 17,047 — — — —
Non-interest expense (non-GAAP) $ 167,848 $ 177,311 $ 180,954 $ 178,322 $ 175,839
Net interest income (GAAP) $ 220,852 $ 223,764 $ 216,929 $ 219,256 $ 224,407
Add: Tax-equivalent adjustment (non-GAAP) 2,487 2,495 2,577 2,635 2,561
Non-interest income (GAAP) 72,702 76,757 76,763 75,060 60,076
Other (non-GAAP) 309 277 291 297 293
Loss on hedge terminations (GAAP) — — 3,680 — —
Customer derivative fair value adjustment (GAAP) — — — — 5,511
Income (non-GAAP) $ 296,350 $ 303,293 $ 300,240 $ 297,248 $ 292,848
Efficiency ratio (non-GAAP) 56.64 % 58.46 % 60.27 % 59.99 % 60.04 %
Return on average tangible common shareholders' equity:
Net income (GAAP) $ 94,035 $ 108,078 $ 60,044 $ 69,281 $ 53,097
Less: Preferred stock dividends (GAAP) 1,969 1,969 1,969 1,968 1,969
Add: Intangible assets amortization, tax-effected (GAAP) 894 900 906 860 760 Income adjusted for preferred stock dividends and intangible assets amortization (non-GAAP) $ 92,960 $ 107,009 $ 58,981 $ 68,173 $ 51,888 Income adjusted for preferred stock dividends and intangible assets amortization, annualized basis (non-GAAP) $ 371,840 $ 428,036 $ 235,924 $ 272,692 $ 207,552
Average shareholders' equity (non-GAAP) $ 3,311,406 $ 3,254,203 $ 3,239,221 $ 3,205,330 $ 3,155,368
Less: Average preferred stock (non-GAAP) 145,037 145,037 145,037 145,037 145,037
Average goodwill and other intangible assets (non-GAAP) 559,032 560,173 561,303 560,959 558,835
Average tangible common shareholders' equity (non-GAAP) $ 2,607,337 $ 2,548,993 $ 2,532,881 $ 2,499,334 $ 2,451,496 Return on average tangible common shareholders' equity (non-GAAP) 14.26 % 16.79 % 9.31 % 10.91 % 8.47 %
19

WEBSTER FINANCIAL CORPORATIONReconciliations to GAAP Financial Measures (continued)
At or for the Three Months Ended
(In thousands, except per share data)June 30,
2021March 31,
2021December 31,
2020September 30,
2020June 30,
2020
Tangible equity:
Shareholders' equity (GAAP) $ 3,329,705 $ 3,272,928 $ 3,234,625 $ 3,219,690 $ 3,174,779
Less: Goodwill and other intangible assets (GAAP) 558,485 559,617 560,756 561,902 558,367
Tangible shareholders' equity (non-GAAP) $ 2,771,220 $ 2,713,311 $ 2,673,869 $ 2,657,788 $ 2,616,412
Total assets (GAAP) $ 33,753,752 $ 33,259,037 $ 32,590,690 $ 32,994,443 $ 32,708,617
Less: Goodwill and other intangible assets (GAAP) 558,485 559,617 560,756 561,902 558,367
Tangible assets (non-GAAP) $ 33,195,267 $ 32,699,420 $ 32,029,934 $ 32,432,541 $ 32,150,250
Tangible equity (non-GAAP) 8.35 % 8.30 % 8.35 % 8.19 % 8.14 %
Tangible common equity:
Tangible shareholders' equity (non-GAAP) $ 2,771,220 $ 2,713,311 $ 2,673,869 $ 2,657,788 $ 2,616,412
Less: Preferred stock (GAAP) 145,037 145,037 145,037 145,037 145,037
Tangible common shareholders' equity (non-GAAP) $ 2,626,183 $ 2,568,274 $ 2,528,832 $ 2,512,751 $ 2,471,375
Tangible assets (non-GAAP) $ 33,195,267 $ 32,699,420 $ 32,029,934 $ 32,432,541 $ 32,150,250
Tangible common equity (non-GAAP) 7.91 % 7.85 % 7.90 % 7.75 % 7.69 %
Tangible book value per common share:
Tangible common shareholders' equity (non-GAAP) $ 2,626,183 $ 2,568,274 $ 2,528,832 $ 2,512,751 $ 2,471,375
Common shares outstanding 90,594 90,410 90,199 90,204 90,194
Tangible book value per common share (non-GAAP) $ 28.99 $ 28.41 $ 28.04 $ 27.86 $ 27.40
Core deposits:
Total deposits $ 28,846,966 $ 28,481,834 $ 27,335,436 $ 26,920,553 $ 26,355,997
Less: Certificates of deposit 2,014,544 2,234,133 2,487,818 2,570,440 2,666,047
Core deposits (non-GAAP) $ 26,832,422 $ 26,247,701 $ 24,847,618 $ 24,350,113 $ 23,689,950
(In millions, except per share data)GAAP earnings adjusted for strategic optimization initiatives and merger related costs:
Three months ended June 30, 2021
Pre-Tax IncomeEarnings Applicable to Common Shareholders Diluted EPS
Reported (GAAP) $ 128.0 $ 91.6 $ 1.01
Facilities optimization 1.1 0.8 0.01
Merger related 17.1 16.8 0.19
Adjusted (non-GAAP) $ 146.2 $ 109.2 $ 1.21
20