Embed Size (px)
Citation preview

applied sciences
Article
Wedge-Splitting Test on Carbon-ContainingRefractories at High Temperatures
Martin Stückelschweiger 1,*, Dietmar Gruber 2 , Shengli Jin 2 and Harald Harmuth 2
1 K1-MET GmbH, Linz 4020, Austria2 Chair of Ceramics, Montanuniversitaet Leoben 8700, Austria* Correspondence: [email protected]; Tel.: +43-3842-402-3207
Received: 4 July 2019; Accepted: 5 August 2019; Published: 8 August 2019�����������������
Abstract: The mode I fracture behavior of ordinary refractory materials is usually tested with thewedge-splitting test. At elevated temperatures, the optical displacement measurement is difficultbecause of the convection in the furnace and possible reactions of refractory components with theambient atmosphere. The present paper introduces a newly developed testing device, which isable to perform such experiments up to 1500 ◦C. For the testing of carbon-containing refractories agas purging, for example, with argon, is possible. Laser speckle extensometers are applied for thedisplacement measurement. A carbon-containing magnesia refractory (MgO–C) was selected fora case study. Based on the results obtained from tests, fracture mechanical parameters such as thespecific fracture energy and the nominal notch tensile strength were calculated. An inverse simulationprocedure applying the finite element method yields tensile strength, the total specific fractureenergy, and the strain-softening behavior. Additionally, the creep behavior was also considered forthe evaluation.
Keywords: high-temperature wedge splitting test; fracture parameters; reducing condition;carbon-containing refractories; strain-softening; fracture energy
1. Introduction
The wedge-splitting test is performed on notched prismatic specimens that enable stable crackformation for relatively large specimens [1,2]. The reasons are the action of the wedge and the relativelyhigh fracture surface to sample volume ratio. The specimen length is 100 mm, the height is also 100 mm,and the thickness 75 mm. A three-dimensional schematic representation of the sample including theload transmission parts is shown in Figure 1. The wedge-splitting test (WST) at room temperatureis performed with a loading rate of 0.5 mm/min. During the test, a video extensometer detects thehorizontal displacement at the measuring points. The displacement is measured at the height wherethe rollers contact the load transmission elements.
Appl. Sci. 2019, 9, 3249; doi:10.3390/app9163249 www.mdpi.com/journal/applsci

Appl. Sci. 2019, 9, 3249 2 of 10Appl. Sci. 2019, 9, x FOR PEER REVIEW 2 of 11
Figure 1. Schematic representation of the wedge-splitting test.
The sample rests on a linear support (3 × 3 × 90 mm3) to allow for the free vertical displacement of the sample except for the support. The linear support, as well as the wedge and the rollers, are made of corundum to withstand the testing temperatures.
From the results, the specific fracture energy Gf’ and the nominal notch tensile strength σNT, can be calculated directly from the load-displacement curve (Equations (2) and (3)). The horizontal force FH, which is needed for Equations (2) and (3), is calculated from the geometry of the wedge and the measured vertical force FV (Equation (1)): = (1)
In this equation, α is the wedge angle (10°). = 1 (2)
The specific fracture energy Gf’ is the area below the load-displacement curve divided by the ligament area A. The measured horizontal displacement is defined with δH, and the horizontal displacement at 15% of the maximum load is δ.
Here Gf’ (Equation (2)) is the specific fracture energy directly evaluated from the load-displacement curve. This parameter includes only the major part of the specific fracture energy because a premature termination of the test is necessary to avoid the contact of the wedge with the ligament. This means that the WST is stopped before the force reaches zero.
The nominal notch tensile strength σNT is calculated according to Equation (3): = , 1 6 (3)
Here, FH,max is the maximum horizontal load, b and h are the width and the height of the ligament, and y is the vertical distance from the loading position to the center of the ligament.
The simplest possibility for the displacement measurement is to make use of the crosshead travel. Unfortunately, this is not accurate because deformations of the testing machine influence the results as well as the adjustment of the load transmission parts during load application. Out of these reasons, it is advantageous to measure the displacement directly on the sample.
Wedge Load transmission elements
Rollers
Sample
Linear support
Loading direction
Measuring point 2 Measuring point 1
Figure 1. Schematic representation of the wedge-splitting test.
The sample rests on a linear support (3 × 3 × 90 mm3) to allow for the free vertical displacementof the sample except for the support. The linear support, as well as the wedge and the rollers, are madeof corundum to withstand the testing temperatures.
From the results, the specific fracture energy Gf’ and the nominal notch tensile strength σNT, can becalculated directly from the load-displacement curve (Equations (2) and (3)). The horizontal forceFH, which is needed for Equations (2) and (3), is calculated from the geometry of the wedge and themeasured vertical force FV (Equation (1)):
FH =FV
2tanα2(1)
In this equation, α is the wedge angle (10◦).
G f ′ =1A
∫ δ
0FHdδH (2)
The specific fracture energy Gf’ is the area below the load-displacement curve divided by theligament area A. The measured horizontal displacement is defined with δH, and the horizontaldisplacement at 15% of the maximum load is δ.
Here Gf’ (Equation (2)) is the specific fracture energy directly evaluated from the load-displacementcurve. This parameter includes only the major part of the specific fracture energy because a prematuretermination of the test is necessary to avoid the contact of the wedge with the ligament. This meansthat the WST is stopped before the force reaches zero.
The nominal notch tensile strength σNT is calculated according to Equation (3):
σNT =FH,max
bh
(1 +
6yh
)(3)
Here, FH,max is the maximum horizontal load, b and h are the width and the height of the ligament,and y is the vertical distance from the loading position to the center of the ligament.
The simplest possibility for the displacement measurement is to make use of the crosshead travel.Unfortunately, this is not accurate because deformations of the testing machine influence the results as
Appl. Sci. 2019, 9, 3249 3 of 10
well as the adjustment of the load transmission parts during load application. Out of these reasons,it is advantageous to measure the displacement directly on the sample.
At elevated temperatures, one possibility is to measure the displacement with an opticaldilatometer. Here a halogen lamp illuminates the sample on one side and on the other side theshadow cast by the sample against the light source is recorded by a high-resolution complementarymetal-oxide-semiconductor (CMOS) camera [3]. With this method, the displacement is measured onone side of the sample only. Although the performance of the wedge splitting test at room temperaturewith optical displacement measurement is state of the art [4], at elevated temperatures, the opticalmeasurement is far more difficult due to the radiation and convection in the furnace chamber.
High-temperature testing above 600 ◦C of carbon-containing refractories shall be carried out innon-oxidizing atmospheres. Otherwise, the oxidation of carbon 2C(g) + O2(g) = 2CO(g) takes place [5],and the microstructure and the properties will be changed significantly [6].
To counteract these problems, a new device was developed to perform the WST oncarbon-containing materials up to 1500 ◦C in an argon atmosphere and to measure the displacementon the front and rear side of the sample. The horizontal displacements are measured with two laserspeckle extensometers (LSE). In the present paper, the features of the new device and the fracturebehavior of a resin-bonded magnesia carbon material at elevated temperatures are discussed.
2. Material and Sample Preparation
The tested resin bonded magnesia carbon brick is composed of fused magnesia, large crystalmagnesia clinker, and graphite. A typical application is the refractory lining of a steel ladle in thesecondary steel metallurgy. The residual carbon content after cooking under reducing conditionswas 10%. The composition showed a CaO/SiO2 (C/S) ratio of 3.8. Bricks were heat-treated at 1000◦C for 5 h in a coke bed prior to testing; this enhanced the carbon bond and reduced the emission ofvolatiles during testing. These emissions caused problems for the displacement measurement by laserspeckle extensometers.
3. Device
The wedge splitting test device (universal testing device with displacement measurement) wasdeveloped in close cooperation with the company ZwickRoell Testing Systems GmbH (Furstenfeld,Austria). An existing universal testing device with a rigid frame and two rotating spindles wereequipped with several components in order to perform the wedge-splitting test at high temperatures.A schematic drawing of the device is illustrated in Figure 2. The load cell is integrated in the lowerpiston and the maximum load capacity is 300 kN at room temperature. The vertical load rate is set to0.5 mm/min for the wedge-splitting test.
Appl. Sci. 2019, 9, x FOR PEER REVIEW 3 of 11
At elevated temperatures, one possibility is to measure the displacement with an optical dilatometer. Here a halogen lamp illuminates the sample on one side and on the other side the shadow cast by the sample against the light source is recorded by a high-resolution complementary metal-oxide-semiconductor (CMOS) camera [3]. With this method, the displacement is measured on one side of the sample only. Although the performance of the wedge splitting test at room temperature with optical displacement measurement is state of the art [4], at elevated temperatures, the optical measurement is far more difficult due to the radiation and convection in the furnace chamber.
High-temperature testing above 600 °C of carbon-containing refractories shall be carried out in non-oxidizing atmospheres. Otherwise, the oxidation of carbon 2C(g) + O2(g) = 2CO(g) takes place [5], and the microstructure and the properties will be changed significantly [6].
To counteract these problems, a new device was developed to perform the WST on carbon-containing materials up to 1500 °C in an argon atmosphere and to measure the displacement on the front and rear side of the sample. The horizontal displacements are measured with two laser speckle extensometers (LSE). In the present paper, the features of the new device and the fracture behavior of a resin-bonded magnesia carbon material at elevated temperatures are discussed.
2. Material and Sample Preparation
The tested resin bonded magnesia carbon brick is composed of fused magnesia, large crystal magnesia clinker, and graphite. A typical application is the refractory lining of a steel ladle in the secondary steel metallurgy. The residual carbon content after cooking under reducing conditions was 10%. The composition showed a CaO/SiO2 (C/S) ratio of 3.8. Bricks were heat-treated at 1000 °C for 5 h in a coke bed prior to testing; this enhanced the carbon bond and reduced the emission of volatiles during testing. These emissions caused problems for the displacement measurement by laser speckle extensometers.
3. Device
The wedge splitting test device (universal testing device with displacement measurement) was developed in close cooperation with the company ZwickRoell Testing Systems GmbH (Furstenfeld, Austria). An existing universal testing device with a rigid frame and two rotating spindles were equipped with several components in order to perform the wedge-splitting test at high temperatures. A schematic drawing of the device is illustrated in Figure 2. The load cell is integrated in the lower piston and the maximum load capacity is 300 kN at room temperature. The vertical load rate is set to 0.5 mm/min for the wedge-splitting test.
Figure 2. High-temperature testing device (courtesy of Messphysik).
In this device, a gas-tight furnace was installed (Figure 2, Figure 3). The furnace has two windows (front and rear) in order to measure the displacement during the test. The maximum testing temperature is 1500 °C. In order to protect the carbon in the samples from oxidation, the furnace chamber can be purged with an inert gas. The purging rate depends on the material and on the testing
Figure 2. High-temperature testing device (courtesy of Messphysik).
In this device, a gas-tight furnace was installed (Figure 2, Figure 3). The furnace has two windows(front and rear) in order to measure the displacement during the test. The maximum testing temperatureis 1500 ◦C. In order to protect the carbon in the samples from oxidation, the furnace chamber can bepurged with an inert gas. The purging rate depends on the material and on the testing temperature

Appl. Sci. 2019, 9, 3249 4 of 10
and can be adjusted between 8 and 70 L/h. The adjustment of the purging rate was done with a valveat the digital flowmeter.
Appl. Sci. 2019, 9, x FOR PEER REVIEW 4 of 11
temperature and can be adjusted between 8 and 70 L/h. The adjustment of the purging rate was done with a valve at the digital flowmeter.
Figure 3. Gas-tight furnace (courtesy of Messphysik).
For the displacement measurement during the wedge-splitting test, the device was equipped with two laser-speckle extensometers. One is situated in the front and the other one in the rear of the furnace. The sample was illuminated with green laser light (wavelength: 532 nm), creating a speckled pattern on the sample surface. The movement of the speckled pattern was recorded with two full-screen digital cameras. In each evaluation area, a displacement measurement of the speckled pattern was performed. The increase in the distance between the measurement points is calculated. It is called horizontal displacement in this paper [7].
The setup of the furnace including the laser-speckle extensometers is shown in Figure 4 (all units in mm).
Figure 4. Furnace with two laser-speckle extensometers (courtesy of Messphysik).
Each extensometer has two lasers and two cameras. The green lines in Figure 4 show the course of the laser beam. The distance of the measuring points was set to 40 mm. This initial measurement length can be adjusted according to the sample geometry. The distance between the position of the camera and the sample surface is 380 mm.
The advantage of a laser-speckle-extensometer compared to a mechanical extensometer is that the sample and the extensometer fingers are not in contact. Contacting extensometer fingers could be damaged during the cracking of the sample, furthermore, a possible deformation of the extensometers could influence the results. An advantage compared to a standard laser extensometer is that an application of measuring marks to increase the contrast is not necessary because of the characteristic speckled pattern. The resolution of the strain measurement is 0.11 µm according to the specifications from ZwickRoell. The scattering of the measurement signal during a high-temperature test was below 3 µm. This value was determined together with the company ZwickRoell in the course of preliminary investigations. The horizontal displacement was measured in the front and rear side, the average value was used for the evaluation. Figure 5 shows the configuration after a test.
Figure 3. Gas-tight furnace (courtesy of Messphysik).
For the displacement measurement during the wedge-splitting test, the device was equippedwith two laser-speckle extensometers. One is situated in the front and the other one in the rear ofthe furnace. The sample was illuminated with green laser light (wavelength: 532 nm), creating aspeckled pattern on the sample surface. The movement of the speckled pattern was recorded withtwo full-screen digital cameras. In each evaluation area, a displacement measurement of the speckledpattern was performed. The increase in the distance between the measurement points is calculated.It is called horizontal displacement in this paper [7].
The setup of the furnace including the laser-speckle extensometers is shown in Figure 4 (all unitsin mm).
Appl. Sci. 2019, 9, x FOR PEER REVIEW 4 of 11
temperature and can be adjusted between 8 and 70 L/h. The adjustment of the purging rate was done with a valve at the digital flowmeter.
Figure 3. Gas-tight furnace (courtesy of Messphysik).
For the displacement measurement during the wedge-splitting test, the device was equipped with two laser-speckle extensometers. One is situated in the front and the other one in the rear of the furnace. The sample was illuminated with green laser light (wavelength: 532 nm), creating a speckled pattern on the sample surface. The movement of the speckled pattern was recorded with two full-screen digital cameras. In each evaluation area, a displacement measurement of the speckled pattern was performed. The increase in the distance between the measurement points is calculated. It is called horizontal displacement in this paper [7].
The setup of the furnace including the laser-speckle extensometers is shown in Figure 4 (all units in mm).
Figure 4. Furnace with two laser-speckle extensometers (courtesy of Messphysik).
Each extensometer has two lasers and two cameras. The green lines in Figure 4 show the course of the laser beam. The distance of the measuring points was set to 40 mm. This initial measurement length can be adjusted according to the sample geometry. The distance between the position of the camera and the sample surface is 380 mm.
The advantage of a laser-speckle-extensometer compared to a mechanical extensometer is that the sample and the extensometer fingers are not in contact. Contacting extensometer fingers could be damaged during the cracking of the sample, furthermore, a possible deformation of the extensometers could influence the results. An advantage compared to a standard laser extensometer is that an application of measuring marks to increase the contrast is not necessary because of the characteristic speckled pattern. The resolution of the strain measurement is 0.11 µm according to the specifications from ZwickRoell. The scattering of the measurement signal during a high-temperature test was below 3 µm. This value was determined together with the company ZwickRoell in the course of preliminary investigations. The horizontal displacement was measured in the front and rear side, the average value was used for the evaluation. Figure 5 shows the configuration after a test.
Figure 4. Furnace with two laser-speckle extensometers (courtesy of Messphysik).
Each extensometer has two lasers and two cameras. The green lines in Figure 4 show the courseof the laser beam. The distance of the measuring points was set to 40 mm. This initial measurementlength can be adjusted according to the sample geometry. The distance between the position of thecamera and the sample surface is 380 mm.
The advantage of a laser-speckle-extensometer compared to a mechanical extensometer is thatthe sample and the extensometer fingers are not in contact. Contacting extensometer fingers could bedamaged during the cracking of the sample, furthermore, a possible deformation of the extensometerscould influence the results. An advantage compared to a standard laser extensometer is that anapplication of measuring marks to increase the contrast is not necessary because of the characteristicspeckled pattern. The resolution of the strain measurement is 0.11 µm according to the specificationsfrom ZwickRoell. The scattering of the measurement signal during a high-temperature test was below3 µm. This value was determined together with the company ZwickRoell in the course of preliminaryinvestigations. The horizontal displacement was measured in the front and rear side, the average valuewas used for the evaluation. Figure 5 shows the configuration after a test.
Appl. Sci. 2019, 9, 3249 5 of 10
Appl. Sci. 2019, 9, x FOR PEER REVIEW 5 of 11
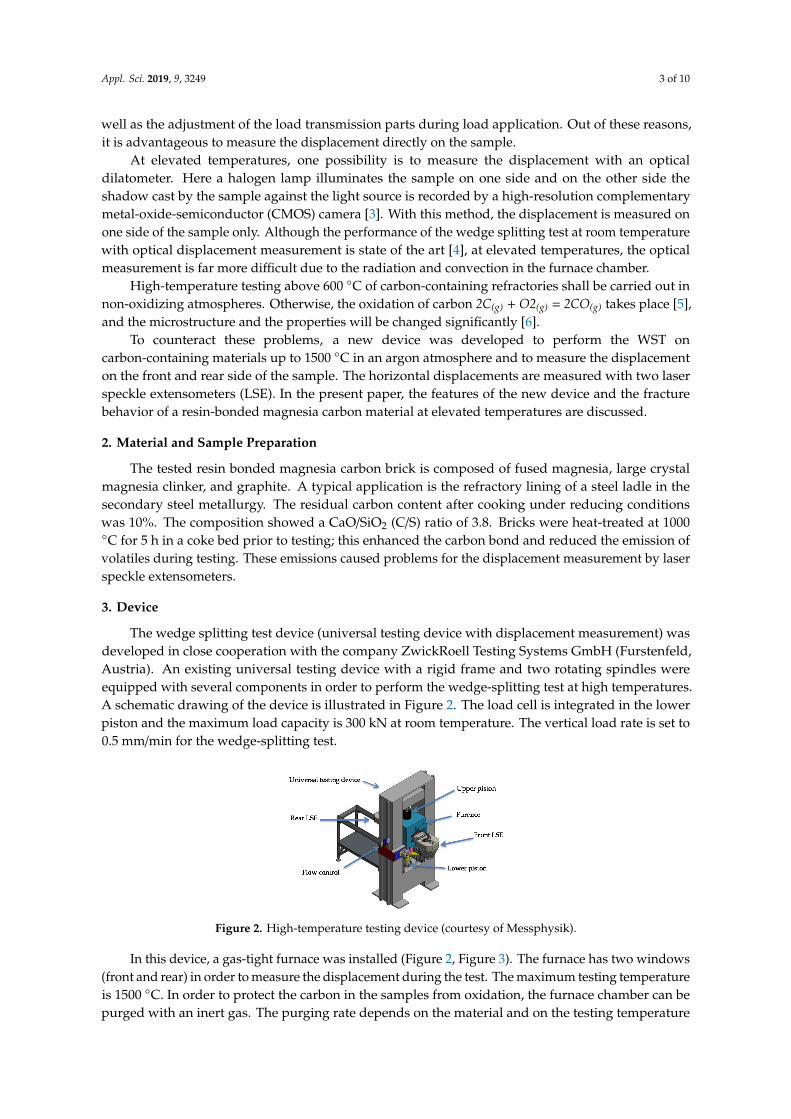
Figure 5. Wedge splitting test setup and sample after testing.
The alignment of the rolls and the wedge is essential to achieve symmetrical displacement on the front and rear side of the sample.
4. Results and Discussion
This section is divided into three subsections. It provides a concise and precise description of the experimental results, their interpretations, and the conclusions that can be drawn.
4.1. Experiments and Evaluation
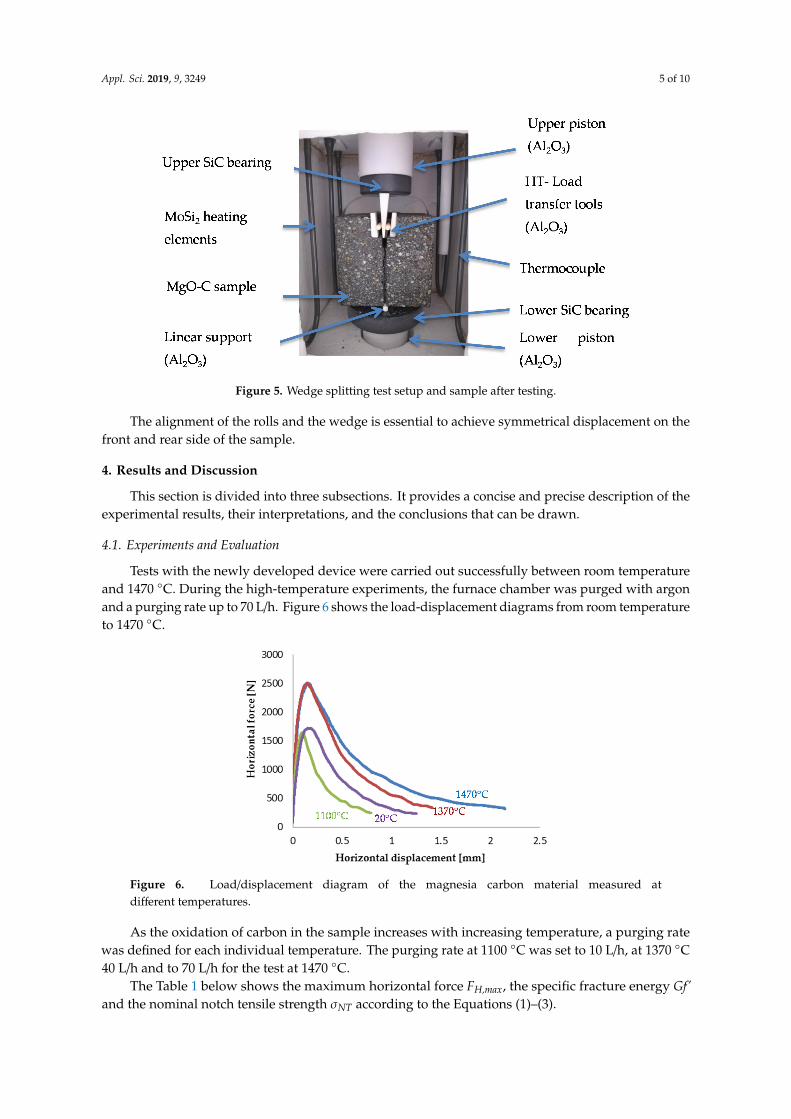
Tests with the newly developed device were carried out successfully between room temperature and 1470 °C. During the high-temperature experiments, the furnace chamber was purged with argon and a purging rate up to 70 L/h. Figure 6 shows the load-displacement diagrams from room temperature to 1470 °C.
Figure 6. Load/displacement diagram of the magnesia carbon material measured at different temperatures.
Figure 5. Wedge splitting test setup and sample after testing.
The alignment of the rolls and the wedge is essential to achieve symmetrical displacement on thefront and rear side of the sample.
4. Results and Discussion
This section is divided into three subsections. It provides a concise and precise description of theexperimental results, their interpretations, and the conclusions that can be drawn.
4.1. Experiments and Evaluation
Tests with the newly developed device were carried out successfully between room temperatureand 1470 ◦C. During the high-temperature experiments, the furnace chamber was purged with argonand a purging rate up to 70 L/h. Figure 6 shows the load-displacement diagrams from room temperatureto 1470 ◦C.
Appl. Sci. 2019, 9, x FOR PEER REVIEW 5 of 11
Figure 5. Wedge splitting test setup and sample after testing.
The alignment of the rolls and the wedge is essential to achieve symmetrical displacement on the front and rear side of the sample.
4. Results and Discussion
This section is divided into three subsections. It provides a concise and precise description of the experimental results, their interpretations, and the conclusions that can be drawn.
4.1. Experiments and Evaluation
Tests with the newly developed device were carried out successfully between room temperature and 1470 °C. During the high-temperature experiments, the furnace chamber was purged with argon and a purging rate up to 70 L/h. Figure 6 shows the load-displacement diagrams from room temperature to 1470 °C.
Figure 6. Load/displacement diagram of the magnesia carbon material measured at different temperatures.
Figure 6. Load/displacement diagram of the magnesia carbon material measured atdifferent temperatures.
As the oxidation of carbon in the sample increases with increasing temperature, a purging ratewas defined for each individual temperature. The purging rate at 1100 ◦C was set to 10 L/h, at 1370 ◦C40 L/h and to 70 L/h for the test at 1470 ◦C.
The Table 1 below shows the maximum horizontal force FH,max, the specific fracture energy Gf’and the nominal notch tensile strength σNT according to the Equations (1)–(3).

Appl. Sci. 2019, 9, 3249 6 of 10
Table 1. Fracture mechanical parameters determined from tests performed at room temperature (RT),1100 ◦C, 1370 ◦C, and 1470 ◦C.
20 ◦C (RT) 1100 ◦C 1370 ◦C 1470 ◦C
FVmax [N] 301 288 439 440FHmax [N] 1720 1646 2508 2510
Specific fracture energy Gf’ [N/m] 240 125 362 513Nominal notch tensile strength σNT [N/mm2] 2.71 3.13 4.02 4.35
Gf’/σNT [mm] 0.09 0.04 0.09 0.12
For the high-temperature tests the specific fracture energy Gf’ and the nominal notch tensilestrength σNT show an increase with increasing temperature. The test at room temperature shows thesmallest nominal notch tensile strength but the specific fracture energy Gf’ is higher than that at 1100◦C and lower than that at 1370 ◦C. The ratio between the specific fracture energy Gf’ and the notchtensile strength σNT are applied as an indicator for brittleness [8].
The following figure illustrates a sample after the experiment at 1470 ◦C. The oxidation of thecarbon in the sample is relatively small, only slight traces of oxidation are visible on the surface.The ligament area of the sample (the area inside the red frame) is without any visible oxidation(Figure 7).
Appl. Sci. 2019, 9, x FOR PEER REVIEW 6 of 11
As the oxidation of carbon in the sample increases with increasing temperature, a purging rate was defined for each individual temperature. The purging rate at 1100 °C was set to 10 L/h, at 1370 °C 40 L/h and to 70 L/h for the test at 1470 °C.
The Table 1 below shows the maximum horizontal force FH,max, the specific fracture energy Gf’ and the nominal notch tensile strength σNT according to the Equations (1)–(3).
Table 1. Fracture mechanical parameters determined from tests performed at room temperature (RT), 1100 °C, 1370 °C, and 1470 °C.
20 °C (RT) 1100 °C 1370 °C 1470 °C
FVmax [N] 301 288 439 440
FHmax [N] 1720 1646 2508 2510
Specific fracture energy Gf‘ [N/m] 240 125 362 513
Nominal notch tensile strength σNT [N/mm2] 2.71 3.13 4.02 4.35
Gf`/σNT [mm] 0.09 0.04 0.09 0.12
For the high-temperature tests the specific fracture energy Gf’ and the nominal notch tensile strength σNT show an increase with increasing temperature. The test at room temperature shows the smallest nominal notch tensile strength but the specific fracture energy Gf` is higher than that at 1100 °C and lower than that at 1370 °C. The ratio between the specific fracture energy Gf’ and the notch tensile strength σNT are applied as an indicator for brittleness [8].
The following figure illustrates a sample after the experiment at 1470 °C. The oxidation of the carbon in the sample is relatively small, only slight traces of oxidation are visible on the surface. The ligament area of the sample (the area inside the red frame) is without any visible oxidation (Figure 7).
Figure 7. Sample after a wedge-splitting test at 1470 °C.
The weight loss after the test at 1470 °C is below 1% (18 g out of 2250 g of a sample in virgin state) for a purging rate of 70 L/h. The reaction of C(s) with O2(g) decreases with an increase in the argon purging rate [9]. The weight loss after the test at 1370 °C is 0.8%. For the test at 1100 °C, the weight loss decreases to 0.5%.
4.2. Inverse Evaluation
In order to determine other parameters of interest, such as the tensile strength ft and the total specific fracture energy Gf and to consider the influence of the creep behavior, an inverse evaluation method was applied on a two-dimensional finite element model of the wedge splitting test developed
Figure 7. Sample after a wedge-splitting test at 1470 ◦C.
The weight loss after the test at 1470 ◦C is below 1% (18 g out of 2250 g of a sample in virgin state)for a purging rate of 70 L/h. The reaction of C(s) with O2(g) decreases with an increase in the argonpurging rate [9]. The weight loss after the test at 1370 ◦C is 0.8%. For the test at 1100 ◦C, the weightloss decreases to 0.5%.
4.2. Inverse Evaluation
In order to determine other parameters of interest, such as the tensile strength ft and the total specificfracture energy Gf and to consider the influence of the creep behavior, an inverse evaluation method wasapplied on a two-dimensional finite element model of the wedge splitting test developed earlier [10].The commercial software package ABAQUS (6.13, Dassault Sys Simulia Corp, Providence, RI, USA)was used for modeling. The mode I fracture was considered with an exponential strain-softeningbehavior applied in the ligament area (Figure 8) (Equation (4)).
σ = ft
1−
1− e−ϕx
xult
1− e−ϕ
(4)

Appl. Sci. 2019, 9, 3249 7 of 10
Appl. Sci. 2019, 9, x FOR PEER REVIEW 7 of 11
earlier [10]. The commercial software package ABAQUS (6.13, Dassault Sys Simulia Corp, Providence, RI, USA) was used for modeling. The mode I fracture was considered with an exponential strain-softening behavior applied in the ligament area (Figure 8) (Equation (4)).
= 1 1 1 (4)
Figure 8. Finite element model geometry and mesh.
In this equation ft is the tensile strength of the material, the parameter xult is the ultimate crack opening and φ is a non-dimensional parameter that defines the rate of damage evolution [11]. Cohesive elements were applied to the interfaces of the two half specimens to simulate the mode I fracture [11]. Through an adaptive nonlinear least-squares algorithm, the fracture parameters are inversely calculated by fitting the results of finite element simulations to the results of laboratory wedge splitting tests.
The following Figures 9–11 show the load-displacement diagrams and the determined strain-softening behavior for experiments between 1100 °C and 1470 °C. The green curves in the left diagrams (a) are the measured ones from the wedge splitting tests. The blue curves (a) are the curves simulated by finite element simulations. The red curves in the diagrams show the results with consideration of the creep behavior and are explained in the following chapter. The (b) figures show the strain-softening behavior determined via inverse evaluation from parameters ft, xult, and φ. Results from (b) correspond to (a).
Figure 8. Finite element model geometry and mesh.
In this equation f t is the tensile strength of the material, the parameter xult is the ultimatecrack opening and ϕ is a non-dimensional parameter that defines the rate of damage evolution [11].Cohesive elements were applied to the interfaces of the two half specimens to simulate the mode Ifracture [11]. Through an adaptive nonlinear least-squares algorithm, the fracture parameters areinversely calculated by fitting the results of finite element simulations to the results of laboratorywedge splitting tests.
The following Figures 9–11 show the load-displacement diagrams and the determinedstrain-softening behavior for experiments between 1100 ◦C and 1470 ◦C. The green curves in theleft diagrams (a) are the measured ones from the wedge splitting tests. The blue curves (a) are thecurves simulated by finite element simulations. The red curves in the diagrams show the resultswith consideration of the creep behavior and are explained in the following chapter. The (b) figuresshow the strain-softening behavior determined via inverse evaluation from parameters f t, xult, and ϕ.Results from (b) correspond to (a).Appl. Sci. 2019, 9, x FOR PEER REVIEW 8 of 11
Figure 9. Load-displacement diagram (a) and strain-softening behavior (b) at 1470 °C.
Figure 10. Load-displacement diagram (a) and strain-softening behavior (b) at 1370 °C.
Figure 11. Load-displacement diagram (a) and strain-softening behavior (b) at 1100 °C.
The inversely calculated curve (a) shows only a slight deviation from the tested one. The minimization procedure is automatically terminated when a minimum of residuals is reached [10]. The tensile strength and xult show a decrease with decreasing temperature when the creep is not considered.
Table 2 shows the inversely evaluated parameters and brittleness indicators.
Table 2. Fracture mechanical parameters and brittleness indicators at different temperatures calculated from ABAQUS simulations.
Gf
Figure 9. Load-displacement diagram (a) and strain-softening behavior (b) at 1470 ◦C.

Appl. Sci. 2019, 9, 3249 8 of 10
Appl. Sci. 2019, 9, x FOR PEER REVIEW 8 of 11
Figure 9. Load-displacement diagram (a) and strain-softening behavior (b) at 1470 °C.
Figure 10. Load-displacement diagram (a) and strain-softening behavior (b) at 1370 °C.
Figure 11. Load-displacement diagram (a) and strain-softening behavior (b) at 1100 °C.
The inversely calculated curve (a) shows only a slight deviation from the tested one. The minimization procedure is automatically terminated when a minimum of residuals is reached [10]. The tensile strength and xult show a decrease with decreasing temperature when the creep is not considered.
Table 2 shows the inversely evaluated parameters and brittleness indicators.
Table 2. Fracture mechanical parameters and brittleness indicators at different temperatures calculated from ABAQUS simulations.
Gf
Figure 10. Load-displacement diagram (a) and strain-softening behavior (b) at 1370 ◦C.
Appl. Sci. 2019, 9, x FOR PEER REVIEW 8 of 11
Figure 9. Load-displacement diagram (a) and strain-softening behavior (b) at 1470 °C.
Figure 10. Load-displacement diagram (a) and strain-softening behavior (b) at 1370 °C.
Figure 11. Load-displacement diagram (a) and strain-softening behavior (b) at 1100 °C.
The inversely calculated curve (a) shows only a slight deviation from the tested one. The minimization procedure is automatically terminated when a minimum of residuals is reached [10]. The tensile strength and xult show a decrease with decreasing temperature when the creep is not considered.
Table 2 shows the inversely evaluated parameters and brittleness indicators.
Table 2. Fracture mechanical parameters and brittleness indicators at different temperatures calculated from ABAQUS simulations.
Gf
Figure 11. Load-displacement diagram (a) and strain-softening behavior (b) at 1100 ◦C.
The inversely calculated curve (a) shows only a slight deviation from the tested one.The minimization procedure is automatically terminated when a minimum of residuals is reached [10].The tensile strength and xult show a decrease with decreasing temperature when the creep isnot considered.
Table 2 shows the inversely evaluated parameters and brittleness indicators.
Table 2. Fracture mechanical parameters and brittleness indicators at different temperatures calculatedfrom ABAQUS simulations.
Parameter 1470 ◦C 1370 ◦C 1100 ◦C
Total specific fracture energy Gf [N/m] 563 453 162Tensile strength ft [N/mm2] 2.40 2.26 1.42
σNT/ft 1.83 1.77 2.2Gf/ft [mm] 0.23 0.20 0.11
With increasing temperature, the specific fracture energy Gf increases. The tensile strength followsthe same trend. At 1470 ◦C and 1370 ◦C, the maximum horizontal forces are similar but the specificfracture energy is lower at 1370 ◦C because of lower horizontal displacement.
Additionally, the ratio between σNT and f t was calculated. The difference between σNT and f t isexpected. Reasons are the action of the notch on the one hand and on the other hand the dependence onthe brittleness number [12]. As well as Gf’/σNT, the ratio between the real specific fracture energy Gf andthe tensile strength f t is an indicator of the brittleness. This ratio decreases with decreasing temperature.

Appl. Sci. 2019, 9, 3249 9 of 10
4.3. Inverse Evaluation with the Consideration of Creep
In this chapter, the tensile creep behavior was considered in the inverse evaluation. The creepbehavior of this material was already investigated by the authors [13]. It is clear that creep has aninfluence on the service behavior and furthermore on the results of the high-temperature wedgesplitting test. The aim of these simulations is to calculate the specific fracture energy, which is caused bycrack propagation only. The contribution of creep depends on the loading rate. For low loading rates,the influence of creep is comparatively high and vice versa for high loading rates. The Norton–Baileycreep equation was applied (Equation (5)).
.εcr = K(T)σn εa
cr (5)
Here, σ is the applied load,.εcr is the creep strain rate, εcr is the creep strain, K(T)
is a temperature-dependent function and the parameters n and a are the stress and strainexponents, respectively.
These parameters were implemented in the simulation of the wedge-splitting test and the creepbehavior was considered in the whole specimen volume. The diagrams (Figures 9–11) in Section 4.2shows the results in detail. The left diagrams (a) at each temperature show the experimental curve andthe fits, both, with and without consideration of creep. The strain-softening behavior, which is plottedon the right side in Figures 9b, 10b and 11b, shows the change of the energy and the tensile strength ofthe material at each temperature.
Table 3 shows the change of the parameter with respect to temperature when creep is considered.The inverse calculated parameter Gf shows an increase of the specific fracture energy with increasingtemperature. The ratio between the specific fracture energy and the tensile strength that is related to thebrittleness shows, for both cases (with and without consideration of creep), an increase with increasingtemperature. The difference between Gf with consideration of creep and Gf without consideration ofcreep (Table 2), ∆Gf, shows a maximum temperature of 1370 ◦C and is between 15% and 47% for thehigh-temperature tests.
Table 3. Fracture mechanical parameters at different temperatures calculated considering creep andinfluence on Gf.
Parameter 1470 ◦C 1370 ◦C 1100 ◦C
Specific fracture energy Gf, creep considered [N/m] 417 238 137∆Gf [N/m] 146 (26%) 215 (47%) 25 (15%)
Tensile strength ft, creep considered [N/mm2] 2.47 2.99 1.71Gf/ft, creep considered [mm] 0.17 0.08 0.08
5. Conclusions
A new testing device to perform the WST was introduced in this paper. This new deviceallows fracture mechanical characterization of carbon-containing refractories up to 1500 ◦C underreducing conditions. Tests on resin bonded magnesia carbon material were successfully carried out.The oxidation of the carbon in the sample during the high-temperature test can be avoided by inertgas purging during the whole test. The displacement measurement directly on the sample showsa resolution below 3 µm and works stably over the whole temperature range. Based on the dataobtained from laboratory experiments, fracture parameters can be determined and implemented infinite element simulations with an inverse estimation procedure. Besides, simulations including thetensile creep behavior were performed and the fracture parameters under pure mode I failure weredetermined. The influence of creep on the results obtained from the inverse evaluation for the specificfracture energy is between 15% (1100 ◦C) and 47% (1370 ◦C).

Appl. Sci. 2019, 9, 3249 10 of 10
Author Contributions: Conceptualization, M.S. and D.G.; Methodology, M.S.; Software, S.J.; Validation, D.G., S.J.and H.H.; Formal Analysis, M.S. and. S.J.; Investigation, M.St.; Resources, M.S. and D.G.; Data Curation, D.G.;Writing—Original Draft Preparation, M.S.; Writing—Review & Editing, D.G.; Visualization, M.S.; Supervision,H.H.; Project Administration, D.G.; Funding Acquisition, H.H.
Acknowledgments: This research was funded by K1-MET GmbH, metallurgical competence center. The researchprogram of the competence center K1-MET is supported by COMET (Competence Centre for Excellent Technologies),the Austrian program for competence centers. COMET is funded by the Federal Ministry for Transport, Innovationand Technology, the Federal Ministry for Science, Research and Economy, the province of Upper Austria, Tyrol,and Styria, the Styrian Business Promotion Agency. The authors gratefully thank the company ZwickRoell TestingSystems GmbH (former Messphysik Materials Testing GmbH) for the good cooperation and manufacturing of thenewly developed device.
Conflicts of Interest: The authors declare no conflict of interest
References
1. Harmuth, H.; Rieder, K.; Krobath, M.; Tschegg, E. Investigation of the nonlinear fracture behaviour ofordinary ceramic refractory materials. Mater. Sci. Eng. A Struct. 1996, 214, 53–61. [CrossRef]
2. Tschegg, E. Equipment and Appropriate Specimen Shapes for Tests To Measure Fracture Values. Austria Patent390328, 31 January 1986.
3. Brochen, E.; Dannert, C. Thermo-mechanical characterisation of magnesia-carbon refractories by means ofwedge splitting test under controlled atmosphere at high-temperature. In Proceedings of the 13th BiennialWorldwide Congress UNITECR 2013, Victoria, BC, Canada, 10–13 September 2013.
4. Dai, J.; Gruber, D.; Harmuth, H. Determination of the fracture behaviour of MgO-refractories using multi-cyclewedge splitting test and digital image correlation. J. Eur. Ceram. Soc. 2017, 37, 5035–5043. [CrossRef]
5. Zhu, T.; Li, Y.; Luo, M.; Sang, S.; Wang, Q.; Zhao, L.; Li, Y.; Li, S. Microstructure and mechanical propertiesof MgO-C refractories containing graphite oxide nanosheets (GONs). Ceram. Int. 2013, 39, 3017–3025.[CrossRef]
6. Mahato, S.; Shantanu, K.; Behera, K. Oxidation resistance and microstructural evolution in MgO–C refractorieswith expanded graphite. Ceram. Int. 2016, 42, 7611–7619. [CrossRef]
7. Song, J.; Yang, J.; Liu, F.; Lu, K. High temperature strain measurement method by combining digital imagecorrelation of laser speckle and improved RANSAC smoothing algorithm. Opt. Lasers Eng. 2018, 111, 8–18.[CrossRef]
8. Harmuth, H.; Bradt, R.C. Investigation of refractory brittleness by fracture mechanical and fractographicmethods. InterCeram Int. Ceram. Rev. 2010, 62, 6–10.
9. Faghihi-Sani, M.; Yamaguchi, A. Oxidation kinetics of MgO–C refractory bricks. Ceram. Int. 2002, 28, 835–839.[CrossRef]
10. Jin, S.; Gruber, D.; Harmuth, H. Determination of Young’s modulus, fracture energy and tensile strengthof refractories by inverse estimation of a wedge splitting procedure. Eng. Fract. Mech. 2014, 116, 228–236.[CrossRef]
11. Abaqus 6.13 Documentation. Available online: http://dsk.ippt.pan.pl/docs/abaqus/v6.13/index.html (accessedon 4 July 2019).
12. Auer, T.; Harmuth, H. Numerical simulation of a fracture test for brittle disordered materials. In Proceedingsof the 16th European Conference of Fracture, Alexandroupolis, Greece, 3–7 July 2006.
13. Stueckelschweiger, M.; Gruber, D.; Jin, S.; Harmuth, H. Creep testing of carbon containing refractories underreducing conditions. Ceram. Int. 2019, 45, 9776–9781. [CrossRef]
© 2019 by the authors. Licensee MDPI, Basel, Switzerland. This article is an open accessarticle distributed under the terms and conditions of the Creative Commons Attribution(CC BY) license (http://creativecommons.org/licenses/by/4.0/).