Embed Size (px)
Citation preview

Strategic Alliance Reference Group Meeting – 5 October 2011 Page 1
Strategic Alliance Reference Group Meeting PROGRAM
Wednesday 5 October 2011 Ballymore Rugby Club
Clyde Road, Herston 8:30am to 4:00pm
8:30am Registration
9:00am Chairman of Board opens meeting & board update Peter Evans
9:10am Sustainability Benefits brought by Asphalt Pavement Technologies
Dave Newcomb
9:40am AAPA R&T Project – Asphalt Pavement Solutions for Life
Ian Rickards
10:10am Principles of Perpetual Pavement Design David Timm
10:40am Morning Break
11:00am Matching Accelerated Pavement Testing to Design & Performance
Buzz Powell
11:30am Polymers for a New Era of Pavement Design Erik Scholten
12:00pm Feedback on AAPA 2011 Study Tour of South Africa Peter Evans / Rob Vos / Russell Lowe
12:30pm Update - SARG Projects
- Including safe sampling of binders in the field
protocol (update and display of sampling device) and skid resistance
Rob Vos
12:45pm Development of WMA protocol for Australia Kieran Sharp
1:00pm Lunch
1:30pm Separate Technical Committee Meetings
AAPA Technical Committee Meeting
TMR Road Surfacings Technology Meeting
Chris Lange
- Incl. sampling of binders
- Incl. sampling of binders
Mike Pickering
3:20pm Meetings close
3:30pm Close out – all meeting participants come together
4:00pm Close
16-Dec-11
1
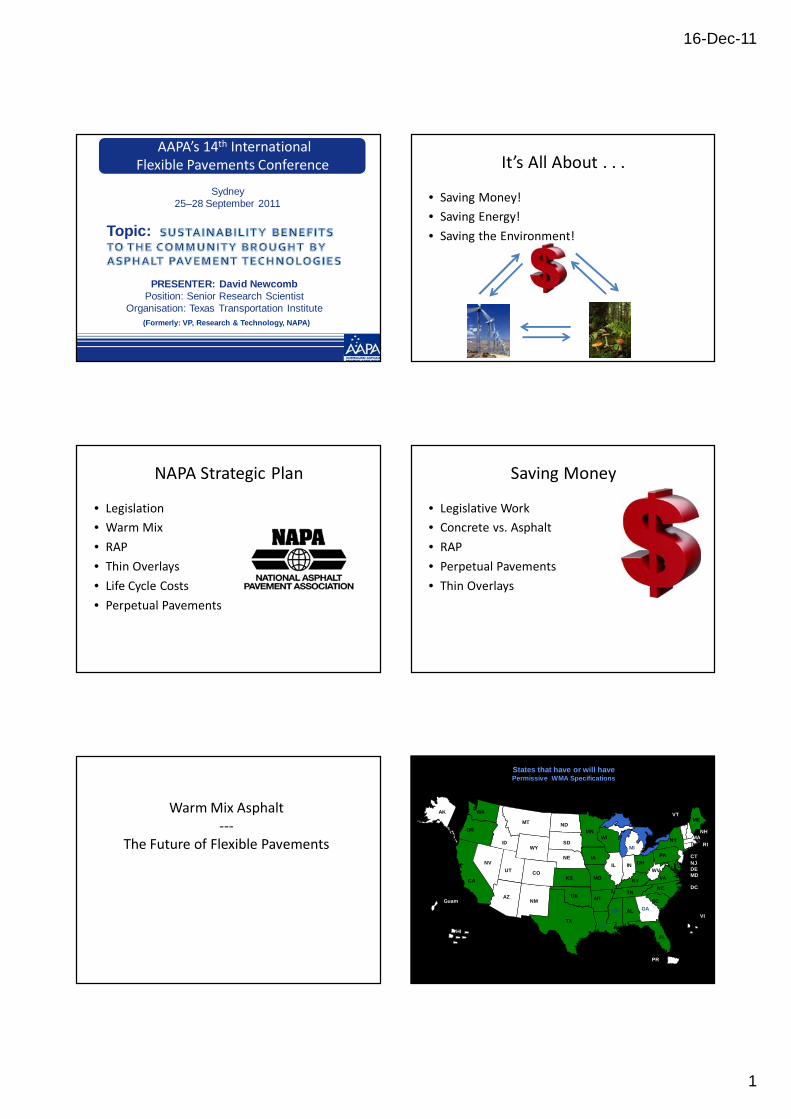
AAPA’s 14th International Flexible Pavements Conference
Sydney25–28 September 2011
Topic:
PRESENTER: David NewcombPosition: Senior Research Scientist
Organisation: Texas Transportation Institute(Formerly: VP, Research & Technology, NAPA)
It’s All About . . .
• Saving Money!
• Saving Energy!
• Saving the Environment!
NAPA Strategic Plan
• Legislation
• Warm Mix
• RAP
• Thin Overlays
• Life Cycle Costs
• Perpetual Pavements
Saving Money
• Legislative Work
• Concrete vs. Asphalt
• RAP
• Perpetual Pavements
• Thin Overlays
Warm Mix Asphalt‐‐‐
The Future of Flexible Pavements
States that have or will havePermissive WMA Specifications
CA
AZ
CO
NM
TX
OK AR
LA
MO KY
AL GA
FL
VA
OH
MI
VTAK
VI
MT
NV
Guam
ME
WA
OR
UT
KS
IDWY
ND
SD
MN
NE
WI
IA
IL IN
MS
TN
SC
NC
WV
PA
NY
CTNJDEMD
DC
MANH
PR
HI
RI

16-Dec-11
2
WMA Survey
• 2009 – 13 million tons
• 2010 – 47 million tons
Initial CostThe Beauty of RAP!
U.S. Department of TransportationFederal Highway Administration
Increased RAP Use Since 2007
CA
AZ
CO
NM
TX
OK AR
LA
MO KY
AL GA
FL
VA
OH
MI
VTAK
MT
NV
ME
WA
OR
UT
KS
IDWY
ND
SD
MN
NE
WI
IA
IL IN
MS
TN
SC
NC
WV
PA
NY
CTNJDEMD
DC
MANH
PR
HI
RI
Increased RAP Use from 2007 to 2009No Increase since 2007
Jones 2009 surveyU.S. Department of TransportationFederal Highway Administration
States that Permit More than 25% RAP in HMA Layers
CA
AZ
CO
NM
TX
OK AR
LA
MO KY
AL GA
FL
VA
OH
MI
VTAK
MT
NV
ME
WA
OR
UT
KS
IDWY
ND
SD
MN
NE
WI
IA
IL IN
MS
TN
SC
NC
WV
PA
NY
CTNJDEMD
DC
MA
NH
HI
RI
All layersBase and Intermediate Layers OnlyBase layer onlyDo not permit more than 25% RAP Jones 2009 survey
Usage
• In 2008, national average RAP use was about 12.5%
• In 2010, the average was 17.6%
Max Tensile Strain
Pavement Foundation
High ModulusRut Resistant Material(Varies As Needed)
Flexible Fatigue ResistantMaterial 75 - 100 mm
40-75 mm SMA, OGFC or Superpave}100 mmto150 mm
ZoneOf High
Compression
Perpetual Pavement

16-Dec-11
3
Comparison of Thickness –AASHTO 93 vs. Long Life
0
5
10
15
20
25
0.1 1 10 100 1000
As
ph
alt
Th
ick
ne
ss
, in
.
ESALs, Millions
AASHTO PerRoad
125
250
375
500
Perpetual Pavement Life Cycle Costs
Save 44%
Perpetual Pavement Material Usage ‐Sustainable
Save 32% Save 28%
Save 31% Save 28%
Study of Kansas Interstates Perpetual Pavements vs. Concrete
~50%
User Costs – Consider Additional Emissions from Vehicles
0
500,000
1,000,000
1,500,000
Rubblize & Overlay Remove/Replace PCC
$ p
er M
ile
Thin Overlay Economics
16-Dec-11
4
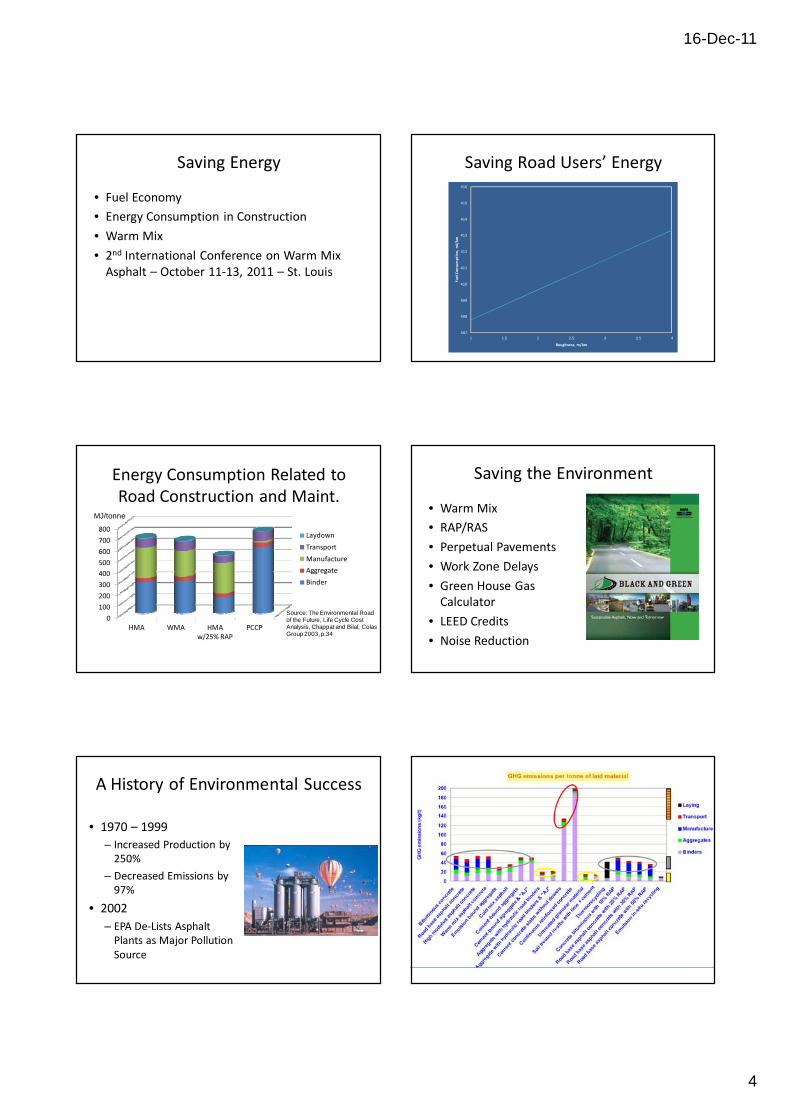
Saving Energy
• Fuel Economy
• Energy Consumption in Construction
• Warm Mix
• 2nd International Conference on Warm Mix Asphalt – October 11‐13, 2011 – St. Louis
Saving Road Users’ Energy
407
408
409
410
411
412
413
414
415
416
1 1.5 2 2.5 3 3.5 4
Fuel Consumption, ml/km
Roughness, m/km
Energy Consumption Related to Road Construction and Maint.
0
100
200
300
400
500
600
700
800
HMA WMA HMA w/25% RAP
PCCP
Laydown
Transport
Manufacture
Aggregate
Binder
MJ/tonne
Source: The Environmental Road of the Future, Life Cycle Cost Analysis, Chappat and Bilal, Colas Group 2003, p.34
Saving the Environment
• Warm Mix
• RAP/RAS
• Perpetual Pavements
• Work Zone Delays
• Green House Gas Calculator
• LEED Credits
• Noise Reduction
A History of Environmental Success
• 1970 – 1999
– Increased Production by 250%
– Decreased Emissions by 97%
• 2002
– EPA De‐Lists Asphalt Plants as Major Pollution Source

16-Dec-11
5
Green Rating Systems
• LEED
• IN‐VEST – Infrastructure Voluntary Evaluation Sustainability Tool
• Green Roads
NCAT Study of 244 Pavements
889092949698
100102104
So
un
d L
ev
el,
dB
(A)
Fine
OGFC
SMA
Dense H
MA
Coarse
OGFC
Diam
ond Gnd
.
Long. T
ined
Long. G
roove
d
Trans.
Tin
ed
HMA PCC
Summary
• This Industry has a great story to tell.
• Innovation = Flexibility
• Flexibility = Wider Applications
• Economics for contractors and owners
• Energy conservation for contractors and road users
• Environmental benefits for everyone.

16‐Dec‐11
1
AAPA’s 14th International Flexible Pavements Conference
Sydney25–28 September 2011
Topic: Asphalt Pavement Solutions – For Life
Implementation project update
PRESENTER: Ian RickardsPosition: ConsultantOrganisation: AAPA
ASPHALT PAVEMENT SOLUTIONS –FOR LIFE (APS-FL) PRESENTATION
• LLAP background and motivation
• Project methodology and deliverables– National asphalt characterisation project
– CIRCLY LLAP software development
– Calibration studies
• Project current status
APS-FL Project background and motivation APS-FL Project background and motivation
APS-FL Project background and motivation APS-FL Project background and motivation

16‐Dec‐11
2
APS-FL Project background and motivation
M65
M6
M62M18
M56
M1
M58
M53
M6
M54
M42
M69
M6
M5 M45M11
M1
M25
M2
M20M23
M3
M40
M27
M4
M50
M5
M62
M61
M55
05
25
06
0104 11
07
09
26
22
08
18
2932/33
19/34
30/31
17
27
02
03
20
2423
16
21
15
13
35
10
14
A1A65
A6
A46
A49
A64
A16
A17
A50A5
A49
A40
A303
A35A31
A34
A12
A23A3
A259
A6
A1(M) A10
A47
A11
A43
Leeds
ManchesterLiverpool
StokeDerby
Shrewsbury
BirminghamCoventry
Norwich
Leicester
Scarborough
York
Sheffield
Hull
Gloucester
CardiffBristol
Banbury
Oxford
Reading
ExeterSo'ton
Brighton
Dover
LONDON
IpswichCambridge
12
41
46A14
A38
40
A24943
A2144
45A27
A30
42
39
28 Fully flexible sites monitored
FWD - D1-D4 Against Traffic
0.0
20.0
40.0
60.0
80.0
100.0
120.0
140.0
160.0
180.0
0 10 20 30 40 50 60 70 80 90Traffic / MSA
FW
D -
D1-D
4 /
mic
rons_
APS-FL Project background and motivation
APS-FL Project background and motivation European asphalt thickness design 100MSA
0
50
100
150
200
250
300
350
Fig 3.2 Asphalt thickness design for 100 MSA80 design trafficFEHRL Report 2004/01
APS-FL Project background and motivation
0
50
100
150
200
250
300
350
400
450
500
1 10 100 1000
Design Life (msa)
To
tal
Asp
hal
t T
hic
knes
s (
mm
) 80 msa
GRADE 1
GRADE 3
GRADE 6
GRADE 9
UK Highways Agency design chart
Interpretation: if pavement survives 80MSA it is above the threshold
thickness for a “Long Life Pavement”
APS-FL Project background and motivation
No Damage Accumulation
Log N
Log
ThresholdStrain
E1
E2
E3
D1
D2
D3
P
A
t
v
ASPHALT FATIGUE ENDURANCE LIMIT CONCEPT

16‐Dec‐11
3
CORRELATION OF STRAIN DISTRIBUTION AND PERFORMACNE
APS-FL Project background and motivation
0%
10%
20%
30%
40%
50%
60%
70%
80%
90%
100%
0 200 400 600 800 1000 1200
Microstrain
Per
centile
N1 2003N2 2003N3 2003N4 2003
N5 2003N6 2003N7 2003N1 2006N2 2006
N3 2006N4 2006N8 2006N9 2006N10 2006
S11 2006S13 2000
FatigueNo Fatigue
APS-FL Project background and motivation
Design Traffic
Asphalt CharacterisationDesign Modulus
(@wMAPT and traffic speed)
Asphalt CharacterisationDynamic Modulus (Spectrum
of temperature & traffic speeds)
Calculate critical strain using CIRCLY
Calculate cumulative strain distribution using CIRCLY
Select trial asphalt thickness for analysis
Select trial asphalt thickness for analysis
Examine performance using Shell fatigue criterion
Confirm conformance using LTPP & NCAT field test data
Refine design
thickness
Refine design
thickness
CURRENT AUSTROADS DESIGN METHOD
PROPOSED ASP-FL DESIGN METHOD
APS-FL Project background and motivation
SPT TEST - OUTPUT DATA DYNAMIC MODULUS E*
0 90 180 270 360
SINUSOIDAL LOAD CYCLE (1 CYCLE)
ST
RE
SS
& S
TR
AIN
Stress
Strain
Phase angle
Phase angle 0o Elastic
Phase angle = 90o Viscous
ASPHALT MATERIALS PERFORMANCE TESTER (AMPT)
Dynamic modulus master curve
APS-FL Project background and motivation APS-FL Project background and motivation
Design Traffic
Asphalt CharacterisationDesign Modulus
(@wMAPT and traffic speed)
Characterise asphalt E*Dynamic Modulus (Spectrum
of temperature & traffic speeds)
Calculate critical strain using CIRCLY
Calculate cumulative strain distribution using CIRCLY
Select trial asphalt thickness for analysis
Select trial asphalt thickness for analysis
Examine performance using Shell fatigue criterion
Confirm conformance using LTPP & NCAT field test data
Refine design
thickness
Refine design
thickness
CURRENT AUSTROADS DESIGN METHOD
PROPOSED ASP-FL DESIGN METHOD

16‐Dec‐11
4
APS-FL Project background and motivation APS-FL Project background and motivation
APS-FL Project background and motivation APS-FL Project background and motivation
• NCAT measure the fluctuation in asphalt stiffness and strain as a function of load & temperature spectrum
• Conclusion: limiting the cumulative distribution of asphalt strain will provide a rational design criterion
• Thus we need to model asphalt stiffness over the temperature spectrum in design analyses
• This process will enable us to calibrate the LLAP design limits by analysis of LTPP sites
APS-FL national asphalt characterisation study
Objectives
• Determine range of E* v temperature and load duration of typical Australian mixes
• Determine range of G* v temperature and load frequency of typical Australian bitumen
• Calibrate predictive models e.g. Hirsch
• Once calibrated can be used in the absence of laboratory data
APS-FL national asphalt characterisation study
• Replicate testing in overseas laboratory to calibrate our sampling and testing methods
• Correlation will ensure a sound basis for performance comparison with overseas mixes
• Will facilitate access to LTPP data i.e. similar laboratory performance implies similar field performance
• Peer review of APS-FL project and research plan; workshops with overseas experts

16‐Dec‐11
5
Long life pavement design software and manual
• Define software methodology; prepare project brief and obtain cost estimates
• Beta version; temperature spectrum single layer; outputs cumulative distribution of strain
• Refinement; modeling multi layer structure; output strain distribution cumulative damage
• Final version; includes iterative loop to yield required thickness to satisfy design criterion
Long life pavement design software and manual
0
2000
4000
6000
8000
10000
12000
14000
16000
18000
20000
0
10
20
30
40
50
60
70
80
90
100
0 10 20 30 40 50 60
Dynamic modulus MPaDistribution
Pavement temperature C
TRAFFIC, PAVEMENT TEMPERATURE & ASPHALT STIFFNESS DISTRIBUTION
Melbourne 100mm
Canberra 100mm
Asphalt stiffness
Long life pavement design software and manual
0
10
20
30
40
50
60
70
80
90
100
0 100 200 300 400
Cummulative distribution %
Tensile strain bottom of asphalt
CUMULATIVE ASPHALT STRAIN DISTRIBUTION RELATIVE TO CLIMATE 300mm ASPHALT ON STANDARD FOUNDATION
Melbourne
Canberra
Sydney
Darwin
NCAT tentative limit
UK
Fra
• Identify and select LLAP sites i.e. deflections reducing over the long term
• Obtain pavement composition, temperature / traffic distribution data from long life LTPP sites
• Obtain component asphalt materials master curve data (if possible)
• Run deflection back-analyses to estimate E* at test temperature and calculate asphalt strain
• Analyses of deflections taken over a range of temperatures will enable the calculation of the cumulative distribution of asphalt strain
Calibration of the limiting cumulative distribution of strain
• In all pavement thickness design a number of assumptions and relationships are applied
• In the calibration exercise if the same assumptions and relationships are used, the limiting cumulative distribution of strain so derived accrues the effects of all the variables.
Calibration of the limiting cumulative distribution of strain

16‐Dec‐11
6
• US proposal to incorporate healing into design process beyond our resources
• Control the durability of the bottom asphalt layer by the specification of the binder ‘richness modulus’ and other benchmark conditions
• The APS-FL manual will dictate high standards of construction quality; this will more than compensate for minor inaccuracy in modelling
Long life pavement design software and manualAPS-FL information dissemination & training
program
• Staged technical reports of findings in condensed / practitioner format
• Long Life pavement design and construction manual prepared by AAPA
• National roadshow to disseminate project outcomes and train practitioners in implementation
• Austroads guidelines for the design and construction of long life asphalt pavements
APS-FL CURRENT STATUS
• The project team is in place and guidelines framed with input from key stakeholders
• The national asphalt characterisation project has been scoped, approved and samples sought
• The long life pavement design software has been scoped and costed
• Information dissemination is ongoing and peer review is programmed
AAPA’s 14th International Flexible Pavements Conference
Sydney25–28 September 2011
Topic: Asphalt Pavement Solutions – For Life
Implementation project update
PRESENTER: Ian RickardsPosition: ConsultantOrganisation: AAPA

16-Dec-11
1
What is a Perpetual Pavement?
• No deep structural distress
Limit Cracking to top-down
Goal of Perpetual Pavement Design• Design so there are no deep structural distresses
– Bottom up fatigue cracking– Structural rutting
• All distresses can be quickly remedied from surface• Result in a structure with ‘Perpetual’ or ‘Long Life’
Do Perpetual Pavements Exist?
• Perpetual Pavements are NOT a new concept
– Full-depth
– Mill and inlay
– Deep strength
• Perpetual Pavement Award– 35+ years
– No structural failures
– 13+ year rehab interval

16-Dec-11
2
Designing Perpetual Pavements
Newcomb, 2001
M-E Perpetual Pavement Design
No Damage Accumulation
Log N
Log
ThresholdStrain
E1
E2
E3
D1
D2
D3
P
A
t
v
Normal Fatigue Testing Results VersusEndurance Limit Testing
0
200
400
600
800
1000
1200
1000 100000 10000000 1.1E+08
Number of Loads to Failure
Stra
in, (
10E
-06)
Endurance Limit
Normal Range forFatigue Testing
0
200
400
600
800
1000
1200
1000 100000 10000000 1.1E+08
Number of Loads to Failure
Stra
in, (
10E
-06)
Endurance Limit
0
200
400
600
800
1000
1200
1000 100000 10000000 1.1E+08
Number of Loads to Failure
Stra
in, (
10E
-06)
Endurance Limit
Normal Range forFatigue Testing
What is the Endurance Limit for HMA?
• 1972 – Monismith estimates about 70 • 2001 – I-710 designed at 70 • 2002 – 70 used by APA• 2007 – NCHRP 9-38 Lab Study
– 100 for unmod binders– 250 for mod binders– More severe than field
• 2007 – MEPDG uses 100 to 250 • 2008 – Field measurements show higher
strains
N8 and N9
2.3 2.0
2.9 3.5
2.8 3.1
1.92.6
3.26.4
8.4
0.0
5.0
10.0
15.0
20.0
25.0
N8 N9Section
De
pth
Fro
m P
ave
me
nt S
urf
ac
e, i
n.
Lift 1
Lift 2
Lift 3
Lift 4
Lift 1
Lift 2
Lift 3
Lift 4
Lift 5
Aggregate Base(Track Fill)
Subgrade(A-7-6 Soil)
Rich Bottom LayerPG 64-22
Dense Graded HMAPG 64-22
Dense Graded HMAPG 76-28
SMAPG 76-28
Moisture Content = 10.8%Unit Weight = 133.4 pcf
Moisture Content = 12.9%Unit Weight = 133.8 pcf
Moisture Content = 18.0%Unit Weight = 126.2 pcf
Moisture Content = 17.2%Unit Weight = 126.9 pcf
250 mm 350 mm

16-Dec-11
3
Strain Measurements Strain and Temperature
0
200
400
600
800
1000
1200
01
-No
v-0
6
31
-De
c-0
6
01
-Ma
r-0
7
30
-Ap
r-0
7
29
-Ju
n-0
7
28
-Au
g-0
7
27
-Oct
-07
26
-De
c-0
7
24
-Fe
b-0
8
24
-Ap
r-0
8
Date
Lo
ng
itud
ina
l Mic
rost
rain
-Sin
gle
Axl
e
0
20
40
60
80
100
120
Mid
-De
pth
Pa
vem
en
t Te
mp
era
ture
,F
N8-Strain
N9-Strain
N8-Temperature
N9-Temperature
Strain vs. Temperature
N8 Strain = 21.249e0.033*Temp
R2 = 0.9584
N9 Strain = 11.136e0.0293*Temp
R2 = 0.9309
0
200
400
600
800
1000
1200
0 20 40 60 80 100 120 140
Mid-Depth Pavement Temperature, F
Lo
ng
itu
din
al M
icro
str
ain
-Sin
gle
Axl
e
Section Axle Type C1 C2 R2
Single 21.249 0.033 0.96Tandem 15.326 0.035 0.96
Steer 11.341 0.036 0.87Single 11.136 0.029 0.93
Tandem 8.600 0.030 0.92Steer 5.901 0.030 0.93
N8
N9
Strain Distributions
0%
10%
20%
30%
40%
50%
60%
70%
80%
90%
100%
0 100 200 300 400 500 600 700 800 900 1000 1100 1200
Longitudinal Strain
Pe
rce
ntile
N9 N8
End Result NCAT Test Track Results
0%
10%
20%
30%
40%
50%
60%
70%
80%
90%
100%
0 200 400 600 800 1000 1200
Microstrain
Pe
rce
nti
le
N1 2003N2 2003N3 2003N4 2003N5 2003N6 2003N7 2003N1 2006N2 2006N3 2006N4 2006N8 2006N9 2006N10 2006S11 2006S13 2000
FatigueNo Fatigue

16-Dec-11
4
2003 Test Sections
0.0
0.5
1.0
1.5
2.0
2.5
3.0
3.5
4.0
4.5
N1 2003 N2 2003 N3 2003 N4 2003 N5 2003 N6 2003 N7 2003
Section
Fat
igu
e R
ati
o
Fatigue Cracking Occurred
Fatigue Cracking AbsentMax Ratio = 2.11
2006 Test Sections
0
1
2
3
4
5
6
N1 2006 N2 2006 N3 2006 N4 2006 N8 2006 N9 2006 N10 2006 S11 2006
Section
Fat
igue
Rat
io
Fatigue Cracking Occurred
Fatigue Cracking AbsentMax. Ratio = 2.18
Probabilistic Design – Monte Carlo Simulation
Thickness
f
Material Properties
f
Axle Weight
f
MonteCarlo
RandomSampling
MechanisticModel
Pavement Response
f % Below Threshold
% Above Threshold
% Below Threshold
• Design should have high % below threshold
Pavement Response
f% Below Threshold
How much ‘damage’ does this
area correspond to?
‘Damage Computation’• For responses exceeding threshold, compute N
using transfer function– User defined
• Calculate damage accumulation rate– Damage / Maxles
Pavement Response
f% Below Threshold
DamageMillion Axles
Estimated Long Life
• Convert damage rate into an estimated time– Use traffic volume and growth
– Calculate when damage = 0.1

16-Dec-11
5
PerRoad 3.5• Sponsored by APA
• Developed at Auburn University / NCAT
• M-E Perpetual Pavement Design and Analysis Tool
Thickness
f
Material Properties
f
Performance Criteria
Traffic Volume
Types of Axles
Functional Classification
16-Dec-11
6
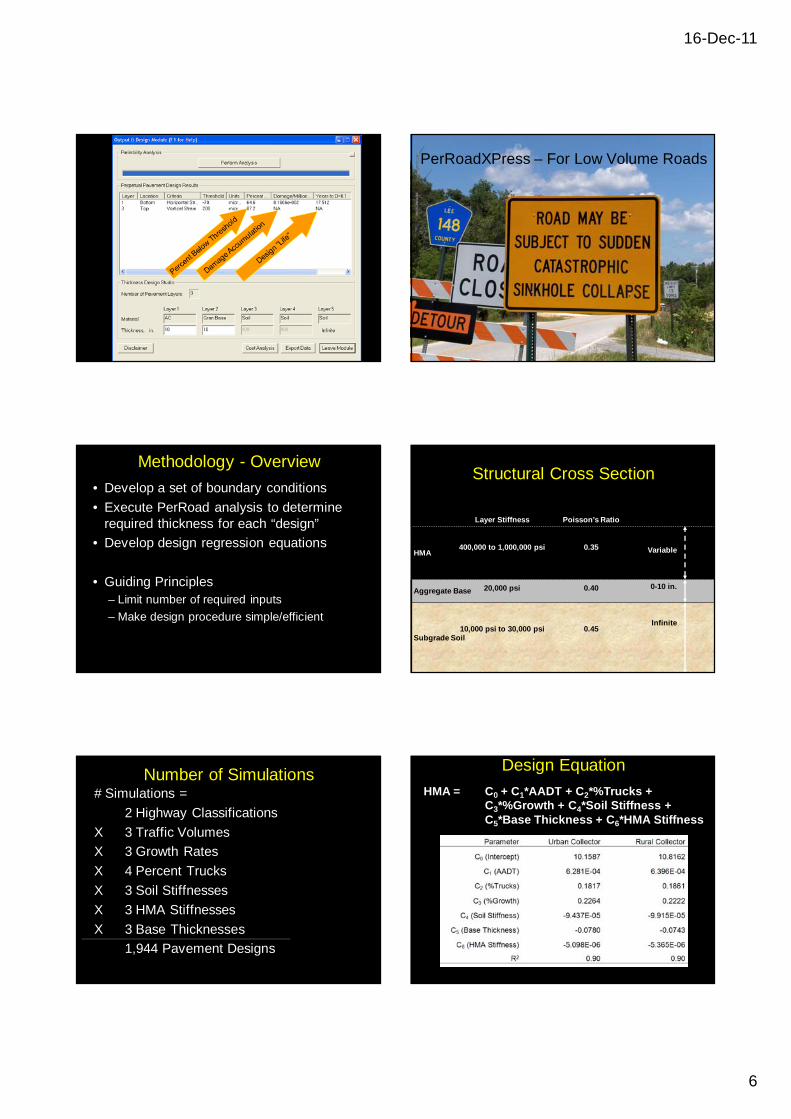
PerRoadXPress – For Low Volume Roads
Methodology - Overview
• Develop a set of boundary conditions
• Execute PerRoad analysis to determine required thickness for each “design”
• Develop design regression equations
• Guiding Principles– Limit number of required inputs
– Make design procedure simple/efficient
Structural Cross Section
Subgrade Soil
Aggregate Base
HMA Variable
0-10 in.
Infinite
Layer Stiffness
400,000 to 1,000,000 psi
20,000 psi
10,000 psi to 30,000 psi
Poisson’s Ratio
0.35
0.40
0.45
Number of Simulations# Simulations =
2 Highway Classifications
X 3 Traffic Volumes
X 3 Growth Rates
X 4 Percent Trucks
X 3 Soil Stiffnesses
X 3 HMA Stiffnesses
X 3 Base Thicknesses
1,944 Pavement Designs
Design Equation
HMA = C0 + C1*AADT + C2*%Trucks + C3*%Growth + C4*Soil Stiffness + C5*Base Thickness + C6*HMA Stiffness

16-Dec-11
7
PerRoadXPress
Traffic
SoilAgg. Base
HMA
http://www.eng.auburn.edu/users/timmdav/Software.html

16‐Dec‐11
1
AAPA’s 14th International Flexible Pavements Conference
Sydney25–28 September 2011
Matching Accelerated Pavement TestingMatching Accelerated Pavement Testingto Pavement Design and Performanceto Pavement Design and Performance
Dr. R. Buzz Powell, P.E.Assistant Director & Test Track Manager
National Center for Asphalt Technology at Auburn University USA 2
APT – Not Just Another New Thing• 1912 UK Road Machine
• 1922 Bates Experimental Road
• 1952 WASHO then AASHO (1956) Road Tests
• 1967 Washington State University Track
• 1970 South African HVS
• 1973 Danish Road Testing Machine
• 1984 Australian ALF
• 1989 New Zealand CAPTIF
• 1994 MnRoad
• 1996 WesTrack
• 2000 NCAT Pavement Test Track
• 2002 University of Waterloo CPATT
3
UK Road Machine1912
4
Australian ALF1984
NCAT Pavement Test Track2000
5
Relating APTTrack to APTHVS
6

16‐Dec‐11
2
Relating APTTrack to APTHVS
7 8
Relating APT to Infrastructure
• APT rutting relates well to infrastructure rutting
• Speed, age, and temperature can be problematic
• Laboratory master curves may improve modeling
• Loaded wheel testers still being used by many
• Cracking and durability are greater challenge
• Crack initiation and propagation are the key
Roughness vs Traffic (Weak Subgrade)
0
25
50
75
100
125
150
175
200
0 1,000,000 2,000,000 3,000,000 4,000,000 5,000,000 6,000,000 7,000,000 8,000,000 9,000,000 10,000,000
IRI (
inch
es p
er m
ile)
ESALs
N8 N9
9
250 mm 350 mm
Roughness Increased at 6.8M ESALs
0
25
50
75
100
125
150
175
200
0 1,000,000 2,000,000 3,000,000 4,000,000 5,000,000 6,000,000 7,000,000 8,000,000 9,000,000 10,000,000
IRI (
inch
es p
er m
ile)
ESALs
N8 N9
10
250 mm 350 mm
Cracking First Mapped at 8.3M ESALs
0
25
50
75
100
125
150
175
200
0 1,000,000 2,000,000 3,000,000 4,000,000 5,000,000 6,000,000 7,000,000 8,000,000 9,000,000 10,000,000
IRI (
inch
es p
er m
ile)
ESALs
N8 N9
11
250 mm 350 mm
122/19/09
High‐Speed Strain Response
-400
-300
-200
-100
0
100
200
300
400
0 0.2 0.4 0.6 0.8 1 1.2 1.4 1.6 1.8 2
Time, sec
Lo
ng
itu
din
al
Mic
ros
tra
in
ALL ALC ALR

16‐Dec‐11
3
Effect of Pavement Thickness
N8 Strain = 21.487e0.0335*Temperature
R2 = 0.96
N9 Strain = 11.496e0.0298*Temperature
R2 = 0.9217
0
200
400
600
800
1000
1200
1400
0 20 40 60 80 100 120 140
Mid-Depth Temperature, F
Te
nsi
le M
icro
stra
in
N8 N9
13
250 mm
350 mm
Effect of Pavement Thickness
N8 Strain = 21.487e0.0335*Temperature
R2 = 0.96
N9 Strain = 11.496e0.0298*Temperature
R2 = 0.9217
0
200
400
600
800
1000
1200
1400
0 20 40 60 80 100 120 140
Mid-Depth Temperature, F
Te
nsi
le M
icro
stra
in
N8 N9
14
250 mm
350 mm
15
Strain Distributions on NCAT Track
16
Strain Distributions on NCAT Track
250 mm350 mm
17
Strain Distributions on NCAT Track
225 mm225 mm
Implementation Example
18
•• 600 mm600 mm perpetual (original) Track foundationperpetual (original) Track foundation
• Two 225 mm thick structural sections built in 2003
• 225 mm sections were found to be perpetual (LLAP)
• Design layer coefficient increased from 0.44 to 0.54
• Saving $25‐$50 million annually in Alabama alone
16‐Dec‐11
4
19
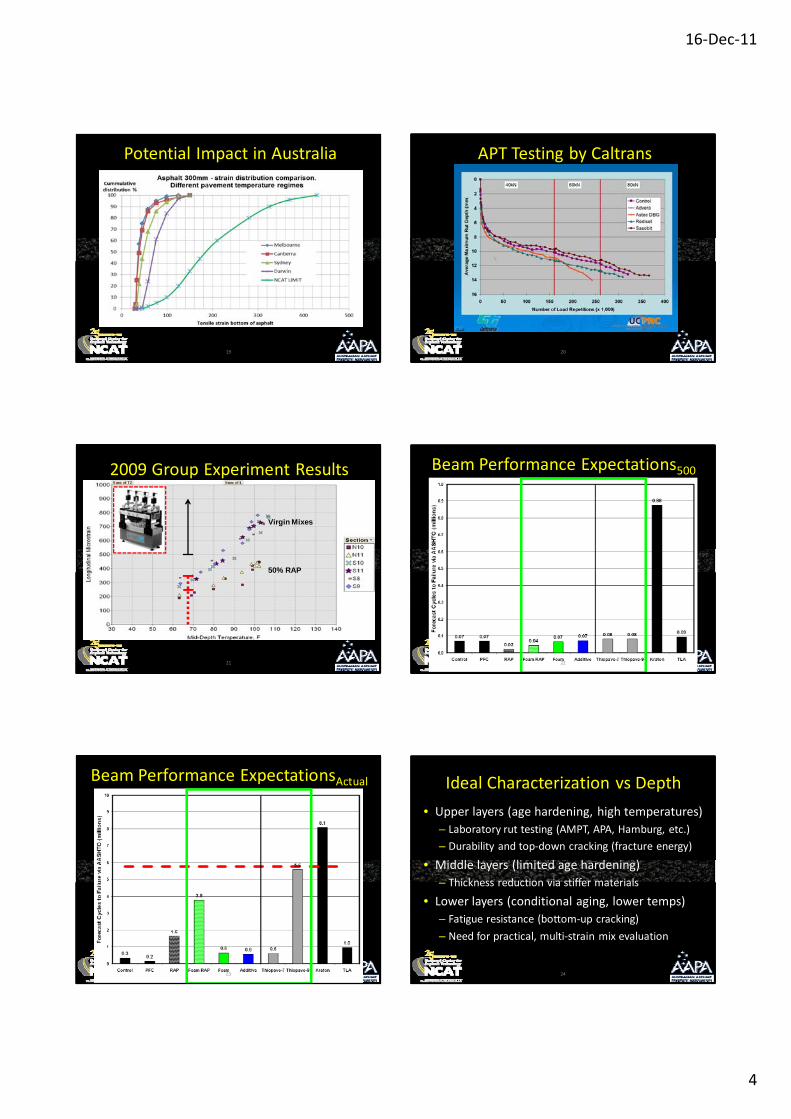
Potential Impact in Australia
20
APT Testing by Caltrans
21
2009 Group Experiment Results
50% RAP
Virgin Mixes
22
Beam Performance Expectations500
23
Beam Performance ExpectationsActual
24
Ideal Characterization vs Depth
• Upper layers (age hardening, high temperatures)
– Laboratory rut testing (AMPT, APA, Hamburg, etc.)
– Durability and top‐down cracking (fracture energy)
• Middle layers (limited age hardening)
– Thickness reduction via stiffer materials
• Lower layers (conditional aging, lower temps)
– Fatigue resistance (bottom‐up cracking)
– Need for practical, multi‐strain mix evaluation

16‐Dec‐11
5
25
Long Life Asphalt Pavement Design
• Laboratory mix characterization
• Determination of design parameters
• Pavement response predictions
• Construction of strain distribution
• Confidence via comparison to APT limit
26
Questions ?

1
Accelerated loading test results of two NCAT sections with highly modified asphalt
Erik J. Scholten – Kraton Innovation Center AmsterdamDavid H. Timm – Auburn UniversityJ. Richard Willis – Auburn UniversityR. Buzz Powell - National Center for Asphalt TechnologyRobert Q. Kluttz – Kraton Innovation Center HoustonWillem C. Vonk – Kraton Innovation Center Amsterdam
14th International Flexible Pavements ConferenceSydney, Australia25-28 September 2011
Introduction
Concept of highly modified asphalt
Two high SBS sections in monitored field trials at NCAT, USA
Rutting data comparison section N7 APA and AMPT data Finite Element Modelling and actual rut depths at NCAT
Successful rehabilitation of failed pavement on weak subgrade
Summary / conclusions
Concept of Highly Modified Asphalt (HiMA)
7.5% SBS – Continuous polymer rich phase
2.5% SBS - Continuous asphaltenerich phase
Polymerrich
Before mixing After mixing
5 % SBS - Co-continuous asphalteneand polymer rich phases
Asphaltenerich
TU Delft, standard base course mix with 4.6% binder. Full sine loading in 4 point bending
(20°C, 8 Hz)
Making it possible with current equipment
Challenges:
Hard base bitumens (40-60 pen, C320, C600)
High SBS content
Storage stability
Issues solved by adapting design of the polymer
Kraton D0243
Provides a low viscosity, even in hard bitumens at elevated SBS content
Provides compatibility
Provides storage stable PMBs with most base bitumens
Opportunities with highly modified asphalt (HiMA)
1. Base/binder course layer thickness reductionLife cycle impact reductionUp front Cost Savings and eco impact
2. Perpetual pavement at standard thicknessHigh modulus, fatigue resistant, full depth asphalt pavements
3. Reinforced binder/wearing course for pavement rehabilitationBetter performance without making pavement thicker
Kraton™ Polymers’ new SBS grade D0243 enables high SBS content with current equipment
National Center for Asphalt Technology (NCAT)
ObjectiveEvaluate in situ structural characteristics of highly modified asphalt pavement relative to reference section
Two sections1. Full depth highly modified asphalt (N7) 7.5% SBS in all layers 20% reduced pavement thickness
2. Highly modified overlay (N8) 14.5 cm inlay over cracked pavement
3 year cycle of construction and testing
Unique opportunity to evaluate structural responses against wide range of materials and pavement structures

2
Update section N7
Rutting:
S9 (control) = 5.9 mm
N7 (HiMA) = 1.3 mm
No cracking in either section
Previous experience with thin sections led to fatigue failure within one year
Test Track SoilMr = 200 Mpa = 0.45
Dense Graded Crushed Aggregate BaseMr = 85 MPa = 0.40
150mm
76mm (PG 67-22; 19mm NMAS; 80 Gyrations)
70mm (PG 76-22; 19mm NMAS; 80 Gyrations)
32mm (PG 76-22; 9.5mm NMAS; 80 Gyrations)
Control (178mm HMA)
57mm (7.5% polymer;19mm NMAS; 80 Gyrations)
57mm (7.5% polymer;19mm NMAS; 80 Gyrations)
32mm (7.5% polymer, 9.5 mm NMAS)
Experimental (145mm HMA)
Courtesy Prof. David Timm, Auburn U.
Lift thicknesses limited by 3:1 thickness:NMAS requirement
Rutting comparison mixtures section N7
Asphalt Pavement Analyzer (APA) – AASHTO TP63-09 Test temperature 64°C
8000 cycles
Asphalt Mixture Performance Tester (AMPT) Test temperature 59.5°C Flow number as rutting indicator
(no. of cycles at 10% axial strain)
MixtureAverage Rut Depth, mm StDev, mm
Rate of SecondaryRutting, mm/1000
cyclesControl – Surface 3.07 0.58 0.140
Control – Base 4.15 1.33 0.116HiMA – Surface 0.62 0.32 0.0267
HiMA – Base 0.86 0.20 0.0280
1
10
100
1000
10000
Control Surface
Control Base
HPM Surface
HPM Base
Flow
Number, cycles
Rutting comparison mixtures section N7
Rutting predictions with APA and AMPT provide same relative result
HiMA mixes provide significant improvement in rutting resistance
y = 46.729x‐0.532
R² = 0.9289
0.1
1
10
1 10 100 1000 10000
APA
Rut Depth, mm
Flow Number, cycles
Measured rut depths versus Finite Element Model
Relative rutting in actual NCAT sections very similar to rutting in modelled pavements at TU Delft
4.5 - 5x less rutting in high SBS pavements
TU Delft
Conventional design for N7 using stiffness data
Conventional modelling indicates highly modified pavements have more rutting due to reduced stiffness……….test results show the opposite
0%
10%
20%
30%
40%
50%
60%
70%
80%
90%
100%
Control (7") Kraton (5.75") Kraton (7")
Cross-Section
Fat
igue
Cra
ckin
g, %
of L
ane
Are
a
0
0.1
0.2
0.3
0.4
0.5
0.6
0.7
0.8
0.9
Rut
Dep
th, i
n.
Fatigue
Rutting
Design calculations
Sub grade50 MPa
Sub base100 MPa
Asphalt layer
125 mm
Shell Pavement Design Manual
Melbourne climate
10 million ESALs
Standard asphalt mix:
Stiffness at 20°C – 8 Hz: 8900 MPa
Fatigue equation:
36.31110.6 xN
Polymer modified mix:
Stiffness at 20°C – 8 Hz: 8100 MPa
Fatigue equation:
17.61810.9 xN
What difference does fatigue make for the design?

3
The importance of taking into account fatigue
Fatigue line HiMA included;
HiMA asphalt allows 29% thickness reduction despite slightly lower stiffness
Sub grade50 MPa
Sub base100 MPa
272 mmstandardAsphalt
-29%
194 mmHiMA
Asphalt
Sub grade50 MPa
Sub base100 MPa
Fatigue line unmodified asphalt applied for both mixes:
HiMA pavement would be thicker due to lower stiffness
Sub grade50 MPa
Sub base100 MPa
272 mmstandardAsphalt
+4.5%
285 mmHiMA
Asphalt
Sub grade50 MPa
Sub base100 MPaMaterial properties
not fully taken intoaccount
Rehabilitation of failed pavement with high SBS mix
2006 Perpetual design study Oklahoma DoT at NCAT
Soft subgrade with stiff top 8 inches (lime stabilization)
0
2
4
6
8
10
12
14
16
18
20
Original Construction Conventional Rehabilitation HPM Rehabilitation
Dep
th from Surface of Pavemen
t, in.
Subgrade
Stiff
Soil
Base
Stiff
Soil
Base
Stiff
Soil
Base
Rich AC Rich AC Rich AC
Original
Dense
Original
Dense
Original
DenseOriginal
Dense
Rehab
Dense
Rehab
SMAOriginal
SMA
HPM
HPM
Rich
Paving
Fabric
Depth of
Mill & Inlay
Depth of
Mill & Inlay
Subgrade Subgrade
Subgrade
Pressure
Gauge
Base
Pressure
Gauge
Asphalt
Strain
Gauges
2006 2009 2010
Original construction severely distressed after 10 million ESALs
Rehab with paving fabric failed after 4.0 million ESALs
Rehab with paving fabric after 4.0 million ESALs
10” pavementpaved summer 20065” rehabilitationpaved August 200910 months old
High SBS modified mill & inlay after 4.2 million ESALs
10” pavementpaved summer 20065” rehabilitationpaved August 20095 ½” HiMA rehabpaved August 201010 months old
Concluding remarks
Full depth high SBS modified section N7 at NCAT shows continued good rutting results
Asphalt Pavement Analyzer and Asphalt Mixture Performance Tester predict same relative rutting differences between reference and high SBS mixes
Actual rutting data matches predicted rutting performance based on Finite Element Modelling from TU Delft
Excellent rutting performance could not be predicted with traditional pavement design models Need for better models!
High SBS modified mill and inlay shows no damage after 4.2 million ESALs whilst previous rehab failed;
new cost effective overlay solution for cracked pavement
Concluding remarks
NCAT section N7 has no cracking until date despite 20% thickness reduction
Lab testing confirms superior performance of high SBS mixes to prevent rutting and cracking
Thinner, more cost effective asphalt pavements are possible now without jeopardizing performance

4
19
We believe the information set forth above to be true and accurate, but any findings, recommendations or suggestions that may be made in the foregoing text are without any warranty or guarantee whatsoever, and shall establish no legal duty or responsibility on the part of the authors or any Kraton Polymers entity. Furthermore, nothing set forth above shall be construed as a recommendation to use any product in conflict with any existing patent rights. All Kraton Polymers entities expressly disclaim any and all liability for any damages or injuries arising out of any activities relating in any way to this publication or the information set forth herein.
©2011 Kraton Performance Polymers, Inc. All rights reserved.
Publication Disclaimer:
Kraton, the Kraton logo and design, Cariflex and Nexar are trademarks of Kraton Performance Polymers, Inc. Giving Innovators Their Edge is a service mark of Kraton Performance Polymers, Inc.

AAPA 2011 Pre‐CAPSA’11 Study Tour of South AfricaTopic
Page 1
AAPA 2011 Pre-CAPSA’11 Study Tour – Feedback SARG 2011-10-05
Feedback from theAAPA 2011
Study Tour
AAPA 2011 Pre-CAPSA’11 Study Tour – Feedback SARG 2011-10-05 www.aapa.asn.au
AAPA 2011 Pre-CAPSA’11 Study Tour – Feedback SARG 2011-10-05 www.aapa.asn.au AAPA 2011 Pre-CAPSA’11 Study Tour – Feedback SARG 2011-10-05
• 3rd to 19th September 2011
• Tour group 9 Australian roads people
o Researchers / State & LG Road Officials / Consultants
o Industry representatives / Asphalt suppliers
o Wide range of experience
o Skilled including professional engineers & technologists
• Five legs
o Cape Town / Pretoria / Durban / CAPSA’11 / KNP
• Four key issues www.aapa.asn.au
AAPA 2011 Pre-CAPSA’11 Study Tour – Feedback SARG 2011-10-05
Travel routeTravel route
www.aapa.asn.au
+11 hours flying to Sydney
AAPA 2011 Pre-CAPSA’11 Study Tour – Feedback SARG 2011-10-05
A. Surface Treatmentso Sprayed seals | Slurry seals | Surface rejuvenation
B. Binderso use of bitumen rubber in sprayed seals and asphalt wearing courses,
availability and specification requirements including quality control measure to ensure compliance.
C. Improving pavement performanceo modelling, accelerated testing, design methods & models, foam bitumen
stabilisation and bitumen treated base experience and transfer of high modulus asphalt technology to RSA
D. Sustainabilityo recycling, warm mix asphalt, efforts to reduce carbon footprint, carbon
calculators and impacts for road asset management
www.aapa.asn.au

AAPA 2011 Pre‐CAPSA’11 Study Tour of South AfricaTopic
Page 2
AAPA 2011 Pre-CAPSA’11 Study Tour – Feedback SARG 2011-10-05
ProcessProcess• Visited research centres, state road authorities, municipal government, CAPSA conference, contractors, site & road inspections
• Presentations at Society for Asphalt Technology
• Provided detailed questions ahead of visit – answers provided and will be in report
• Contacts established and directions provided to participants on specific topics
www.aapa.asn.au AAPA 2011 Pre-CAPSA’11 Study Tour – Feedback SARG 2011-10-05
Immediate outcomes for QldImmediate outcomes for Qld1. Bitumen contents of foam stabilised basecourse
2. Emulsion & Polymer Modified Emulsion
3. Higher traffic loads on sprayed surface seals
4. Use of 20% rubber crumb in field blended CRB
5. Accelerated pavement test results in design
6. Warm Mix Asphalt and high % RAP used
7. Heavy duty pavement structures with HiMA
8. Use of higher standard granular basecourse G1
9. Southern Hemisphere Sprayed Seal Alliance
www.aapa.asn.au
AAPA 2011 Pre-CAPSA’11 Study Tour – Feedback SARG 2011-10-05
Reducing bitumen in foamed basesReducing bitumen in foamed bases
www.aapa.asn.au AAPA 2011 Pre-CAPSA’11 Study Tour – Feedback SARG 2011-10-05
Opportunity for Queensland TMR to explore
• Queensland normally working on 3 ½% binder in foam bitumen.
• South Africa have reduced to 2 ½% based on research.
• Can Queensland follow?
• Substantial potential saving, given the high proportionate cost of binder in foam bitumen stabilisation.
AAPA 2011 Pre-CAPSA’11 Study Tour – Feedback SARG 2011-10-05 AAPA 2011 Pre-CAPSA’11 Study Tour – Feedback SARG 2011-10-05 www.aapa.asn.au
RAP for ColdRAP for Cold‐‐InplantInplant RecyclingRecycling

AAPA 2011 Pre‐CAPSA’11 Study Tour of South AfricaTopic
Page 3
AAPA 2011 Pre-CAPSA’11 Study Tour – Feedback SARG 2011-10-05
Increased use of bitumen emulsionIncreased use of bitumen emulsion
• Emulsion used extensively in seals
• Included as part of design to ensure coating
• Polymer modified bitumen emulsion (SBR) widely used for aggregate retention and adhesion
• Extends spray seal season
www.aapa.asn.au AAPA 2011 Pre-CAPSA’11 Study Tour – Feedback SARG 2011-10-05
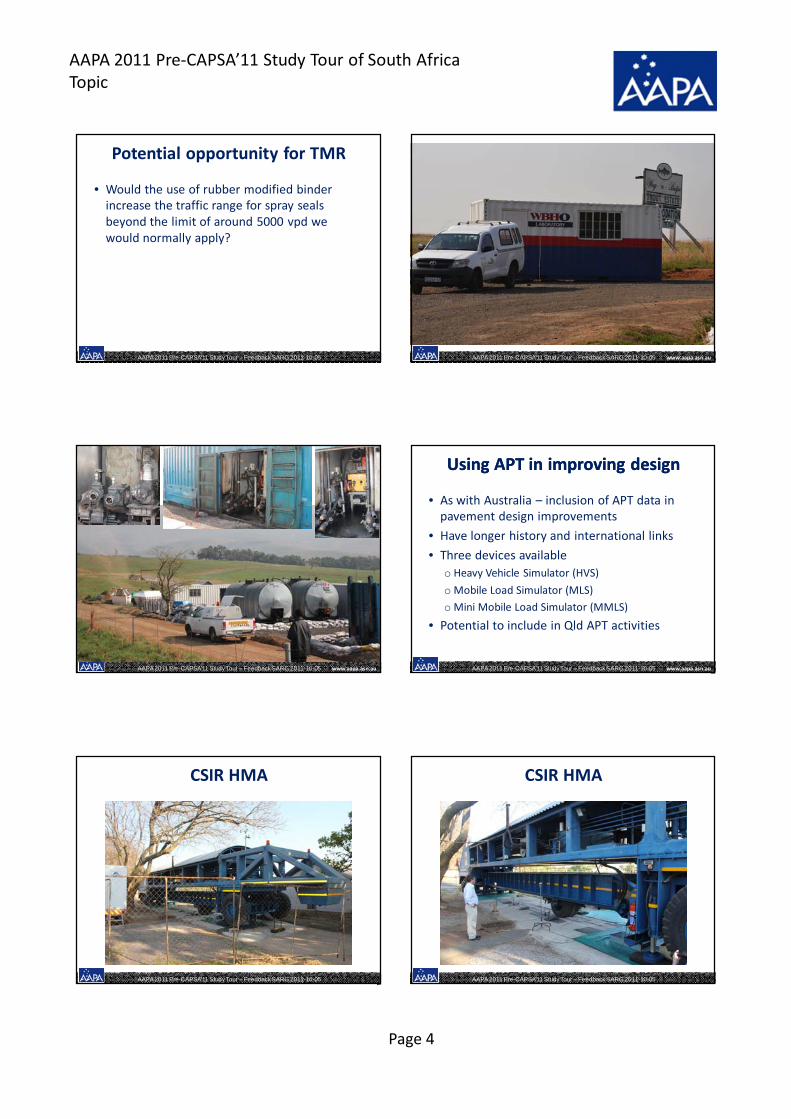
Potential opportunity for TMR
• Would the use of polymer modified emulsions potentially extend the sealing window in Queensland through Winter?
• Would elimination of cutter reduce the potential for flushing in the following summer, and improve seal quality?
AAPA 2011 Pre-CAPSA’11 Study Tour – Feedback SARG 2011-10-05 www.aapa.asn.au AAPA 2011 Pre-CAPSA’11 Study Tour – Feedback SARG 2011-10-05
Higher traffic loads on sealsHigher traffic loads on seals
• Traffic loads well in excess of 5 000 vpld (>15%HV)
• 20% crumb rubber binder / double seal
• Good construction control
www.aapa.asn.au
AAPA 2011 Pre-CAPSA’11 Study Tour – Feedback SARG 2011-10-05 www.aapa.asn.au AAPA 2011 Pre-CAPSA’11 Study Tour – Feedback SARG 2011-10-05
20% crumbed rubber binders20% crumbed rubber binders
• Field blended
• Property monitoring in field (viscosity, SP (R&B))
• Usage within defined time
www.aapa.asn.au
AAPA 2011 Pre‐CAPSA’11 Study Tour of South AfricaTopic
Page 4
AAPA 2011 Pre-CAPSA’11 Study Tour – Feedback SARG 2011-10-05
Potential opportunity for TMR
• Would the use of rubber modified binder increase the traffic range for spray seals beyond the limit of around 5000 vpd we would normally apply?
AAPA 2011 Pre-CAPSA’11 Study Tour – Feedback SARG 2011-10-05 www.aapa.asn.au
AAPA 2011 Pre-CAPSA’11 Study Tour – Feedback SARG 2011-10-05 www.aapa.asn.au AAPA 2011 Pre-CAPSA’11 Study Tour – Feedback SARG 2011-10-05
Using APT in improving designUsing APT in improving design
• As with Australia – inclusion of APT data in pavement design improvements
• Have longer history and international links
• Three devices available
o Heavy Vehicle Simulator (HVS)
o Mobile Load Simulator (MLS)
o Mini Mobile Load Simulator (MMLS)
• Potential to include in Qld APT activities
www.aapa.asn.au
AAPA 2011 Pre-CAPSA’11 Study Tour – Feedback SARG 2011-10-05
CSIR HMA
AAPA 2011 Pre-CAPSA’11 Study Tour – Feedback SARG 2011-10-05
CSIR HMA

AAPA 2011 Pre‐CAPSA’11 Study Tour of South AfricaTopic
Page 5
AAPA 2011 Pre-CAPSA’11 Study Tour – Feedback SARG 2011-10-05
Benoit explaining operation
AAPA 2011 Pre-CAPSA’11 Study Tour – Feedback SARG 2011-10-05
Operation of APT
AAPA 2011 Pre-CAPSA’11 Study Tour – Feedback SARG 2011-10-05
Opportunity for TMR
• Given our investment in roads infrastructure in Queensland, can we afford not to have an APT?
• What would be the best configuration to adopt?
• Working with ARRB to explore the full range of available options.
AAPA 2011 Pre-CAPSA’11 Study Tour – Feedback SARG 2011-10-05
WMA & high % RAPWMA & high % RAP
• Three trials undertaken since 2008
• Different WMA technologies trialled
• RAP% 10,20,40%
• PMB’s included
• Surfacing & base
• Heavily trafficked
• Sabita WMA manualin print
www.aapa.asn.au
AAPA 2011 Pre-CAPSA’11 Study Tour – Feedback SARG 2011-10-05
Warm Mix Asphalt
• Increasing use in South Africa and US
• Appears to offer many benefits:
‐ Reduced fuming – with WHS benefits
‐ Improved consistency
‐ Better handling
• Already used extensively by BCC
• Worthwhile Alliance project
AAPA 2011 Pre-CAPSA’11 Study Tour – Feedback SARG 2011-10-05 www.aapa.asn.au
AAPA 2011 Pre‐CAPSA’11 Study Tour of South AfricaTopic
Page 6
AAPA 2011 Pre-CAPSA’11 Study Tour – Feedback SARG 2011-10-05
Heavy duty pavements Heavy duty pavements HiMAHiMA
• Based on the proven French EME system
• Use of a harder but resilient binder (Pen 10/15)
• Increases the modulus to >14 000 MPA whilst retaining fatigue characteristics
• Able to provide thinner higher load bearing capacity for heavy duty pavements
• Trial project inspected forrequired performance properties
• Could be delivered locally
www.aapa.asn.au AAPA 2011 Pre-CAPSA’11 Study Tour – Feedback SARG 2011-10-05
Implications for TMR
• What is the real life of HiMA?
• Harder binder when constructed would normally lead to shorter life due to fatigue.
• Does the increase in binder content to 6% fully compensate for this?
• Can we obtain the suitable binder in Qld?
• Would adoption of HiMA (with its thinner overall thickness) increase the competitiveness of asphalt compared to concrete pavements?
AAPA 2011 Pre-CAPSA’11 Study Tour – Feedback SARG 2011-10-05 www.aapa.asn.au AAPA 2011 Pre-CAPSA’11 Study Tour – Feedback SARG 2011-10-05 www.aapa.asn.au
AAPA 2011 Pre-CAPSA’11 Study Tour – Feedback SARG 2011-10-05 www.aapa.asn.au AAPA 2011 Pre-CAPSA’11 Study Tour – Feedback SARG 2011-10-05
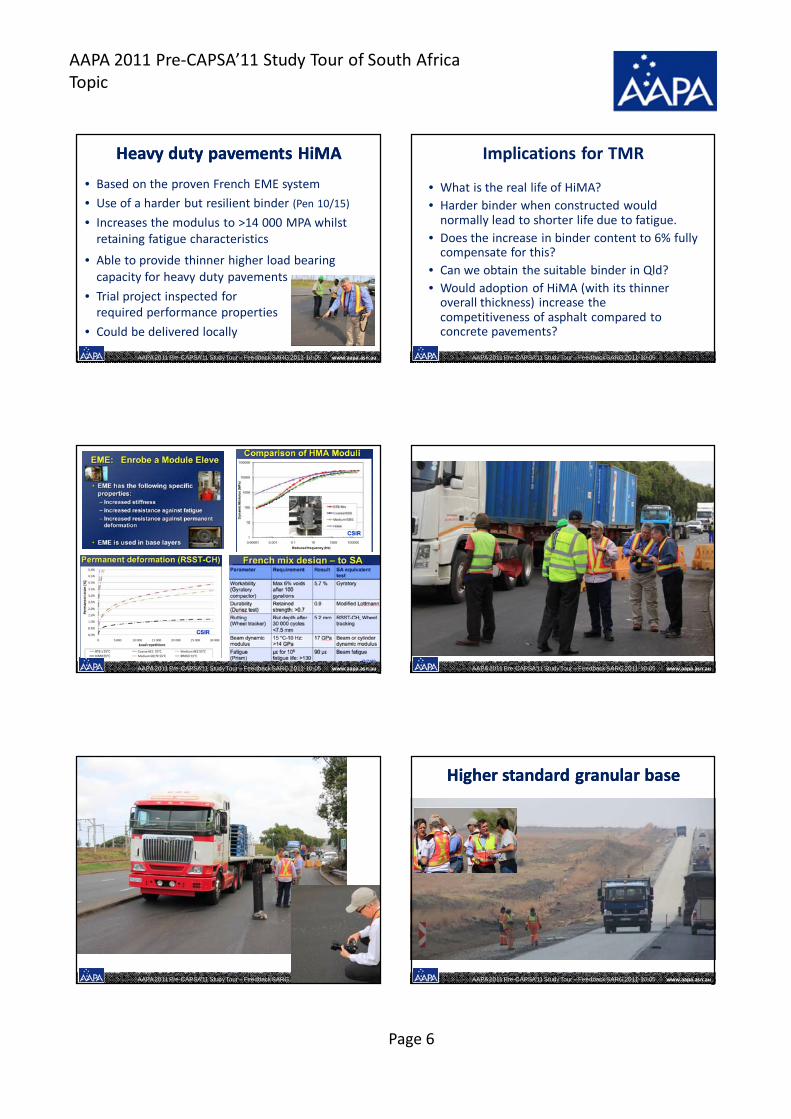
Higher standard granular baseHigher standard granular base
www.aapa.asn.au

AAPA 2011 Pre‐CAPSA’11 Study Tour of South AfricaTopic
Page 7
AAPA 2011 Pre-CAPSA’11 Study Tour – Feedback SARG 2011-10-05
SHSSASHSSA
• Agreed to the formation of the Southern Hemisphere Sprayed Seal Alliance
• Includes
o Individuals interested in sprayed seals
o Representative groups
• AAPA, Sabita
• ARRB, CSIR
• AsAc, SAT
• Communication through web & LinkedIn
• Formal structure to be established
www.aapa.asn.au AAPA 2011 Pre-CAPSA’11 Study Tour – Feedback SARG 2011-10-05 www.aapa.asn.au
AAPA 2011 Pre-CAPSA’11 Study Tour – Feedback SARG 2011-10-05
Questions for TMR
• What is the role of professional networking (using LinkedIn) in TMR?
• Should we establish other communities of practice for other technologies as well, as a forum for sharing of knowledge?
• How should these be managed, to ensure that “information” on LinkedIn is soundly evidence based?
AAPA 2011 Pre-CAPSA’11 Study Tour – Feedback SARG 2011-10-05 www.aapa.asn.au
Special eventsSpecial events
AAPA 2011 Pre-CAPSA’11 Study Tour – Feedback SARG 2011-10-05 www.aapa.asn.au AAPA 2011 Pre-CAPSA’11 Study Tour – Feedback SARG 2011-10-05 www.aapa.asn.au
AAPA 2011 Pre‐CAPSA’11 Study Tour of South AfricaTopic
Page 8
AAPA 2011 Pre-CAPSA’11 Study Tour – Feedback SARG 2011-10-05 www.aapa.asn.au AAPA 2011 Pre-CAPSA’11 Study Tour – Feedback SARG 2011-10-05
Report being preparedJoint and shared content – lead by key issue leaders
Feedback Regionally through AAPA organised events
Initial overview at SARG on Wednesday
Forward actionsWill be driven by report recommendations, likely . . . . . .o Link to foam stabilisedmaterial experts in South Africa
o Review APT experience based on RSA & USA reports
o Invite supply & use of field blended 20% crumb rubber
o Trial heavy duty seal designs with above
o Commence HiMA activities
o Develop Polymer Modified Emulsion Specifications
www.aapa.asn.au
AAPA 2011 Pre-CAPSA’11 Study Tour – Feedback SARG 2011-10-05
Thank you Rob
• Sincere thanks to AAPA and particularly Rob Vos for organising this trip.
• TMR intends to work collaboratively with AAPA to drive worthwhile changes identified during the trip.

Reference Group 12 May 2010
Page 1
Referen
ce Group
Referen
ce Group
2010
2010
Strategic Alliance Reference Group
Thermal Imaging and Bitumen Sprayer Distribution
Strategic Alliance R
Strategic Alliance R
12 M
ay
12 M
ay
Thermal imaging and bitumen sprayer distribution 1
p y
Michael Janosevic
Joel Gibson
Referen
ce Group
Referen
ce Group
2010
2010
Thermal Imaging
Strategic Alliance R
Strategic Alliance R
12 M
ay
12 M
ay
Thermal imaging and bitumen sprayer distribution 2
Referen
ce Group
Referen
ce Group
2010
2010
Thermal Imaging
Strategic Alliance R
Strategic Alliance R
12 M
ay
12 M
ay
Thermal imaging and bitumen sprayer distribution 3
Referen
ce Group
Referen
ce Group
2010
2010
Thermal Imaging
Strategic Alliance R
Strategic Alliance R
12 M
ay
12 M
ay
Thermal imaging and bitumen sprayer distribution 4
Referen
ce Group
Referen
ce Group
2010
2010
Thermal Imaging
Strategic Alliance R
Strategic Alliance R
12 M
ay
12 M
ay
Thermal imaging and bitumen sprayer distribution 5
Referen
ce Group
Referen
ce Group
2010
2010
Thermal Imaging
Questions?
Strategic Alliance R
Strategic Alliance R
12 M
ay
12 M
ay
Thermal imaging and bitumen sprayer distribution 6

Reference Group 12 May 2010
Page 1
Referen
ce Group
Referen
ce Group
2010
2010
Strategic Alliance Reference Group
Bitumen Sampling Device
Strategic Alliance R
Strategic Alliance R
12 M
ay
12 M
ay
Thermal imaging and bitumen sprayer distribution 1
Michael Janosevic
Joel Gibson
Referen
ce Group
Referen
ce Group
2010
2010
Bitumen Sampling
Strategic Alliance R
Strategic Alliance R
12 M
ay
12 M
ay
Thermal imaging and bitumen sprayer distribution 2
Referen
ce Group
Referen
ce Group
2010
2010
Bitumen Sampling
Strategic Alliance R
Strategic Alliance R
12 M
ay
12 M
ay
Thermal imaging and bitumen sprayer distribution 3
Referen
ce Group
Referen
ce Group
2010
2010
Bitumen Sampling
Questions?
Strategic Alliance R
Strategic Alliance R
12 M
ay
12 M
ay
Thermal imaging and bitumen sprayer distribution 4


![AGENDA PLANNING COMMITTEE MEETING Tuesday 18 …€¦ · Nursing Home Facility at Lot 1 DP 1099088, No. 18 Ballymore Court, Banora Point 173 P10 [CNR-PC] Development of a Model Biodiversity](https://img.pdfslide.net/doc/110x75/5f1cfc225b48925e320df1ec/agenda-planning-committee-meeting-tuesday-18-nursing-home-facility-at-lot-1-dp-1099088.jpg)