Embed Size (px)
Citation preview
Earth’s Climate: Past, Present and Future;Concerns and Solutions
Week 4: Wednesday April 20, 2016Paul Belanger
Concerns: Rates of change, Oceanacidification, modeling
1. Recap of climate variables and past records2. Rates of change3. Proxies that tell us of climate records4. Ocean Acidification5. Climate Modeling
• Week 2’s slide sethttp://denverclimatestudygroup.com/?page_id=1796
• Week 3’s slides and video linkshttp://denverclimatestudygroup.com/?page_id=1798
1. Recap of climate variables andpast records
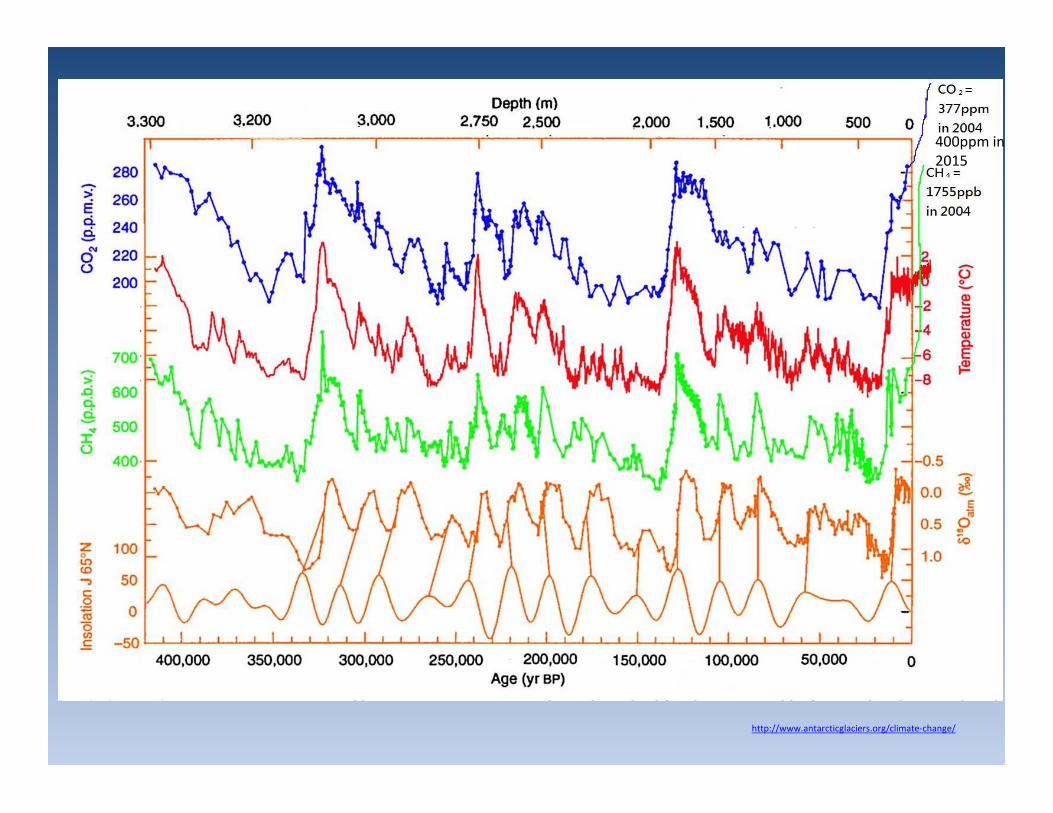
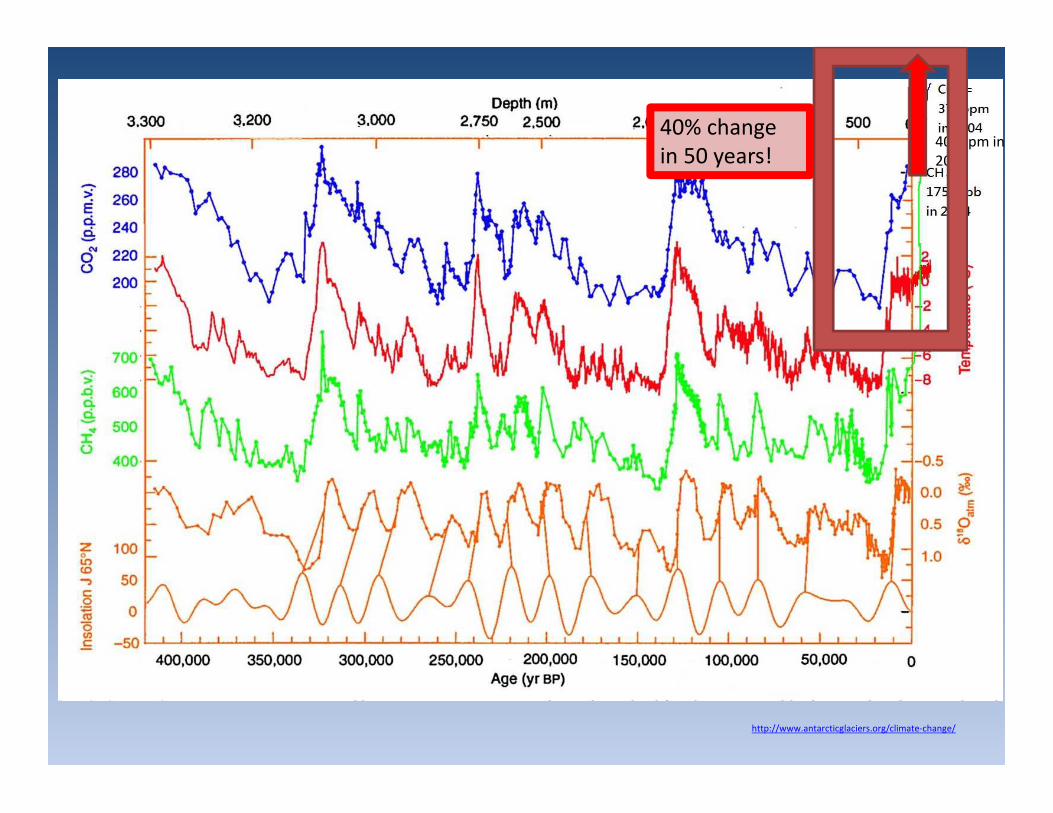
http://www.antarcticglaciers.org/climate-change/
400ppm in2015

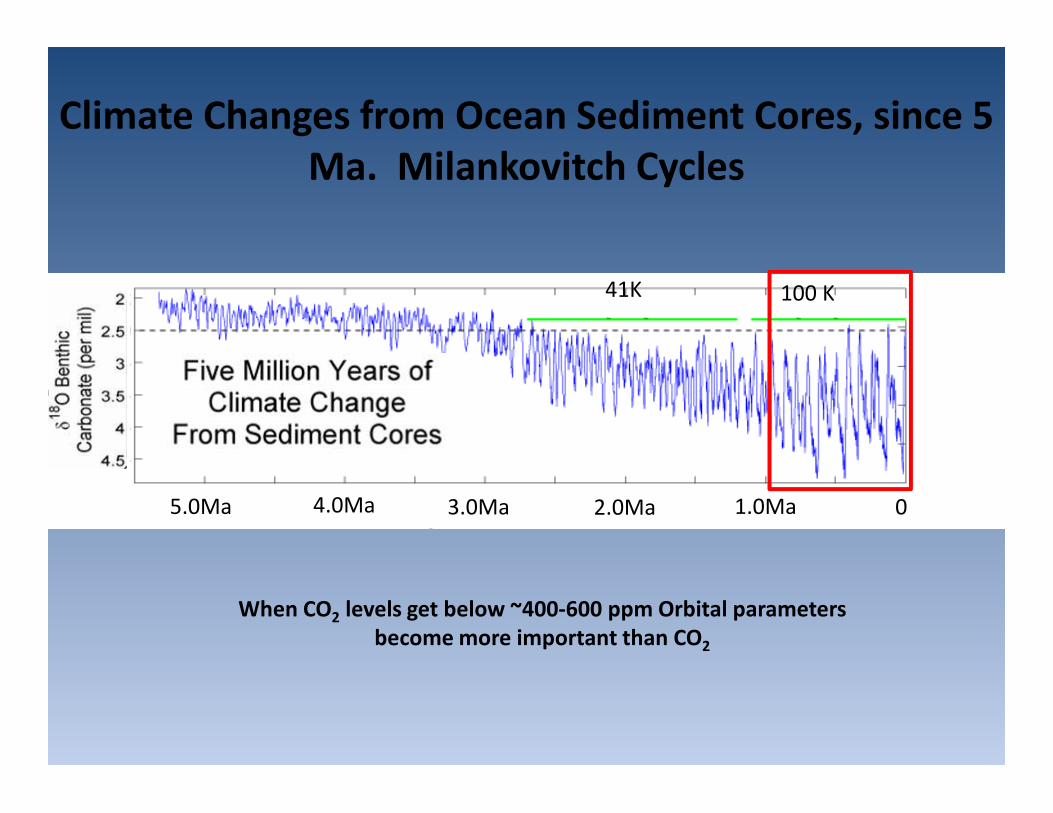
Climate Changes from Ocean Sediment Cores, since 5Ma. Milankovitch Cycles
41K 100 K
3.0Ma4.0Ma 2.0Ma 1.0Ma5.0Ma 0
When CO2 levels get below ~400-600 ppm Orbital parametersbecome more important than CO2
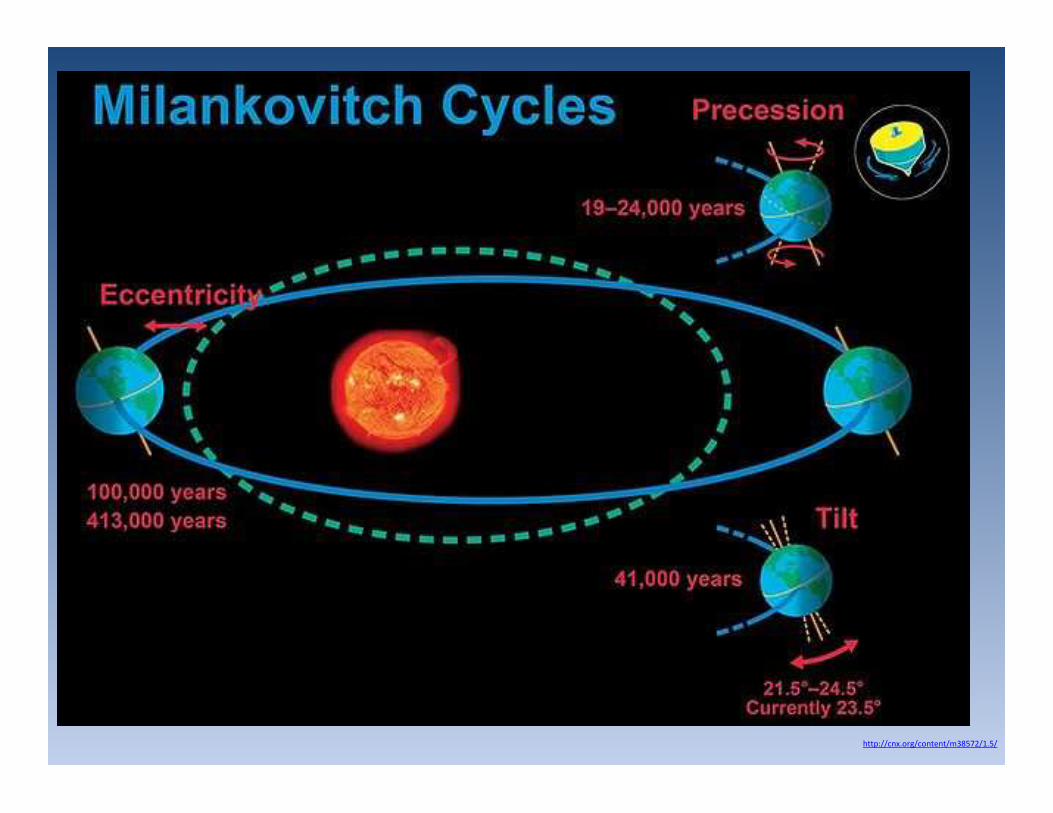
http://cnx.org/content/m38572/1.5/
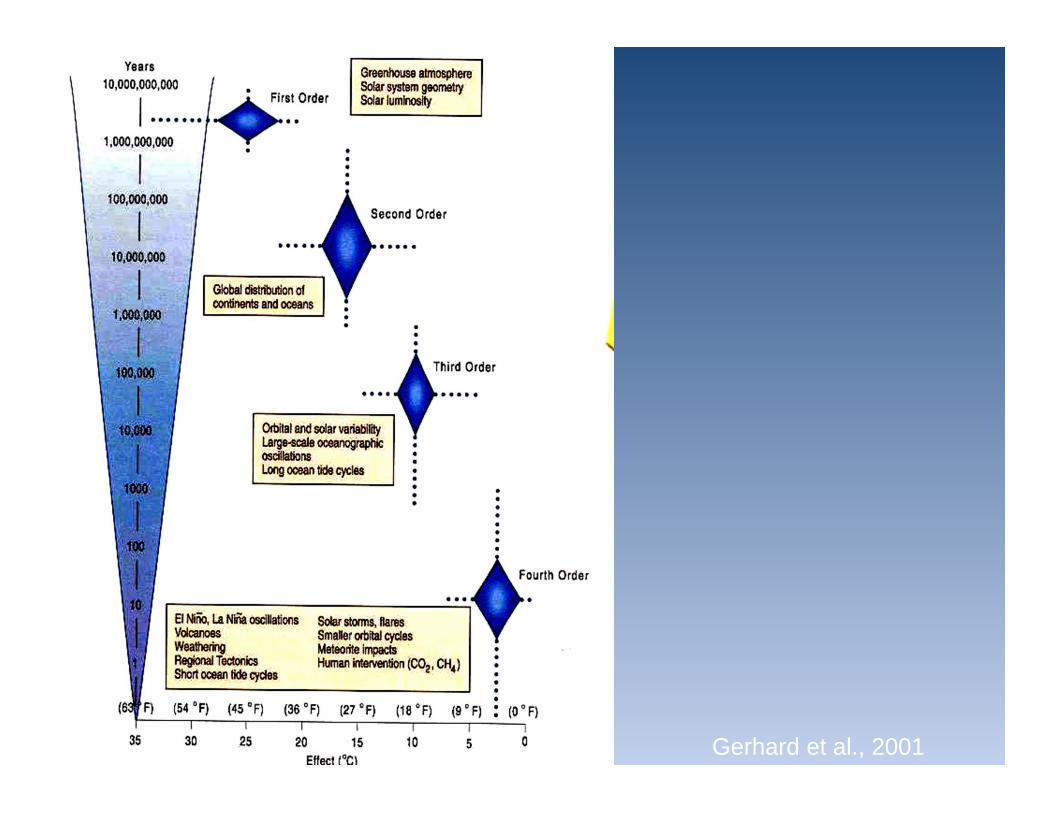
Gerhard et al., 2001
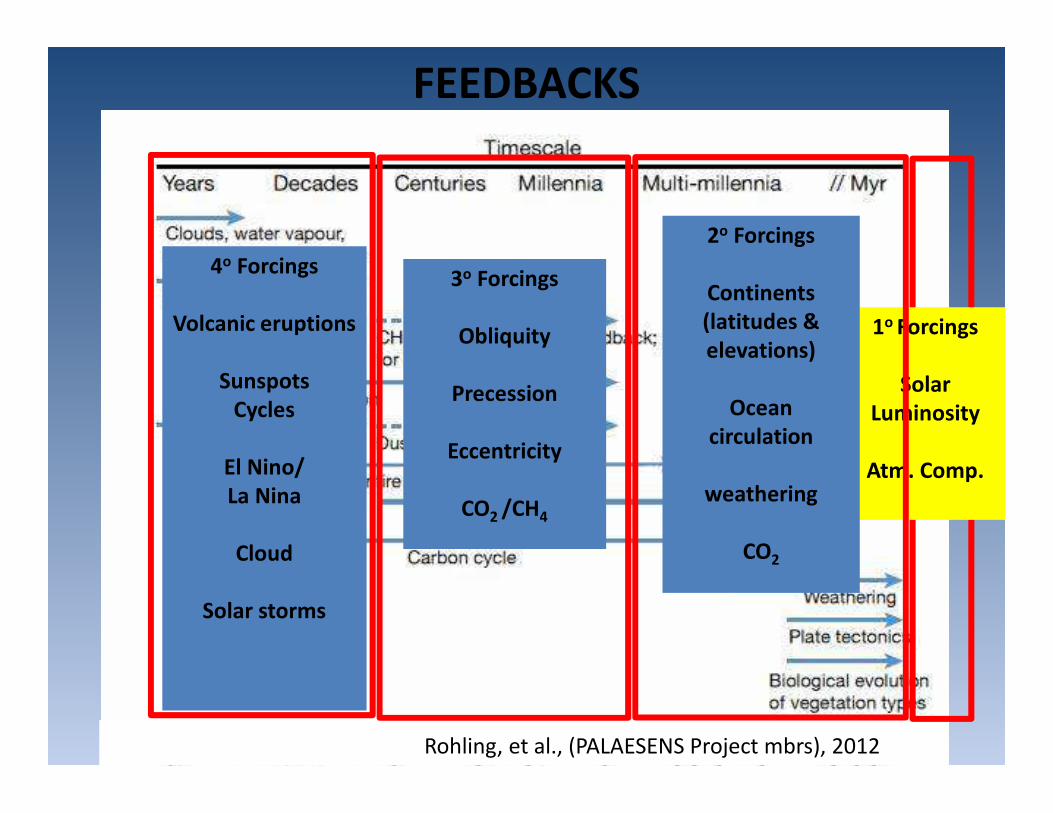
Rohling, et al., (PALAESENS Project mbrs), 2012
1o Forcings
SolarLuminosity
Atm. Comp.
2o Forcings
Continents(latitudes &elevations)
Oceancirculation
weathering
CO2
3o Forcings
Obliquity
Precession
Eccentricity
CO2 /CH4
FEEDBACKS
4o Forcings
Volcanic eruptions
SunspotsCycles
El Nino/La Nina
Cloud
Solar storms
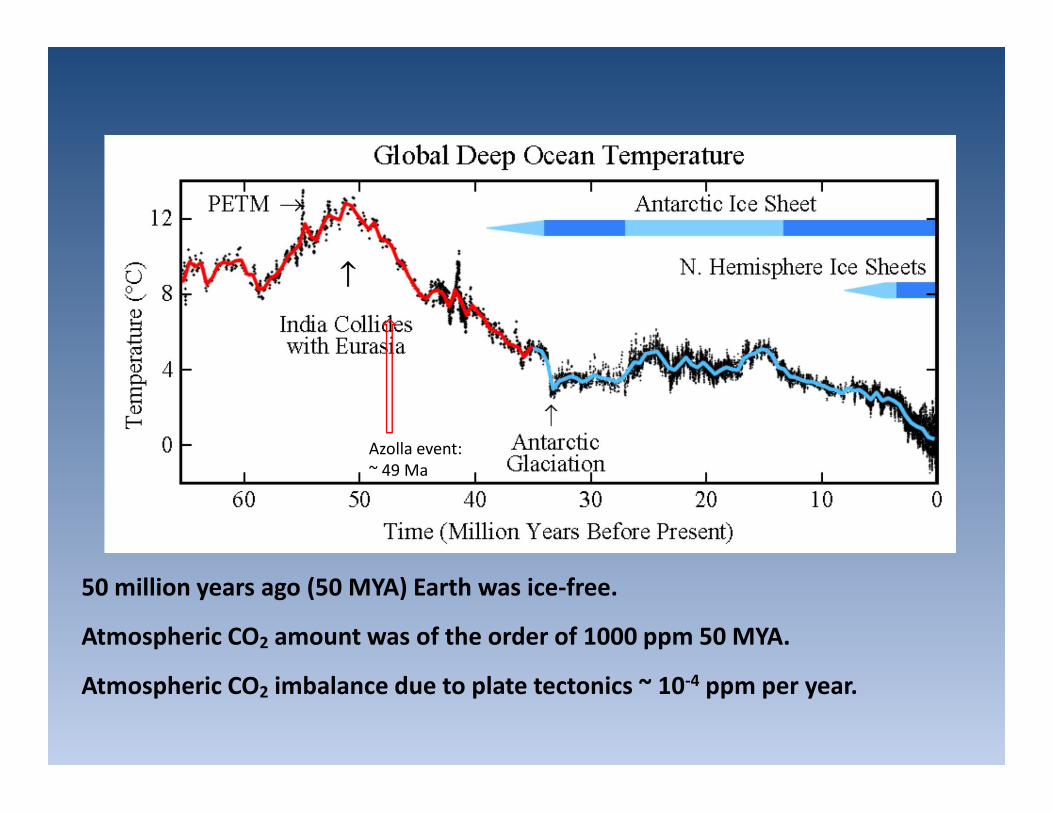
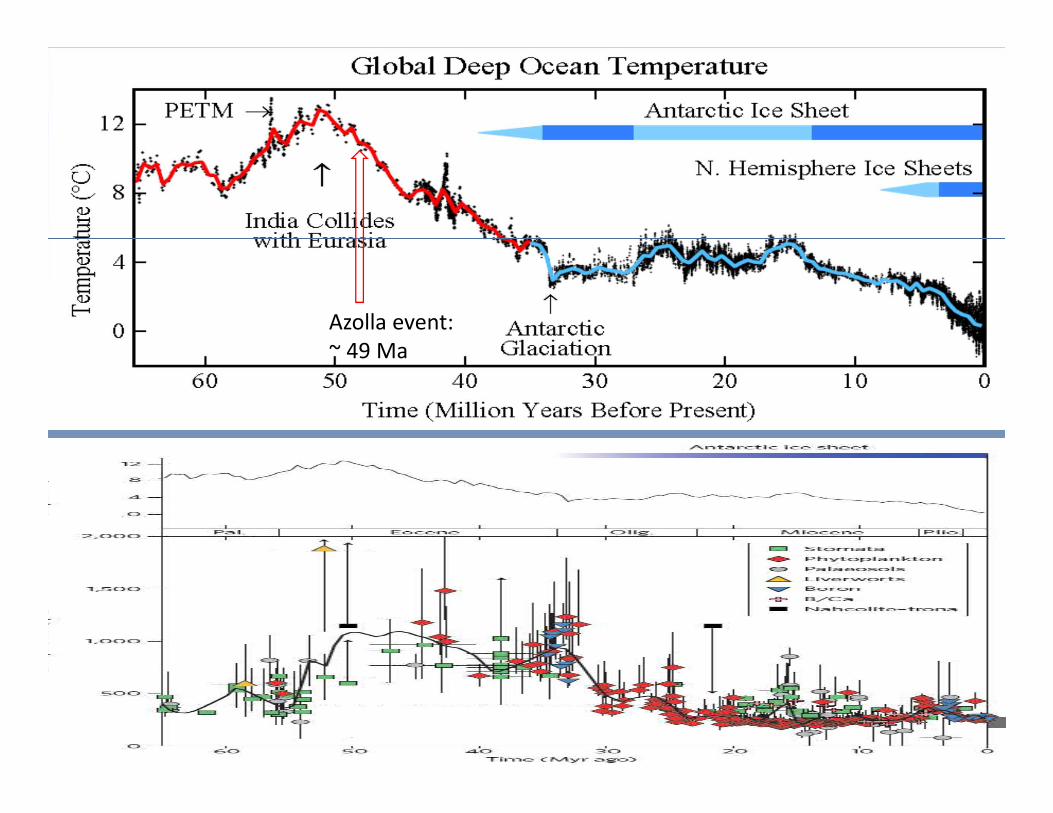
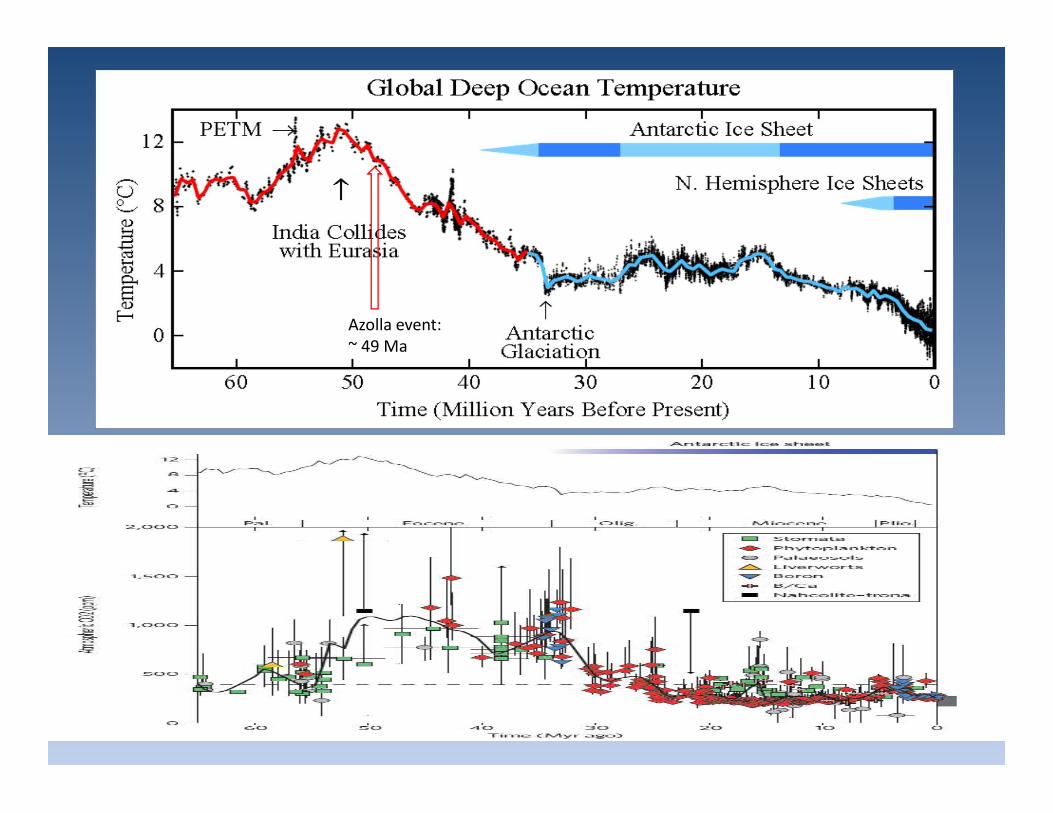
50 million years ago (50 MYA) Earth was ice-free.
Atmospheric CO2 amount was of the order of 1000 ppm 50 MYA.
Atmospheric CO2 imbalance due to plate tectonics ~ 10-4 ppm per year.
Azolla event:~ 49 Ma
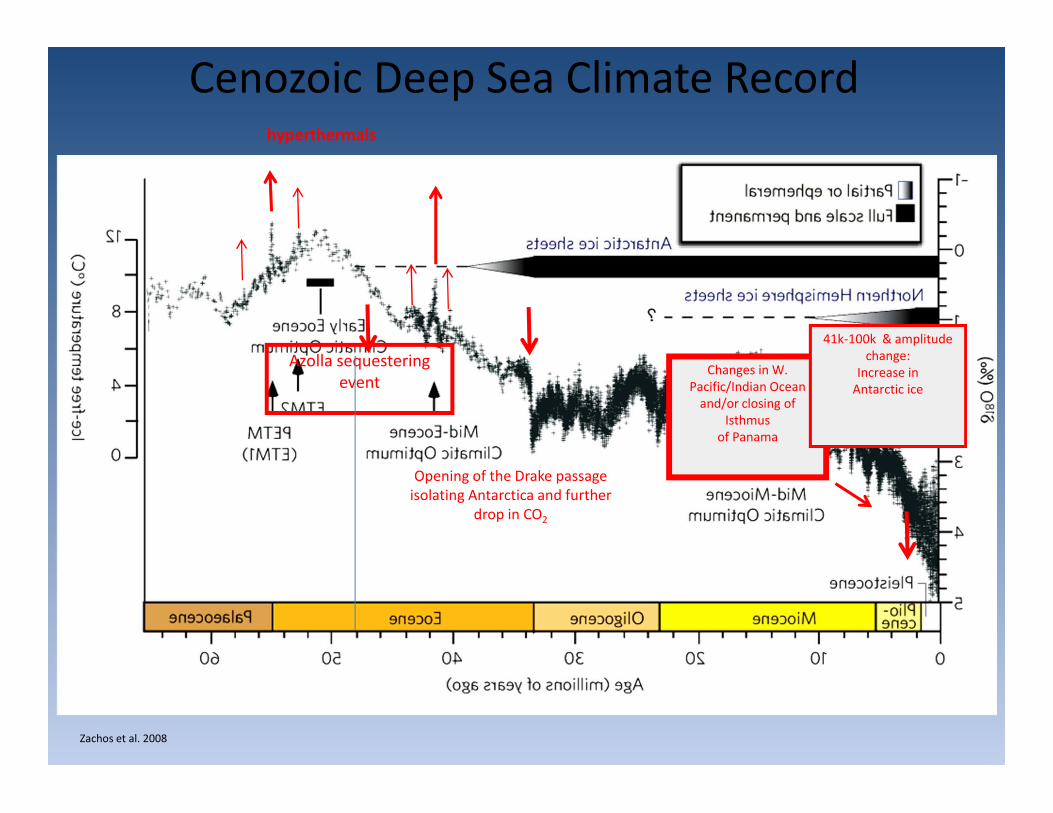
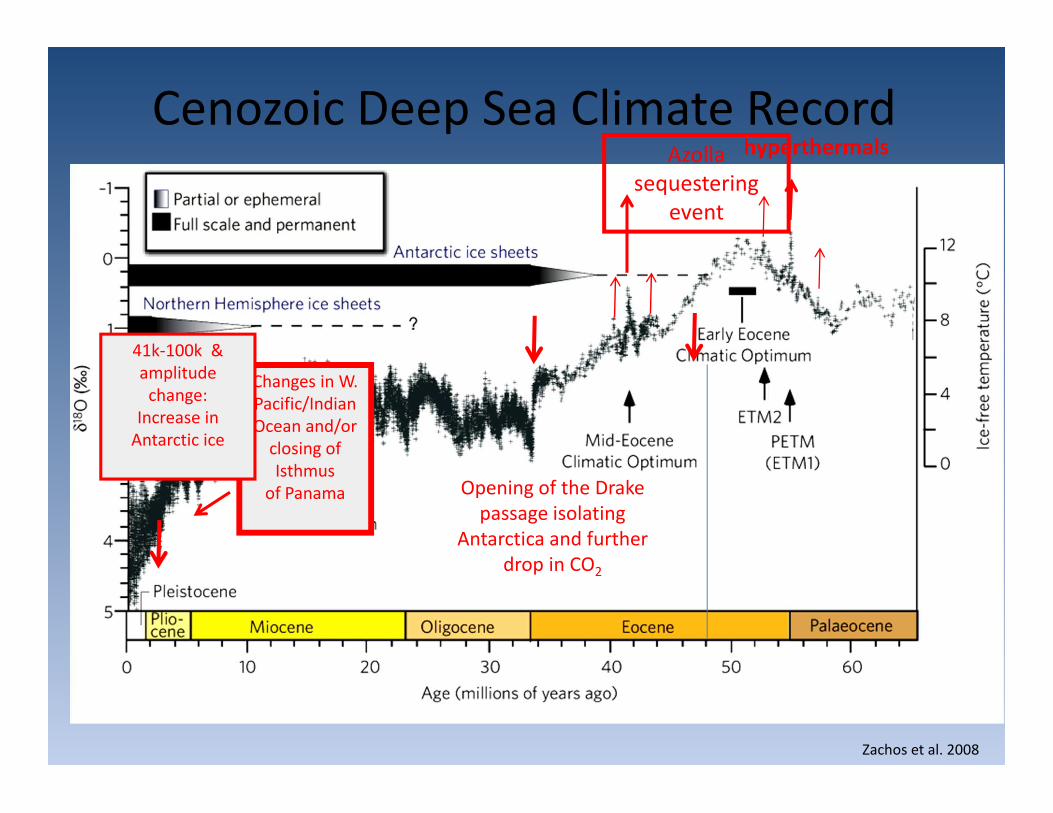
Zachos et al. 2008
hyperthermals
Opening of the Drake passageisolating Antarctica and further
drop in CO2
Changes in W.Pacific/Indian Ocean
and/or closing ofIsthmus
of Panama
41k-100k & amplitudechange:
Increase inAntarctic ice
Azolla sequesteringevent
Cenozoic Deep Sea Climate Record
Azolla event:~ 49 Ma
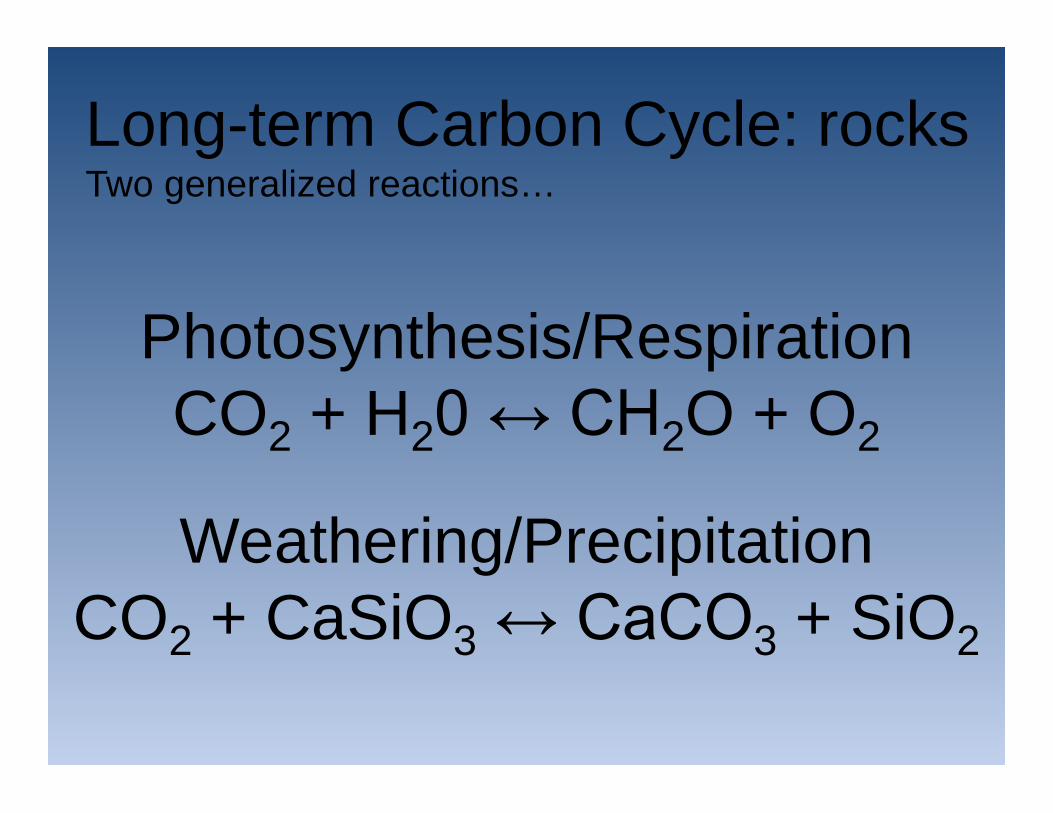
Photosynthesis/RespirationCO2 + H20 ↔ CH2O + O2
Weathering/PrecipitationCO2 + CaSiO3 ↔ CaCO3 + SiO2
Long-term Carbon Cycle: rocksTwo generalized reactions…
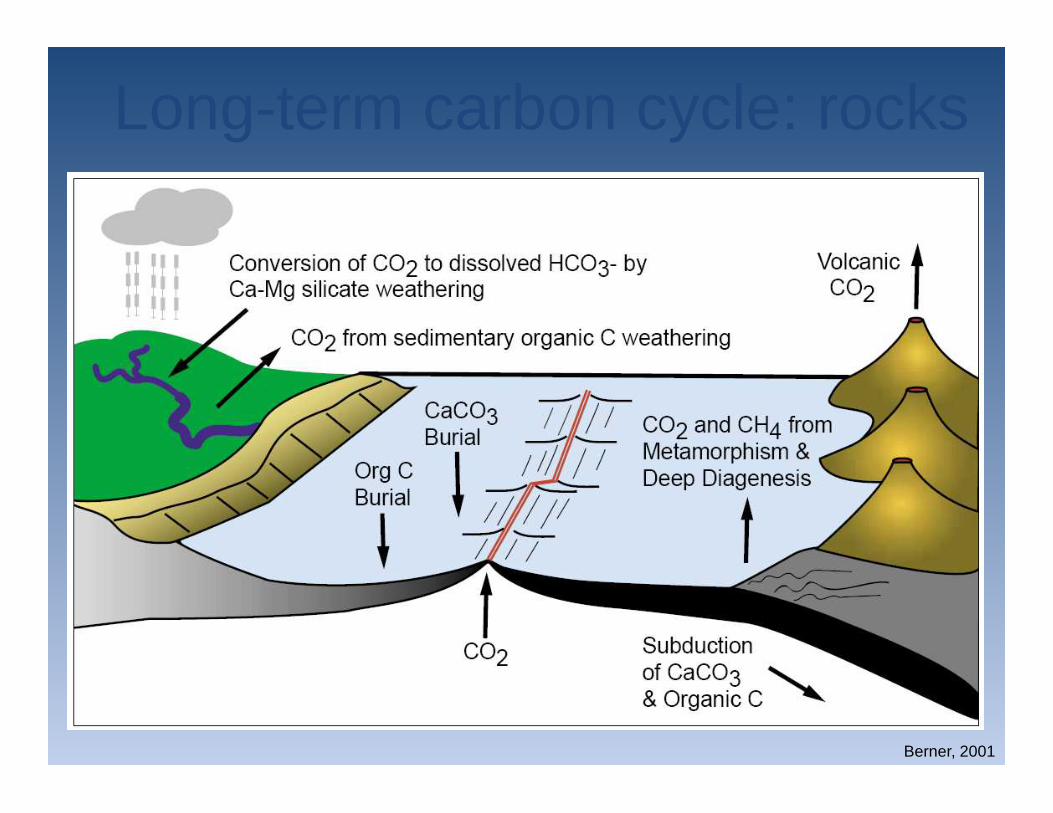
Berner, 2001
Long-term carbon cycle: rocks

50 million years ago (50 MYA) Earth was ice-free.
Atmospheric CO2 amount was of the order of 1000 ppm 50 MYA.
Atmospheric CO2 imbalance due to plate tectonics ~ 10-4 ppm per year.
Azolla event:~ 49 Ma

Azolla event:~ 49 Ma
So – what changed?
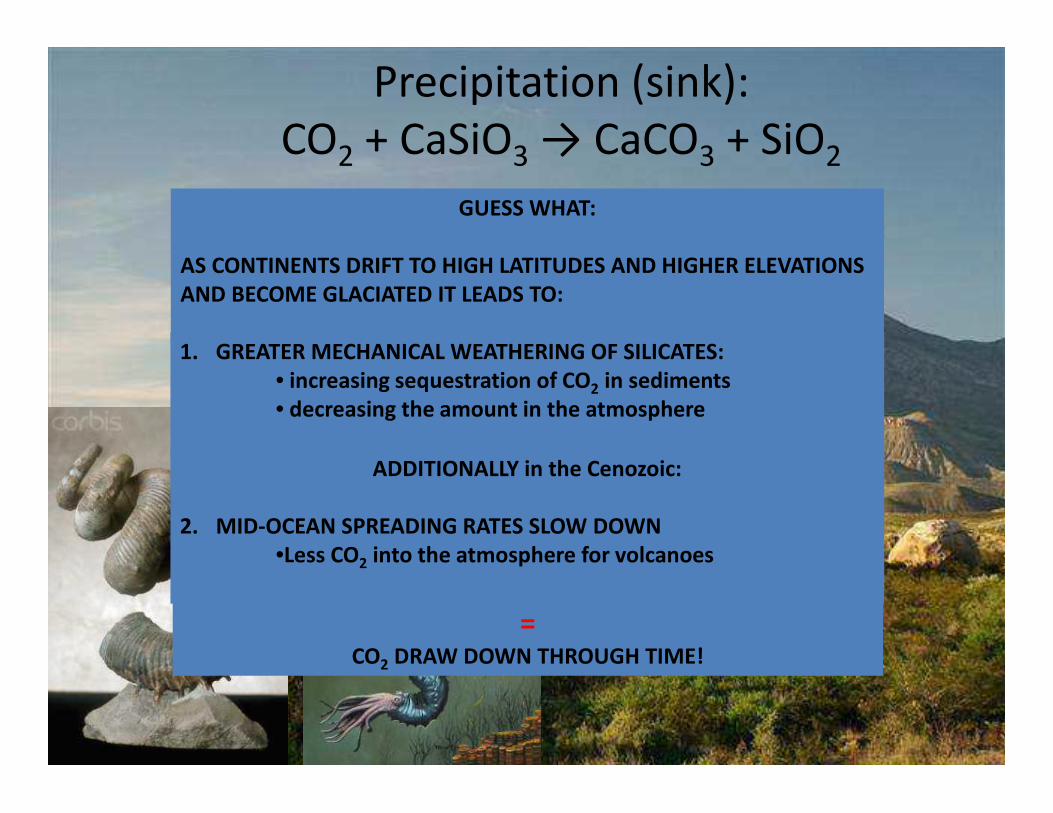
Precipitation (sink):CO2 + CaSiO3 → CaCO3 + SiO2
GUESS WHAT:
AS CONTINENTS DRIFT TO HIGH LATITUDES AND HIGHER ELEVATIONSAND BECOME GLACIATED IT LEADS TO:
1. GREATER MECHANICAL WEATHERING OF SILICATES:• increasing sequestration of CO2 in sediments• decreasing the amount in the atmosphere
ADDITIONALLY in the Cenozoic:
2. MID-OCEAN SPREADING RATES SLOW DOWN•Less CO2 into the atmosphere for volcanoes
=CO2 DRAW DOWN THROUGH TIME!
2. Rates of change

Unprecedented rates of change
http://www.antarcticglaciers.org/climate-change/
400ppm in2015
40% changein 50 years!
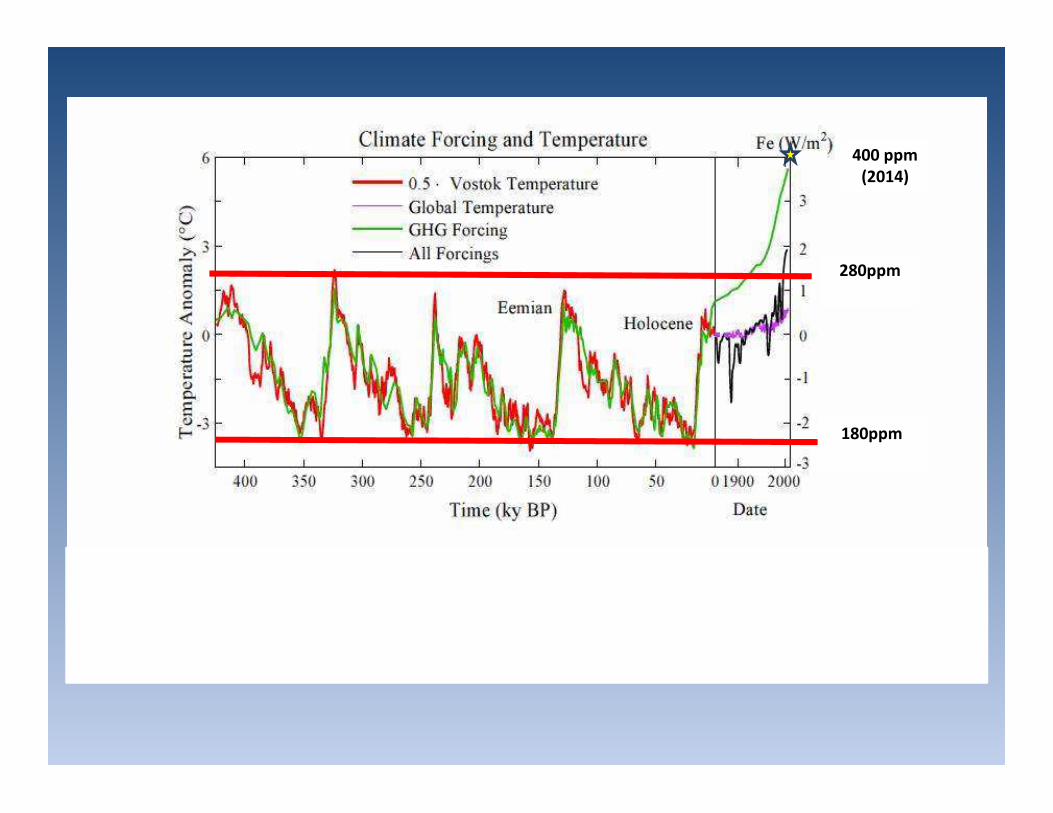
400 ppm(2014)
280ppm
180ppm
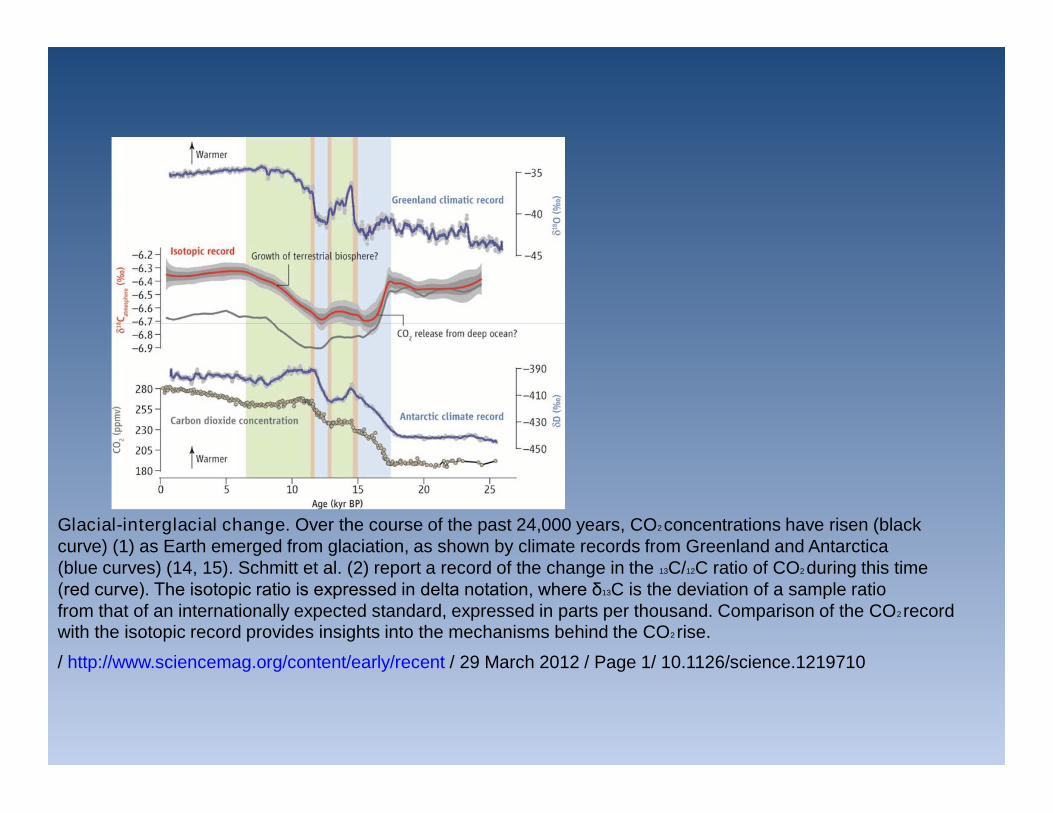
Glacial-interglacial change. Over the course of the past 24,000 years, CO2 concentrations have risen (blackcurve) (1) as Earth emerged from glaciation, as shown by climate records from Greenland and Antarctica(blue curves) (14, 15). Schmitt et al. (2) report a record of the change in the 13C/12C ratio of CO2 during this time(red curve). The isotopic ratio is expressed in delta notation, where δ13C is the deviation of a sample ratiofrom that of an internationally expected standard, expressed in parts per thousand. Comparison of the CO2 recordwith the isotopic record provides insights into the mechanisms behind the CO2 rise.
/ http://www.sciencemag.org/content/early/recent / 29 March 2012 / Page 1/ 10.1126/science.1219710
Climate Changes from Ocean Sediment Cores, since 5Ma. Milankovitch Cycles
41K 100 K
3.0Ma4.0Ma 2.0Ma 1.0Ma5.0Ma 0
When CO2 levels get below ~400-600 ppm Orbital parametersbecome more important than CO2
Paleocene/Eocene Thermal MaximumPETM
Cenozoic Deep Sea Climate Record
Zachos et al. 2008
hyperthermals
Opening of the Drakepassage isolating
Antarctica and furtherdrop in CO2
Changes in W.Pacific/IndianOcean and/or
closing ofIsthmus
of Panama
41k-100k &litude
change:Increase in
Antarctic ice
Azollasequestering
event
Azolla event:~ 49 Ma
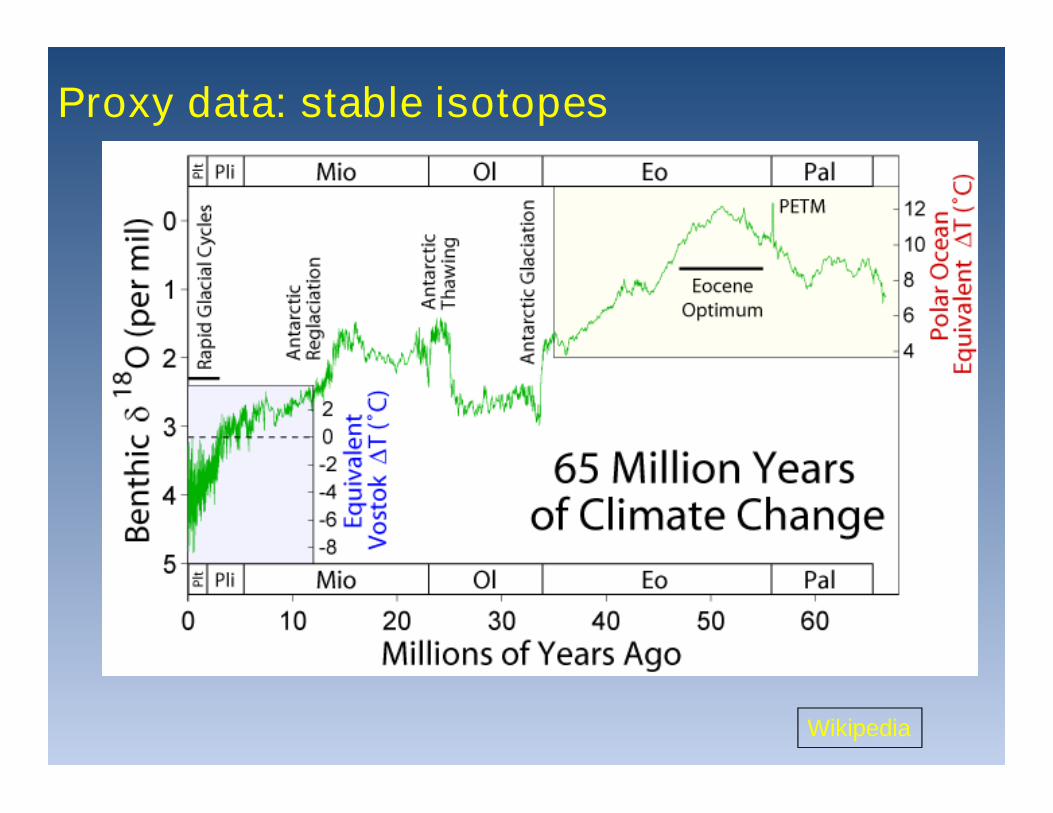
Wikipedia
Proxy data: stable isotopes
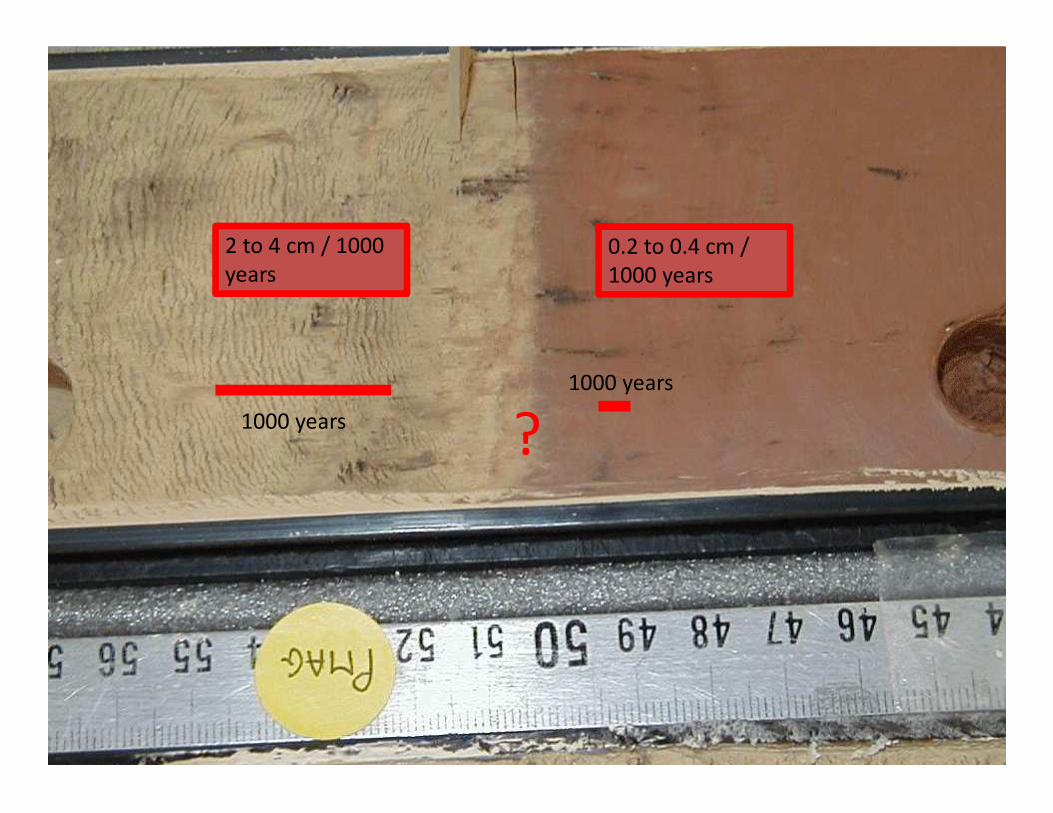
2 to 4 cm / 1000years
0.2 to 0.4 cm /1000 years
1000 years
1000 years
?
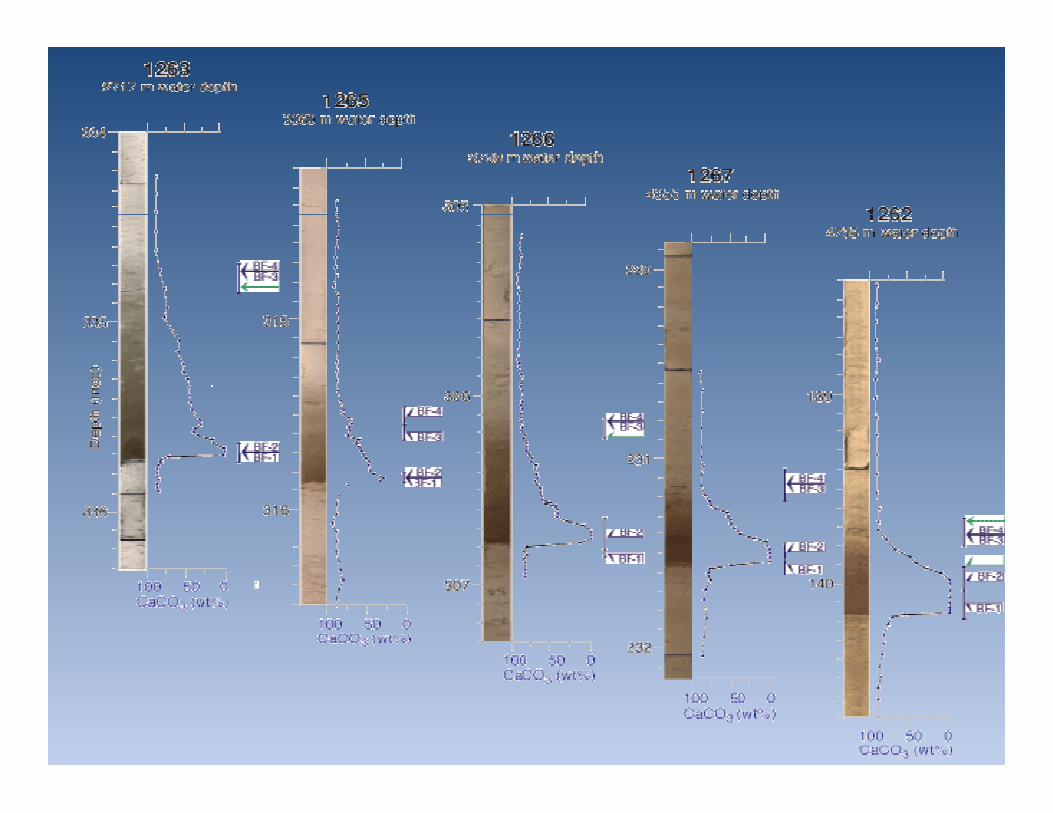
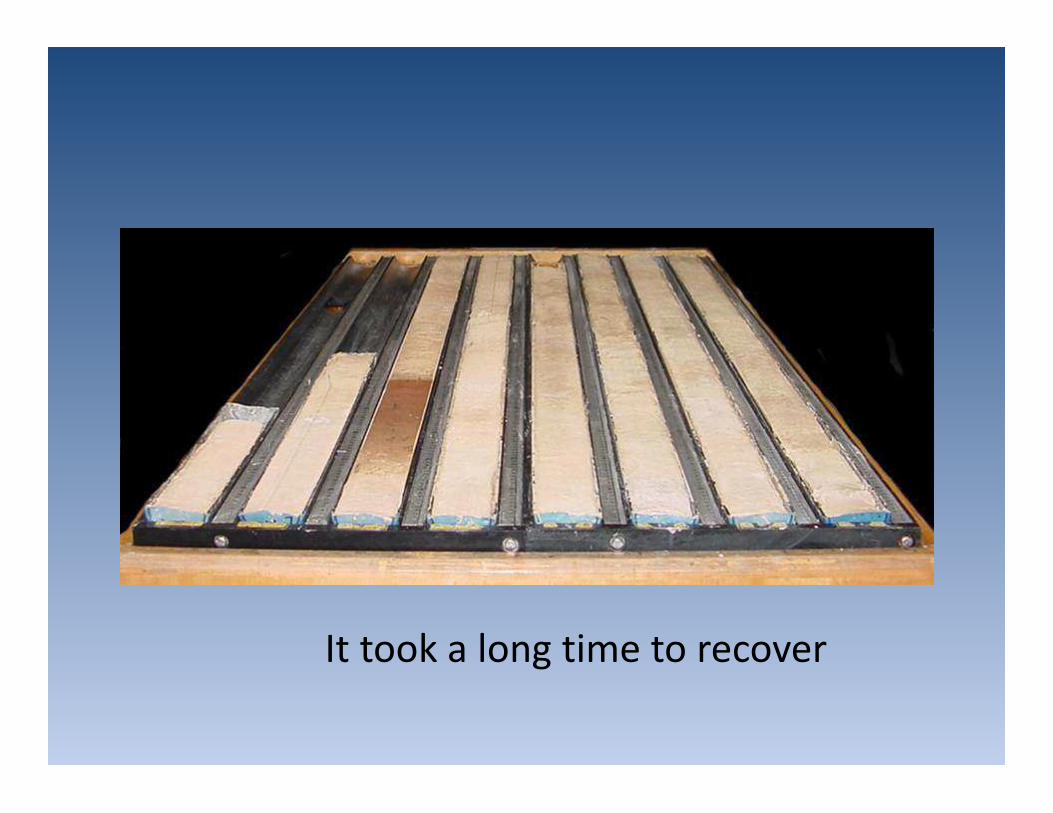
It took a long time to recover
The Azolla event
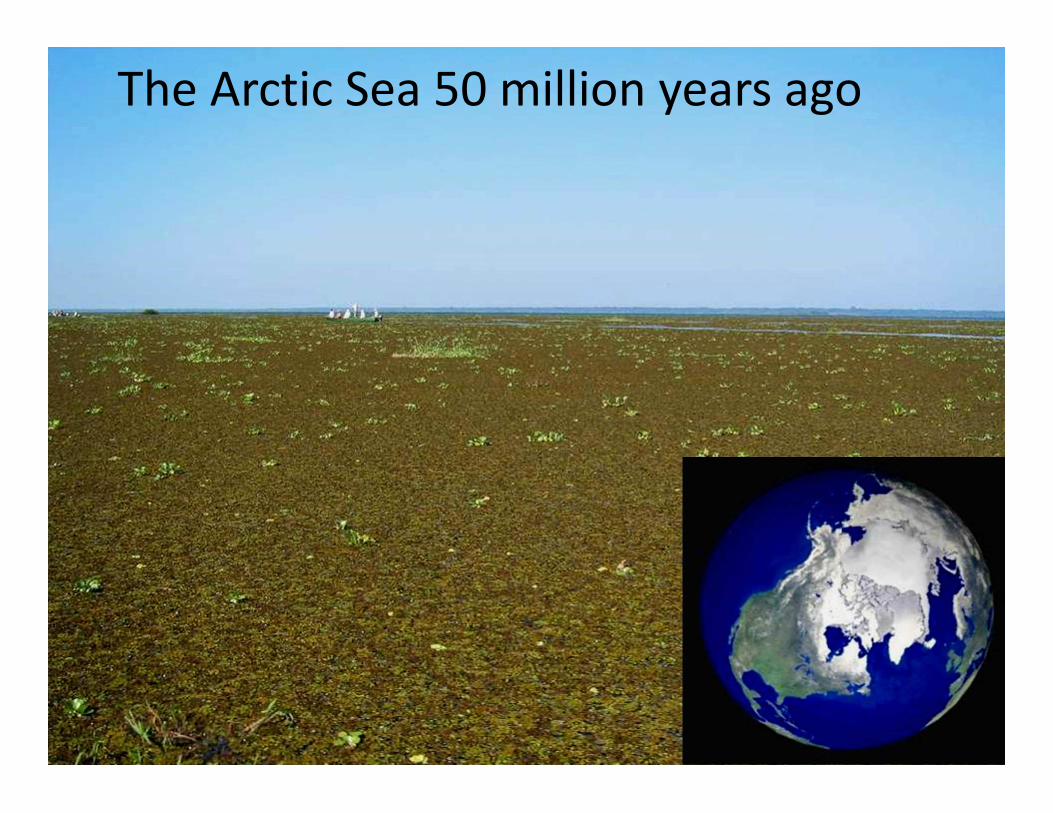
The Arctic Sea 50 million years ago
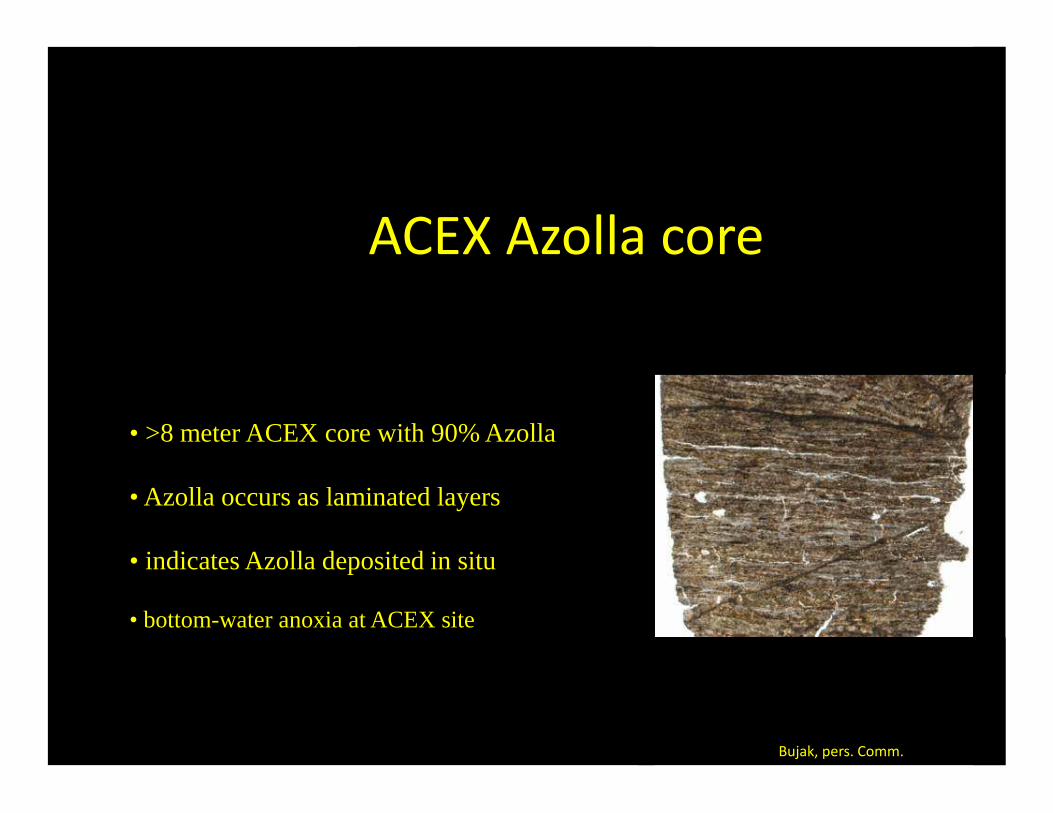
ACEX Azolla core
• >8 meter ACEX core with 90% Azolla
• Azolla occurs as laminated layers
• indicates Azolla deposited in situ
• bottom-water anoxia at ACEX site
Bujak, pers. Comm.
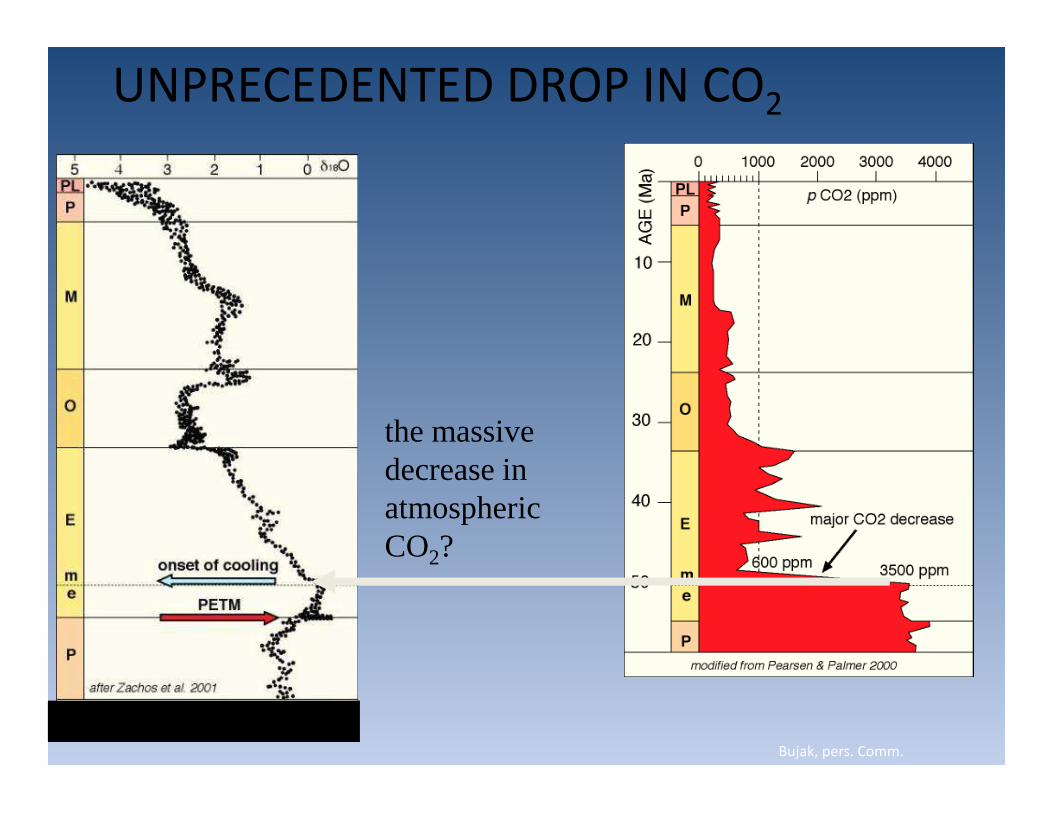
the massivedecrease inatmosphericCO2?
Bujak, pers. Comm.
UNPRECEDENTED DROP IN CO2
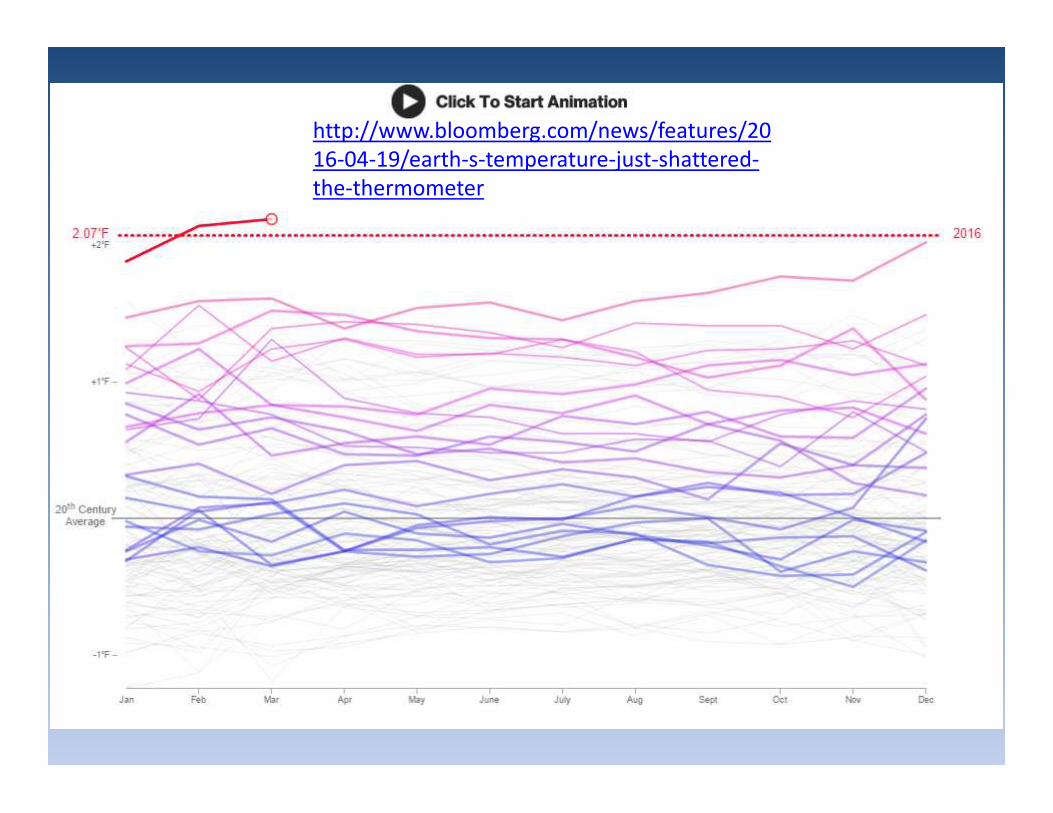
http://www.bloomberg.com/news/features/2016-04-19/earth-s-temperature-just-shattered-the-thermometer
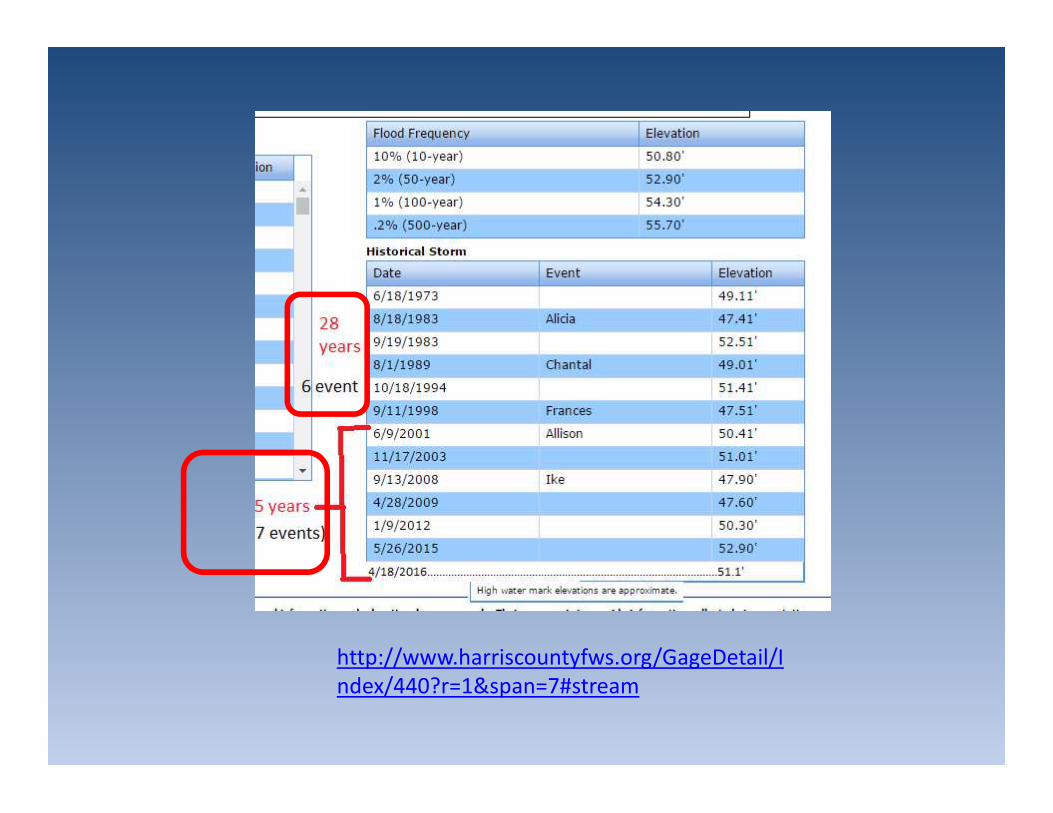
http://www.harriscountyfws.org/GageDetail/Index/440?r=1&span=7#stream
3. Proxies that tell us of climaterecords
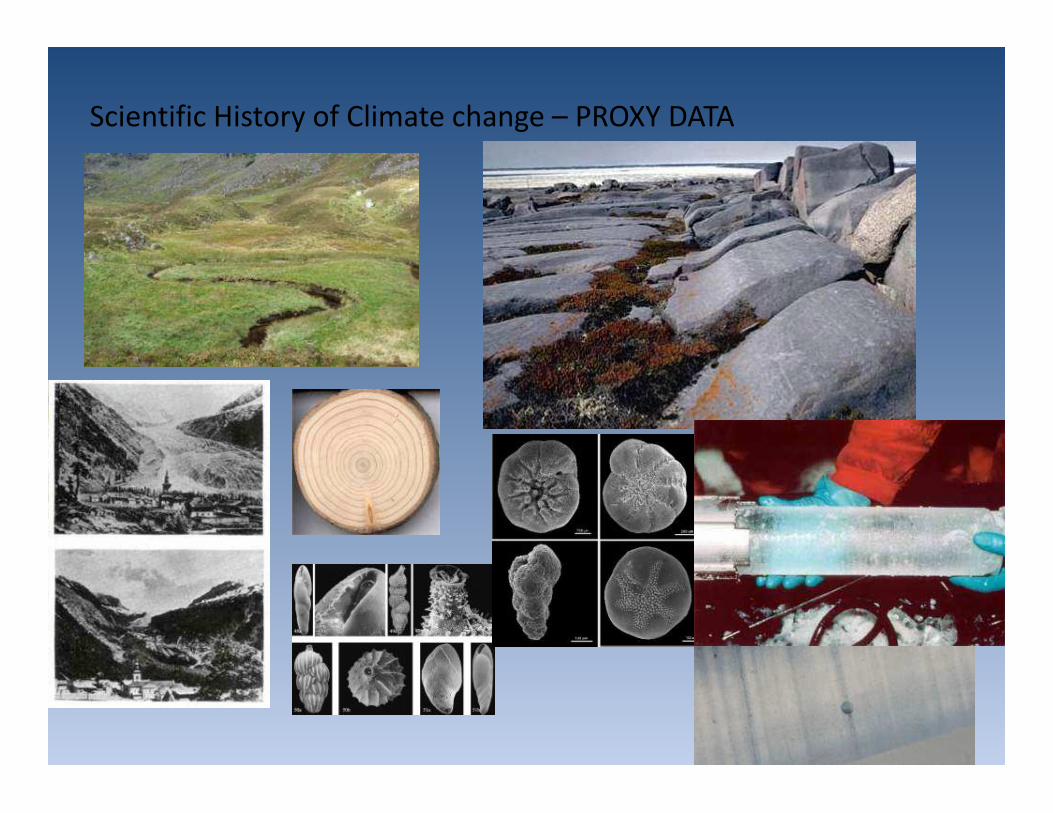
Scientific History of Climate change – PROXY DATA
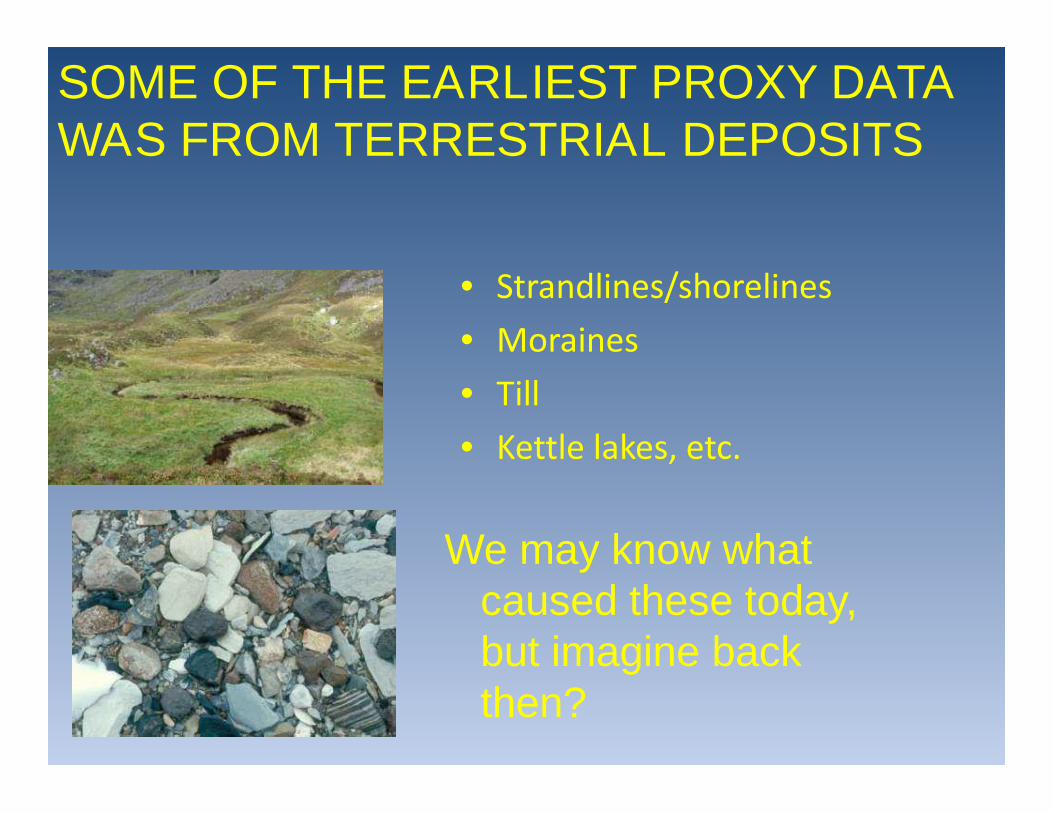
• Strandlines/shorelines
• Moraines
• Till
• Kettle lakes, etc.
SOME OF THE EARLIEST PROXY DATAWAS FROM TERRESTRIAL DEPOSITS
We may know whatcaused these today,but imagine backthen?
IT’S THE INTERPRETATION THAT’S NOTALWAYS CORRECT
Darwin observed ancient Alpine shorelines:interpreted as ocean shoreline
Agassiz – later correctly interpreted as ice-dammed lake-shore strandlines/shoreline
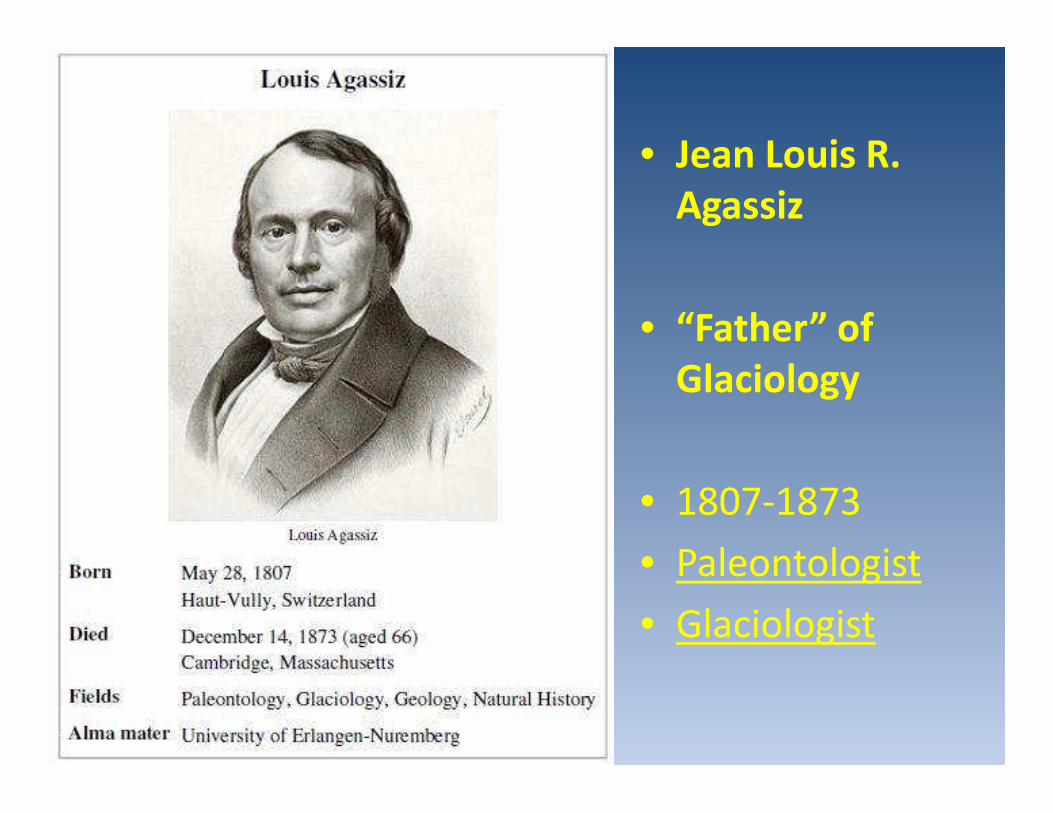
• Jean Louis R.Agassiz
• “Father” ofGlaciology
• 1807-1873
• Paleontologist
• Glaciologist
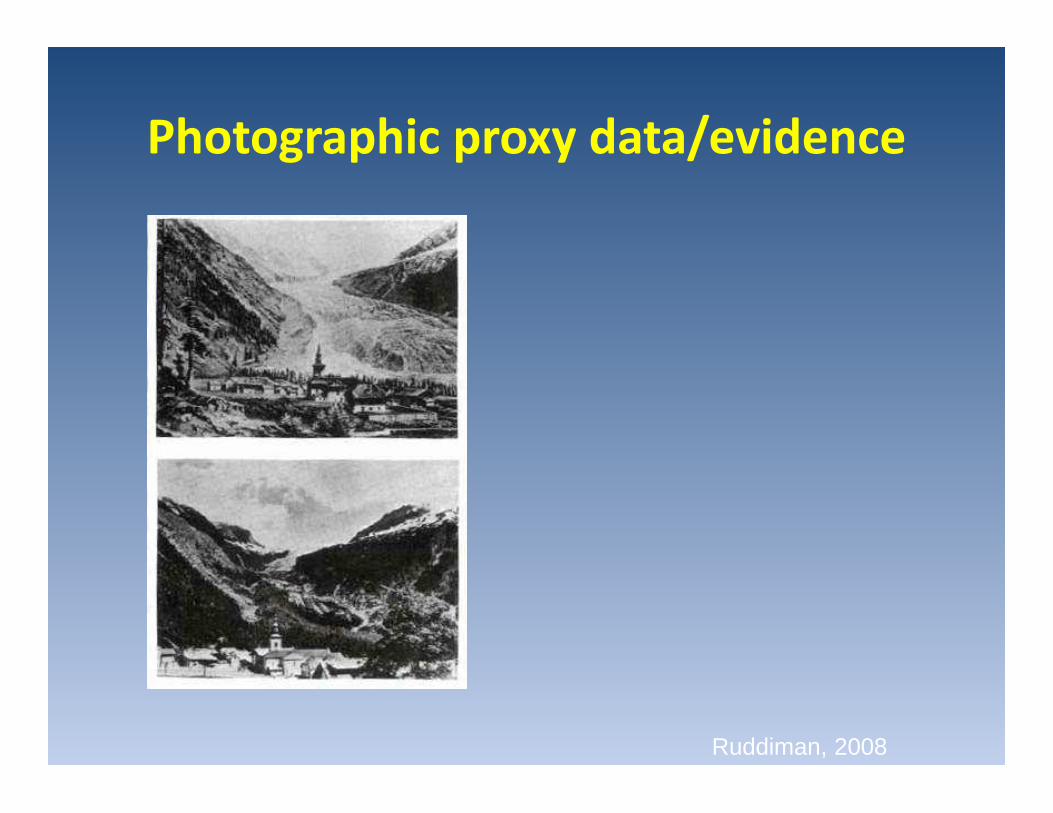
Photographic proxy data/evidence
Ruddiman, 2008
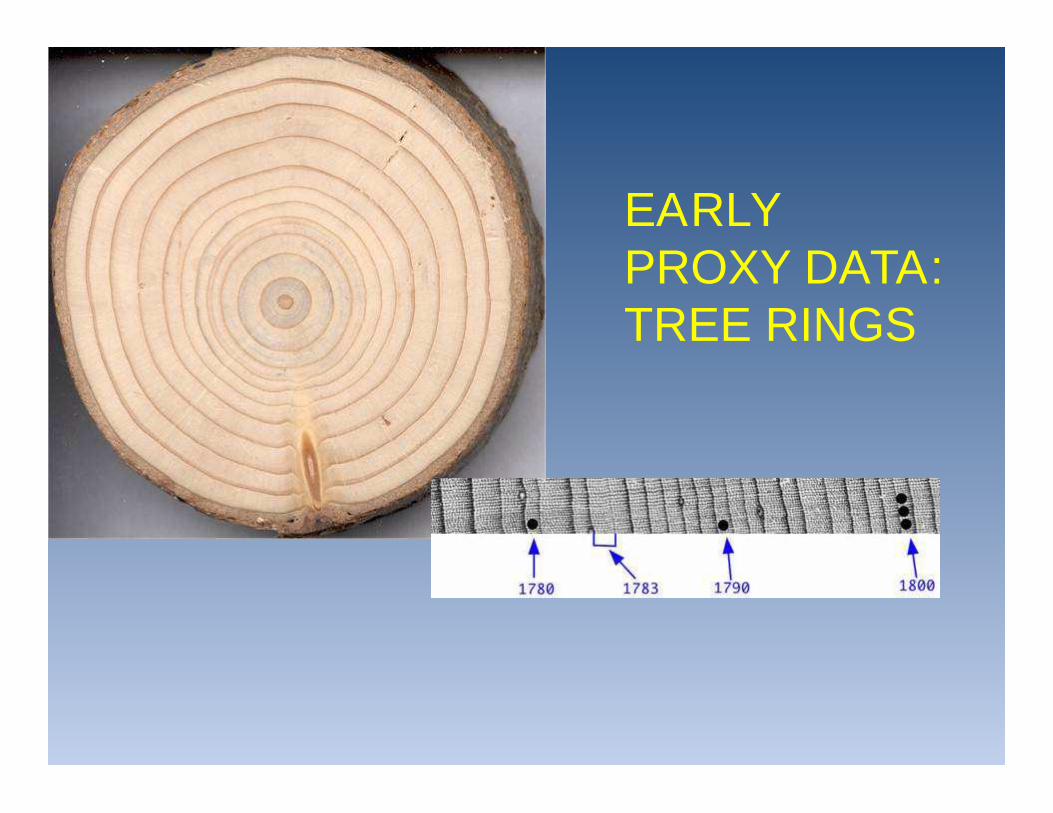
EARLYPROXY DATA:TREE RINGS
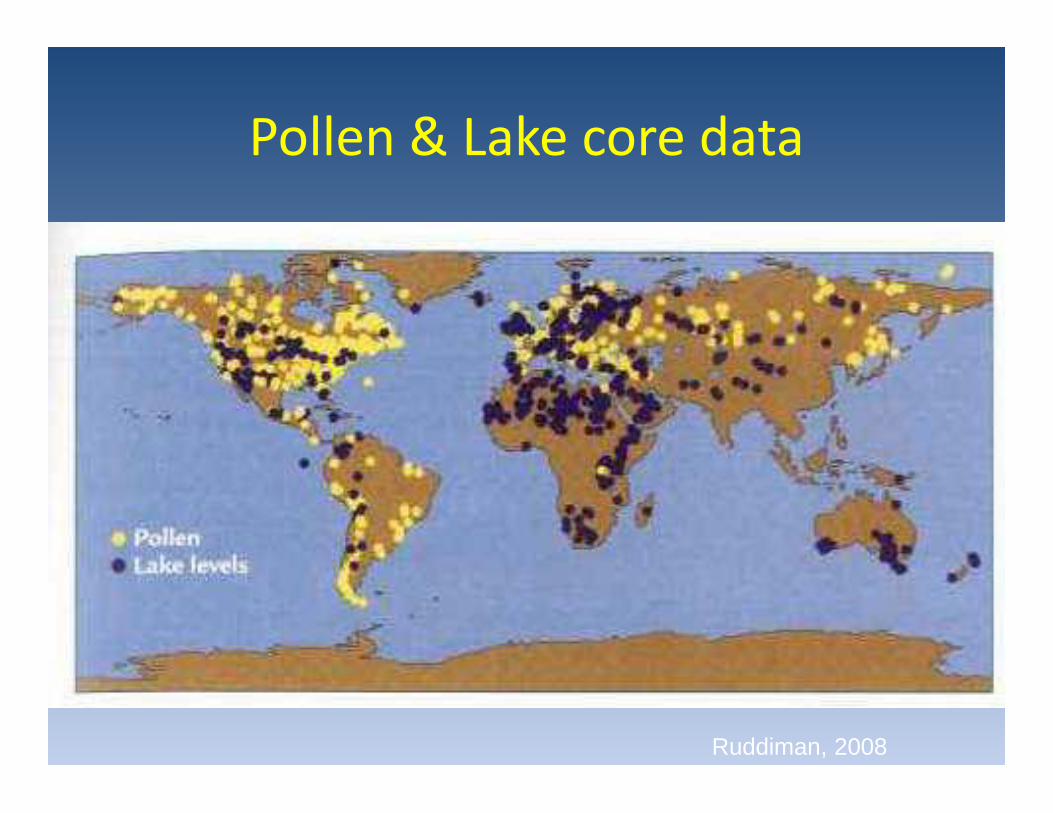
Pollen & Lake core data
Ruddiman, 2008

PROXY DATA:POLLEN DATA
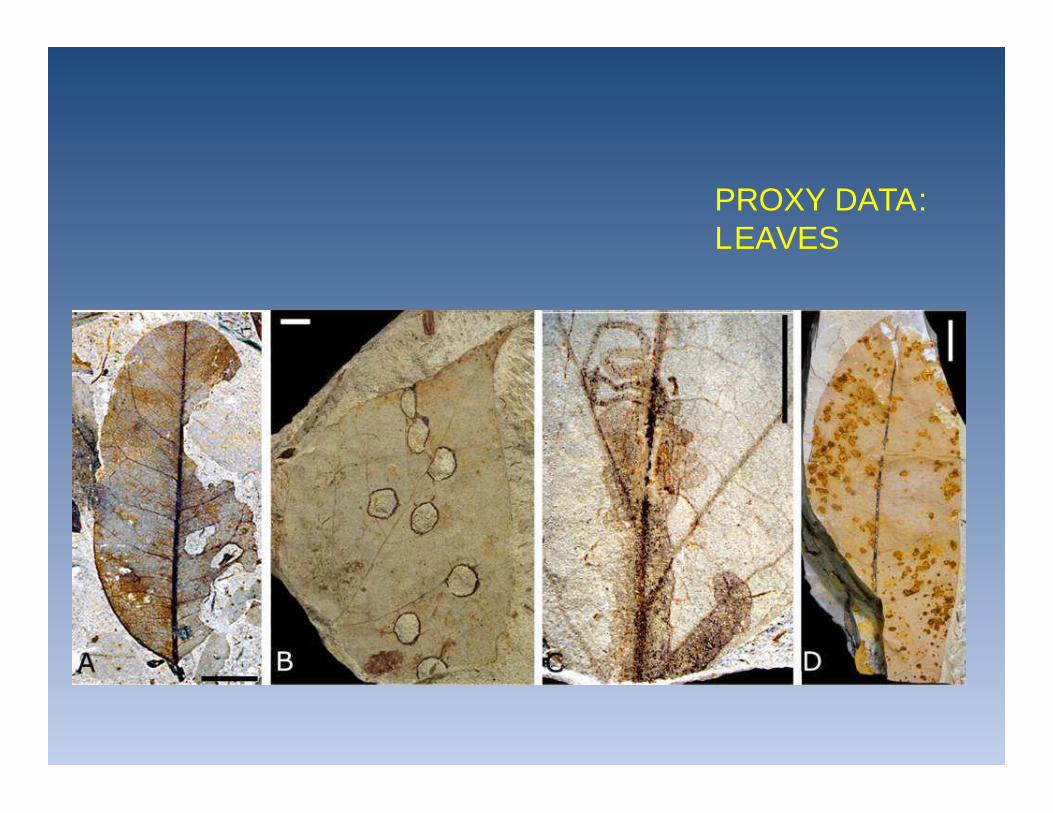
PROXY DATA:LEAVES
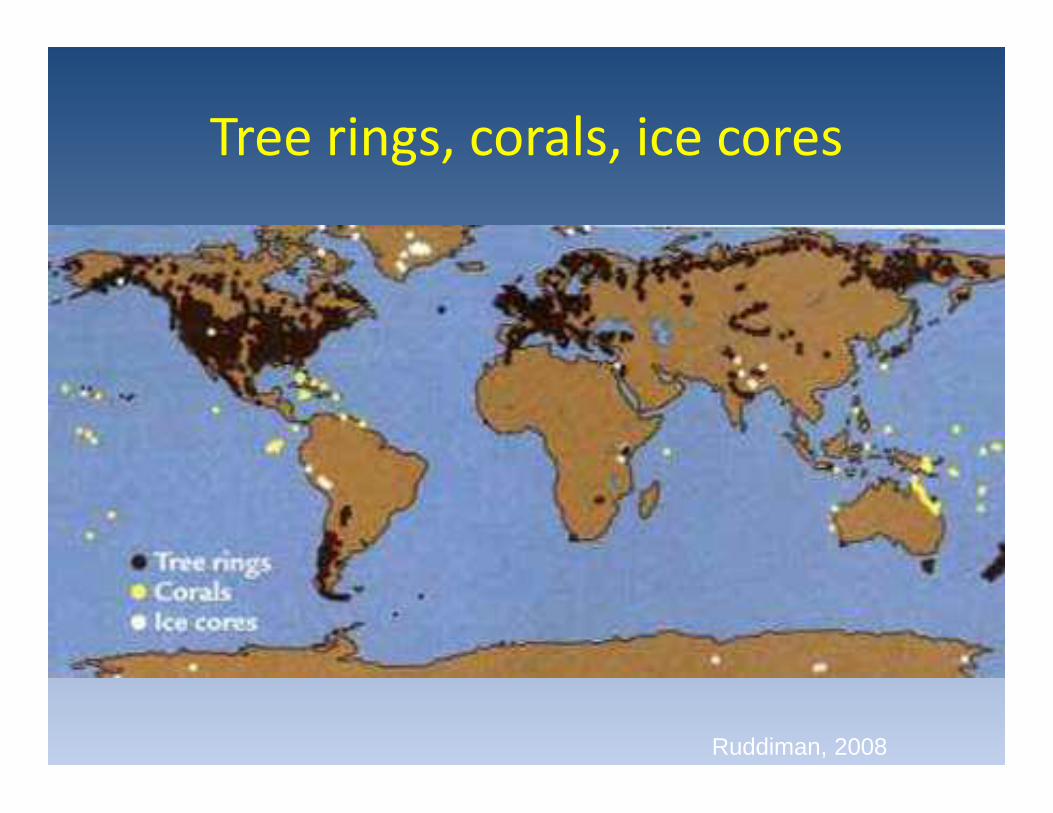
Tree rings, corals, ice cores
Ruddiman, 2008
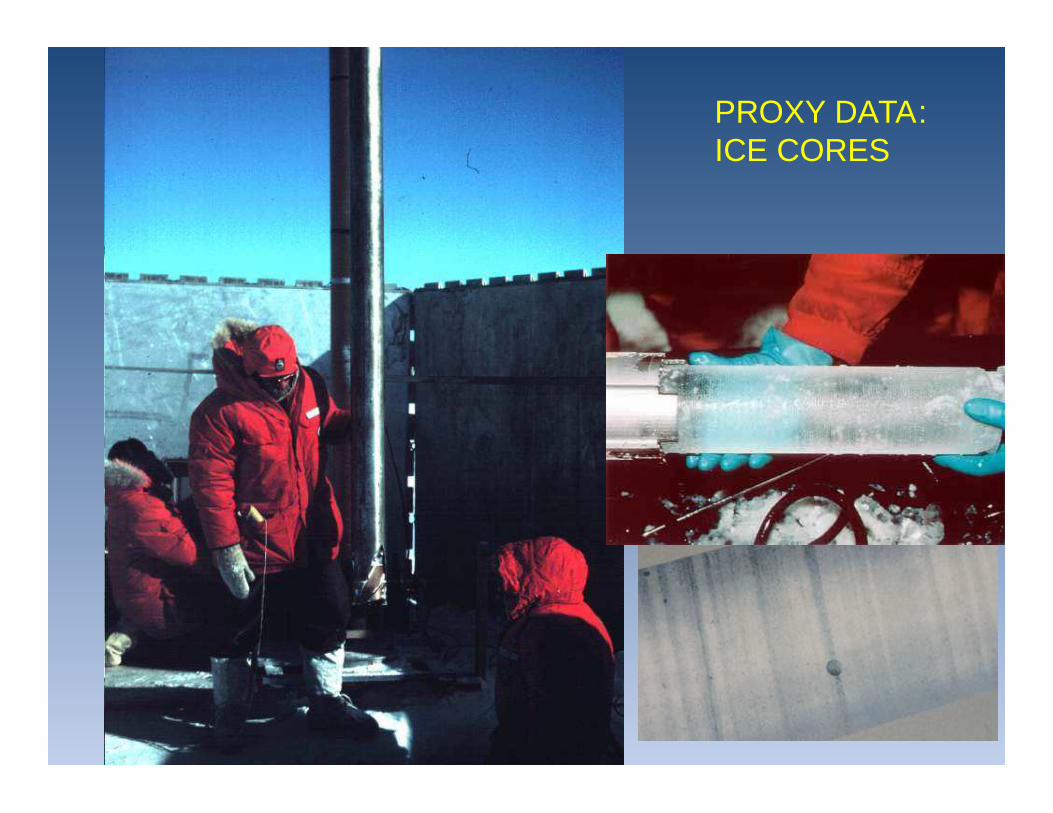
PROXY DATA:ICE CORES
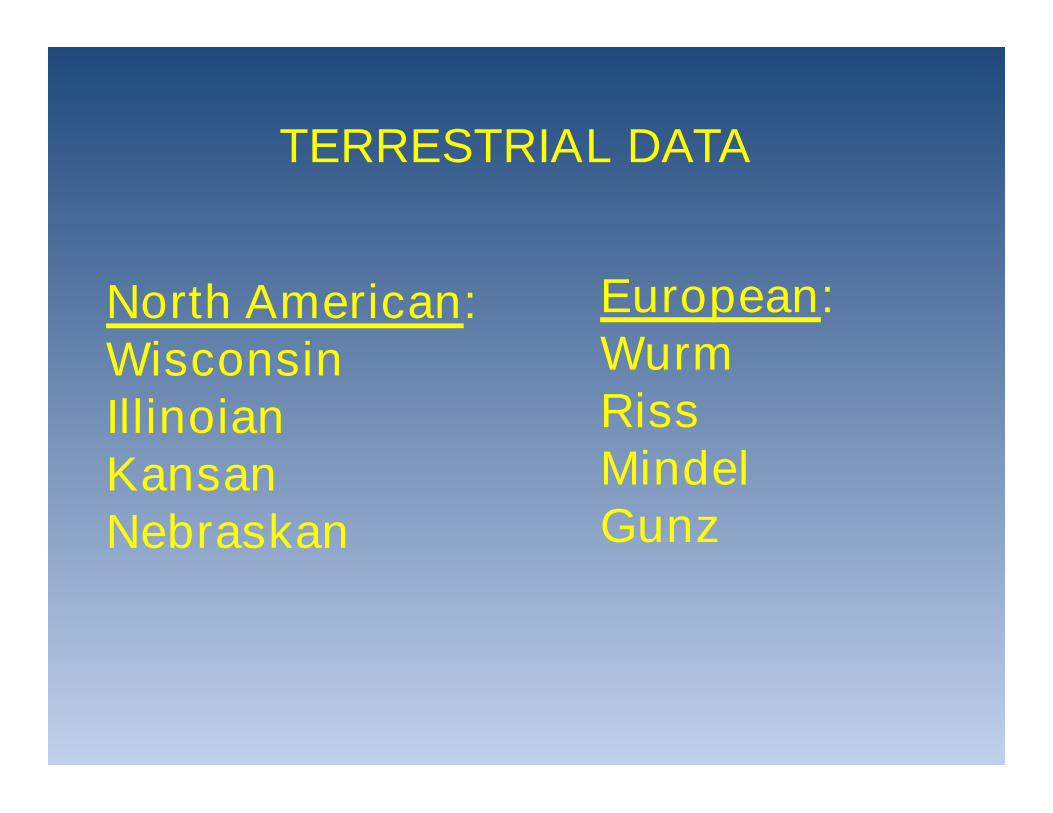
TERRESTRIAL DATA
North American:WisconsinIllinoianKansanNebraskan
European:WurmRissMindelGunz
LATER EVIDENCE CAME FROMTHE MARINE RECORD
NOT WITHOUT IT’S PROBLEMS,BUT MORE COMPLETE
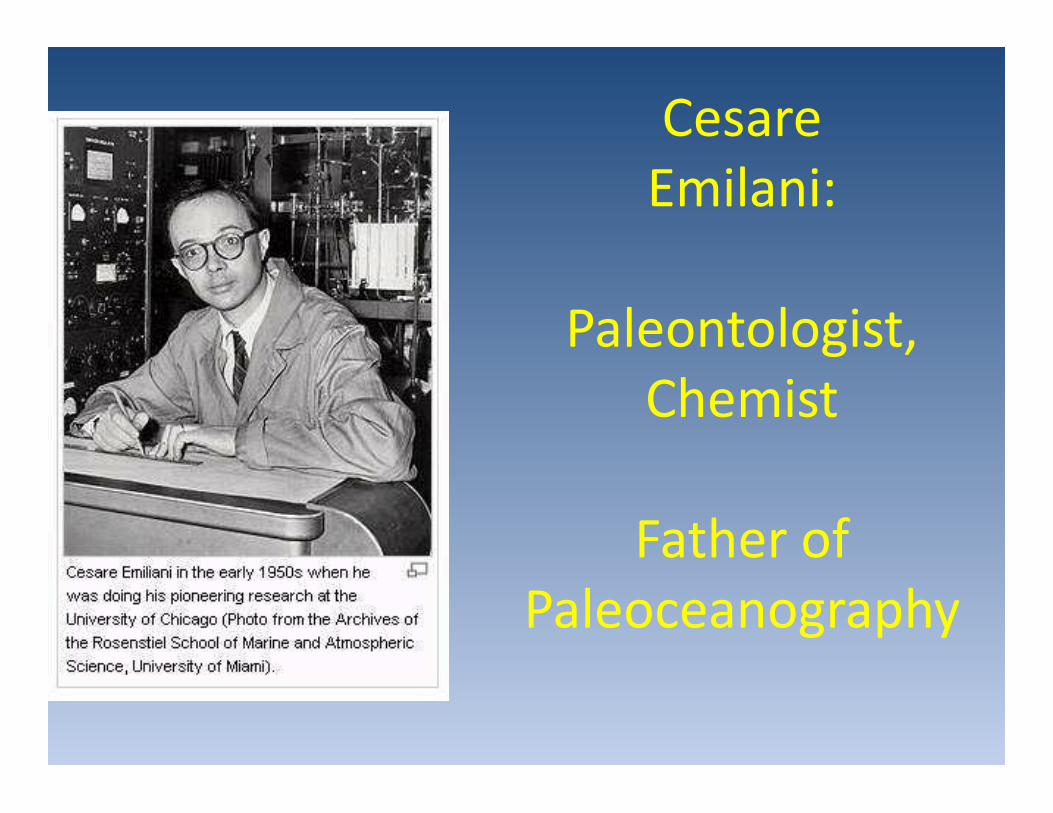
CesareEmilani:
Paleontologist,Chemist
Father ofPaleoceanography
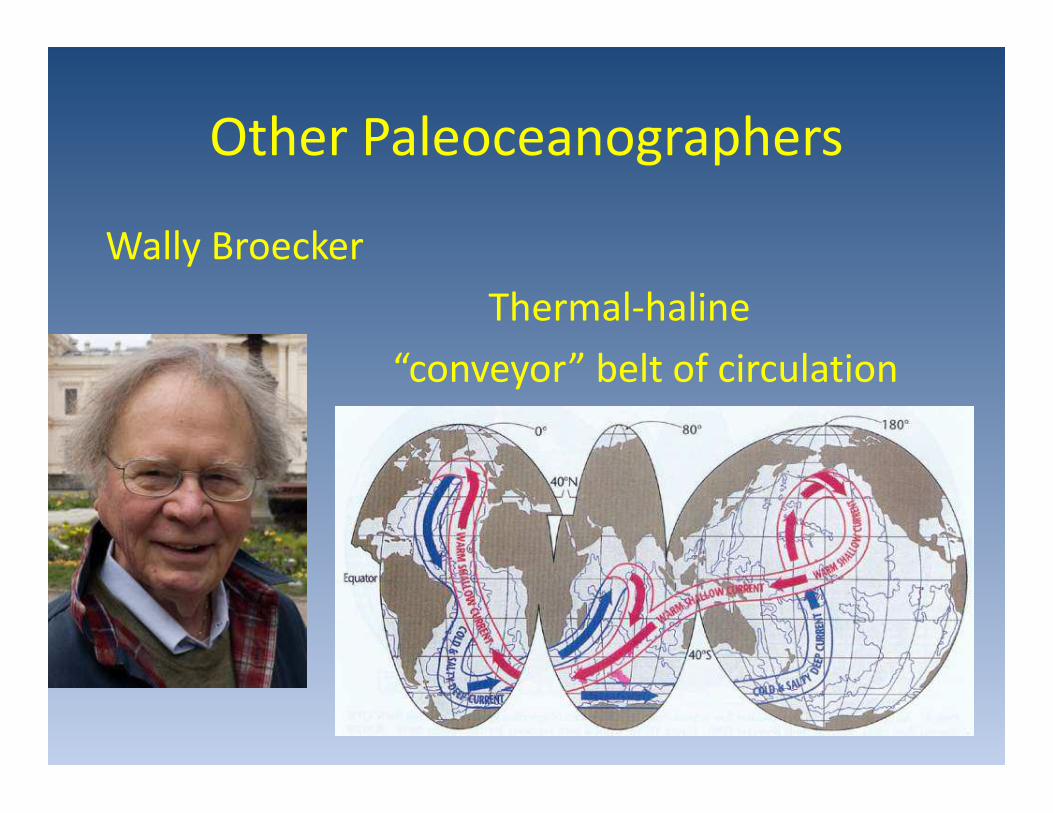
Other Paleoceanographers
Wally Broecker
Thermal-haline
“conveyor” belt of circulation
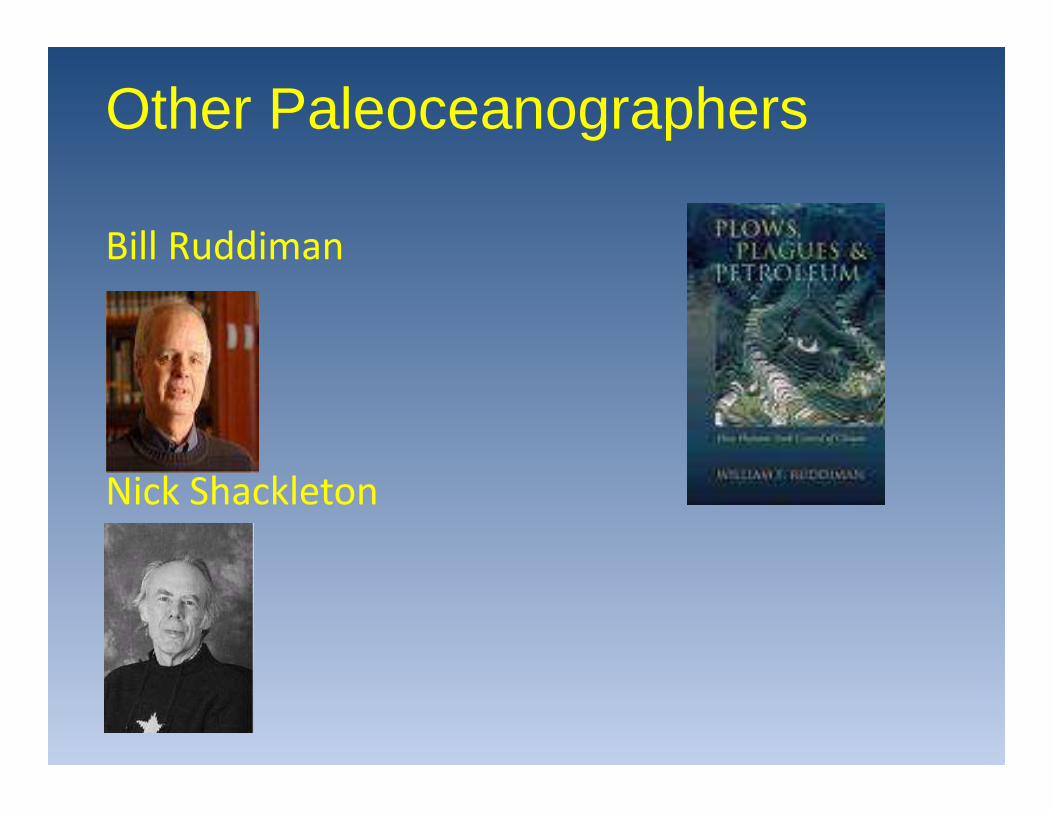
Bill Ruddiman
Nick Shackleton
Other Paleoceanographers
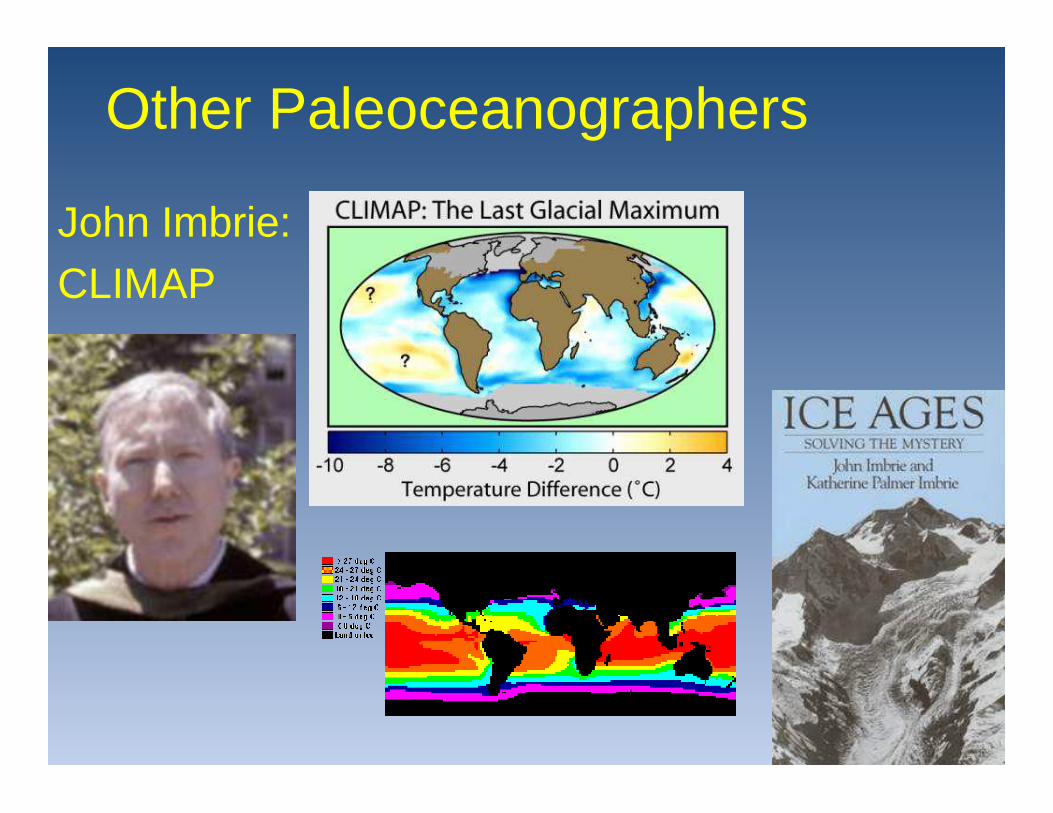
Other Paleoceanographers
John Imbrie:
CLIMAP

PROXY DATA:CORE DATA
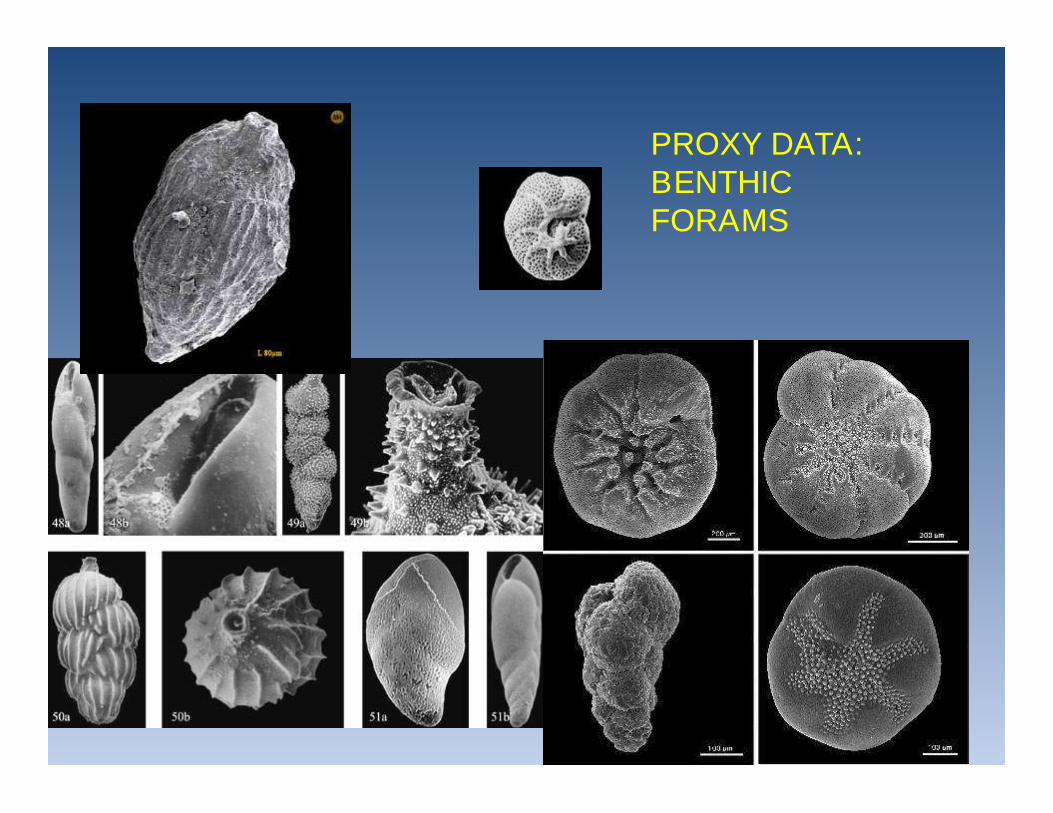
PROXY DATA:BENTHICFORAMS
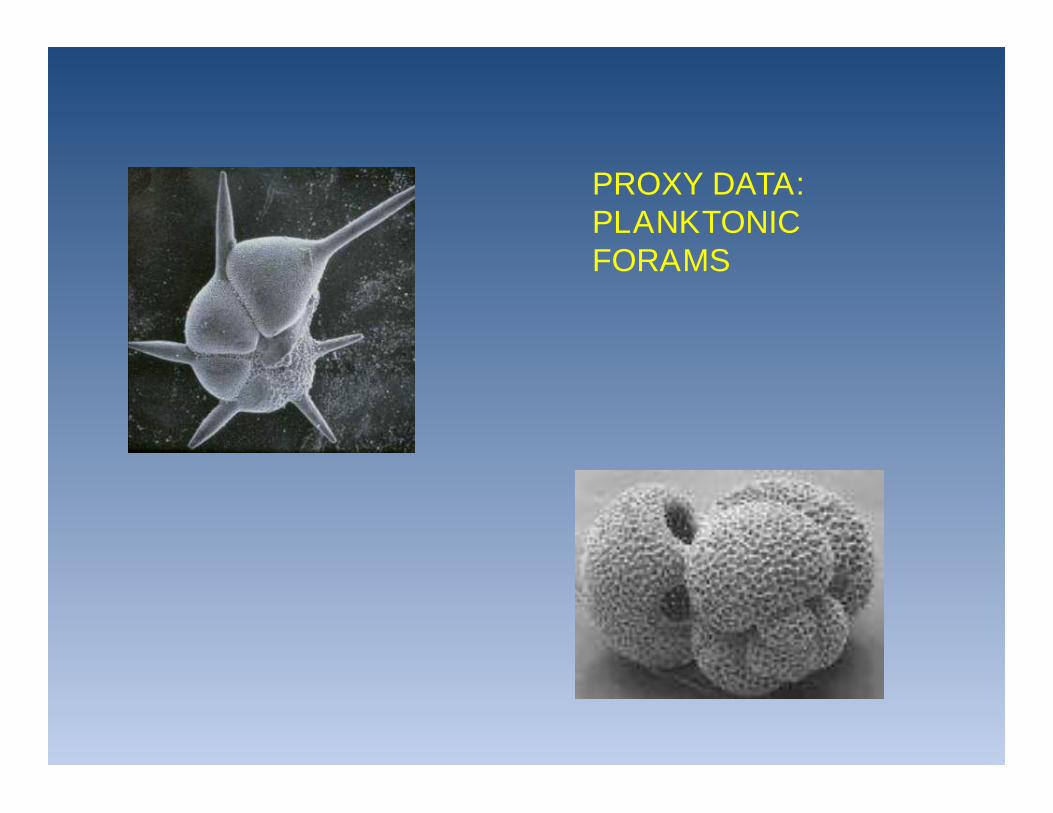
PROXY DATA:PLANKTONICFORAMS
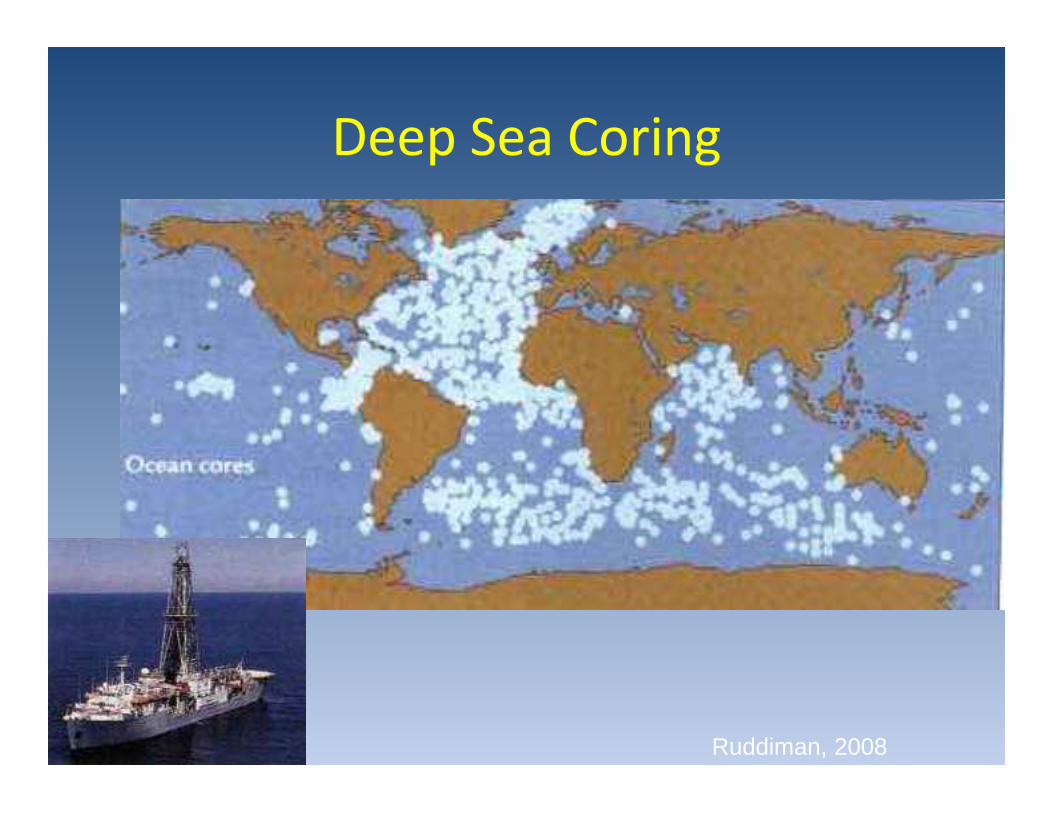
Deep Sea Coring
Ruddiman, 2008
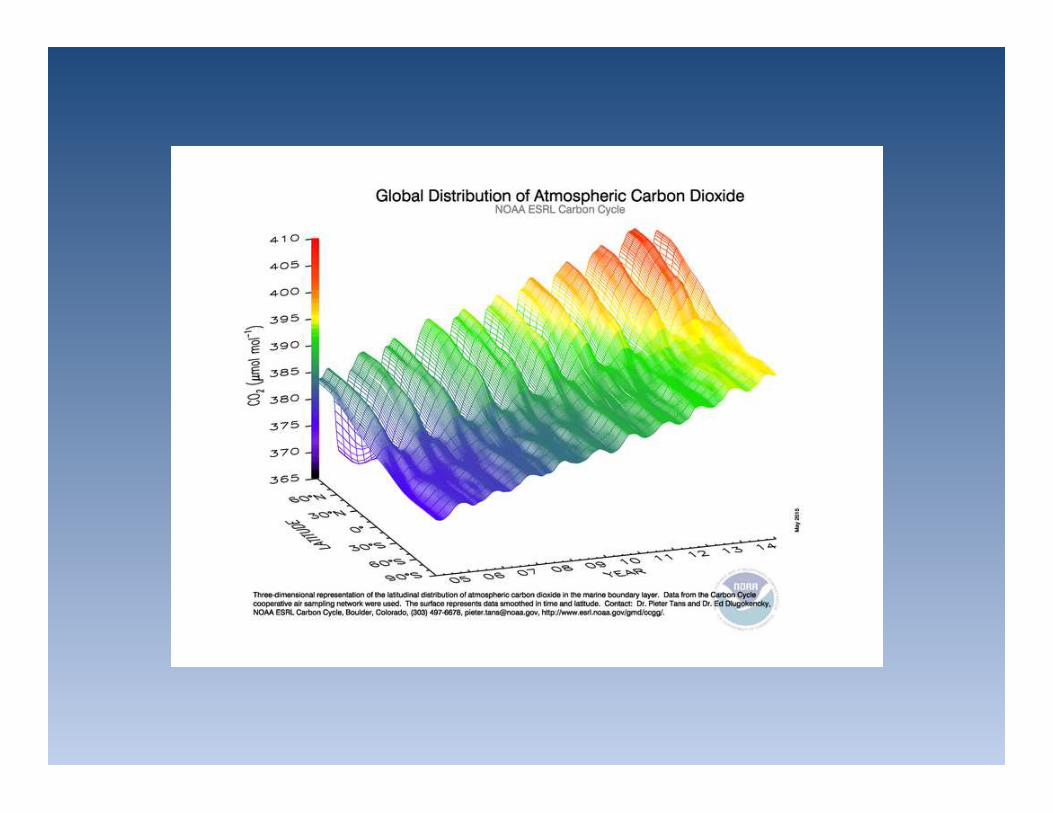
Empirical: real measured data
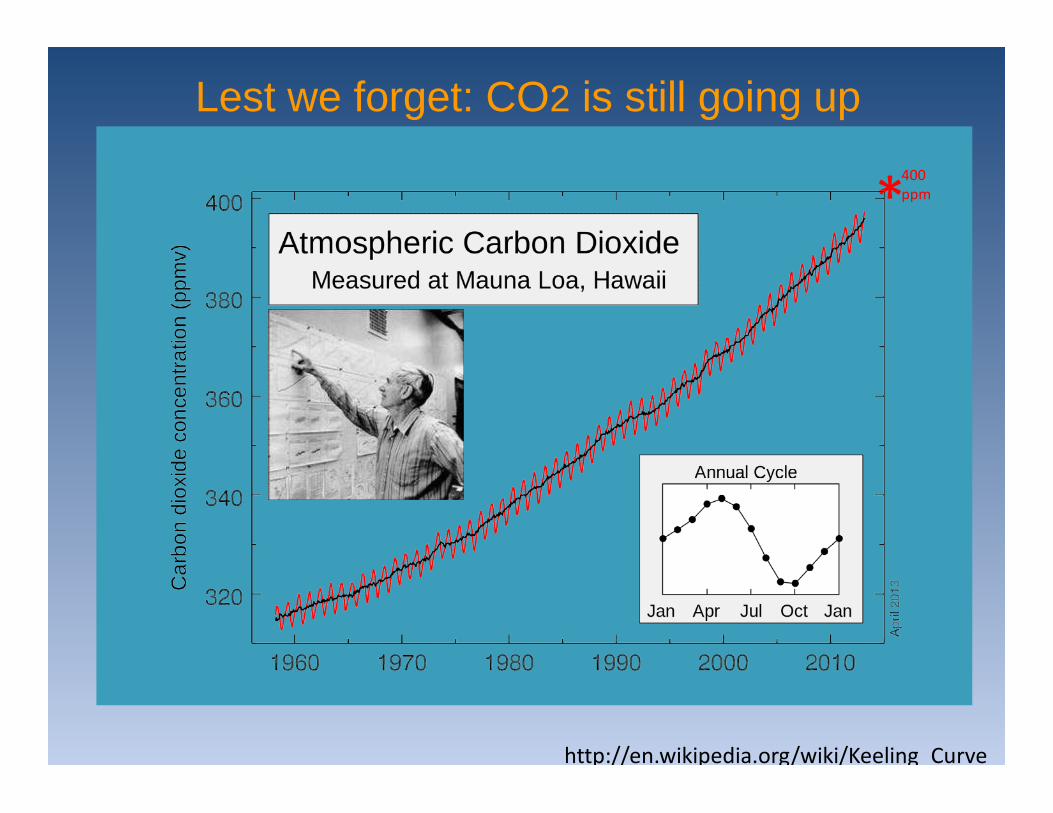
*400ppm
http://en.wikipedia.org/wiki/Keeling_Curve
Lest we forget: CO2 is still going up
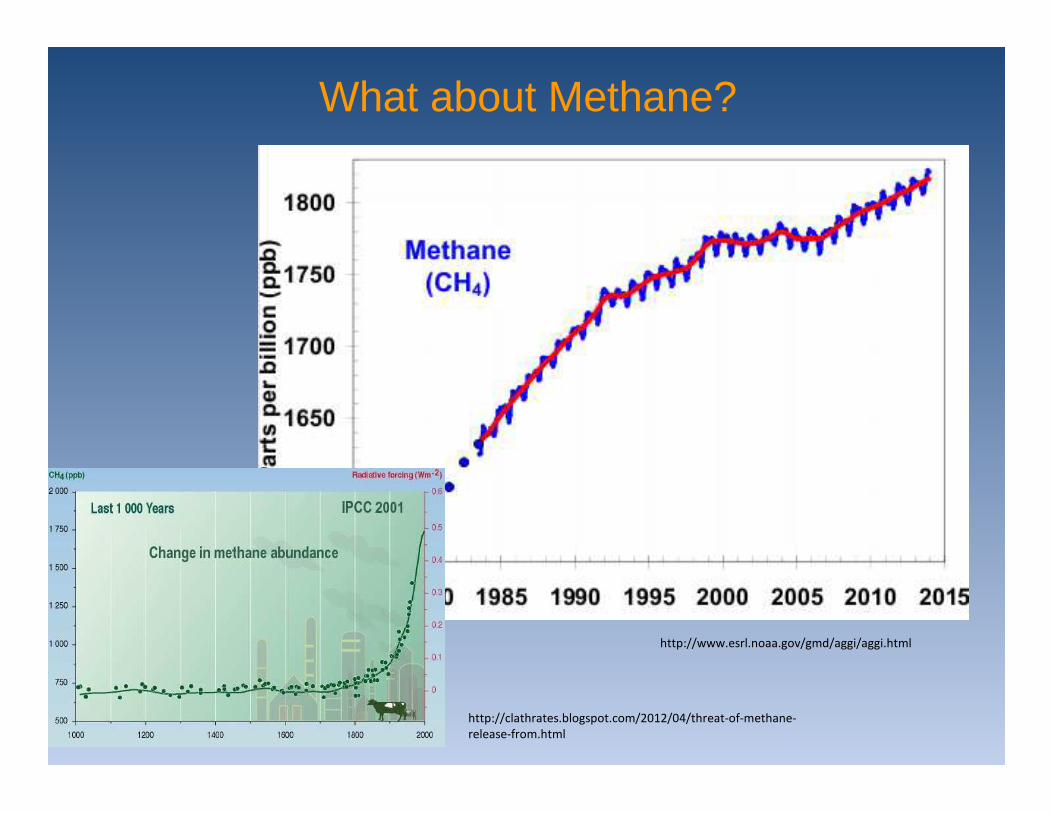
What about Methane?
http://clathrates.blogspot.com/2012/04/threat-of-methane-release-from.html
http://www.esrl.noaa.gov/gmd/aggi/aggi.html
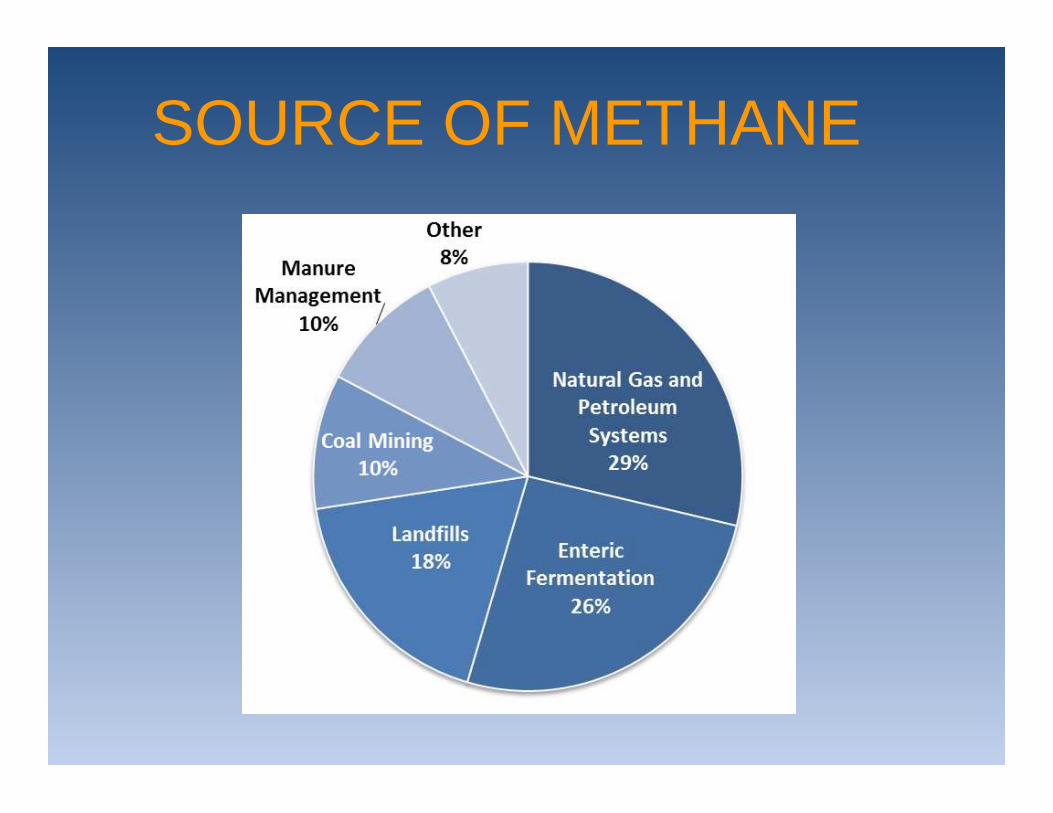
SOURCE OF METHANE
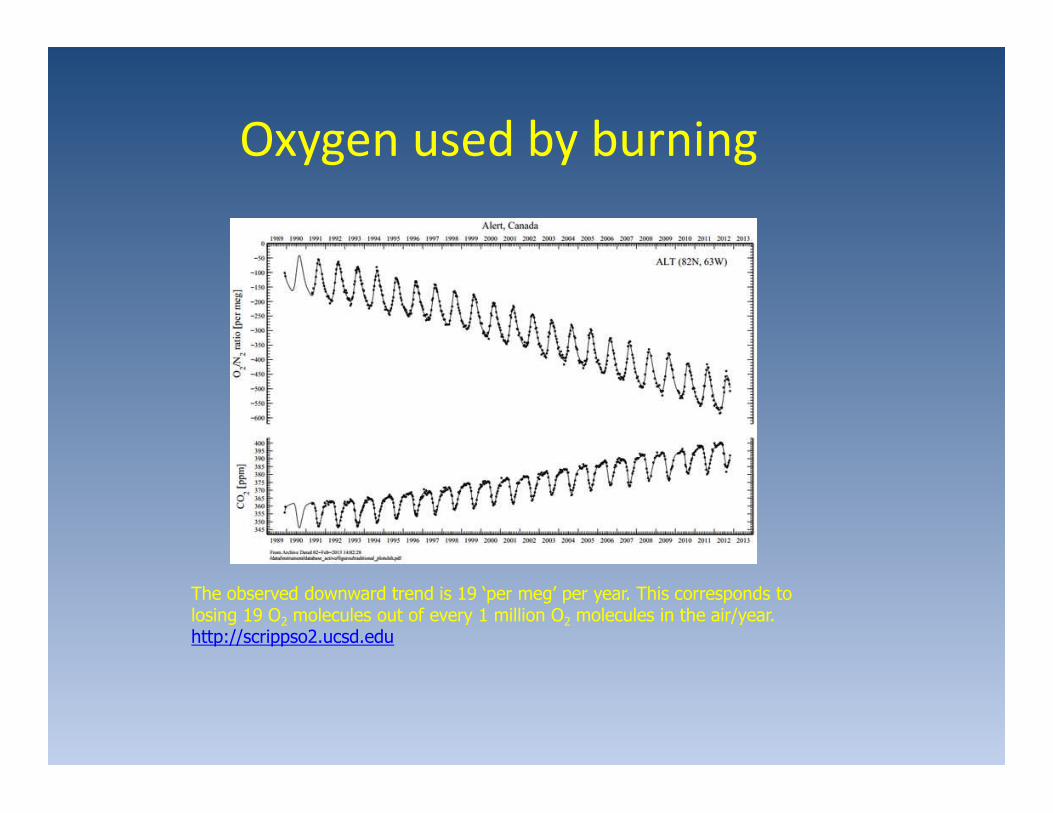
Oxygen used by burning
The observed downward trend is 19 ‘per meg’ per year. This corresponds tolosing 19 O2 molecules out of every 1 million O2 molecules in the air/year.http://scrippso2.ucsd.edu
4. Ocean Acidification
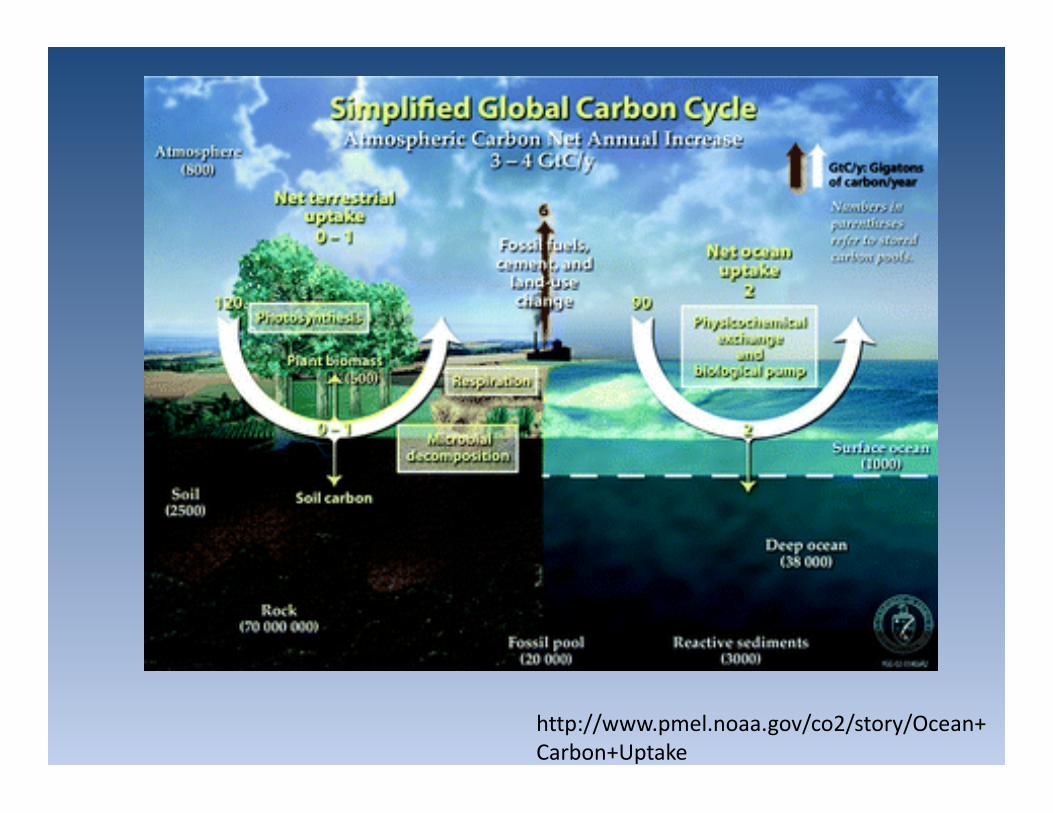
http://www.pmel.noaa.gov/co2/story/Ocean+Carbon+Uptake
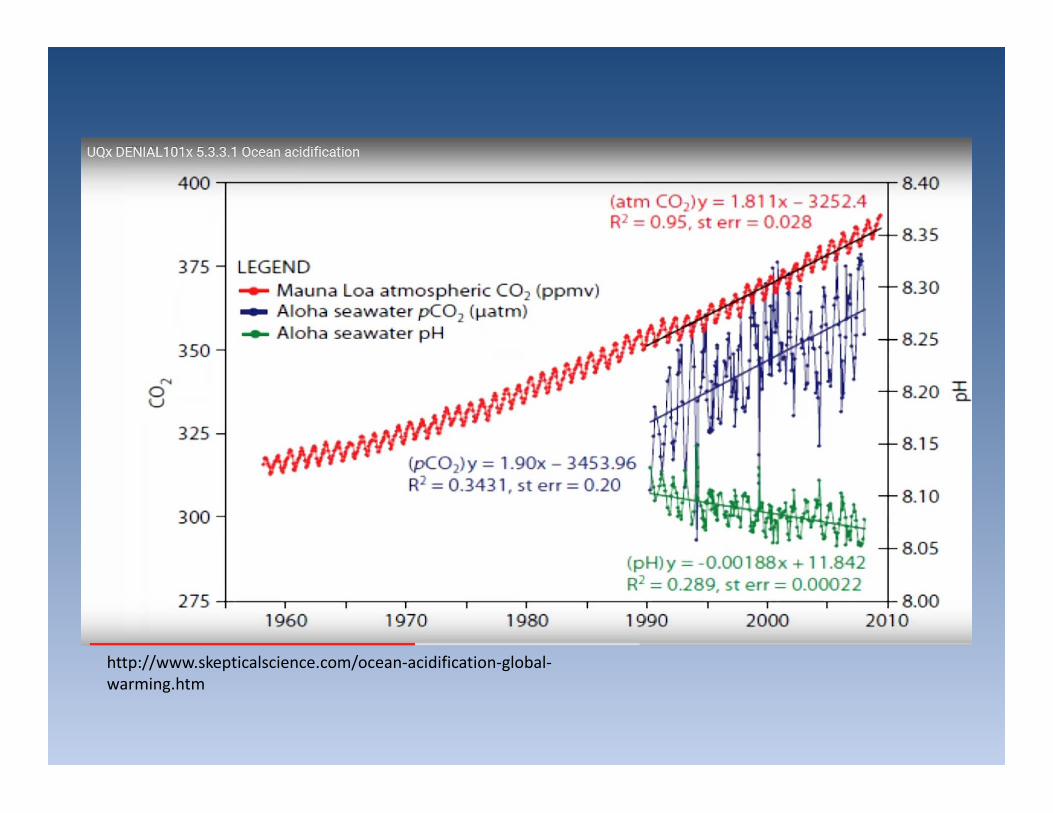
Ocean acidification
• Web page post Monday October , 2015 (andfb)
• Let’s start with a video:https://youtu.be/W1TZ8g8JYVU fromhttp://www.skepticalscience.com/ocean-acidification-global-warming.htm
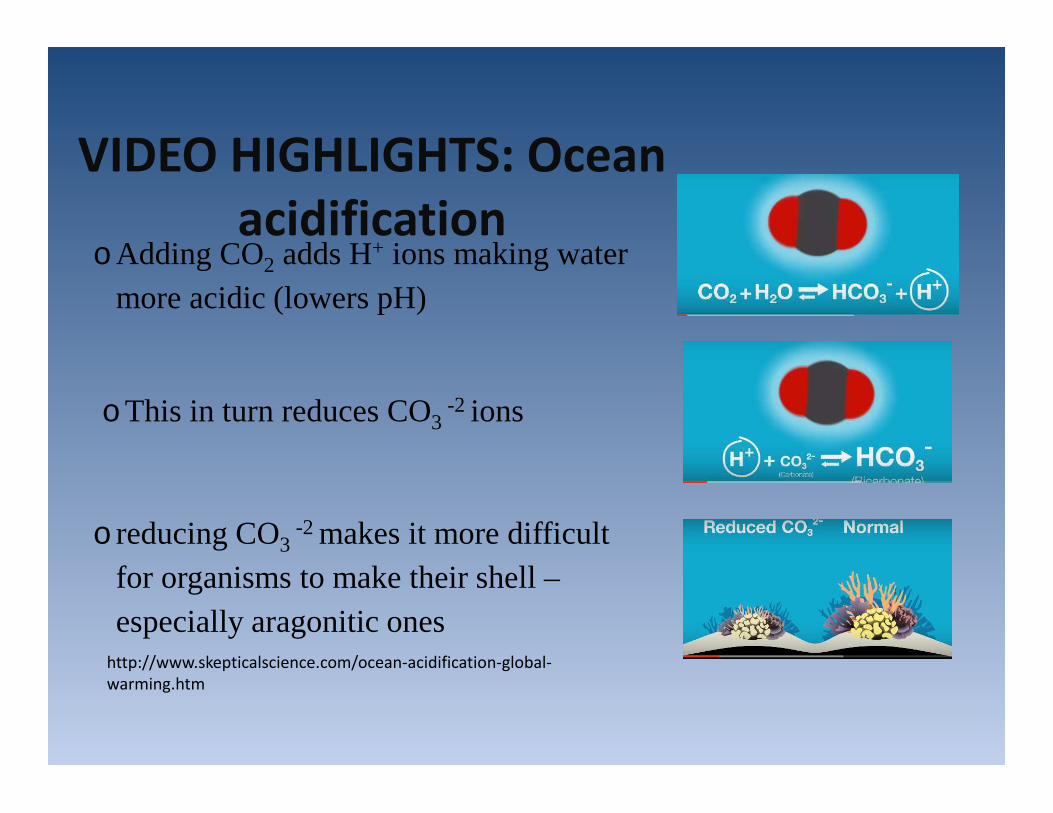
VIDEO HIGHLIGHTS: Oceanacidification
oAdding CO2 adds H+ ions making water
more acidic (lowers pH)
oThis in turn reduces CO3-2 ions
o reducing CO3-2 makes it more difficult
for organisms to make their shell –
especially aragonitic oneshttp://www.skepticalscience.com/ocean-acidification-global-warming.htm
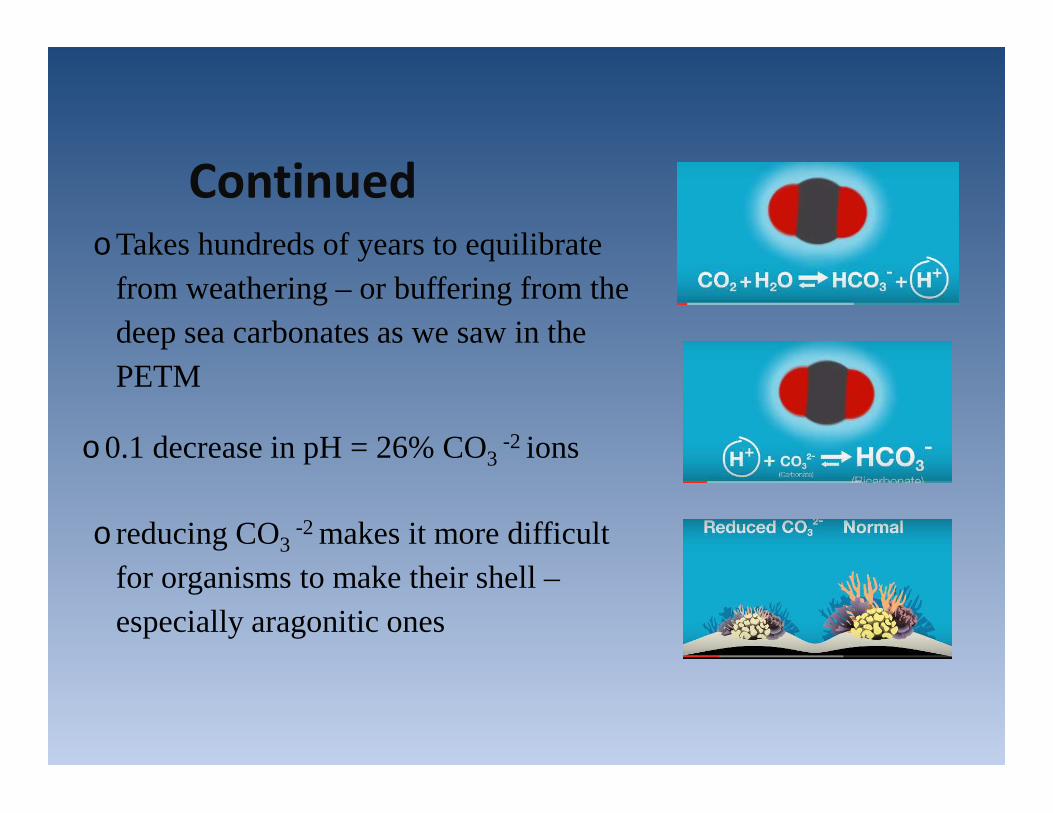
ContinuedoTakes hundreds of years to equilibrate
from weathering – or buffering from the
deep sea carbonates as we saw in the
PETM
o0.1 decrease in pH = 26% CO3-2 ions
o reducing CO3-2 makes it more difficult
for organisms to make their shell –
especially aragonitic ones
http://www.skepticalscience.com/ocean-acidification-global-warming.htm
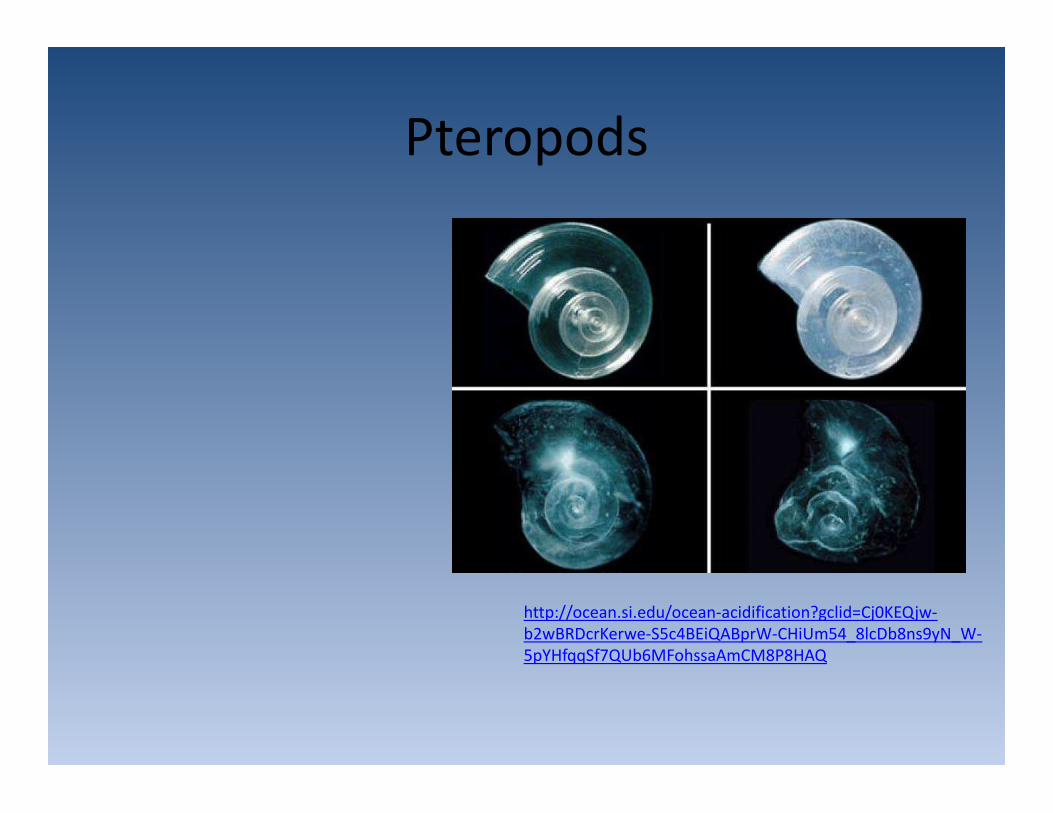
Pteropods
http://ocean.si.edu/ocean-acidification?gclid=Cj0KEQjw-b2wBRDcrKerwe-S5c4BEiQABprW-CHiUm54_8lcDb8ns9yN_W-5pYHfqqSf7QUb6MFohssaAmCM8P8HAQ
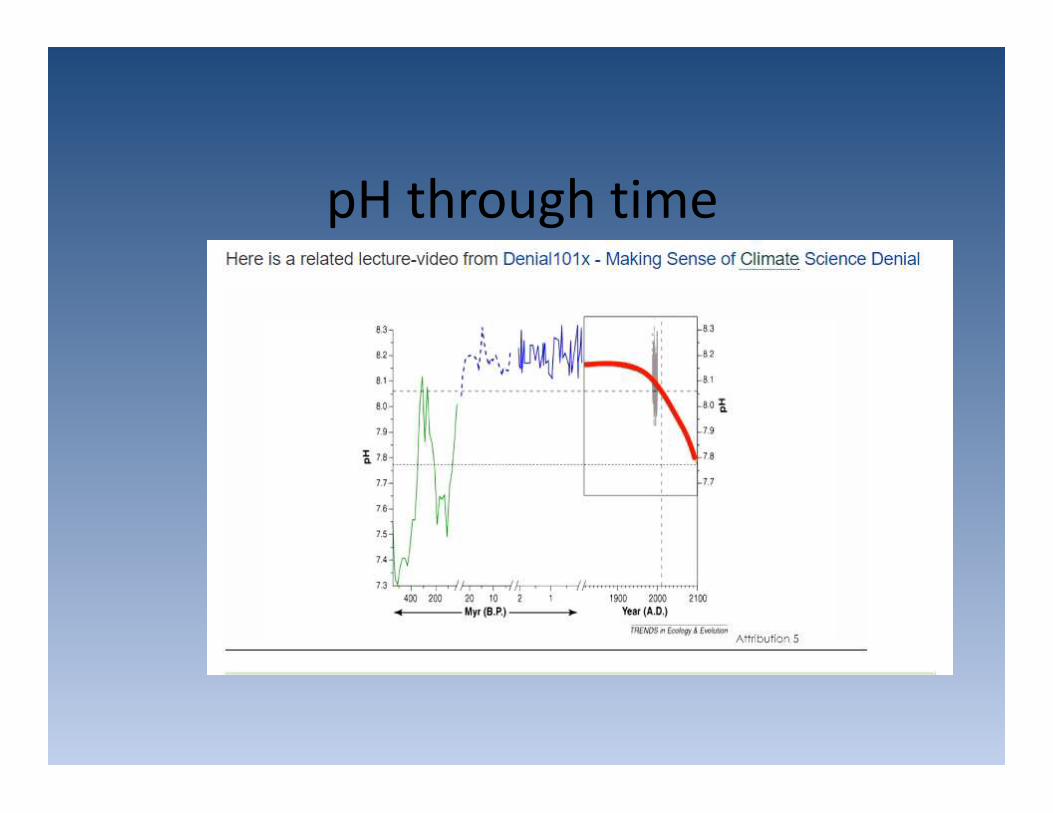
pH through time
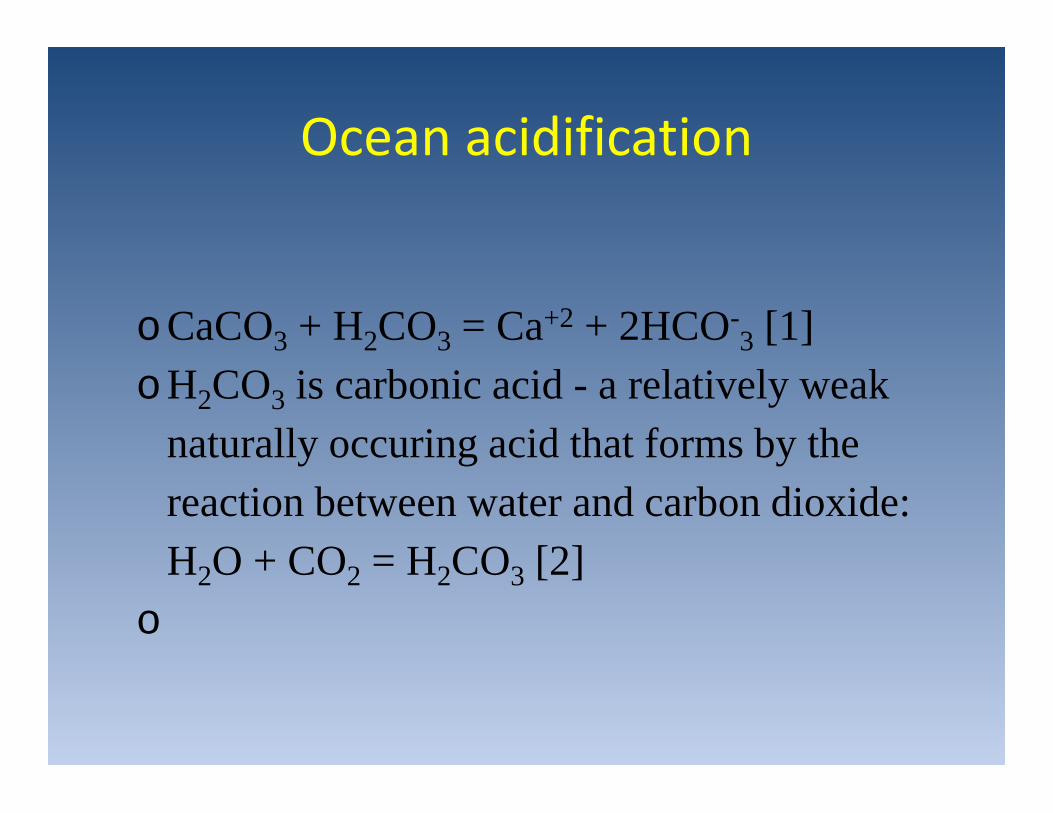
Ocean acidification
oCaCO3 + H2CO3 = Ca+2 + 2HCO-3 [1]
oH2CO3 is carbonic acid - a relatively weak
naturally occuring acid that forms by the
reaction between water and carbon dioxide:
H2O + CO2 = H2CO3 [2]
o
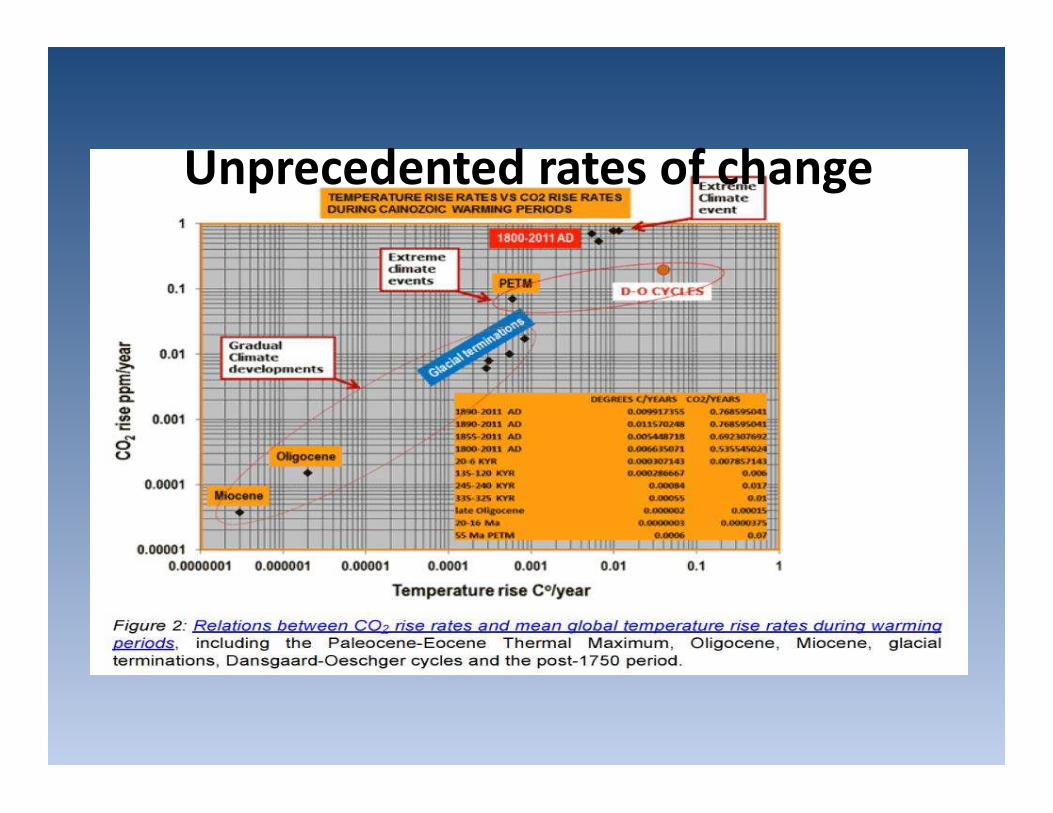
Unprecedented rates of change
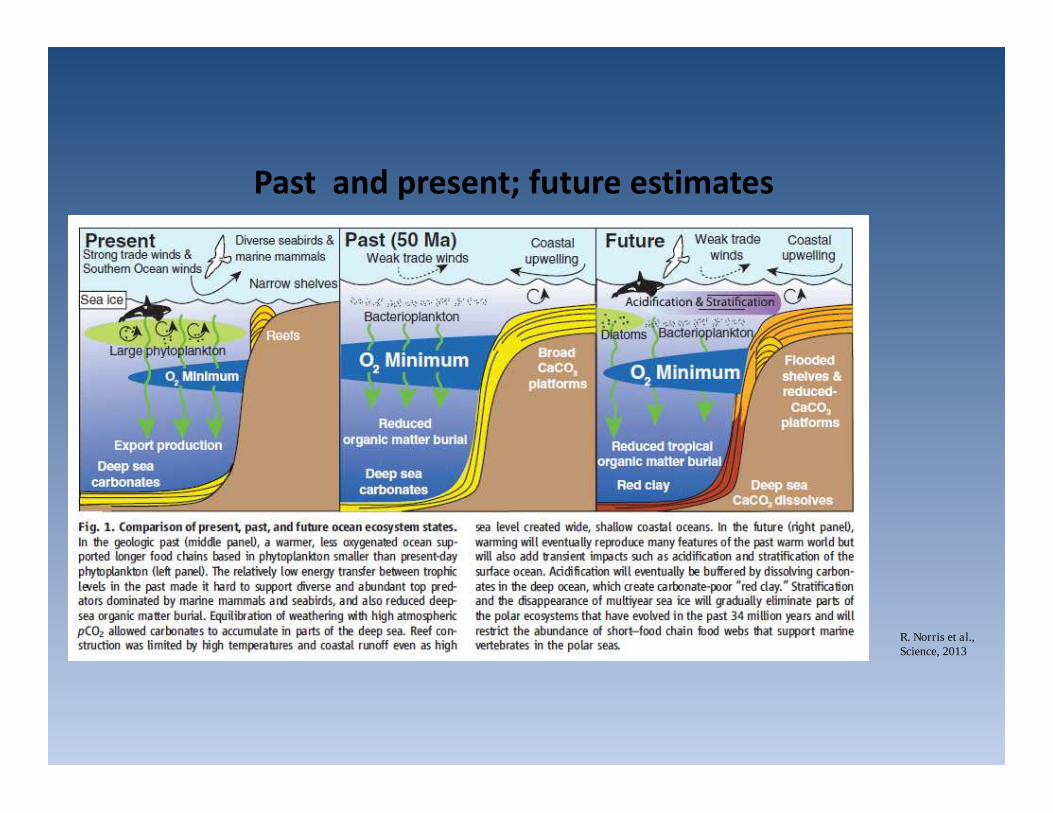
R. Norris et al.,Science, 2013
Past and present; future estimates
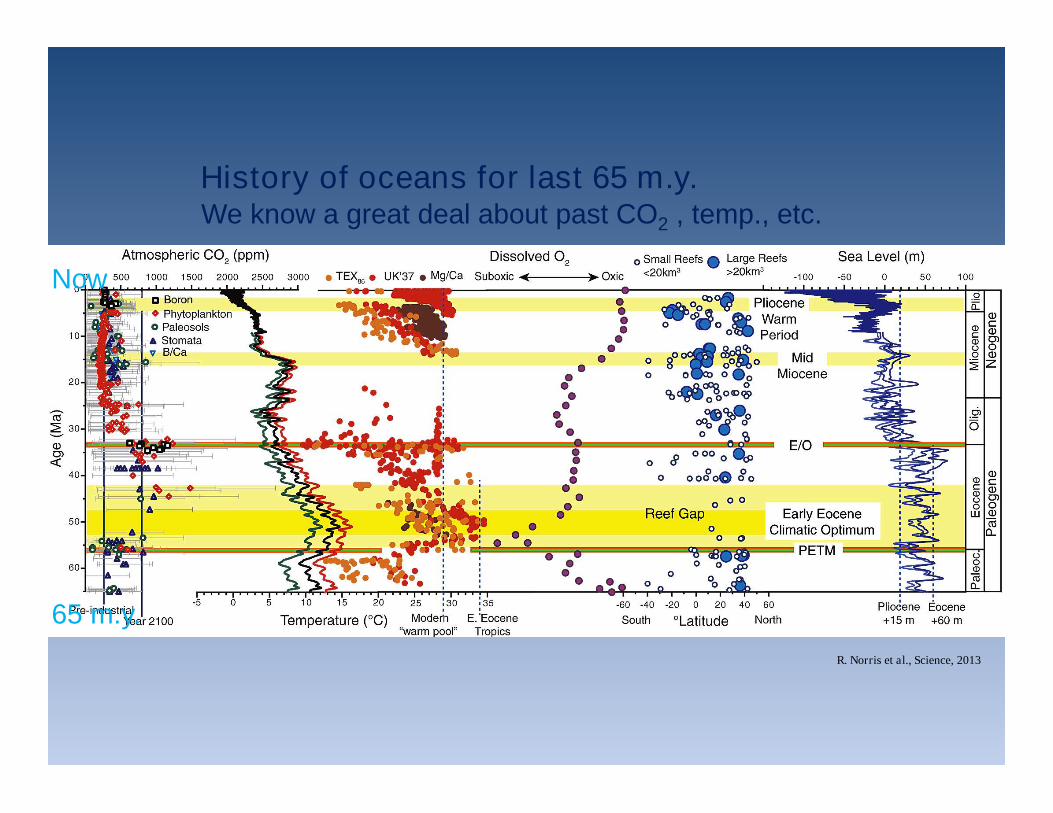
History of oceans for last 65 m.y.We know a great deal about past CO2 , temp., etc.
Now
65 m.y.
R. Norris et al., Science, 2013
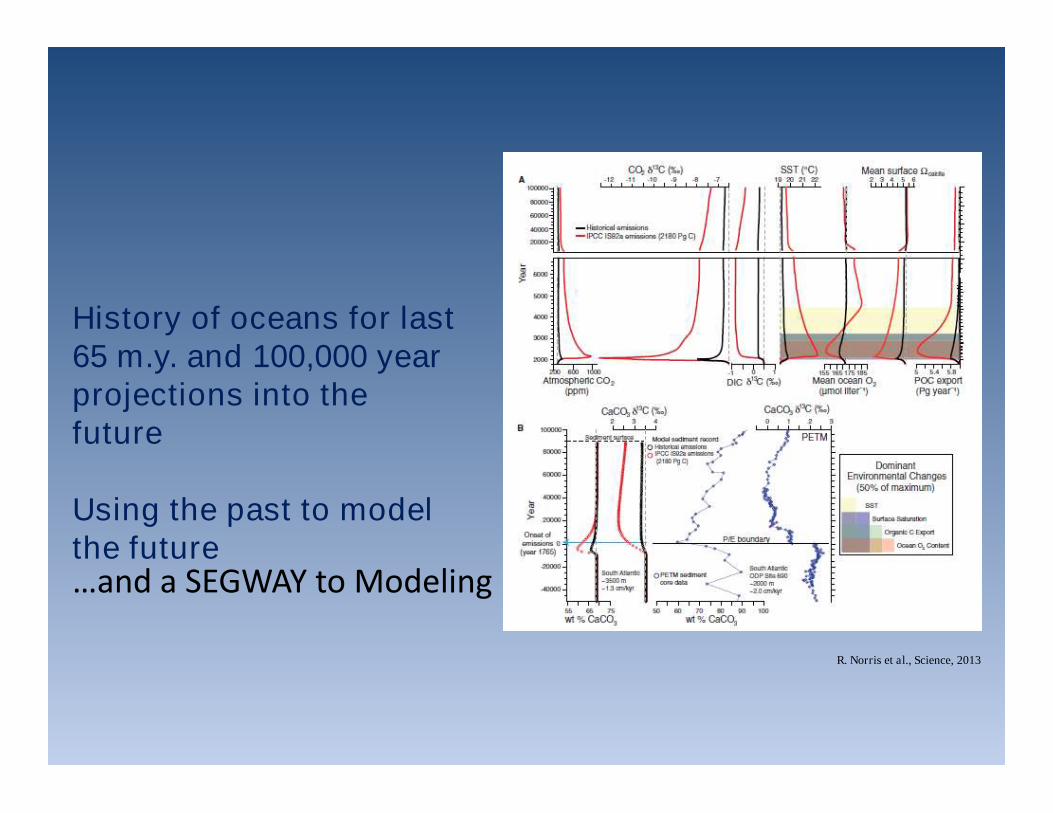
History of oceans for last65 m.y. and 100,000 yearprojections into thefuture
Using the past to modelthe future
R. Norris et al., Science, 2013
…and a SEGWAY to Modeling
http://www.skepticalscience.com/denial101x-videos-and-references.html
Full list of Videos from Skeptical Science
5. Modeling
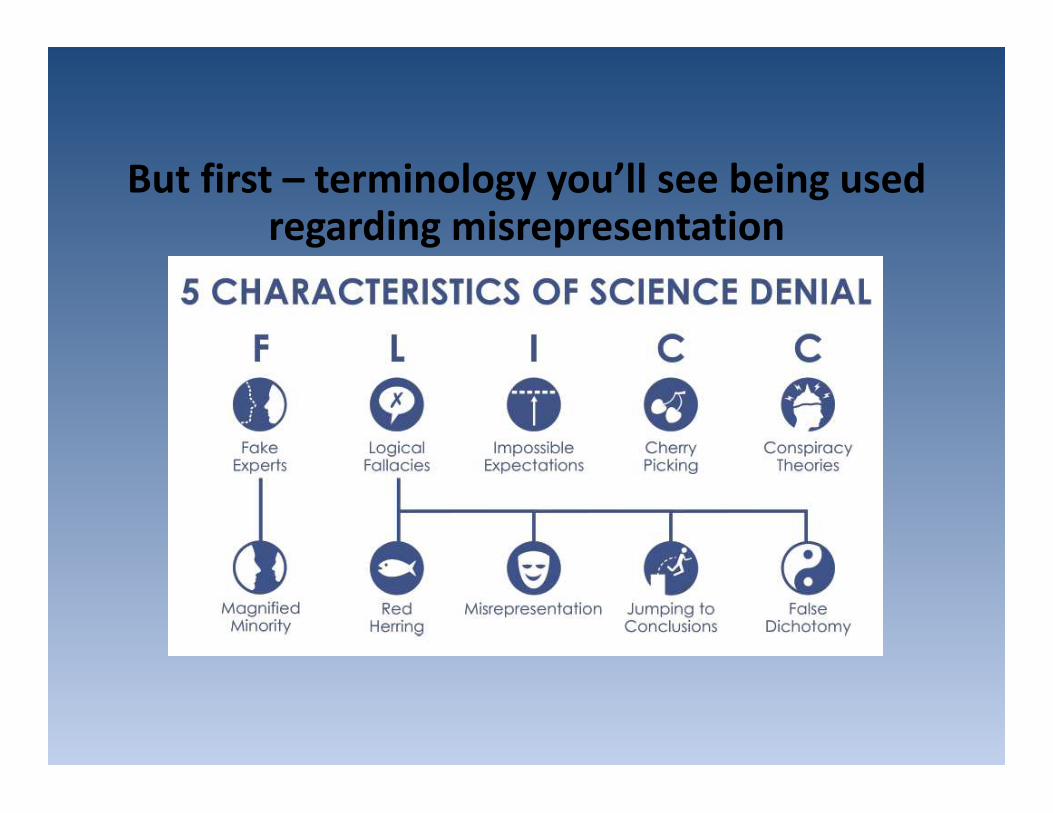
But first – terminology you’ll see being usedregarding misrepresentation
Models – 2 videos
Principles that models are built on – view todayhttps://www.youtube.com/watch?v=mYU2uawYPlE&feature=youtu.be
From the experts: Climate models – leaving it for you to view at yourleisure:https://www.youtube.com/watch?v=PZo1TYpsy2U&feature=youtu.be
NOAA’s Science On a Sphere (SOS)http://sos.noaa.gov/What_is_SOS/index.html ; used at DMNS whereI’ve been co-developing a climate change playlist, soon to be released.In the meantime seehttp://spaceodyssey.dmns.org/exhibitsprograms/interactives-exhibits/sos.aspx

http://www.skepticalscience.com/denial101x-videos-and-references.html
Full list of Videos from Skeptical Science
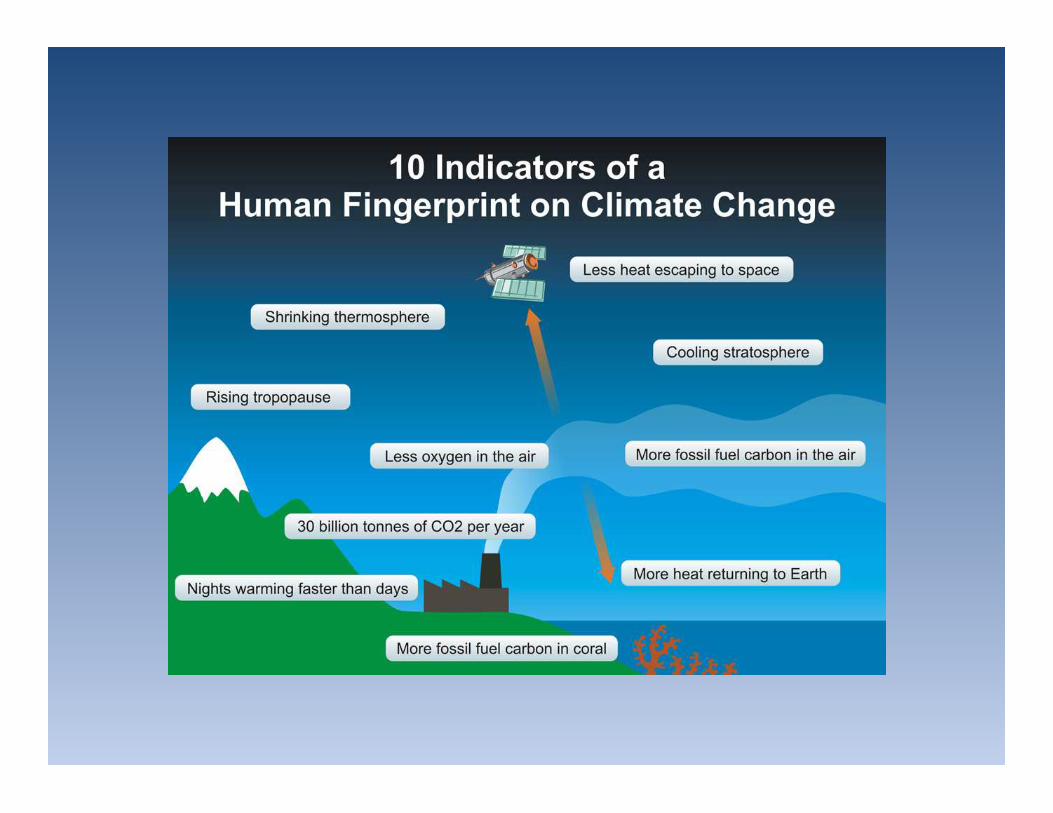
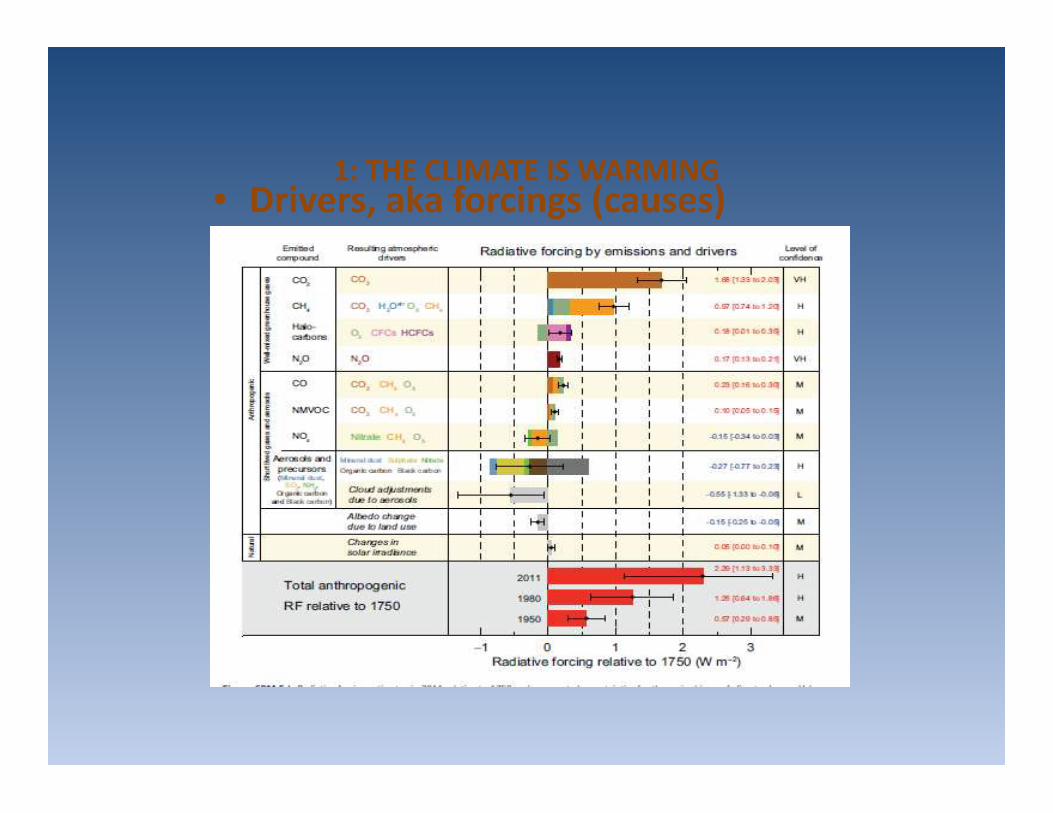
• Drivers, aka forcings (causes)1: THE CLIMATE IS WARMING
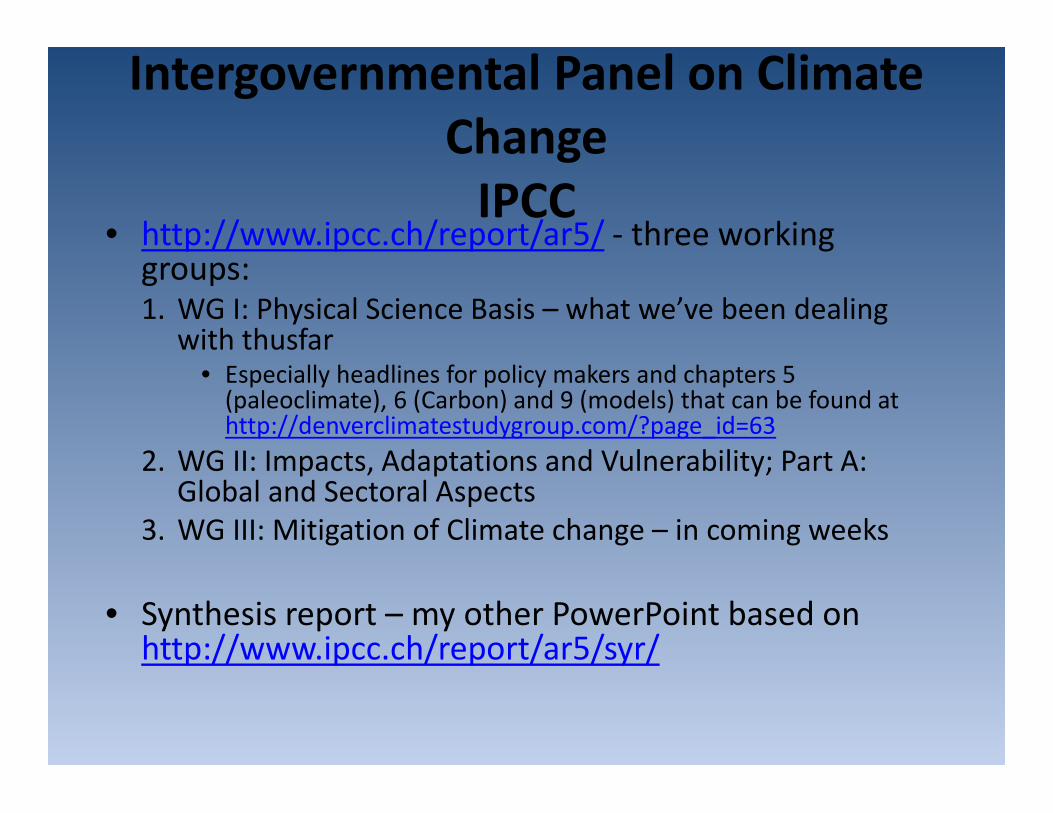
Intergovernmental Panel on ClimateChange
IPCC• http://www.ipcc.ch/report/ar5/ - three working
groups:1. WG I: Physical Science Basis – what we’ve been dealing
with thusfar• Especially headlines for policy makers and chapters 5
(paleoclimate), 6 (Carbon) and 9 (models) that can be found athttp://denverclimatestudygroup.com/?page_id=63
2. WG II: Impacts, Adaptations and Vulnerability; Part A:Global and Sectoral Aspects
3. WG III: Mitigation of Climate change – in coming weeks
• Synthesis report – my other PowerPoint based onhttp://www.ipcc.ch/report/ar5/syr/
• OR: Joint U.S. National Academy of Science and RoyalSociety 20-point summary: 20-point Climate-ChangeSummary (pdf) – summarized in the following 3 slides
Joint U.S. National Academy ofScience and Royal Society 20-point
summary:
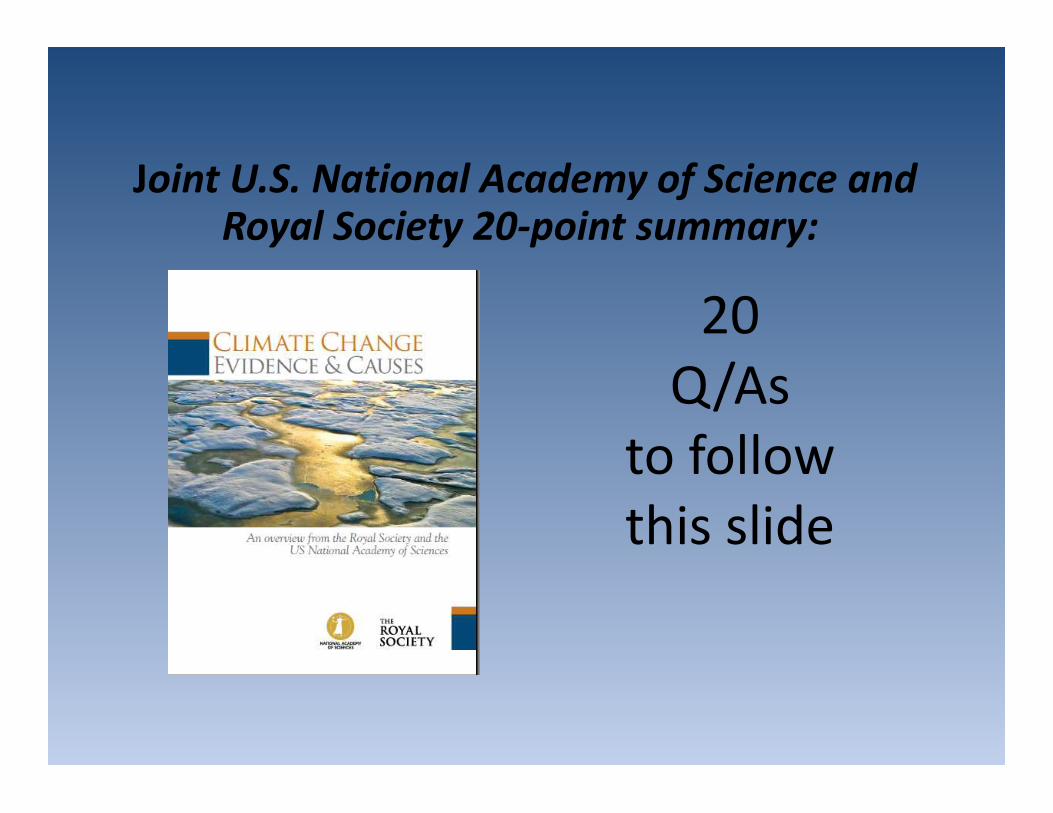
20Q/As
to followthis slide
Joint U.S. National Academy of Science andRoyal Society 20-point summary:
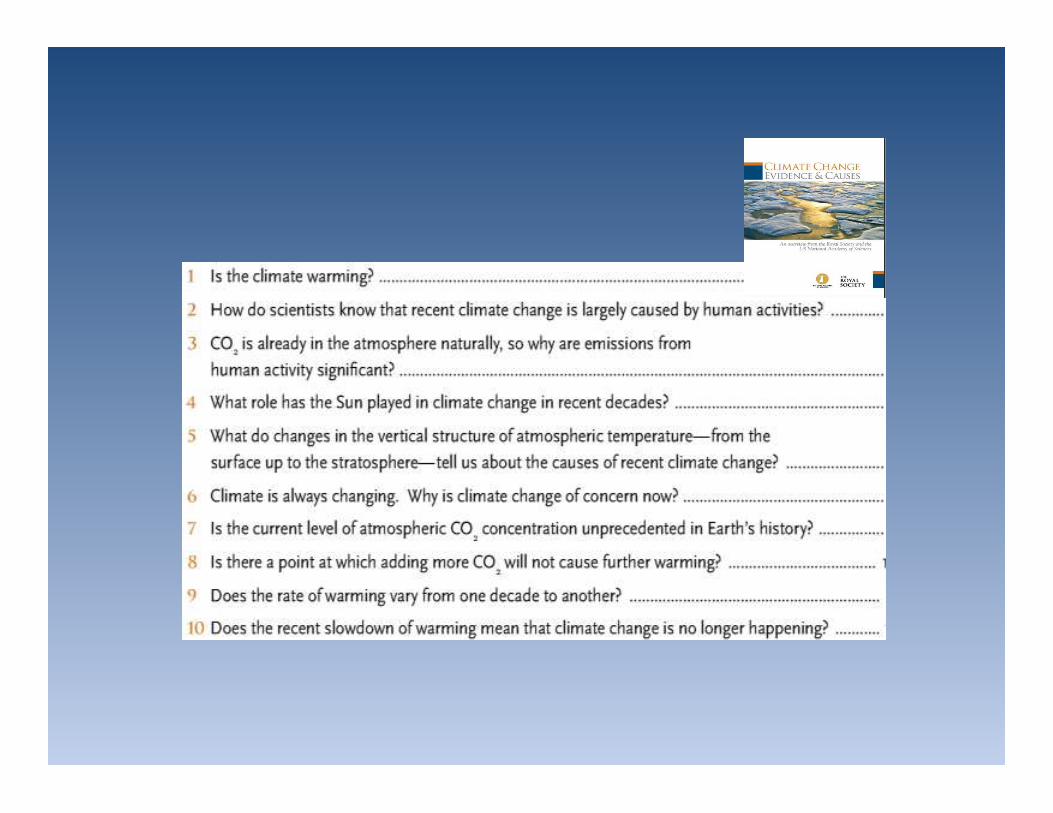
• FOR ANSWERS SEE MY OTHER PowerPoint
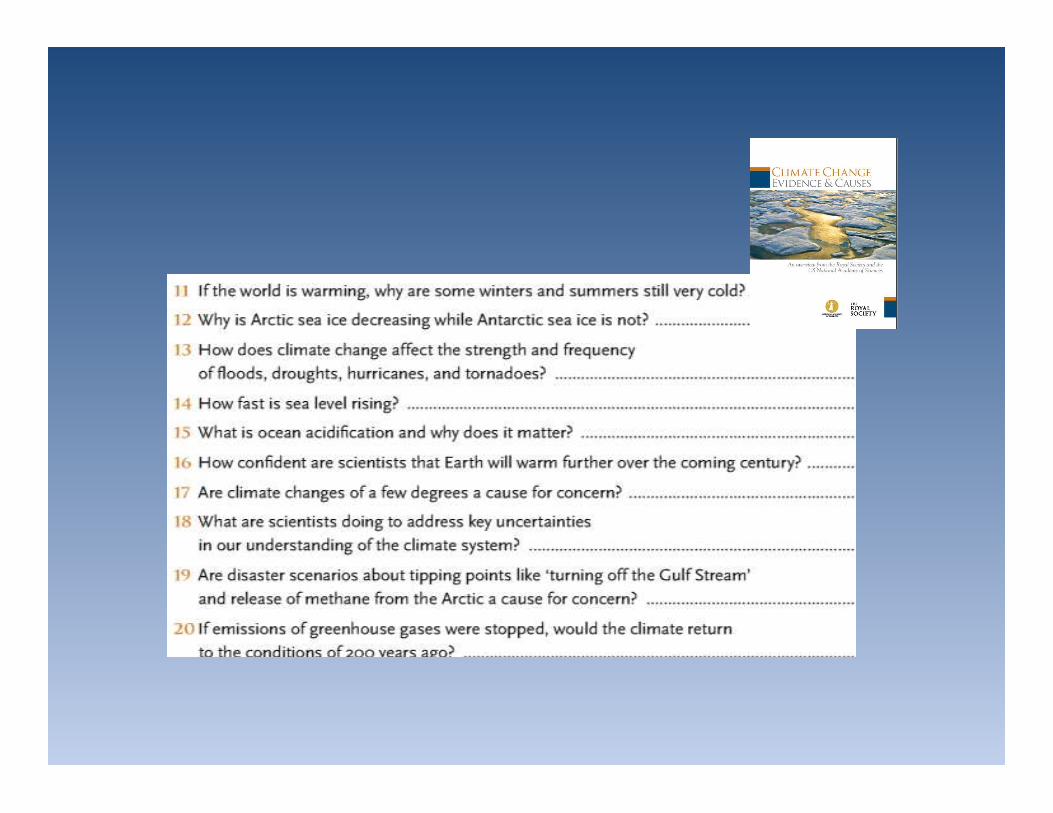
Joint U.S. National Academy ofScience and Royal Society 20-point
summary:
Joint U.S. National Academy ofScience and Royal Society 20-point
summary:• OR: Joint U.S. National Academy of Science
and Royal Society 20-point summary: 20-pointClimate-Change Summary (pdf) – summarizedin the following 3 slides
• If we are so concerned about leaving a nationaldebt to our children and grandchildren, and BTWwe should be, shouldn’t we put the costs ofclimate change as part of that equation?
• For those that don’t accept climate changemaybe it would be a good thing to limit CO2 intothe atmosphere anyway, especially at the rateswe are putting it into the atmosphere –BECAUSE OF OCEAN ACIDIFICATION issuesand the law of unintended consequences!
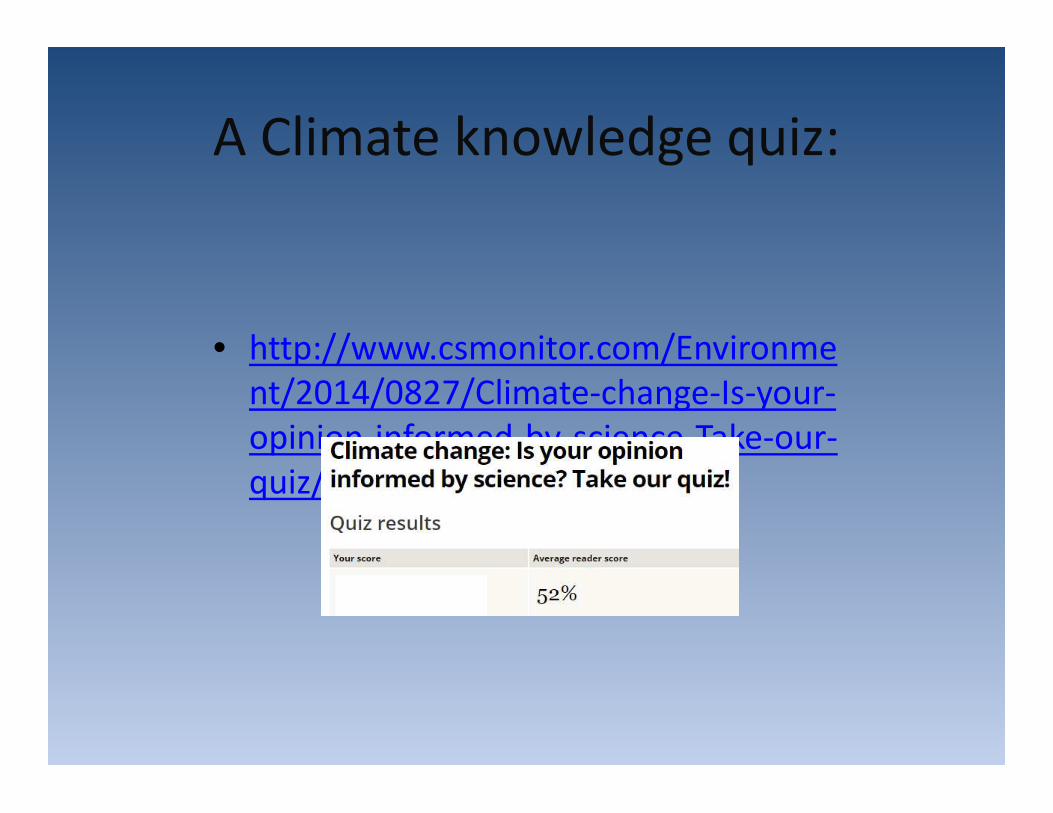
A Climate knowledge quiz:
• http://www.csmonitor.com/Environment/2014/0827/Climate-change-Is-your-opinion-informed-by-science-Take-our-quiz/Gas