Embed Size (px)
DESCRIPTION
Chapter 9 Project Management
Citation preview
Risk Management and Scheduling:
Estimating completion times
Week 9 Supplement: explaining the statistics09-01
Copyright © 2013 Pearson Education, Inc. Publishing as Prentice Hall
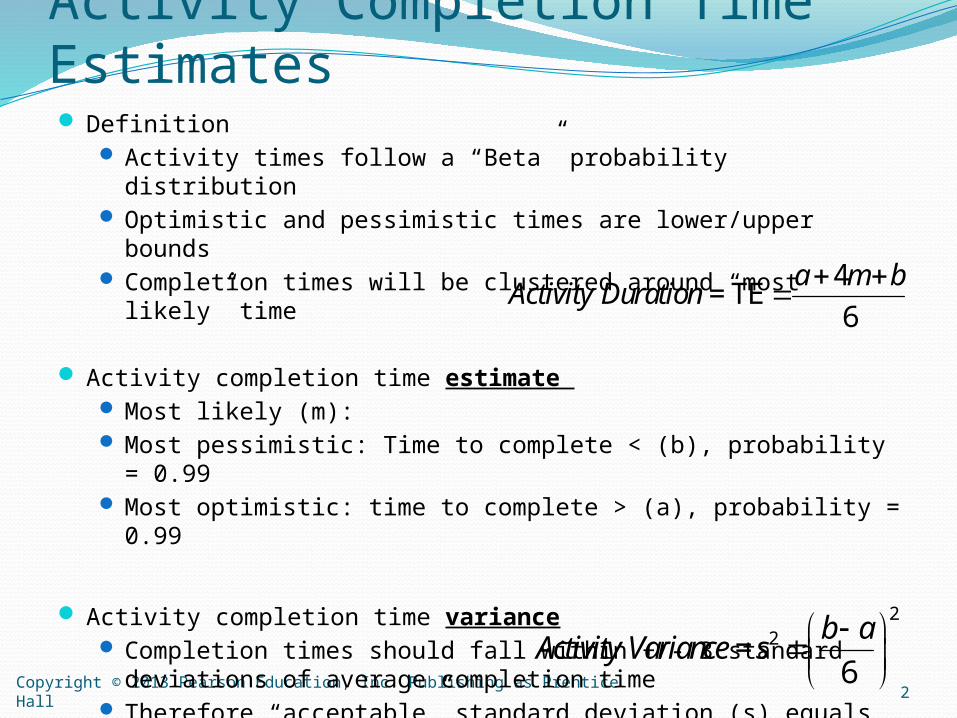
Activity Completion Time Estimates Definition
Activity times follow a “Beta” probability distribution Optimistic and pessimistic times are lower/upper bounds Completion times will be clustered around “most likely” time
Activity completion time estimate Most likely (m): Most pessimistic: Time to complete < (b), probability = 0.99 Most optimistic: time to complete > (a), probability = 0.99
Activity completion time variance Completion times should fall within +/- 3 standard deviations
of average completion time Therefore “acceptable” standard deviation (s) equals 1/6 of
range of times The range is (b-a); therefore s =(b-a)/6 “Variance” is defined as s2
2
4 = TE
6
a m bActivity Duration
22 =
6
b aActivity Variance s
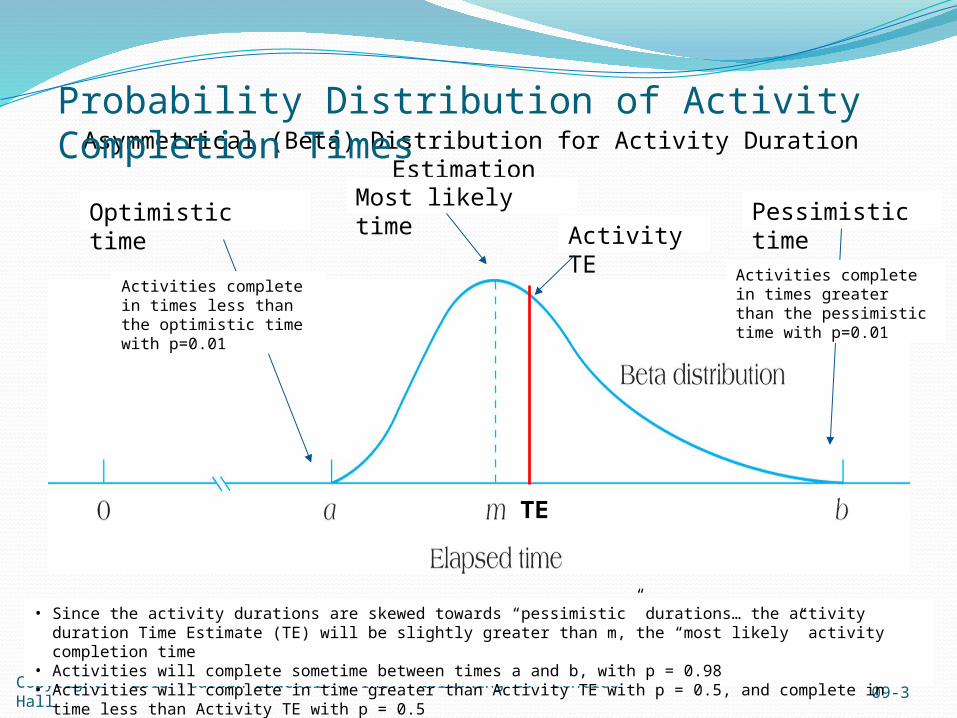
Asymmetrical (Beta) Distribution for Activity Duration Estimation
Copyright © 2013 Pearson Education, Inc. Publishing as Prentice Hall 09-3
Optimistic timeMost likely time
Pessimistic time
Probability Distribution of Activity Completion Times
Activities complete in times less than the optimistic time with p=0.01
Activities complete in times greater than the pessimistic time with p=0.01
• Since the activity durations are skewed towards “pessimistic” durations… the activity duration Time Estimate (TE) will be slightly greater than m, the “most likely” activity completion time
• Activities will complete sometime between times a and b, with p = 0.98• Activities will complete in time greater than Activity TE with p = 0.5, and complete in time less than Activity TE with p = 0.5
TE
Activity TE
Copyright © 2013 Pearson Education, Inc. Publishing as Prentice Hall
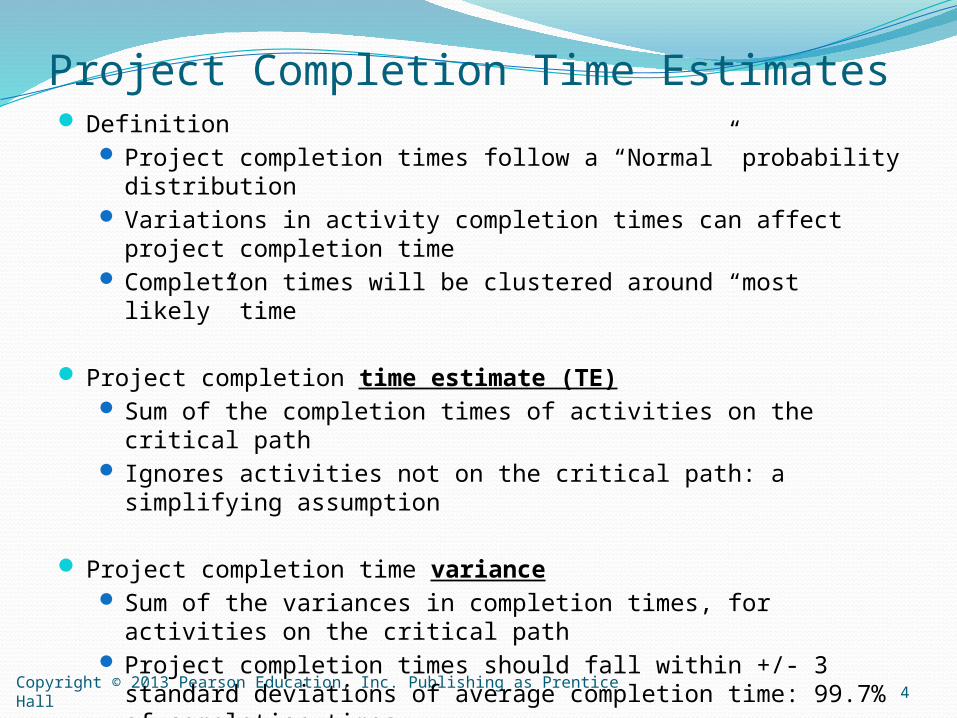
Project Completion Time Estimates
4
Definition Project completion times follow a “Normal” probability
distribution Variations in activity completion times can affect project
completion time Completion times will be clustered around “most likely” time
Project completion time estimate (TE) Sum of the completion times of activities on the critical path Ignores activities not on the critical path: a simplifying
assumption
Project completion time variance Sum of the variances in completion times, for activities on the
critical path Project completion times should fall within +/- 3 standard
deviations of average completion time: 99.7% of completion times
Project Standard Deviation =

Copyright © 2013 Pearson Education, Inc. Publishing as Prentice Hall 09-5
Probability Distribution of Project Completion Times Symmetrical (Normal) Distribution for Project Duration Estimation
Probabilities of project completion times – see chart on next page for derivations• 68.3% will be within +/- 1 standard deviation
of expected completion time• 95.6% within 2 std dev of expected• 99.7% within 3 std dev of expected
Z = Standard Deviation coefficient• for example, if Z= 2;
then Z * S = Z * 2 std dev
Since the activity Time Estimates (TEs) are skewed towards “pessimistic” durations, and because the project Time Estimate (TE) is the sum of the TEs for activities on the critical path, the project TE will be slightly greater than the “most likely” time for project completion. Since the individual project TE has already accounted for the skew in activity completion times, the distribution of project TEs is symmetrical.
TE; Z =0
Projects will complete in greater time than the predicted TE with p=0.5
Projects will complete in less time than the predicted TE with p=0.5
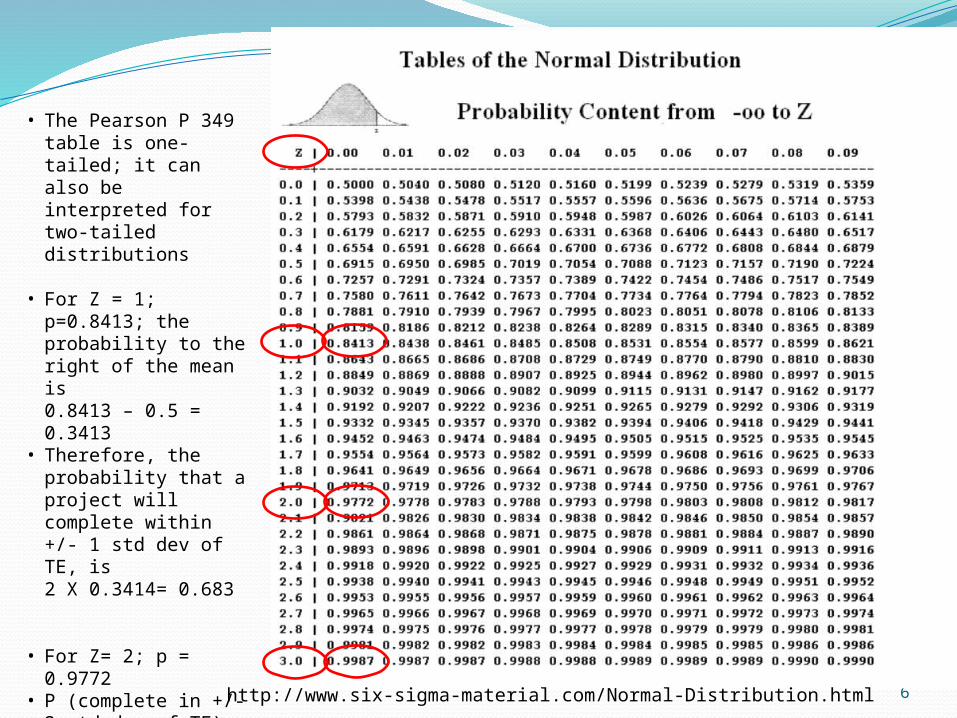
6http://www.six-sigma-material.com/Normal-Distribution.html
• The Pearson P 349 table is one-tailed; it can also be interpreted for two-tailed distributions
• For Z = 1; p=0.8413; the probability to the right of the mean is 0.8413 – 0.5 = 0.3413
• Therefore, the probability that a project will complete within +/- 1 std dev of TE, is 2 X 0.3414= 0.683
• For Z= 2; p = 0.9772• P (complete in +/- 2 std
dev of TE) is2 X (0.9772-0.5) = 0.956
• For Z= 3; p = 0.9987• P (complete in +/- 3 std
dev of TE) is2 X (0.9987-0.5) = 0.997
Copyright © 2013 Pearson Education, Inc. Publishing as Prentice Hall 09-7
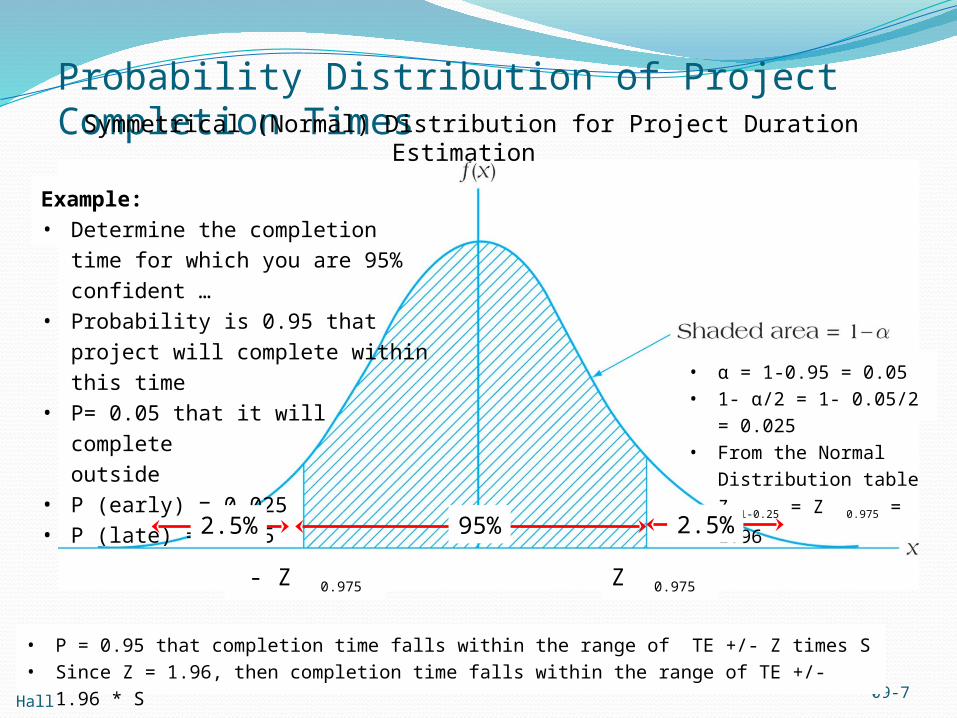
Example:• Determine the completion time for
which you are 95% confident …• Probability is 0.95 that project will
complete within this time• P= 0.05 that it will complete
outside• P (early) = 0.025• P (late) = 0.025
Probability Distribution of Project Completion Times Symmetrical (Normal) Distribution for Project Duration Estimation
• α = 1-0.95 = 0.05• 1- α/2 = 1- 0.05/2 =
0.025• From the Normal
Distribution table
Z 1-0.25 = Z 0.975 = 1.96
• P = 0.95 that completion time falls within the range of TE +/- Z times S • Since Z = 1.96, then completion time falls within the range of TE +/- 1.96 * S
95%2.5% 2.5%
Z 0.975 - Z 0.975
8
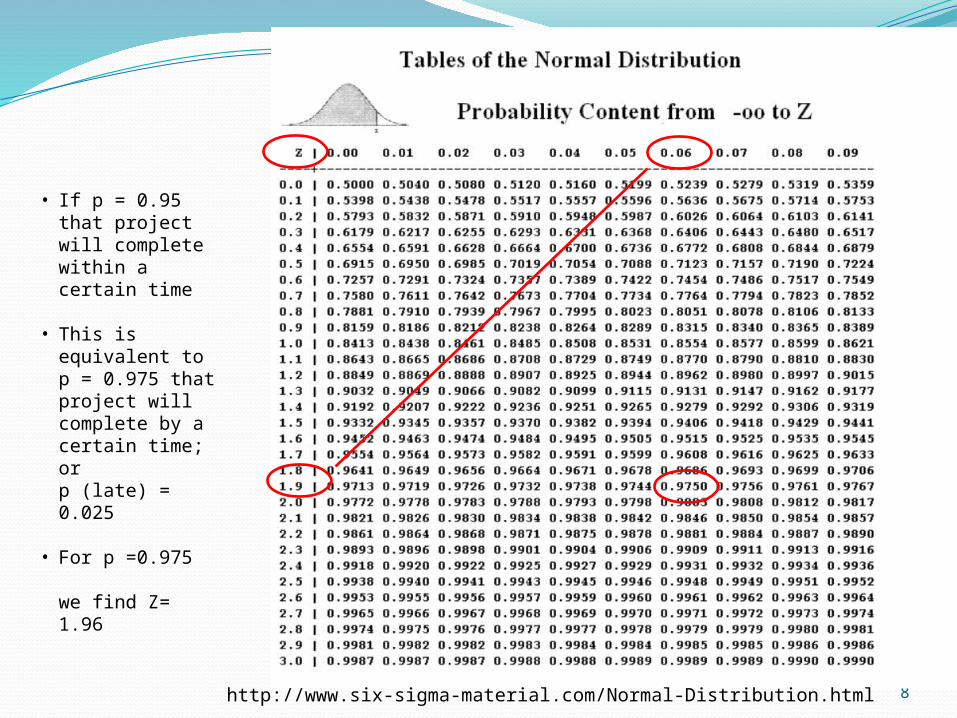
• If p = 0.95 that project will complete within a certain time
• This is equivalent to p = 0.975 that project will complete by a certain time; orp (late) = 0.025
• For p =0.975
we find Z= 1.96
http://www.six-sigma-material.com/Normal-Distribution.html
Copyright © 2013 Pearson Education, Inc. Publishing as Prentice Hall
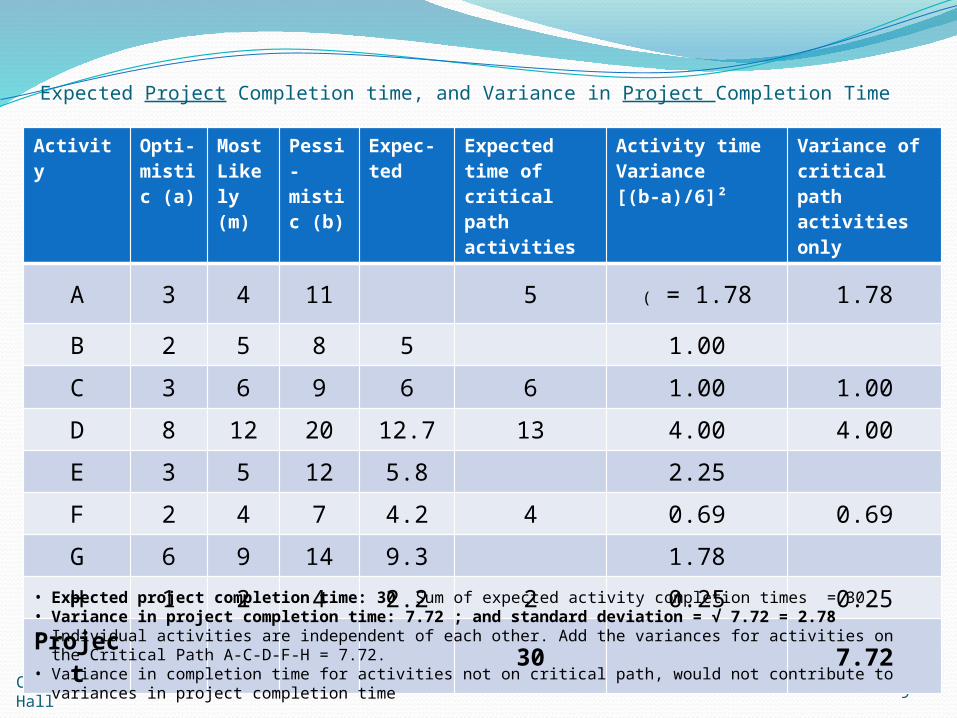
Expected Project Completion time, and Variance in Project Completion Time
9
Activity Opti-mistic (a)
Most Likely (m)
Pessi-mistic (b)
Expec-ted
Expected time of critical path activities
Activity time Variance [(b-a)/6]²
Variance of critical path activities only
A 3 4 11 5 ( = 1.78 1.78
B 2 5 8 5 1.00
C 3 6 9 6 6 1.00 1.00
D 8 12 20 12.7 13 4.00 4.00
E 3 5 12 5.8 2.25
F 2 4 7 4.2 4 0.69 0.69
G 6 9 14 9.3 1.78
H 1 2 4 2.2 2 0.25 0.25
Project 30 7.72
• Expected project completion time: 30 Sum of expected activity completion times = 30• Variance in project completion time: 7.72 ; and standard deviation = √ 7.72 = 2.78• Individual activities are independent of each other. Add the variances for activities on the Critical Path A-C-D-F-H = 7.72. • Variance in completion time for activities not on critical path, would not contribute to variances in project completion time

Copyright © 2013 Pearson Education, Inc. Publishing as Prentice Hall 09-10
Z = 0.72Z=0
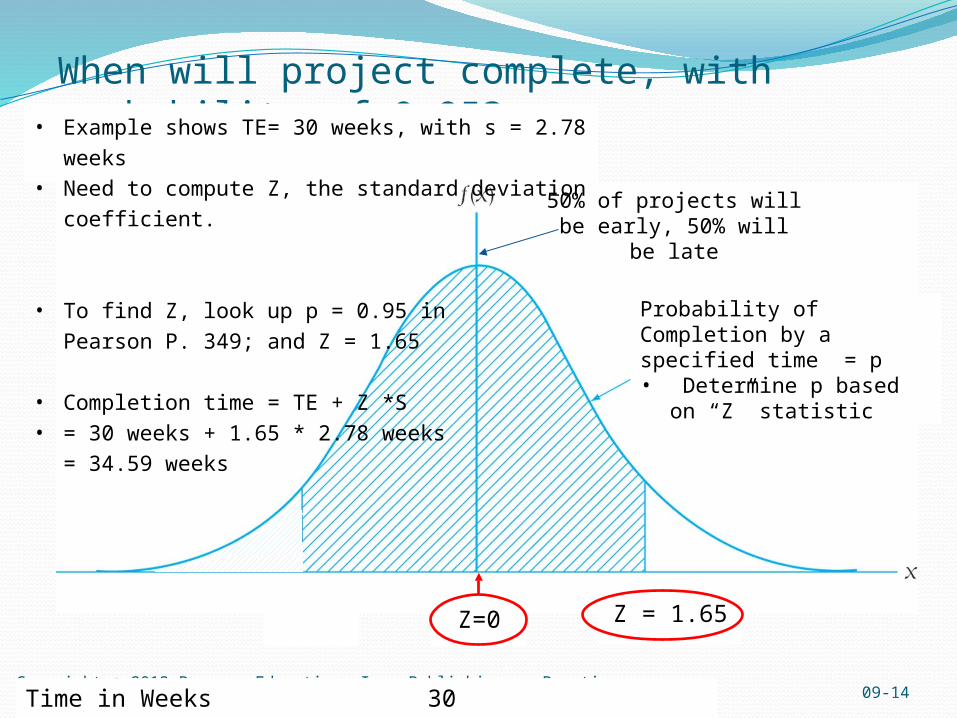
Probability of Completion by a specified time = p • Determine p based on “Z”
statistic
50% of projects will be early, 50% will be late
Probability that project completes within 32 weeks? • Example shows TE= 30 weeks, with s = 2.78 weeks• Need to compute Z, the standard deviation coefficient.
• Deadline = 32 weeks, or
2 weeks after expected completion
• Z as a proportion of S:
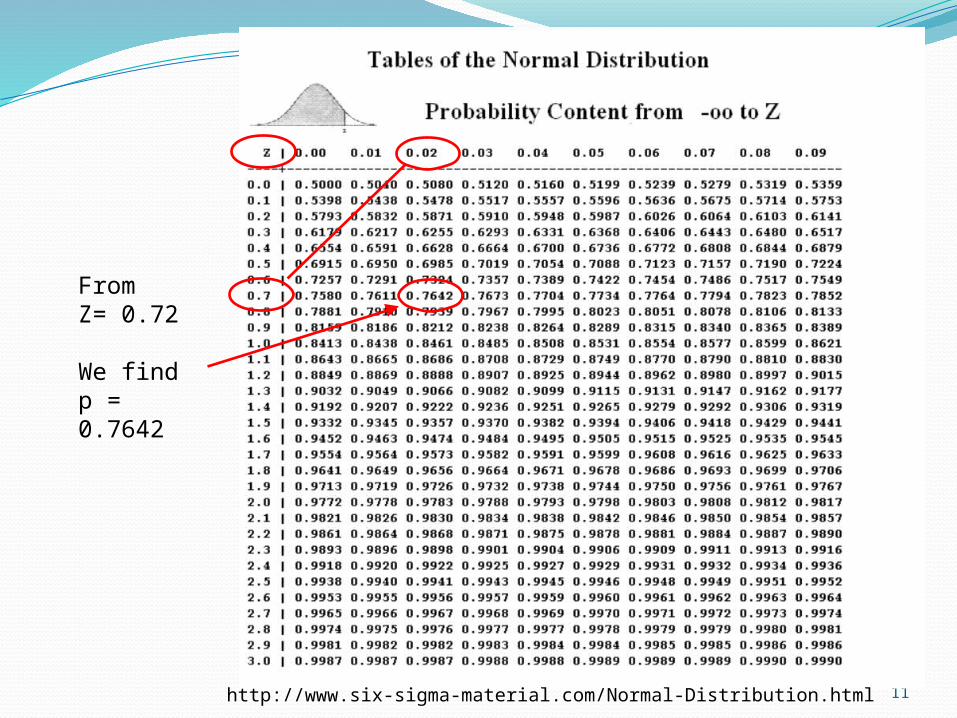
2 / 2.78 weeks = 0.72• Look up Z = 0.72 in Pearson
P. 349, to find p= 0.7642
• Therefore, 76% probability
project will complete
within 32 weeks;
24% after 32 weeks
Time in Weeks 30 32
11
From Z= 0.72 We findp = 0.7642
http://www.six-sigma-material.com/Normal-Distribution.html
Copyright © 2013 Pearson Education, Inc. Publishing as Prentice Hall
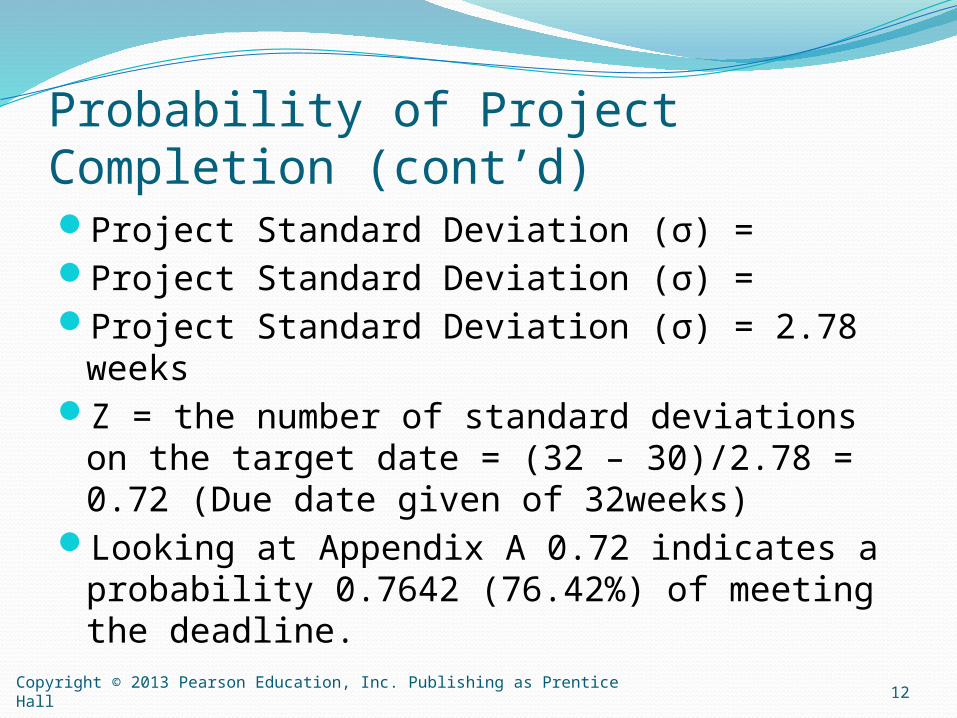
Probability of Project Completion (cont’d)Project Standard Deviation (σ) = Project Standard Deviation (σ) = Project Standard Deviation (σ) = 2.78 weeksZ = the number of standard deviations on the
target date = (32 – 30)/2.78 = 0.72 (Due date given of 32weeks)
Looking at Appendix A 0.72 indicates a probability 0.7642 (76.42%) of meeting the deadline.
12
Copyright © 2013 Pearson Education, Inc. Publishing as Prentice Hall
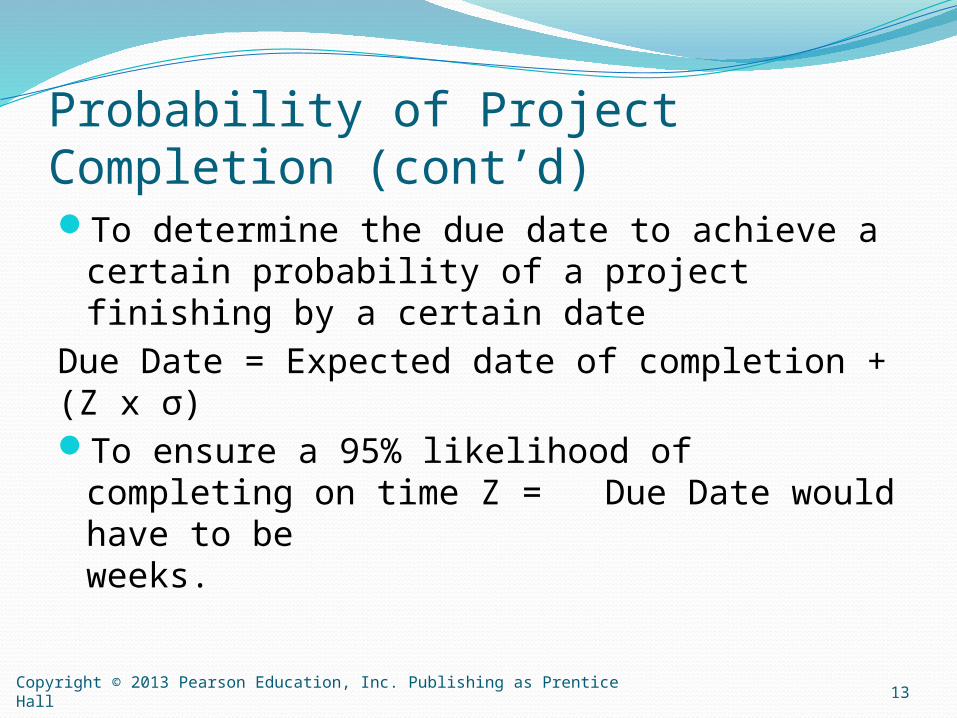
Probability of Project Completion (cont’d)To determine the due date to achieve a
certain probability of a project finishing by a certain date
Due Date = Expected date of completion + (Z x σ)To ensure a 95% likelihood of completing on
time Z = Due Date would have to be weeks.
13
Copyright © 2013 Pearson Education, Inc. Publishing as Prentice Hall 09-14
Z = 1.65Z=0
Probability of Completion by a specified time = p • Determine p based on “Z”
statistic
50% of projects will be early, 50% will be late
When will project complete, with probability of 0.95?• Example shows TE= 30 weeks, with s = 2.78 weeks• Need to compute Z, the standard deviation coefficient.
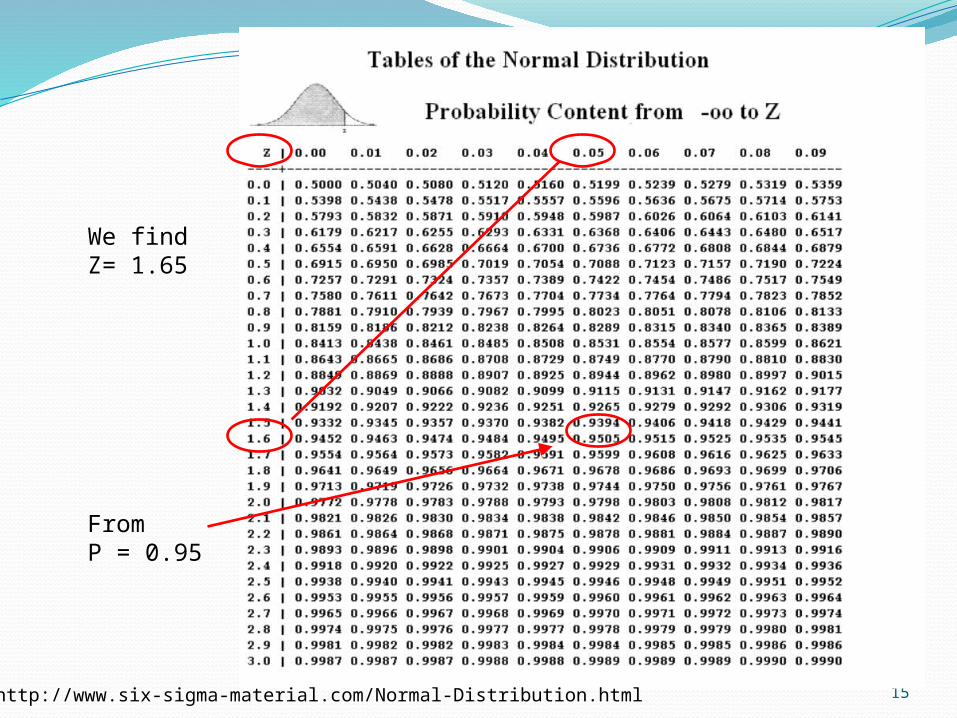
• To find Z, look up p = 0.95 in
Pearson P. 349; and Z = 1.65
• Completion time = TE + Z *S• = 30 weeks + 1.65 * 2.78 weeks
= 34.59 weeks
Time in Weeks 30 34.59
15http://www.six-sigma-material.com/Normal-Distribution.html
We find Z= 1.65
FromP = 0.95
Copyright © 2013 Pearson Education, Inc. Publishing as Prentice Hall
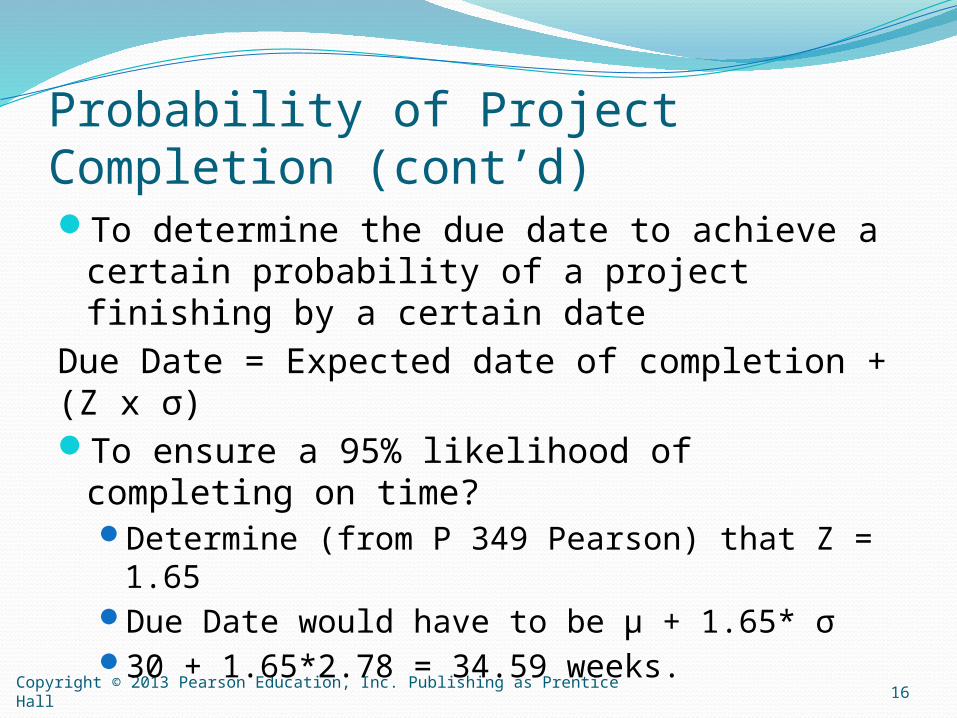
Probability of Project Completion (cont’d)To determine the due date to achieve a
certain probability of a project finishing by a certain date
Due Date = Expected date of completion + (Z x σ)To ensure a 95% likelihood of completing on
time?Determine (from P 349 Pearson) that Z = 1.65 Due Date would have to be μ + 1.65* σ30 + 1.65*2.78 = 34.59 weeks.
16