Embed Size (px)
Citation preview
28/07/2020 (new wording) Intro
1/1
26/07/2020
Overview This report summarises the information from the surveillance system which is used to monitor the cases of the Coronavirus Disease 2019 (COVID-19) pandemic in Nottinghamshire (excluding Nottingham city). The report is based on daily data up to COVID-19 cases are identified by taking specimens from people and sending these specimens to laboratories to be tested. If the test is positive, this is referred to as a lab-confirmed case. Data includes lab-confirmed positive cases of COVID-19 from pillar 1 (NHS hospital and Public Health England laboratories) and pillar 2 (commercial partner laboratories) of the Government's testing programme. There are many factors that can contribute to the number of cases in an area. As part of local outbreak control arrangements, a team meets daily to review information about new cases to identify where further investigation or action is required. Technical details The maps presented in the report examine counts and rates of COVID-19 at Middle Super Output Area level. Middle Layer Super Output Areas are a census based geography used in the reporting of small area statistics in England and Wales. The minimum population is 5,411 and the average is 8,363. As such they are larger than electoral wards but smaller than Districts. Disclosure control rules have been applied to all figures not currently in the public domain. All counts of 1 or 2 have been suppressed. Data has been sourced from Public Health England. The report has been compiled by Performance, Intelligence and Policy Team at Nottinghamshire County Council.
Cumulative data from 21/02/2020 -
Weekly COVID-19 Surveillance Report in Nottinghamshire
26 July 2020.
28/07/2020 Covid counts
1/1
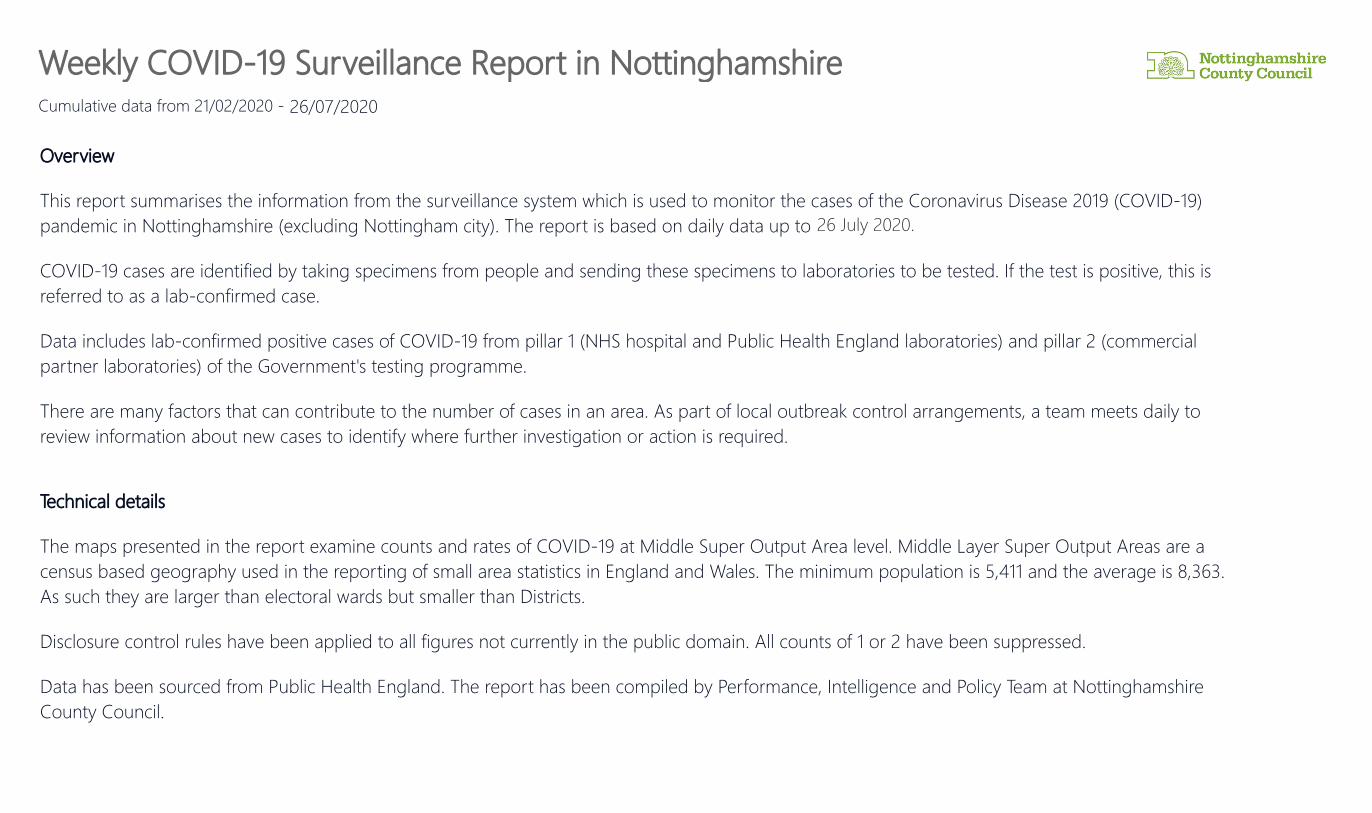
Cases per week
0
100
200
300
400
Week Commencing
Coun
t of C
ases
17 February
2 March9 March
16 March
23 March
30 March6 April
13 April
20 April
27 April4 May
11 May18 May
25 May1 June
8 June15 June
22 June29 June
6 July13 July
20 July28 53
170236 220 202
124 143
64 8855 29 32 20
20
133
181189
122
154160
123 140
76 8544 22 25 23
PILLAR 1 PILLAR 2
Cumulative data from 21/02/2020 -
Pillar 1 + 2combined data from both Pillar 1 and Pillar 2 of the UK Government’s COVID-19 testing programme
COVID-19 cases | Cumulative data from
COVID-19 cases | Cumulative data from
CASES PILLAR 1CASES
PILLAR 2CASES
CASES PILLAR 1CASES
PILLAR 2CASES Years median age* Years median age*
* median age is the middle when all ages are lined up smallest to largest - half of the cases are younger than this age and half are older
26/07/2020 Moving average of cases per day
0
10
20
30
Day of Specimen date
Case
s per
day
May 2020 Jun 2020 Jul 2020
PILLAR 1 PILLAR 2
Population pyramid - Pillar 1
8
51
49
82
86
60
126
352
9
11
30
39
69
86
154
306
0-19
20-29
30-39
40-49
50-59
60-69
70-79
80+
Female Male
Population pyramid - Pillar 2
38
165
135
185
193
78
41
147
31
78
109
74
116
49
34
58
0-19
20-29
30-39
40-49
50-59
60-69
70-79
80+
Female Male
Weekly COVID-19 Surveillance Report in Nottinghamshire
Pillar 1data from swab testing in PHE labs and NHS hospitals for those with a clinical need, and health and care workers
Pillar 2data from swab testing for the wider population, as set out in government guidance
3050 1518 1532
38 3 35
76 48
21/02/2020 - 26/07/2020 (total)
20/07/2020 - 26/07/2020 (latest week)
28/07/2020 Districts
1/1
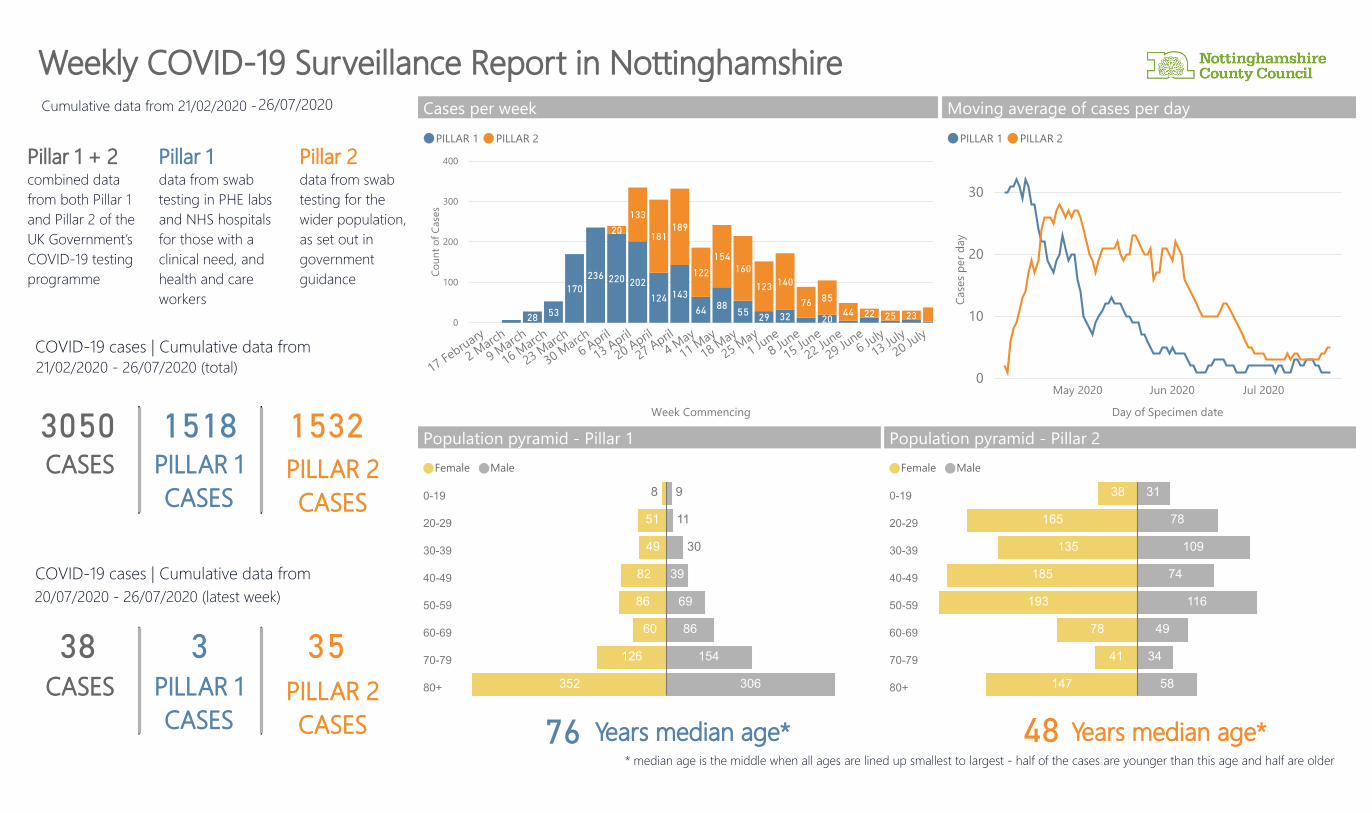
Rate of cumulative cases per 100,000 population by district
0
200
400
600
800
Ashfield Bassetlaw Broxtowe Gedling Mansfield Newark &Sherwood
Rushcliffe
Cumulative data from 21/02/2020 -26/07/2020
Rate of cumulative cases per 100,000 population by district
0
200
400
600
800
Ashfield Bassetlaw Broxtowe Gedling Mansfield Newark &Sherwood
Rushcliffe
England Average
570
593
433
377
357
323
397
247
275
243
227
144
176
206
323
318
190
150
213
147
191
Ashfield
Bassetlaw
Broxtowe
Gedling
MansfieldNewark & Sherwood
Rushcliffe
Pillar 1 + 2combined data from both Pillar 1 and Pillar 2 of the UK Government’sCOVID-19 testing programme
Pillar 1 + 2Cases
Pillar 1Cases
Pillar 2Cases
Cumulative cases per DistrictDistrict
0
200
400
600
Specimen Date
Cum
ulat
ive
COVI
D-1
9 ca
ses
Mar 2020 Apr 2020 May 2020 Jun 2020 Jul 2020
Ashfield Bassetlaw Broxtowe Gedling Mansfield Newark & Sherwood Rushcliffe
vs. Eng Sig. higher | Similar | Sig. lower
Weekly COVID-19 Surveillance Report in Nottinghamshire
Pillar 1data from swab testing in PHE labs and NHS hospitals for those with a clinical need, and health and care workers
Pillar 2data from swab testing for the wider population, as set out in government guidance
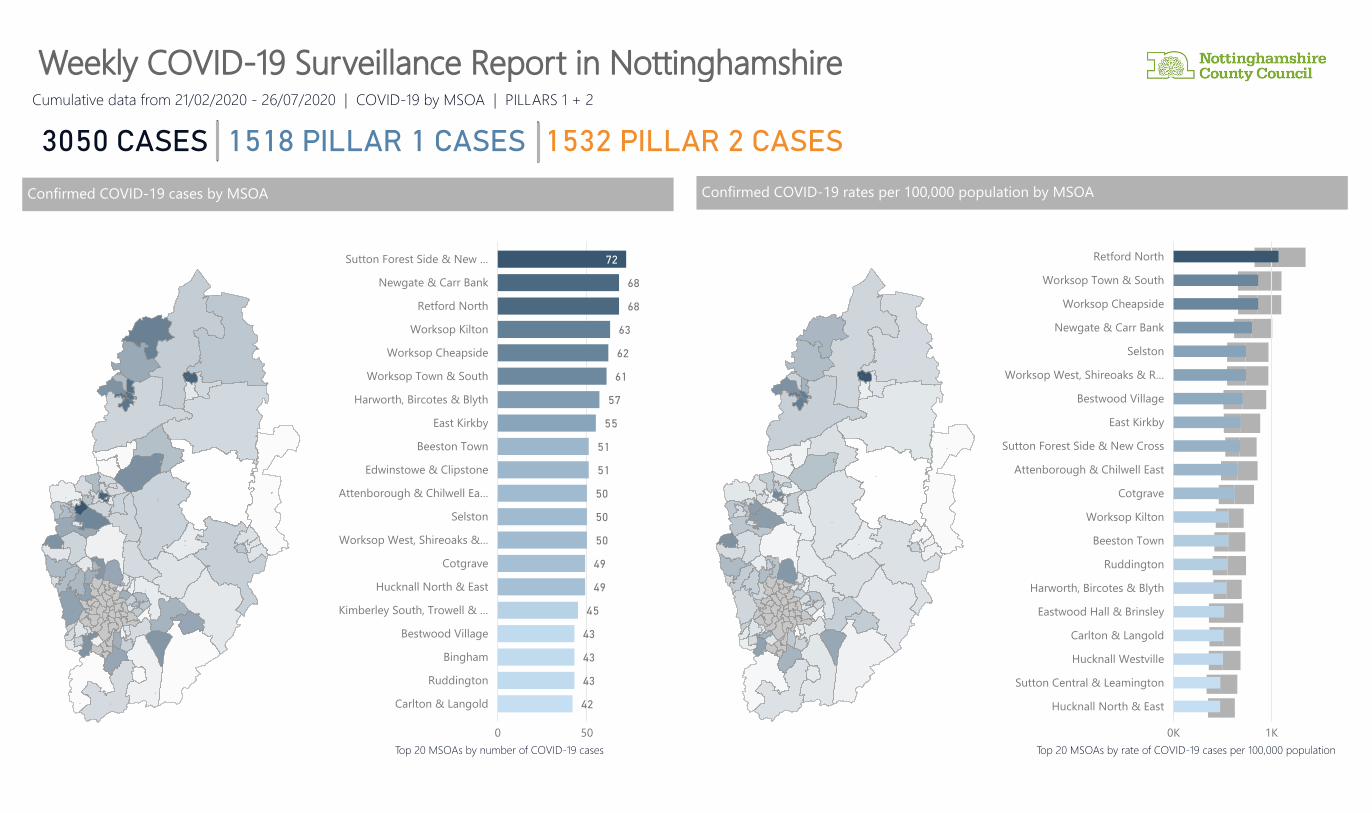
28/07/2020 MSOAs all dates
1/1
Cumulative data from 21/02/2020 - 26/07/2020 | COVID-19 by MSOA | PILLARS 1 + 2
0 50
Sutton Forest Side & New …
Newgate & Carr Bank
Retford North
Worksop Kilton
Worksop Cheapside
Worksop Town & South
Harworth, Bircotes & Blyth
East Kirkby
Beeston Town
Edwinstowe & Clipstone
Attenborough & Chilwell Ea…
Selston
Worksop West, Shireoaks &…
Cotgrave
Hucknall North & East
Kimberley South, Trowell & …
Bestwood Village
Bingham
Ruddington
Carlton & Langold
72
68
68
63
62
61
57
55
51
51
50
50
50
49
49
45
43
43
43
42
Confirmed COVID-19 cases by MSOA Confirmed COVID-19 rates per 100,000 population by MSOA
Top 20 MSOAs by number of COVID-19 cases Top 20 MSOAs by rate of COVID-19 cases per 100,000 population
Weekly COVID-19 Surveillance Report in Nottinghamshire
0K 1K
Retford North
Worksop Town & South
Worksop Cheapside
Newgate & Carr Bank
Selston
Worksop West, Shireoaks & R…
Bestwood Village
East Kirkby
Sutton Forest Side & New Cr…
Attenborough & Chilwell East
Cotgrave
Worksop Kilton
Beeston Town
Ruddington
Harworth, Bircotes & Blyth
Eastwood Hall & Brinsley
Carlton & Langold
Hucknall Westville
Sutton Central & Leamington
Hucknall North & East
0K 1K
Retford North
Worksop Town & South
Worksop Cheapside
Newgate & Carr Bank
Selston
Worksop West, Shireoaks & R…
Bestwood Village
East Kirkby
Sutton Forest Side & New Cross
Attenborough & Chilwell East
Cotgrave
Worksop Kilton
Beeston Town
Ruddington
Harworth, Bircotes & Blyth
Eastwood Hall & Brinsley
Carlton & Langold
Hucknall Westville
Sutton Central & Leamington
Hucknall North & East
1518 PILLAR 1 CASES3050 CASES 1532 PILLAR 2 CASES