Embed Size (px)
Citation preview
Vol. 41 No. 41 04th – 10th October 2014
This is the second in a series the two arti-
cles on Leprosy.
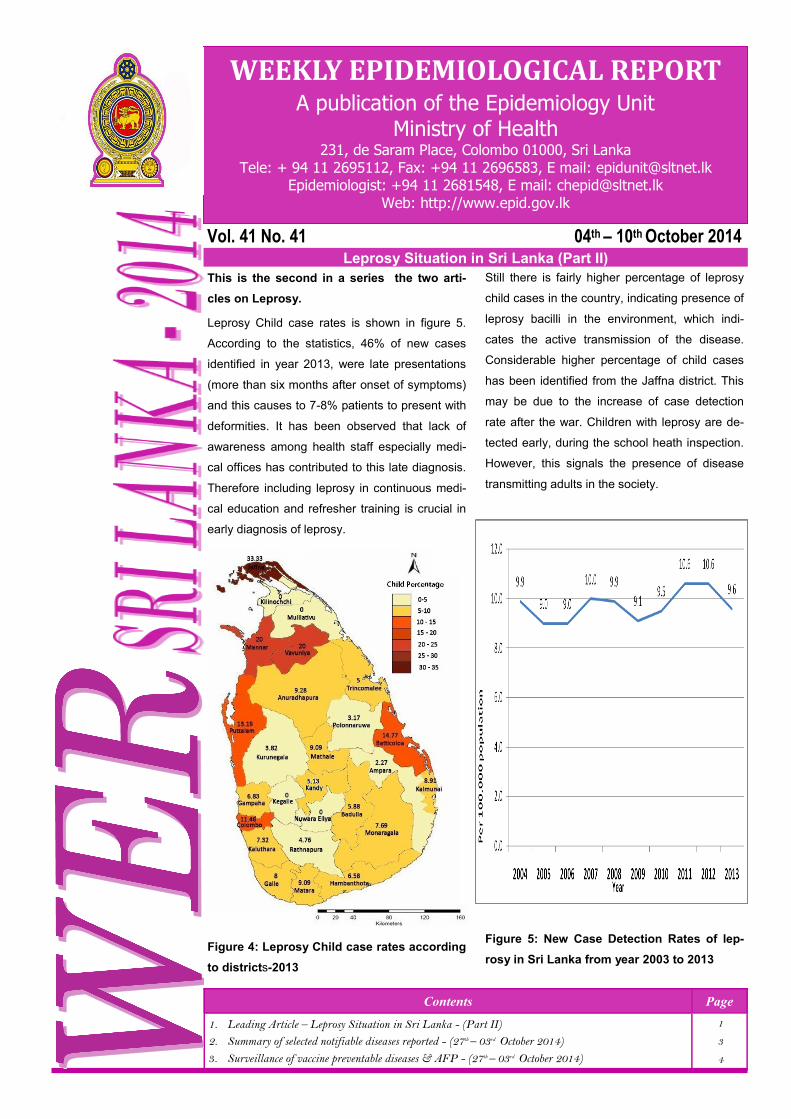
Leprosy Child case rates is shown in figure 5.
According to the statistics, 46% of new cases
identified in year 2013, were late presentations
(more than six months after onset of symptoms)
and this causes to 7-8% patients to present with
deformities. It has been observed that lack of
awareness among health staff especially medi-
cal offices has contributed to this late diagnosis.
Therefore including leprosy in continuous medi-
cal education and refresher training is crucial in
early diagnosis of leprosy.
Figure 4: Leprosy Child case rates according
to districts-2013
Still there is fairly higher percentage of leprosy
child cases in the country, indicating presence of
leprosy bacilli in the environment, which indi-
cates the active transmission of the disease.
Considerable higher percentage of child cases
has been identified from the Jaffna district. This
may be due to the increase of case detection
rate after the war. Children with leprosy are de-
tected early, during the school heath inspection.
However, this signals the presence of disease
transmitting adults in the society.
Figure 5: New Case Detection Rates of lep-
rosy in Sri Lanka from year 2003 to 2013
Contents Page
1. Leading Article – Leprosy Situation in Sri Lanka - (Part II)
2. Summary of selected notifiable diseases reported - (27th – 03rd October 2014)
3. Surveillance of vaccine preventable diseases & AFP - (27th – 03rd October 2014)
1
3
4
WEEKLY EPIDEMIOLOGICAL REPORT A publication of the Epidemiology Unit
Ministry of Health 231, de Saram Place, Colombo 01000, Sri Lanka
Tele: + 94 11 2695112, Fax: +94 11 2696583, E mail: [email protected] Epidemiologist: +94 11 2681548, E mail: [email protected]
Web: http://www.epid.gov.lk
Leprosy Situation in Sri Lanka (Part II)

In 1991 the World Health Organization (WHO) had set a target
of eliminating leprosy as a public health problem by year 2000.
Even though Sri Lanka has achieved the elimination target (10
cases per 100,000 population) set by WHO in 1995 there have
been around 2000 new cases of leprosy reported every year
for the past 15 years( ALC 2013). New case detection rate
remains at the same level (10 per 100, 000 population) for the
past 5-6 years and approximately 10% of the new cases are
child cases which indicates the on-going transmission of the
disease.
Figure 6: Percentages of Grade 2 deformity in Sri Lanka
from year 2003 to 2013
Leprosy remains a serious public health problem due to its
ability to cause disability. The prevention of leprosy ultimately
lies in the early diagnosis and treatment of the individuals sus-
pected or diagnosed as having leprosy, thereby preventing
further transmission of the disease to others. Diagnosing and
treating the leprosy patients is the main approach in interrupt-
ing the transmission of leprosy.
However, certain challenges have been identified in the pro-
gramme to control leprosy. Unabated active transmission of
the disease is a major problem in the country. According to the
background information inadequacy of knowledge among
health care staff remains an obstacle in identifying, referring,
diagnosing and treating patients with leprosy. Delayed presen-
tation and defaulting treatments are also challenges in the lep-
rosy control programme. All aspects of quality clinical manage-
ment are not accounted at the service delivery points and ser-
vices offered to patients needing rehabilitation are not satisfac-
tory. Inadequacy of trained personnel for leprosy control is
another obstacle in controlling leprosy. Inadequate supervi-
sion, monitoring and evaluation is another challenge.
Several approaches have been made to overcome the chal-
lenges. For example the increase of public awareness on lep-
rosy via social marketing programmes and making leprosy
services more accessible have resulted in the increase in new
case detection. The concept of establishing satellite clinics at
peripheral health facilities is used to improve access to leprosy
services. By bringing the services closer to the needy commu-
nities; case detection, regular follow-up, compliance to treat-
ment and reduction in number of defaulters are expected to be
ensured.
This approach helps to reduce the delayed presentation. By
increasing awareness among people is being used to increase
compliance to treatment. Improving quality services in all treat-
ment centers, provision of satisfactory rehabilitation services to
all leprosy patients with disabilities, training human resources,
strengthening and monitoring and evaluation are other major
approaches to control leprosy.
Sources
PubMed-(Walker & Lockwood,2007).-availale at http://
www.ncbi.nlm.nih.gov/pubmed/17350495
Leprosy statistics - latest data-WHO 2014-available at http://
www.who.int/wer/2013/wer8835.pdf?ua=1
Dr. Monika Wijerathne
Consultant Community Physician-Anti Leprosy Campaign
WER Sri Lanka - Vol. 41 No. 41 04th – 10th October 2014
Page 2

Page 3
WER Sri Lanka - Vol. 41 No. 41 04th – 10th October 2014 R
DH
S
D
ivis
ion
Den
gue
Fev
er
Dys
ente
ry
Enc
epha
liti
s
Ent
eric
F
ever
F
ood
P
oiso
ning
Le
ptos
piro
sis
Typ
hus
Fev
er
Vira
l
H
epat
itis
Hum
an
Rab
ies
C
hick
enpo
x M
enin
gitis
Le
ishm
ani-
asis
W
RC
D
A
B
A
B
A
B
A
B
A
B
A
B
A
B
A
B
A
B
A
B
A
B
A
B
T
* C
**
Col
ombo
149
10709
4
118
0
11
4
88
0
172
2
120
1
3
0
40
0
0
4
345
0
49
0
3
69
3
1
Gam
paha
115
5632
2
113
0
11
0
32
0
24
26
240
1
19
8
204
0
5
3
239
1
55
0
2
53
4
7
Kal
utar
a 27
2114
1
136
0
6
1
44
0
59
11
237
0
2
2
18
0
1
3
206
0
62
0
0
10
0
0
Kan
dy
39
1284
0
77
1
6
1
20
0
17
0
39
0
72
5
141
0
1
0
160
2
24
0
4
70
3
0
Mat
ale
6
363
0
57
0
2
0
17
0
17
0
33
0
2
0
115
0
1
1
47
0
45
0
26
46
5
4
Nuw
araE
liya
2
234
5
215
0
3
0
17
0
69
1
23
0
55
0
29
0
0
6
103
1
29
0
0
46
5
4
Gal
le
7
847
0
98
0
6
0
8
0
33
2
143
1
81
0
6
0
0
4
353
0
43
0
3
60
4
0
Ham
bant
ota
4
523
0
41
0
4
0
10
1
16
1
76
0
62
0
16
0
0
3
127
0
40
2
294
58
4
2
Mat
ara
29
506
2
83
0
4
1
23
0
18
4
71
4
49
0
33
0
0
1
147
0
27
0
73
10
0
0
Jaffn
a 29
914
34
448
0
7
5
178
0
56
0
8
3
272
0
8
0
0
1
120
2
48
0
1
10
0
0
Kili
noch
chi
0
46
0
78
0
1
0
22
0
0
0
1
0
19
0
0
0
0
0
15
0
6
0
11
25
7
5
Man
nar
11
100
2
34
0
10
0
34
0
9
0
4
0
24
0
1
0
0
0
10
0
7
1
4
20
8
0
Vav
uniy
a 0
105
1
43
0
1
3
30
0
22
0
9
0
6
0
5
0
0
0
11
1
14
0
2
50
5
0
Mul
laiti
vu
0
85
0
52
0
0
1
11
0
18
0
8
0
11
0
0
0
2
0
5
0
5
0
7
10
0
0
Bat
tical
oa
4
663
11
248
0
3
1
30
0
30
1
15
0
2
0
7
0
1
1
49
0
6
0
0
86
1
4
Am
para
0
126
2
61
0
1
0
3
0
10
0
15
0
12
1
5
0
1
1
86
0
8
0
10
86
1
4
Trin
com
alee
2
502
2
41
0
1
0
4
0
9
0
16
0
20
0
2
0
0
0
86
1
14
0
5
42
5
8
Kur
uneg
ala
42
1637
3
110
0
26
0
17
0
25
4
79
0
42
0
48
0
1
2
341
0
64
0
115
74
2
6
Put
tala
m
4
525
2
60
0
2
1
12
1
11
0
58
0
21
0
3
0
3
0
73
0
22
0
6
46
5
4
Anu
radh
apur
a 1
418
2
125
0
5
0
3
0
45
0
80
0
27
0
10
0
0
1
192
0
43
5
337
58
4
2
Pol
onna
ruw
a 6
421
0
39
0
4
0
6
0
1
0
57
0
8
1
7
0
0
1
133
0
25
5
112
43
5
7
Bad
ulla
20
551
1
130
0
9
0
11
0
9
0
46
2
94
4
121
0
0
2
65
1
108
0
0
53
4
7
Mon
arag
ala
7
228
2
51
0
4
0
8
0
33
1
64
2
144
3
105
0
2
2
71
1
21
0
27
64
3
6
Rat
napu
ra
29
2457
3
188
1
22
0
23
0
26
16
312
5
93
8
363
0
1
0
166
0
37
0
28
61
3
9
Keg
alle
10
1326
1
93
0
9
1
38
0
34
4
149
1
52
6
211
0
0
1
218
0
67
0
2
55
4
5
Kal
mun
e 2
135
3
105
0
1
0
6
0
74
0
1
0
0
0
0
0
0
0
88
1
8
0
0
31
6
9
SR
ILA
NK
A
54
5
32
45
1
83
2
84
4
2
15
9
19
6
95
2
8
37
7
3
19
04
2
0
11
92
3
8
14
98
0
1
9
37
3
45
6
11
8
77
1
3
10
72
6
4
36
Table 1: Selected notifiable diseases reported by Medical Officers of Health 27th – 03rd Oct 2014 (40th Week)
So
urc
e: W
eekl
y R
etu
rns
of
Co
mm
un
icab
le
Dis
ease
s (
WR
CD
).
*T=
Tim
elin
ess
refe
rs to
ret
urns
rec
eive
d on
or
befo
re 0
3rd
Oct
ober
, 20
14 T
otal
num
ber
of r
epor
ting
units
337
Num
ber
of r
epor
ting
units
dat
a pr
ovid
ed fo
r th
e cu
rren
t wee
k: 2
17 C
**-C
ompl
eten
ess
A =
Cas
es r
epor
ted
durin
g th
e cu
rren
t wee
k. B
= C
umul
ativ
e ca
ses
for
the
year
.
PRINTING OF THIS PUBLICATION IS FUNDED BY THE WORLD HEALTH ORGANIZATION (WHO).
Comments and contributions for publication in the WER Sri Lanka are welcome. However, the editor reserves the right to accept or reject items for publication. All correspondence should be mailed to The Editor, WER Sri Lanka, Epidemiological Unit, P.O. Box 1567, Colombo or sent by E-mail to [email protected]. Prior approval should be obtained from the Epidemiology Unit before publishing data in
this publication
ON STATE SERVICE
Dr. P. PALIHAWADANA CHIEF EPIDEMIOLOGIST EPIDEMIOLOGY UNIT 231, DE SARAM PLACE COLOMBO 10
Disease No. of Cases by Province Number of cases during current week in
2014
Number of cases during same
week in 2013
Total number of cases to date in 2014
Total num-ber of
cases to date in 2013
Difference between the number of
cases to date in 2013& 2014 W C S N E NW NC U Sab
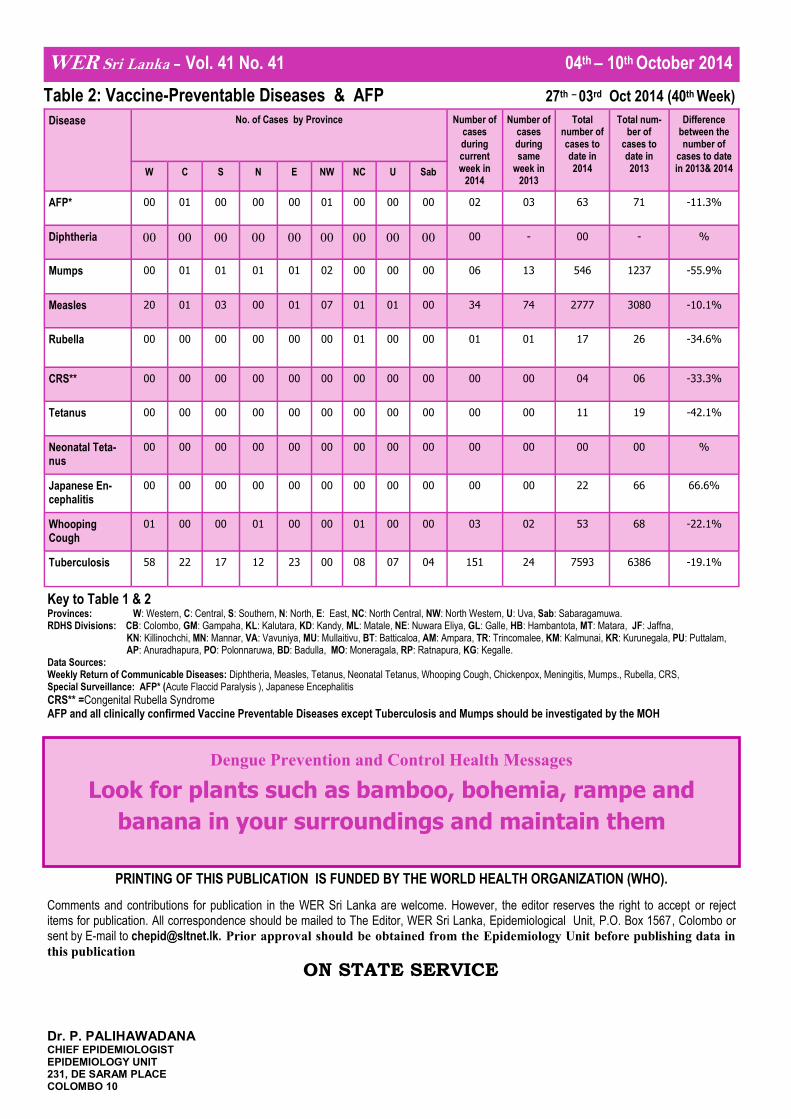
AFP* 00 01 00 00 00 01 00 00 00 02 03 63 71 -11.3%
Diphtheria 00 00 00 00 00 00 00 00 00 00 - 00 - %
Mumps 00 01 01 01 01 02 00 00 00 06 13 546 1237 -55.9%
Measles 20 01 03 00 01 07 01 01 00 34 74 2777 3080 -10.1%
Rubella
00 00 00 00 00 00 01 00 00 01 01 17 26 -34.6%
CRS** 00 00 00 00 00 00 00 00 00 00 00 04 06 -33.3%
Tetanus 00 00 00 00 00 00 00 00 00 00 00 11 19 -42.1%
Neonatal Teta-nus
00 00 00 00 00 00 00 00 00 00 00 00 00 %
Japanese En-cephalitis
00 00 00 00 00 00 00 00 00 00 00 22 66 66.6%
Whooping Cough
01 00 00 01 00 00 01 00 00 03 02 53 68 -22.1%
Tuberculosis 58 22 17 12 23 00 08 07 04 151 24 7593 6386 -19.1%
WER Sri Lanka - Vol. 41 No. 41 04th – 10th October 2014
Table 2: Vaccine-Preventable Diseases & AFP 27th – 03rd Oct 2014 (40th Week)
Key to Table 1 & 2 Provinces: W: Western, C: Central, S: Southern, N: North, E: East, NC: North Central, NW: North Western, U: Uva, Sab: Sabaragamuwa. RDHS Divisions: CB: Colombo, GM: Gampaha, KL: Kalutara, KD: Kandy, ML: Matale, NE: Nuwara Eliya, GL: Galle, HB: Hambantota, MT: Matara, JF: Jaffna,
KN: Killinochchi, MN: Mannar, VA: Vavuniya, MU: Mullaitivu, BT: Batticaloa, AM: Ampara, TR: Trincomalee, KM: Kalmunai, KR: Kurunegala, PU: Puttalam, AP: Anuradhapura, PO: Polonnaruwa, BD: Badulla, MO: Moneragala, RP: Ratnapura, KG: Kegalle.
Data Sources: Weekly Return of Communicable Diseases: Diphtheria, Measles, Tetanus, Neonatal Tetanus, Whooping Cough, Chickenpox, Meningitis, Mumps., Rubella, CRS, Special Surveillance: AFP* (Acute Flaccid Paralysis ), Japanese Encephalitis
CRS** =Congenital Rubella Syndrome AFP and all clinically confirmed Vaccine Preventable Diseases except Tuberculosis and Mumps should be investigated by the MOH
Dengue Prevention and Control Health Messages
Look for plants such as bamboo, bohemia, rampe and
banana in your surroundings and maintain them