Embed Size (px)
Citation preview

Weekly Report 19 August 2012
y q3213 u Macro-economic Developments and Comments
The University of Michigan index of consumer confidence for August rose to 73.6 from 72.3 in June. Consensus was for 72.2.
The Conference Board said that its index of US leading indicators rose by 0.4% in July after it declined by 0.4% in June.
New housing construction in the United States fell to 746,000 units in July from 754,000 units in June while building permits, which is a proxy for future construction, rose to an annualised rate of 812,000 units. This is the highest level since August 2008.
US industrial production growth was stronger than had been expected in July, but a larger downwards revision to June makes the data a net negative. Output in July rose 0.6% month on month (0.5% was consensus) although June was revised down from a rise of 0.4% month on month to a rise of 0.1% month on month.
On an annualised basis, US industrial production growth in July increased by 4.4% year on year, a much healthier level than that suggested by the recent weakness in the ISM.
US inflaheadlin
Page 1
tion was softer than had been expected, with the month-on-month change in e CPI flat for the second month in a row, against an expected 0.2% month on

Weekly Report 19 August 2012
month rise. The annualised rate of inflation eased from 1.7% year on year to 1.4% year on year (consensus was for 1.6%) Core CPI rose by 0.1% month on month (0.2% was consensus) leaving the annualised rate of increase at 2.1% year on year (2.2% year on year was expected).
The Empire manufacturing index was weaker than had been expected, falling from +7.4 to -5.9 (+6.4 expected).
The NAHB index of house builder confidence rose from 35 to 37 (expected 35), the highest level since February 2007. This is still some way off the long term average of 47, but at least the housing sector is now making a small positive contribution to US growth.
Page 2 of 29

Weekly Report 19 August 2012
The chief economist of a large hedge fund said in a note to clients last week that: “Tuesday’s better than expected US retail sales data has seen market expectations for Fed QE in September scaled back. Although there is still a consensus that the Fed will eventually need to ease policy, the time frame for any action seems to be being pushed back towards the end of the year or into 2013. As a result the dollar was a touch firmer today (Wednesday) and this proved sufficient to pressure base metals lower, notwithstanding the continued ascent of crude oil prices, with Brent over $115/bbl today.”
Eurozone GDP contracted by 0.2% quarter on quarter in Q2, in line with market expectations. Growth in France and Germany surprised on the upside while exports also allowed the Netherlands and Austria to grow.
Elsewhere the contractions were deep, particularly in Italy, Finland and Portugal. With virtually all indicators pointing to a sharper decline in Q3 GDP, it is clear that the Eurozone has moved back into a recession.
This will make it even more difficult for most member states, not just those in the periphery, to meet their fiscal targets.
Eurozone industrial production in June fell 0.6% month on month. This was much worse than the 0.2% month on month fall expected, although on a positive note May’s increase was revised higher from 0.6% month on month to 0.9% month on month. This left Eurozone industrial production down 2.1% year on year.
In Germany the ZEW survey of economic sentiment was worse than expected, falling from -19.6 to -25.5 (-18.0 was consensus).
In contrast the US retail sales figures were stronger than had been expected. US retail sales jumped unexpectedly in July and by the biggest amount in five months, the Commerce Department said. Lower fuel prices and modest growth in employment helped spur a 0.8% monthly rise in retail and food services sales. Consensus was for a rise of only 0.3% month on month. On an annualised basis retail sales were up 4.1% year on year.
They amounted to a seasonally-adjusted $404bn in July and were 4.1% higher from a year earlier. The data pointed to a modest recovery in the economy, as spending makes up nearly three-quarters of America's economic output.
“The retail sales data suggest that the US economy fared surprisingly well in July in the face of on-going uncertainty and renewed contraction in the Eurozone” said Chris Williamson, the chief economist of Markit. Mr Williamson cautioned that the sales data can be volatile. "The 0.8% rise in July came on the back of a 0.7% fall in June," he said.
Page 3 of 29

Weekly Report 19 August 2012
Japan’s economy, the world’s third largest, grew at an annualised 1.4% in the second quarter versus consensus expectations of a 2.3% rise, as weak exports and softer consumer spending offset strong public investment in the tsunami-stricken region of Tohoku. This left the annualised rate of GDP growth at 2.5% year on year. Japanese GDP is still 3.3% below its Q1 2008 peak as the chart below shows.
The disappointing data represented a sharp drop from the first quarter, which saw annualised growth of 5.5% as Japanese consumers finally shook off their post- tsunami restraint.
Japan has struggled to adjust to the effects of a strengthening yen and faltering growth in key export partners such as China and the EU. During the second quarter the yen rose 4% against the US dollar, as a surplus of imports over exports trimmed 0.1% from overall output.
China
The Chinese government reported over the weekend that average new home prices in China’s 70 major cities fell 1.5% in July from a year ago. This is the fifth consecutive month of price falls. On a month to month basis, however, prices were up 0.1% in July after staying flat in June and falling for eight consecutive months from October through May.
The China Banking Regulatory Commission has told lenders to push for faster home sales saying that they see signs of credit quality worsening. Lenders must demand more collateral or tell developers to sell projects or stakes. Lack of funding, high leverage and a peak of loans maturing have increased the risk that some
Page 4 of 29

Weekly Report 19 August 2012
developers’ financing chains may collapse, the CBRC told lenders. This ties in with the warning issued by KPMG LLC last month when it said developers are facing “significant liquidity issues.” According to Centaline Group in a report emailed on 13/8/12 developers now have stockpiles of completed homes equivalent to over 10 months of sales.
The CBRC said in a report issued last week that Chinese banks’ bad loans increased again in the last quarter. Non-performing loans increased by Rmb 18.2 billion to Rmb 456.4 billion. Weaker loan demand is also a growing concern, banking sources say.
Foreign direct investment in China fell to a two-year low in July. Investment fell 8.7% on a year on year basis to $7.58 billion. This was the eighth fall in nine months and the smallest inflow since July 2010. A spokesman for the Ministry of Commerce, which released the figures on Thursday, said “In the second half, China’s foreign trade and export situation will be grimmer, there will be more difficulties, harder tasks, and the pressure of achieving the full-year target will be bigger. China has a target of 10% growth in trade this year.
The PBoC is likely to cut the reserve ratio requirement (RRR) within the next two weeks to help stimulate the economy. The RRR currently stands at 20%.
The six LME metals’ stocks and prices LME
closing price 17/8/12
LME closing price 10/8/12
LME closing price 27/7/12
LME closing price 20/7/12
LME closing price 13/7/12
LME closing price 6/7/12
LME closing price 29/6/12
Cu 7,539 7,490 7,565 7,545 7,700 7,531 7,685 Al 1,858 1,881 1,895 1,892 1,910 1,896 1,911 Pb 1,895 1,892 1,924 1,901 1,880 1,860 1,861 Zn 1,797 1,835 1,859 1,840 1,874 1,844 1,877 Ni 15,630 15,400 15,880 15,950 16,155 16,150 16,730 Sn 18,495 17,875 18,106 18,930 18,780 18,500 18,775 Source of prices: LME. All prices in dollars per metric tonne and basis three months LME.
Page 5 of 29

Weekly Report 19 August 2012
LME Stocks LME stocks
17/8/12 10/8/12 27/7/12 End 2011stock level
Change since end 2011
% ch since end 11
Copper 234,550 241,250 250,300 370,900 -136,350 -36.8 Aluminium 4,919,925 4,860,950 4,840,625 4,970,400 -50,475 -1.0 Lead 319,200 325,600 328,975 353,075 -33,875 -9.6 Zinc 978,475 973,700 1,005,200 821,700 156,775 19.1 Nickel 114,900 116,676 112,698 90,048 24,852 27.6 Tin 11,630 11,685 11,770 12,190 -560 -4.6 Source: LME N.B. all figures are metric tonnes
High-Lows for LME Metals 2012 Cu Al Pb Zn Ni Sn 8765/7219.5 2361.5/1827.25 2329/1742 2220/1745 22150/15236 25880/17125 Source: LME all prices in dollars per metric tonne basis three months LME
High-Lows for LME Metals 2011 Cu Al Pb Zn Ni Sn 10190/6635 2803/1955.75 2904/1772.25 2599.75/1718.5 29425/16550 33600/17000Source: LME all prices in dollars per metric tonne basis three months LME
High-Lows for LME Metals 2010 and 2009 2010 9687/6037.5 2500/1828 2690/1535 2736/1577 27595/16975 27500/148502009 7423/3025 2305/1279 2525/957 2615/1070 21325/9250 17000/9700 All in dollars per metric tonne basis three months LME
Page 6 of 29
Weekly Report 19 August 2012
Average Prices for Cash LME Metals in $ per metric tonne and cents per pound Average year to
date 2012 Average for2011
Average for 2010
Average for 2009
Copper $7,979.72 (361.95¢/lb
$8,818.48 (400.0 ¢/lb
$7,526.57 (341.4 ¢/lb
$5,163.22 (234.2 ¢/lb
Aluminium $2,034.69 (92.29¢/lb
$2,403.04 (109.0 ¢/lb
$2,171.55 (98.5¢/lb
$1,666.69 (75.6 ¢/lb
Lead $2,001.89 (90.80¢/lb
$2,403.04 (109.0 ¢/lb
$2,145.10 (97.3 ¢/lb
$1,726.22 (78.3 ¢/lb
Zinc $1,948.86 (86.76¢/lb
$2,204.62 (100.0 ¢/lb
$2,158.32 (97.9 ¢/lb
$1,657.87 (75.2 ¢/lb
Nickel $17,909.78 (812.37¢/lb
$22,883.96 (1,038.0¢/lb
$21,801.49 (988.9 ¢/lb
$14,700.41 (666.8 ¢/lb
Tin $21,077.20 (956.05¢/lb
$26,102.70 (1,184 ¢/lb
$20,401.55 (925.4 ¢/lb
$13,591.48 (616.5 ¢/lb
Page 7 of 29

Weekly Report 19 August 2012
Copper Three months LME copper chart – daily close – February 2012 to the present
Source: Futuresource
Three months LME copper closed on Friday at $7,539 per tonne. This morning three months LME copper is trading at $?????. Dollar/euro is $?????? versus a close on Friday of $1.2320.On Friday copper had a contango of $6 per tonne versus a contango of $6 per tonne on the previous Friday. Copper rose 0.7% last week after rising by 0.6% in the previous week. Shanghai copper stocks fell 1,901 tonnes to 156,151 tonnes.
Copper prices stay high thanks to widespread hopes amongst investors that China will soon launch a stimulus package. And that may be followed, the bulls hope, by a fresh QE programme in the States and some effort by ECB to help the periphery nations by keeping bond yields low. And all this should happen in September which is only a few weeks away!
Many technical analysts have raised their trading range for copper again with the top end of the range seen as being $7,800 and the bottom end of the range as $7,400 per tonne both basis three months LME.
Page 8 of 29

Weekly Report 19 August 2012
Most Chinese firms and dealers see the ideal forward buying range as being $7,300 to $7,200 per tonne. The Shanghai – London differential still has the SHFE at a $100 per tonne discount to London.
Copper open interest remains around the lowest levels seen since mid-2007. This, dealers point out, is exacerbating copper’s range bound behaviour at present and there is virtually no scope for a sharp short covering rally or heavy long liquidation. Copper simply lacks momentum and needs to have some sort of shock or news development that will send prices moving either significantly higher or lower.
Chinese consumption remains quite subdued. One Chinese merchant said in an email to clients that only 40% of some 2,000 copper fabricators in Jiangxi province were working.
On the news front a major bank, which is a leading financier of bonded copper stocks in China, said in a note to clients that it estimates copper stock levels in the bonded zones of Waigaoqia and Yangshan at 600,000 tonnes in early August, up from 500,000 tonnes in July. The bank says that “including commercial stocks held in the domestic market, total stockpiles sit at around one million tonnes, equivalent to roughly seven weeks of demand and a manifestation of the slowing growth in the Chinese economy.”
“The ground has finally cracked under the weight of China’s copper inventories,” the bank said. “China’s rising copper inventory will act as a head wind to three month LME copper prices in the coming weeks.”
The bank warned that “Investors should be wary of linking import data to China’s real demand, as the vast majority of imports are based on one year term contracts rather than spot buying.”
Easing policies by Beijing anticipated for later this year should kick start a recovery in demand for copper late in the fourth quarter, although “…it will be modest at best,” the bank warned. “We recommend that consumers buy on dips towards the $7,220 a tonne (level), looking for a rally back up towards $8,000 a tonne.”
One very experienced Chinese copper merchant said in a note to clients that stocks along the supply chain in China these days are “…running on lower levels of inventory than has perhaps been the case in the past owing to a change in the government’s stance on the currency (the renminbi).”
At present the Rmb to dollar trading range is 6.35 – 6.40. But some currency analysts think the Rmb will depreciate as the year goes on to a 6.50 to the dollar
Page 9 of 29

Weekly Report 19 August 2012
level. If this were to occur then some think it would encourage further destocking within China as Chinese copper users see their purchasing power falling. Meanwhile, copper producers outside of China will probably continue to sell to China in bulk and avoid delivering into LME warehouses. That in turn could lead to falling LME inventories and tightening spreads and possibly a big backwardation. But this is all theoretical at this point of time.
“Looking ahead,” the merchant continues, “the key for copper still appears to be whether China’s economic slump deepens or not, with three main scenarios emerging.”
The first is the “Chinese economy weakens further and excess copper inventory either builds up or gets re-exported, resulting in a rather ominous outlook for the copper price.”
The second one is “A soft landing is achieved, copper prices stabilise but find it tough to rally significantly above current levels as inventories normalise and slowly get worked through.”
The third and “most bullish outcome for copper is if another sustained backwardation on the LME emerges resulting in a stock transfer from bonded warehouse to the LME. You may perhaps get short term price weakness as LME stocks pick up, but you nevertheless also see a forced destocking of bonded warehouse stocks and a regaining in initiative in terms of controlling that inventory. Chinese restocking, when it finally occurs, then depends on re-importing LME, thereby boosting prices.”
The merchant concludes “Given the current forward structure, lack of appetite in the market and on-going concern about the state of the global economy, scenarios one and two look most likely for the time being, with the bearish arguments still very much in the ascendancy.”
Chinese reported refined copper production in July was 483,000 tonnes, a rise of 0.8% on July 2011. This figure takes the seven month total to 3,403,000 tonnes. This is a rise of 9.2% over the same 2011 period. This suggests China will produce around 5.7 million tonnes this year.
Output of copper semis in July was 969,000 tonnes, a rise of 6.8% year on year. But on a month on month basis July was down 22.5%. This takes the total semis production for the first seven months of 2012 up to 6,465,000 tonnes, a rise of 10.2% year on year.
Page 10 of 29

Weekly Report 19 August 2012
These figures, if believed, would suggest that China will produce around 11.4 million tonnes of semis in 2012. But some analysts think this figure is too high with part of the strength in semis output likely to be due to double-counting of wire rod and wire and cable products.
Another bearish development last week was the decision by Cochilco, Chile’s state copper commission, to lower its price forecast for cash LME copper this year to $3.52 a lb ($7,760 per tonne) from $3.85 a lb ($8,488 per tonne). It also lowered its average price forecast for 2013 to $3.48 ($7,672 per tonne) from $3.75 per lb ($8,267 per tonne).
Cochilco said it expected global demand for copper to rise 0.9% this year to 20.07 million tonnes. This is down from its previous forecast of 2.4% rise. Cochilco is a bit more optimistic for next year seeing global copper usage rising by 1.8% to 20.4 million tonnes.
Global mined copper output is expected to rise 1.6% this year to 16.6 million tonnes on better supplies from Chile, China, and Mexico. Output will increase again in 2013 by 1.9% to 16.9 million tonnes.
Cochilco sees Chilean output rising 2.7% this year to 5.4 million tonnes and then rising again next year by 1.9% to 5.5 million tonnes. There will be a global supply deficit of 214,000 tonnes this year which will fall, Cochilco says, to 26,000 tonnes in 2013.
Other copper news
The PASAR copper smelter and refinery in the Philippines has restarted production after a fire shut down all operations in January. The refinery can produce 215,000 tonnes per year of cathodes. ‘The smelter and refinery is 78% owned by Glencore. There is talk about spending $500 million to $600 million to expand the smelter’s capacity and to build a power plant.
Output at Chile’s Escondida jumped 18.3% on a year on year basis in the first half of 2012 to 533,200 tonnes. This is largely due to an improvement in ore grade. Escondida is the world’s largest copper mine. The mine is 70% owned by BHP Billiton and 30% by Rio Tinto. In 2011 Escondida’s output fell 24.6% to 819,261 tonnes due to falling ore grades and a two week strike.
According to a Reuters report, JX Nippon Mining and Metals said last week that copper treatment fees (TCs/RCs) are set to rise next year as new and existing mining projects increase raw material supplies. Pan Pacific expects world copper
Page 11 of 29

Weekly Report 19 August 2012
concentrate output to rise to 12.7 million tonnes and smelting capacity to reach 14.6 million tonnes.
China’s State Reserves Bureau (SRB) continues to be lobbied by smelters up and down the country to begin a support buying programme for the surplus metals being produced. The SRB has made no decision on this. But enthusiasts say that the last SRB buying programme, which was launched in December 2008 and ended last December 2011, had planned to purchase one million tonnes of aluminium, 400,000 tonnes of copper, and a total of 400,000 tonnes of lead and zinc. In the event, the SRB only bought 235,000 tonnes of copper, 590,000 tonnes of aluminium, and 159,000 tonnes of refined zinc. The enthusiasts say this means that the SRB has even more money as of result of this shortfall with which to use to buy up surplus metal production.
Copper premiums in Shanghai are level with the levels that prevailed in the previous week, according to Metal Bulletin. Premiums in Singapore are ranging between $30 to $70 per tonne.
US copper producer Augusta Resources and metals hedge fund Red Kite Management have expanded their offtake agreement for copper concentrates, Augusta said last week. Under the new agreement, Red Kite will purchase 20% of Augusta’s gross annual concentrate production from its Rosemont copper property near Tucson, Arizona, until 1.5 million metric tonnes are delivered. The previous agreement was for Red Kite to purchase 16.25% of gross annual concentrate output. Red Kite is also making an additional loan of $40 million to Augusta in addition to the existing $43 million loan. When in production the mine expects to produce 110,000 tonnes of copper per year for 20 years.
Rio Tinto’s massive Oyu Tolgoi copper and gold project in Mongolia is nearing completion and remains on track for commercial production next year, according to a spokesman in the minority holder in the project – Turquoise Hill Resources Ltd (nee Ivanhoe Mines).
A study done by a major bank has concluded that Chinese copper smelters and refineries have had a cap on maximising production since around April. Spot TC/RCs are currently quoted at $40 per tonne and $4 per lb and this quote is not attractive enough to encourage Chinese smelters to maximise refined production run rates. The bank estimates that the break even rate at which the smelters will maximise production is at $50 per tonne and $5 per lb.
Page 12 of 29

Weekly Report 19 August 2012
Aluminium Three months LME aluminium – daily close – February 2012 to the present day
Source: Futuresource
Three months LME aluminium closed on Friday at $1,858 per tonne. This morning three months aluminium is trading at $?????. On Friday aluminium had a contango of $37 per tonne versus a contango of $40 per tonne on the previous Friday. Aluminium fell 1.2% last week after rising by 1.1% in the previous week. Shanghai aluminium stocks rose by 17,269 tonnes to 358,643 tonnes.
Aluminium came under heavy selling pressure as the week drew to a close with prices hitting a 23 month low at one point. The selling came from both macro funds and some CTAs and technical funds. They are all hoping to break through the support level which currently stands at around $1,820 per tonne basis three months. If that were to go then the next support level is around $1,760. Overhead resistance is seen as being around $1,920 per tonne basis three months. So all in all, aluminium has a nice wide range of $100 per tonne to move about in without threatening dramatic break outs on either side.
In the meantime, premiums continue to rise to new highs in all major regions almost on a weekly basis. In the United States the Mid-West premium is now at a fresh record high of 10.75 ¢/lb to 11.25¢/lb. This is up from 10.50¢/lb to 11¢/lb in the
Page 13 of 29

Weekly Report 19 August 2012
previous week. Lloyd O’Carroll, a leading American aluminium analyst, last week forecast that the Mid-West premium would rise to about 13¢/lb in coming months.
These premiums exist because access to metal units has been limited by a combination of 1) carry trades (stock financing deals funded by forward price spreads. The returns from these have been enriched by the rising premiums the carry trades have helped to support and 2) de facto limits on the rate at which LME metal stocks can be brought back into the market.
One major bank calculated last week how long it would take to withdraw aluminium stocks held in key LME warehousing locations. It found that Detroit took the lead at 620 days followed by Vlissingen in the Netherlands with 572 days. Then Rotterdam at 307 days, Singapore at 292 days, Baltimore at 219 days, New Orleans at 152 days, Mobile at 98 days, Trieste in Italy at 97 days, Johor in Malaysia at 96 days, and Tyne and Wear in the North East of England at a very modest 37 days.
The rise in premiums has two important implications for the aluminium market. These can be summed up as follows:
Since the premiums are paid to the smelters the revenues arising provide some offset to the fall in LME prices. Thus less production is operating at a loss than would otherwise be the case.
Aluminium smelters are bound in much more closely to their key counterparties than in the past because such a high percentage of revenue is now generated by premiums. This particularly applies to contract premiums as well as spot market premiums.
So all seems to be absolutely sunny and rosy in the garden. But one major bank which has studied the premium market closely had this warning to make in a report last week. “While we expect aluminium premiums to remain well supported in the short to medium term, it should be acknowledged that the risk/reward balance is increasingly skewed to the downside and that the scope for premium appreciation to offset any further weakness in the exchange price is accordingly limited.”
The bank goes on to highlight this point with a cash cost graph that plots the C1 cash cost, the LME price plus premium (in the North American, European, and Japanese markets), and the year to date LME price average.
Out of 47 million tonnes of total global capacity, the breakeven point comes out at around 37 million tonnes. So 21.3% of global capacity is losing money even with premiums where they are today. But the other 78.7% percentage are making money
Page 14 of 29

Weekly Report 19 August 2012
and of that 78.7% a good 24.5 million tonnes or 52.1% are making good money as their operations are all within the C1 cash cost curve.
Chinese aluminium output in July rose 6.9% year on year to 1,671,000 tonnes. Total output for the first seven months of 2012 came to 11,302,000 tonnes. This was a rise of 9.9% year on year. This figure puts China on course to produce 19.6 million tonnes in 2012.
Output of aluminium semis in the first seven months is reported to have been 16,240,000 tonnes, a rise of 12.1% year on year and consistent with primary aluminium consumption growth of around 9.0% year on year.
China’s imports of unwrought aluminium and aluminium products in July were 97,651 tonnes. This was a rise of 9% from June and a rise of 38.7% year on year. Total imports for the first seven months of 2012 were 711,363 tonnes. This was a 34% rise from a year ago.
And the aluminium world should thank China for importing so much aluminium from the West because otherwise the supply surplus would be very much larger than it is.
Drucker Worldwide and the European Aluminium Association have completed a study which found that aluminium usage has almost tripled in cars made in Europe since 1990. The amount of aluminium per car in Europe is 140 kilograms this year (309 lbs) compared with only 50 kilograms (110 lbs) in 1990.
Emirates Aluminium Company is looking to raise $4 billion from loans and bonds to finance expansion. Emal is a joint venture between Abu Dhabi’s Mubadala Development Company and Dubai Aluminium. Banks have been sent a request for proposals for loans and have until September 28 to reply. The loans are expected to be both conventional and Islamic. The borrowings will finance Emal’s phase II expansion which aims to increase annual output of primary aluminium to 1.3 million tonnes by 2015. The current smelter is due to hit its output target of 800,000 tonnes per year later on this year.
Rio Tinto Alcan said last week it has lifted its force majeure on shipments of 99.7% grade P1020 aluminium ingot from Sohar Aluminium in Oman. The force majeure was declared on July 19 citing quality issues.
Chalco (Aluminium Corporation of China) reported a first half net loss of Rmb 3.25 billion (around $510.8 million) for the six months ended June. The loss was blamed on falling aluminium prices and rising costs. For the same period of 2011 Chalco made a net profit of Rmb 413 million.
Page 15 of 29

Weekly Report 19 August 2012
Nickel
Three months LME nickel – from February 2012 to the present – daily close
Source: Futuresource
Three months LME nickel closed on Friday at $15,630 per tonne. This morning three months nickel is trading at $???????. On Friday nickel had a contango of $64 per tonne versus a contango of $63 per tonne on the previous Friday. Nickel rose 1.5% last week after falling by 1.4% in the previous week.
An interesting situation may be developing in nickel. Last week saw a surge in cancelled warrants to a total of 14,184 tonnes. This is around 12.3% of total LME nickel stocks of 114,900 tonnes. The main location for this was Johor in Malaysia which now accounts for just under 50% of total cancelled warrants. The other concentration of cancelled warrants is in Rotterdam. This is the highest level of cancelled warrants seen for at least 15 years.
On the face of it nickel is an unlikely metal to start a squeeze in as it is currently in quite large over supply and likely to stay that way for another two or three years. A major bank decided to investigate and found that on warrant inventories have to fall to around 40,000 tonnes before you see a significant reaction in the nearby spreads. On that basis there is still 60,000 tonnes to go.
Page 16 of 29

Weekly Report 19 August 2012
“Interestingly, however,” the bank says in a note to clients, “Rotterdam warrants, which stand at just over 62,000 tonnes are increasingly tightly held and are no longer becoming available through clearing. While overall on-warrant stocks still stand at over 100,000 tonnes therefore for the purposes of Tom/Next type activity, the real float of available units is closer to the 40,000 tonnes mark.”
“It remains highly debateable,” the bank concludes, “whether the ingredients are there for any tightness to emerge in the near dated nickel spreads, and certainly not the cash – three months period. If the trend of warrant cancellations continues, however, there may well be some tightness in the very near dated spreads. More generally, physical premia may also continue to pick up, reflecting the shortage of readily available nickel units, owing to warehouse queues and the perception at least of tighter market conditions.”
The slowdown in Chinese nickel pig iron production is finally beginning to be seen in the figures. In July Chinese production of refined nickel was 20,000 tonnes. This was a rise of 4.8% year on year but a fall of 14% from June’s level of 23,688 tonnes. Production for the first seven months of 2012 was 121,000 tonnes which was down 4.0% year on year. At July’s rate of production China will produce 239,000 tonnes of nickel.
Finnish nickel producer Talvivaara last week lowered its production guidance for the year to 17,000 tonnes. The original guidance figure was for 25,000 to 30,000 tonnes. The mine has encountered a number of mining problems.
South Korea’s Posco said last week it plans to cut stainless steel cold rolled coil output this month by around 10,000 tonnes to help stabilise prices. If that doesn’t do the job, then a Posco spokesman said the company would make further production cuts.
Metal Bulletin says that alloy surcharges for flat rolled stainless steel in Europe are expected to fall further in September as nickel prices continue to churn about at “depressed price levels”.
Page 17 of 29

Weekly Report 19 August 2012
Zinc Three months LME zinc – from February 2012 to the present day – daily close
Source: Futuresource
Three months LME zinc closed at $1,797 per tonne on Friday. This morning three months zinc is trading at $??????. On Friday zinc had a contango of $24 per tonne versus a contango of $16 per tonne on the previous Friday. Zinc fell 2.3% last week after falling by 0.3% in the previous week. Shanghai zinc stocks fell 1,954 tonnes to 304,613tonnes.
Zinc saw some fresh CTA and technical fund selling last week with the bears aiming to break support in and around the $1,780 area basis three months LME.
Chinese zinc production in July was 366,000 tonnes, a fall of 9.9% year on year. The total for the first seven months of 2012 is 2,720,000 tonnes, a fall of 6.6% year on year.
China will probably produce around 4.3 million to possibly 4.5 million tonnes of zinc this year.
Page 18 of 29

Weekly Report 19 August 2012
Lead
Three months LME lead – from February 2012 to the present day – daily close
Source: Futuresource
Three months LME lead closed on Friday at $1,895 per tonne. This morning three months lead is trading at $??????. On Friday lead had a contango of $13 per tonne versus a contango of $3 per tonne on the previous Friday. Lead rose 0.2% last week after falling 0.2% in the previous week. Shanghai lead stocks fell 674 tonnes to 19,117 tonnes.
Lead continues to be dominated by the presence of a dominant position holder of cash and TOM warrants. LME data on 14/8/12 show a dominant holder of cash and TOM warrants (50% to 79% band). This was the factor behind the recent tightness in the TOM/Next spread.
As one trader said in a note to clients: “It is still not clear as to why the tightness emerged, however, it is worth noting that there was a period in mid-May (15th – 17th) where three months prices fell around 5% over a three day period, but on the back of nearly 22,000 lots on LME Select (equivalent to 7,333 tonnes of selling per day). Average daily turnover on LME Select so far this year is 4,535 lots, suggesting a large short position had been added at that time.”
Page 19 of 29

Weekly Report 19 August 2012
It is noteworthy that TOM/Next has shifted $10 per tonne backwardation recently to a contango of around $1.25 per tonne.
Lead was featured on Friday the 17th August with a jump of 21,925 tonnes in cancelled warrants. That takes the total of cancelled warrants in LME warehouses to 55,650 tonnes. Total cancelled warrants now equal 17.4% of total LME stocks which stood at 319,200 tonnes on Friday.
Chinese refined lead production in July was 420,000 tonnes, a rise of 14.8% year on year. The total for the first seven months of 2012 is 2,680,000 tonnes, a rise of 8.9% year on year. On the basis of these figures China could produce between 4.7 million to 4.9 million tonnes of refined lead this year.
Tin
LME three months Tin – from February 2012 to the present – daily close
Source: Futuresource
Three months LME tin closed at $18,495 per tonne on Friday. This morning three months tin is trading at $???????? per tonne. Tin had a contango of only $1 per tonne on Friday versus a backwardation of $5 per tonne on the previous Friday. Tin rose 3.5% last week after falling by 0.1% in the previous week.
Page 20 of 29
Weekly Report 19 August 2012
At last, LME prices have responded to the tightening physical situation in tin. Last week prices rallied 3.5% as the level of cancelled warrants soared to 6,055 tonnes or 52% of total LME stocks. LME stocks fell a net 55 tonnes on the week to end on Friday the 17th at 11,630 tonnes. On Friday the 10th August cancelled warrants stood at only 4,765 tonnes. This is the highest level of cancelled warrants seen in the tin market for at least 10 years.
Tin premiums are expected to rise in the fourth quarter as supplies of tin become tighter. Traders are talking about premiums rising by up to $700 per tonne over the next two months.
Indonesian refined tin exports in July fell 14% month on month to 8,298 tonnes in July. June’s exports of refined tin were 9,647 tonnes. This is the largest one month fall in six months.
PT Timah has been asked by the government to take over the operations of PT Koba Tin when its contract expires on March 31, 2013. Koba Tin is 75% owned by Malaysian Smelting Corporation and 25% by PT Timah.
Chinese tin production in July rose 9% year on year to 12,000 tonnes. Production in the first seven months of 2012 was 83,000 tonnes, a fall of 4.0% year on year. China is on target to produce around 146,000 tonnes of tin this year.
Page 21 of 29

Weekly Report 19 August 2012
Comex Gold – Basis October12– February 2012 to the present
Source: Futuresource
Gold
Spot London gold closed at $1,615 per oz on Friday. This morning gold is trading at $??????? per oz basis spot. Gold fell 0.2% last week after rising by 1% in the previous week.
Gold prices continue to churn about within a well-established range. The top of the range is seen as $1,640 to $1,650 per oz basis spot while the floor is around $1,560 to $1,550 per oz basis spot.
The bulls continue to hope that QE by the Fed, by the ECB, and by China will lift prices again and restart the bull market. Bullion dealers on the other hand are happy enough to try to trade within the range and make a living at it.
On the news front Bloomberg reports that George Soros and John Paulson both increased their stakes in gold ETFs after prices posted their largest quarterly fall since 2008. George Soros more than doubled his investment in the SPDR Gold Trust to 884,000 shares as of June 30 while John Paulson increased his holdings by 26% to 21.8 million shares. Of the two, John Paulson is faring the worst with his
Page 22 of 29

Weekly Report 19 August 2012
primary gold fund down some 23% through July as “…sagging bullion prices and slumping mining stocks take their toll on his fund’s performance.”
Also on the news front, the World Gold Council said last week that demand for gold fell to 990 tonnes during the second quarter of 2012. This is lowest level of off take seen since the first quarter of 2010. The figure is down 7% from last year.
“India and China represent half of global gold consumption and clearly we are seeing a slowdown in both markets,” Marcus Grubb, managing director for investment at the London-based WGC, said in an interview.
Gold prices have fallen by around 17% from their all-time high of $1,920.30 an ounce set in September 2011. But prices remain significantly higher than five years ago, when the metal traded at about $650 an ounce. Since the first signs of the financial crisis emerged in mid-2007, corn, gold and oil have been the best performing assets.
India, which traditionally has been the world’s largest gold consumer but is about to be surpassed by China, has seen the weakest demand recently due to a combination of slow economic growth and a weak rupee against the dollar. The Indian rupee has fallen almost 25% against the US dollar over the past year, lifting the price that Indians pay for gold to near record highs.
India bought 181.3 tonnes of gold in the second quarter, a two-year low, and the industry believes that purchases will remain weak for the rest of the year as prices in local currency remain high combined with the effect of a poor monsoon will have on agricultural production. Gold demand is traditionally strong in the rural areas of India.
Mr Grubb said that India was likely to close the year purchasing just 750 tonnes of gold, down 25% from last year and the lowest in five years. China, which is on track to buy 850 tonnes, will overtake India to become the world’s largest consumer of gold, according to WGC estimates.
Bullion dealers are cautious, however, about writing off India as the main source of demand as some did in 2009 when consumption also fell sharply because the local economy and currency weakened.
But as soon as activity picked up and the rupee strengthened against the dollar the following year, gold purchases bounced back nearly 75% in 2010 to a record high of 1,006 tonnes.
Page 23 of 29

Weekly Report 19 August 2012
Investment demand in Europe and the US through exchange traded funds (ETFs) stagnated in the second quarter, with inflows at nearly zero tonnes. Gold ETF inflows stood at 54 tonnes in the April-June period of last year.
“The wild card is what will happen to investment in the second half and that will be driven by QE developments in the US, the Eurozone and even emerging countries like China,” Mr Grubb said.
Silver
Comex Silver basis September 12 – February 2012 to present – daily closing price
Source: Futuresource
London spot silver closed at $28.20 per oz on Friday. This morning silver is trading at $?????? basis spot. Silver rose 1.1% last week after rising by 2.3% in the previous week.
Silver continues to perform well with some bulls talking about $30 per oz basis spot in coming weeks. But most traders see silver halting at the $29 level basis spot. The $29 per oz level basis spot offers strong overhead resistance. As with gold, investors are looking for monetary stimulus measures coming soon from China, Europe, and the Fed.
Page 24 of 29
Weekly Report 19 August 2012
Platinum and Palladium
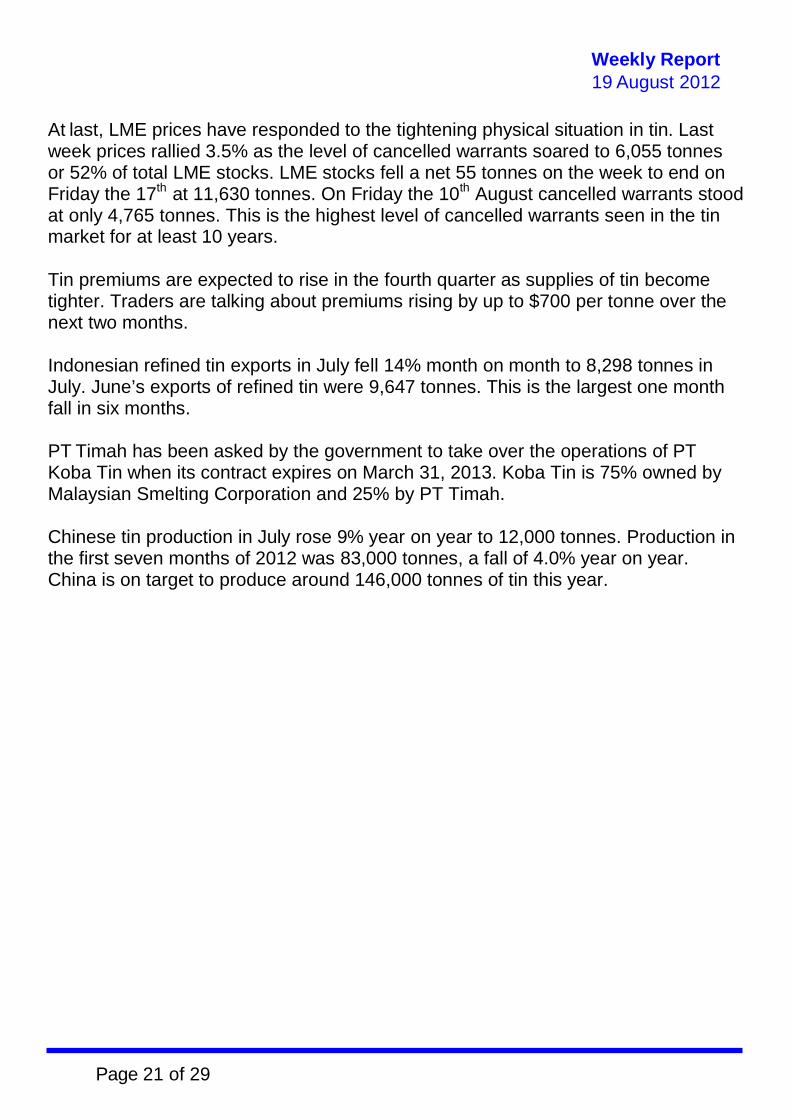
Nymex Platinum October12 – February 2012 to the present – daily close Source: Futuresource
Nymex Palladium September 12 – February 2012 to the present – daily close
Page 25 of 29

Weekly Report 19 August 2012
Source: Futuresource
London spot platinum closed at $1,445 per oz on Friday. This morning platinum is trading at $??????? per oz basis spot. London spot palladium closed at $592 per oz on Friday. This morning palladium is trading at $?????? per oz basis spot. Platinum rose by 4.0% last week after rising by 0.6% in the previous week. Palladium rose by 2.4% last week after rising by 0.9% in the previous week
South African police said on Friday that 34 striking miners were killed after police opened fire on protesting workers. Another 78 were wounded and 259 more strikers were detained on Friday. Frans Baleni, general secretary of the National Union of Mineworkers, said union shop stewards had counted more than 36 people killed in the violence that erupted on Thursday at the Marikana platinum mine complex, which is operated by Lonmin, the world’s third-largest platinum producer.
But Police Commissioner Riah Phiyega said on Friday that 34 protesters had been killed, and that police had been forced to open fire to protect themselves when they were charged by strikers armed with “dangerous weapons”.
She told a news conference that 78 people had been injured and 259 arrested in Thursday’s violence. “The police members had to employ force to protect themselves from the charging group.” she said.
The clashes have shocked South Africa and the global mining industry and are reminiscent of the violence experienced during apartheid.
Page 26 of 29

Weekly Report 19 August 2012
Jacob Zuma, South African president, on Friday declared himself “shocked and saddened” by the violence and has curtailed a visit to neighbouring Mozambique to return home to address the crisis.
Mining is a key driver of the South African economy, and half the world’s top 20 mining companies have operations in the country. It has the world’s fifth-biggest mining sector by gross domestic product value, according to the Chamber of Mines.
It is also home to about two-thirds of the world’s proven platinum reserves and accounts for roughly 80% of the world’s platinum production. The crisis at Marikana, which was triggered by a dispute between members of rival unions, has halted Lonmin’s production in South Africa.
The shooting erupted on Thursday after police apparently sought to disperse striking rock drill operators, who were armed with sticks, spears and machetes. The violence began a week ago and 10 people, including two policemen, were killed in earlier clashes blamed on a dispute between the NUM and the Association of Mineworkers and Construction Union. AMCU is a new, more militant body that has attracted increasing numbers of members away from the NUM.
In response to the violence, hundreds of police have been deployed to the mine site in South Africa’s platinum rich Bushveld Igneous Complex.
Lonmin has already lost six days of production as a result of the violence, representing 15,000 platinum equivalent ounces. The company warned that it is now unlikely to meet its production target of 750,000 ounces for the year. The Impala strike in January lasted for six weeks. Its cause was exactly the same as at Lonmin with AMCU trying to become recognised and gaining members.
The violence at Marikana pushes the miner, already under strain from the falling platinum price, closer to a breach of its debt covenants, making an emergency fund- raising more likely. Lonmin shares fell 1.9% to 636p on Friday, and are down 16% since the start of the week.
Many mining analysts expect that Lonmin will have to restructure its debt or seek additional funding, possibly through a rights issue. A few more days of lost production could push the company close to breaching its banking covenants.
As one firm of London brokers specialising in mining shares said to its clients on Friday: “While the loss of life is tragic, the harsh reality is that Lonmin which is estimated to earn EBITDA margins of 12.5% and net margin of 2.5% for 2012,
Page 27 of 29

Weekly Report 19 August 2012
cannot support the wage rises being demanded by the unions. The current economics of mining the PGMs in South Africa is not working and either prices have to rise or costs have to come down to attract any further capital.”
Adding to its problems, Lonmin also announced on Thursday that Ian Farmer, its chief executive, had been hospitalised with a serious illness.
Platinum prices rose to a one-month high of $1,457.24 an ounce on Friday, up nearly 5% in two days as the precious metal market digested the news of the bloodbath. The cost of the metal remains, however, under downward pressure due to falling consumption in Europe, where it is used to manufacture autocatalytic to clean up tailpipe emissions from diesel cars. Around 30% of platinum’s demad comes from Europe. Platinum prices peaked at nearly $2,300 in 2008.
Unions played an important role in the struggle against apartheid and remain powerful in the country, with the Congress of South African Trade Unions (Cosatu) a key member of the governing alliance led by the ANC. Cosatu issued a statement on Thursday condemning the violence and calling on “workers to observe maximum discipline and unity in the face of a ruthless attempt to divide and weaken them.”
The NUM is a member of Cosatu. But as frustrations over poverty and inequality in the country have grown, AMCU has succeeded in recruiting dissatisfied workers. “Their [AMCU] track record is not a good one,” said Andrew Levy, labour relations and labour law consultant. “Where they have gone, there tends to be high levels of wildcat strikes, damage to equipment and violence.” Mr Levy also said the government could be taking a more active role to end the dispute.
Most analysts are forecasting a slight surplus in the platinum market this year, but depending on how long hostilities at Lonmin last and if the unrest spreads to other miners on the Western limb of the platinum mining area, the surplus of around 150,000 to 200,000 ozs could easily be wiped out.
The platinum group metals basket (pgm) has averaged around $9,740 per oz for the year to date. All the pgm metals (platinum, palladium, and rhodium) are mined together as they occur homogenously in the ore of the South African platinum mines. The basket price calculation is made on the value of the different metals and their percentage weighting in total refined production.
At the current South African rand price for the basket of rand 8,990 per pgm oz, mining analysts estimate that 14.6% of platinum production (690,000 ozs) is at risk as well as 13.15% of palladium production (353,000 ozs) and 12.9% of rhodium
Page 28 of 29
Weekly Report 19 August 2012
production. The price is thought to be some 30% below a sustainable industry price to produce pgm metals.
Page 29 of 29