Embed Size (px)
Citation preview
St. John Fisher College St. John Fisher College
Fisher Digital Publications Fisher Digital Publications
Psychology Faculty/Staff Publications Psychology
3-2016
Weight-based rejection sensitivity: Scale development and Weight-based rejection sensitivity: Scale development and
implications for well-being implications for well-being
Kimberly McClure Brenchley St. John Fisher College, [email protected]
Diane M. Quinn University of Connecticut - Storrs
Follow this and additional works at: https://fisherpub.sjfc.edu/psychology_facpub
Part of the Psychology Commons
How has open access to Fisher Digital Publications benefited you?
Publication Information Publication Information McClure Brenchley, Kimberly and Quinn, Diane M. (2016). "Weight-based rejection sensitivity: Scale development and implications for well-being." Body Image 16, 79-92. Please note that the Publication Information provides general citation information and may not be appropriate for your discipline. To receive help in creating a citation based on your discipline, please visit http://libguides.sjfc.edu/citations.
This document is posted at https://fisherpub.sjfc.edu/psychology_facpub/11 and is brought to you for free and open access by Fisher Digital Publications at St. John Fisher College. For more information, please contact [email protected].
Weight-based rejection sensitivity: Scale development and implications for well-Weight-based rejection sensitivity: Scale development and implications for well-being being
Abstract Abstract We integrated theories of social stigma and rejection sensitivity to develop a new construct for understanding the effects of day-to-day experiences of interpersonal weight stigma: weight-based rejection sensitivity (W-RS), or a tendency to anxiously expect weight-based rejection. We created a new scale to measure W-RS. Studies 1 and 2 together established the scale as valid and reliable in a college student population. Study 3 examined the outcomes and predictive validity of W-RS by testing the effects of W-RS longitudinally across college students’ first semester. Those who were high in W-RS were found to be at additional risk for compromised psychological and physical well-being over time. W-RS also predicted poorer adjustment to college. Overall, W-RS could help to explain individual reactions to stigma and to predict when weight stigmatization may have a greater likelihood of impacting a target.
Keywords Keywords fsc2016
Disciplines Disciplines Psychology
Comments Comments The final published version of this article is available through the publisher: http://dx.doi.org/10.1016/j.bodyim.2015.11.005.
Creative Commons License Creative Commons License
This work is licensed under a Creative Commons Attribution-Noncommercial-No Derivative Works 4.0 License.
This article is available at Fisher Digital Publications: https://fisherpub.sjfc.edu/psychology_facpub/11
1
Running head: WEIGHT-BASED REJECTION SENSITIVITY
IN PRESS- FINAL SUBMITTED DRAFT
Weight-Based Rejection Sensitivity:
Scale Development and Implications for Well-Being
Kimberly J. McClure Brenchley
St. John Fisher College
Diane M. Quinn
University of Connecticut
Author Note
Kimberly J. McClure Brenchley, St. John Fisher College, 3690 East Avenue, Rochester,
NY 14618, USA; +1 585 385 8171; [email protected]
Diane M. Quinn, Department of Psychology, University of Connecticut, 406 Babbidge
Road, Unit 1020, Storrs, CT 06269, USA; [email protected]
WEIGHT-BASED REJECTION SENSITIVITY 2
Abstract
We integrated theories of social stigma and rejection sensitivity to develop a new construct for
understanding the effects of day-to-day experiences of interpersonal weight stigma: weight-based
rejection sensitivity (W-RS), or a tendency to anxiously expect weight-based rejection. We
created a new scale to measure W-RS. Studies 1 and 2 together established the scale as valid and
reliable in a college student population. Study 3 examined the outcomes and predictive validity
of W-RS by testing the effects of W-RS longitudinally across college students’ first semester.
Those who were high in W-RS were found to be at additional risk for compromised
psychological and physical well-being over time. W-RS also predicted poorer adjustment to
college. Overall, W-RS could help to explain individual reactions to stigma and to predict when
weight stigmatization may have a greater likelihood of impacting a target.
Keywords: weight stigma, obesity, rejection sensitivity, well-being
WEIGHT-BASED REJECTION SENSITIVITY 3
Whenever I go to the dining hall with one of my friends and I go to get more food he asks
if I really need it. He says that he is kidding but I continue to tell him that I do not think it
was funny.
– Research participant
People who are overweight and obese are often targets of negative interpersonal
treatment, including weight teasing and disapproving feedback from family and friends, romantic
rejection, poorer service in restaurants, stores and health care settings, and employment
discrimination (Puhl & Heuer, 2009). Research has elucidated adverse consequences of this
devaluation, including an emotional, social, and physical toll on those to whom it is directed
(Puhl & Heuer, 2009). In considering the experience of being stigmatized due to weight,
previous research has primarily focused on whether instances of negative treatment due to one’s
weight have occurred (e.g., frequency counts of instances of discrimination; Myers & Rosen,
1999) or whether obese people devalue themselves (i.e., internalized feelings of low self-worth;
e.g., Durso & Latner, 2008). What is missing is an understanding of how people navigate and
react to the small, daily interpersonal experiences of rejection such as the occurrence highlighted
in the quote above. People may be more or less sensitive to these types of daily
macroaggressions, and their expectations and reactions to them may affect their psychological
and physical outcomes.
In this article, we integrate a rejection sensitivity framework with theories of social
stigma to elucidate the effects of day-to-day experiences of interpersonal weight stigma. Within
this framework, we offer two primary contributions. First, we propose the construct of weight-
based rejection sensitivity and develop a scale for its measurement (Studies 1 and 2). Second, we
propose that those with increased weight-based rejection sensitivity are at additional risk for
compromised psychological and physical well-being over time (Study 3).
WEIGHT-BASED REJECTION SENSITIVITY 4
The Stigma of Obesity
Obesity is a devalued characteristic in today’s society, and obese people are heavily
discriminated against (Puhl & Brownell, 2001; Puhl & Heuer, 2009). Prejudice and
discrimination are pervasive within multiple contexts of daily life for obese people, including
employment, health care, media, and interpersonal relationships (Puhl & Heuer, 2009). Unlike
stigmatized identities such as race or gender, weight is seen as controllable and originating from
personal choice (Crandall, 1994; Weiner, Perry, & Magnusson, 1988). Due to perceived personal
responsibility for weight, negative treatment of obese people is also often perceived as deserved
(Feather, 1996; Lerner, 1980). Moreover, there is a popular notion that negative treatment will
motivate obese people to change their behavior and lose weight (Hebl & Heatherton, 1998; Puhl
& Heuer, 2010), going beyond notions of deservingness to be seen as benefitting the target.
Thus, the stigma of obesity may be particularly pernicious because negative treatment is viewed
as socially acceptable, deserved, and even beneficial.
Within this context, those who are obese are likely to experience numerous interpersonal
interactions in which their weight is made salient, including from friends and family whose
intentions may be to help them lose weight. Negative treatment due to weight is prevalent within
interpersonal relationships, coming from romantic partners, friends, and family members, and is
particularly prevalent for women (Puhl & Heuer, 2009; Sheets & Ajmere, 2005). In fact, obese
people report that the most frequent source of stigmatization is from their family members,
which often includes teasing and derogating comments (Puhl & Brownell, 2006; Puhl, Moss-
Racusin, Schwartz, & Brownell, 2008). Given the prevalence of these stigmatizing interpersonal
interactions, the interpersonal aspects of weight stigma may be a particularly important avenue
for understanding its impact on those who are obese.
WEIGHT-BASED REJECTION SENSITIVITY 5
Experience of Stigma
Those who have stigmatized identities have long been assumed to experience negative
psychological outcomes (Allport, 1954; Goffman, 1963). However, more recent stigma theory
and research has shown that the experience of stigma may be more variable, in that mere
membership in a stigmatized group does not appear to affect people uniformly (Crocker &
Major, 1989; Major, 2006). There are numerous factors that can determine who is most at risk
for adverse consequences of possessing a stigmatized identity (Major, 2006). People may not
only have differences in the amount of stigma they experience, but also differences in their
emotional reactions and coping strategies that shape their outcomes.
Indeed, stigma theory has focused on at least three complementary but distinct
mechanisms by which stigma can be experienced: experienced stigma, internalized stigma, and
anticipated stigma (e.g., Earnshaw & Chaudoir, 2009; Earnshaw & Quinn, 2012; Link, 1987;
Meyer, 1995). Experienced stigma is typically conceptualized as perceived acts of discrimination
one has experienced. Internalized stigma is typically conceptualized as devaluing and/or
stereotyping oneself as a result of possessing the stigmatized identity. Anticipated stigma is
typically conceptualized as expecting rejection in interpersonal interactions and/or having
concerns about experiencing stigma in the future. Although the terminology for these
mechanisms varies across the literature, research has demonstrated that they are conceptually and
empirically distinct processes that uniquely predict psychological and physical health (Earnshaw
& Chaudoir, 2009; Earnshaw & Quinn, 2012; Link, 1987; Meyer, 1995). Together, they provide
a better picture of who is most at risk when possessing a stigmatized identity.
Considering these three mechanisms in the weight stigma literature, two have been
represented in research. First, experienced stigma has been represented, typically assessing the
WEIGHT-BASED REJECTION SENSITIVITY 6
frequency of stigmatizing situations over the lifecourse (e.g., the Stigmatizing Situations
Inventory [SSI]; Myers & Rosen, 1999). Levels of weight stigma measured by frequency have
been linked to depression, lower self-esteem, and body dissatisfaction (Friedman, Reichmann,
Costanzo, Zelli, Ashmore, & Musante, 2005; Jackson, Grilo, & Masheb, 2000; Rosenberger,
Henderson, Bell, & Grilo, 2007). Internalized stigma has also been represented through such
measures as the Weight Bias Internalization Scale (WBIS; Durso & Latner, 2008) and the
Weight Self-stigma Questionnaire (WSSQ; Lillis, Luoma, Levin, & Hayes, 2010). Scoring
highly on internalized stigma has been correlated with poorer psychological well-being and
physical quality of life (Durso & Latner, 2008; Latner, Durso, & Mond, 2013).
These measures of experienced stigma and internalized stigma have been very useful in
showing potential negative outcomes of experiencing weight stigma, but the anticipated stigma
mechanism is largely missing in the weight stigma literature. There is a gap in explaining
people’s day to day experiences with weight stigma. As noted by Goffman (1963) in his seminal
book on stigma, stigma plays out between people – it is interpersonal. Moreover, recent research
has highlighted the importance of concerns over weight-based rejection in predicting
psychological and physical well-being (Hunger & Major, 2015). However, no published
measures currently exist that have been psychometrically assessed. A scale to measure
expectations and concerns over weight-based rejection could help to fill an important gap in
understanding the experience in stigma.
Rejection Sensitivity
Rejection is a negative experience that violates human needs of belongingness
(Baumeister & Leary, 1995), but people vary in the extent to which they perceive rejection
across situations. Rejection sensitivity is described as a personal tendency to anxiously expect
WEIGHT-BASED REJECTION SENSITIVITY 7
rejection and react strongly to it (Downey & Feldman, 1996), and develops from previous
rejecting experiences (Feldman & Downey, 1994). People who are rejection sensitive are
hypervigilant to cues of rejection in their environments: They readily perceive rejection in new
and ambiguous situations, and experience anxiety over this rejection.
Given that devalued status characteristics are often key sources of rejection, people who
possess them may be rejection sensitive within specific social situations in which the
characteristic is salient, even if they are not rejection sensitive in general. Indeed, people who are
socially stigmatized often expect and fear rejection (Link, 1987). Specific measures have been
created to address this status-based rejection sensitivity. For example, race-based rejection
sensitivity describes people who readily perceive rejection based on their race (Mendoza-Denton,
Downey, Purdie, Davis, & Pietrzak, 2002). Other scales include age (Kang & Chasteen, 2009),
gender (London, 2008), and appearance (Park, 2007). Status-based rejection sensitivity is
thought to be activated within situations that have potential for rejection based on that status
characteristic, not across all situations, and not for those who do not carry that status
characteristic (Mendoza-Denton et al., 2002). Following from theory on stigma, constructs of
status-based rejection sensitivity are particularly useful in ascertaining reactions to stigma
because they encapsulate both a cognitive and affective component. Thus, the vigilance of
expecting discrimination and the potential anxiety that accompanies that threat are both
accounted for with these measures.
Status-based rejection sensitivity has been associated with numerous adverse outcomes,
some of which may be specific to the particular status category. Those who are high in gender-
based rejection sensitivity, for example, cope with gender-based threats by suppressing their
thoughts and feelings, a reaction which can lead to feeling less belonging in an institution and
WEIGHT-BASED REJECTION SENSITIVITY 8
lower perceptions of competence (London et al., 2012). Similarly, high race-based rejection
sensitivity has been found to lead to difficulty with college transition and even lowered
educational outcomes after 2-3 years (Mendoza-Denton et al., 2002). These negative outcomes
can span beyond psychological and academic outcomes, affecting physical health as well. Those
high in appearance-based rejection sensitivity were found to possess greater symptoms of
disordered eating (Park, 2007), and were more likely to seek cosmetic surgery (Park, Calogero,
Harwin, & DiRaddo, 2009). In gay men, rejection sensitivity has been associated with
accelerated HIV progression (Cole, Kemeny, & Taylor, 1997).
Weight-based Rejection Sensitivity
Given the variety of outcomes associated with interpersonal rejection sensitivity and
those specific to status-based rejection sensitivity, there are many predictions that can be made
with a new rejection sensitivity construct that is specific to rejection based on weight. As with
other forms of status-based rejection sensitivity, weight-based rejection sensitivity (W-RS)
would be activated only within situations in which weight is salient, such as in stereotype-
relevant situations. Evidence from recent research supports this notion: Within stereotype-
relevant situations, overweight individuals are more likely to feel identity threat (Carels et al.,
2013), and this threat can lead to increased blood pressure, stress, depletion of cognitive
resources, and increased calorie consumption (Major, Eliezer, & Rieck, 2012; Major, Hunger,
Bunyan, & Miller, 2014; Tomiyama, 2014).
Overall, the converging findings from rejection sensitivity research and stigma research
suggest that there are many adverse outcomes that could occur over time for those who
consistently have anxious expectations of being rejected based on their weight. First, we expect
that this chronic threat of rejection based on weight predicts poorer psychological well-being
WEIGHT-BASED REJECTION SENSITIVITY 9
over time. Second, we expect weight-based rejection sensitivity to be associated with poorer
adjustment to college. Third, we expect weight-based rejection sensitivity to be associated with
poorer physical well-being over time. Not only could an anxious expectation of weight-based
rejection contribute to disordered eating patterns, but it could contribute to poorer general
physical health symptoms and status. Finally, because poorer psychological well-being may play
a mediating a role in predicting development of eating disorders and poorer overall health (e.g.,
Ashmore, Friedman, Reichmann, & Musante, 2008; Quinn & Chaudoir, 2009), we also expect
poorer psychological well-being to mediate the relationship between weight-based rejection
sensitivity and physical well-being. See Figure 1 for a conceptual model of primary hypotheses
in the current study.
Overview of Research
A rejection sensitivity scale that is tailored to weight may provide insight into a neglected
area of research. Because rejection sensitivity develops from previous rejecting experiences
(Feldman & Downey, 1994), and rejection due to weight is a common occurrence for those who
are overweight (Puhl & Heuer, 2009), weight-based rejection sensitivity may be exceptionally
prevalent. Weight-based rejection sensitivity (W-RS) could fill a gap in existing weight stigma
measures, and could help to explain individual reactions to stigma and to predict when weight
stigmatization may have a greater likelihood of impacting a target.
Three studies were conducted to develop a W-RS scale and examine its consequences
over time. Study 1 involved creation of the W-RS scale and an examination of the underlying
factor structure of the scale and its reliability. Studies 2a and 2b examined correlates of W-RS to
determine convergent and divergent validity, respectively. Study 3 examined the long-term
outcomes and indirect effects of W-RS in a longitudinal study spanning a college semester.
WEIGHT-BASED REJECTION SENSITIVITY 10
Study 1: Scale Development and Psychometrics
The purpose of Study 1 was to develop a scale of weight-based rejection sensitivity.
Consistent with other rejection sensitivity scales, we created written scenarios that had the
potential for weight-based rejection. These scenarios were based on common stereotypes and
experiences of rejection faced by overweight people. Previous research has shown that some of
the most prevalent stereotypes of obese people are that they overeat, are inactive, and lack self-
control (McClure, Heuer, & Puhl, 2011; Puhl & Heuer, 2009). Thus, several of the scenarios
reflect situations in which obese people may be stereotyped in these ways. The scenarios also
reflect the most frequently stigmatizing situations that obese people report experiencing, such as
being laughed at by children (Myers & Rosen, 1999; Puhl & Brownell, 2006). Because of their
previously established validity, some items from other status-based rejection sensitivity scales
(e.g., Appearance-RS; Park, 2007) were adapted for use to reflect rejection based on weight.
Overall, the scenarios also contain variability in terms of the sources of potential rejection,
including from strangers, family, friends, and health care providers.
In total, 16 scenarios were created (see Table 1). Importantly, the scenarios are purposely
ambiguous, such that the potential for rejection exists, but rejection is not made explicit.
Participants then respond to each scenario based on whether they expect rejection to occur, and
how anxious they feel about it. An example item is, “Imagine that you are at work, and someone
brings in a box of donuts for the office to share. As you are leaning to pick one up, your
coworker walks by and comments on the number of calories in the donuts.” Participants then
respond to two parts of the item, one assessing anxiety over potential rejection, and the other
assessing an expectation of rejection in that scenario. These are tailored to scenario; for example,
on the item described above, participants responds to parts (a) How concerned/anxious would
WEIGHT-BASED REJECTION SENSITIVITY 11
you be over whether your coworker was making this comment specifically to you, because of
your weight?” and (b) “I would expect that my coworker would make the comment specifically to
me.” Responses range from 1 (very unconcerned) to 6 (very concerned) and 1 (very unlikely) to 6
(very likely), respectively. The W-RS scale is scored by calculating an aggregate of all
expectation and anxiety items.1
Method
Participants were 1686 undergraduates at a large Northeastern university. The sample
was comprised of 57.3% women. The racial composition of the sample was 77.2% White, 8.6%
Asian, 6.4% Black, and 5.5% other. Six percent of the sample identified as Hispanic/Latino.
Mean age was 18.54 (SD = 1.65), and mean body mass index (BMI; k/m2) was 22.62 (SD = 4.08;
range: 15.5 - 43.6).
Study 1 was conducted as part of a prescreening process for an introductory psychology
participant pool. The W-RS scale was one of several surveys that participants took online at the
beginning of the Fall semester. An exploratory factor analysis was computed in order to
determine the factor structure of the W-RS. A confirmatory factor analysis was computed to
conform the factor structure. Internal consistency was computed with Cronbach’s alpha. Test-
retest reliability was computed with a subsample of the participants from Study 1 (n = 220) who
completed the W-RS scale again at a second time point approximately 6-8 weeks later. See Study
2a for a description of this subsample.
1 Rejection sensitivity scales are typically scored in a multiplicative fashion, weighting expectations by anxiety to
reflect an expectancy-value model. However, the statistical stability of cross-products based on arbitrary metrics has
been called into question (Blanton & Jaccard, 2006). Aggregating the scale items is a solution that accounts for both
the cognitive (expectation) and affective (anxiety) components of the scale while preventing statistical instability.
We examined the W-RS scale using both methods, and discovered that the aggregation method was highly
correlated with the cross-product method, r = .98, p < .001. Thus, we elected to score the W-RS using the
aggregation method to yield higher statistical stability.
WEIGHT-BASED REJECTION SENSITIVITY 12
Results & Discussion
The mean level of W-RS in the sample was 1.85 (SD = 0.79; range: 1.0 - 5.9). The mean
of the anxiety component of W-RS was 1.78 (SD = 0.79), and the mean of the expectation
component was 1.92 (SD = 0.89). W-RS was not correlated with age, r = .04, p = .09. Women
scored significantly higher on W-RS than did men (M = 2.02, SD = 0.85, and M = 1.62, SD =
0.64, respectively), t(1683) = 10.48, p < .001, d = 0.53, 95% CI [.32, .47]. As expected, those
who self-identified as overweight also scored significantly higher on W-RS (M = 2.44, SD =
0.97) than those who self-identified as normal weight (M = 1.70, SD = 0.65), t(1657) = 16.76, p
< .001, d = 0.90, 95% CI [.65, .83].
The W-RS scale contains 16 items with two parts each. Each item’s two parts
(expectation and anxiety) were averaged together to create a single index of anxious expectations
per item. Thus, 16 total items were analyzed within the factor analysis. The data were analyzed
with an exploratory principal components factor analysis using Varimax rotation. Both the
eigenvalues and the scree test supported a one-factor solution, which explained 55.43% of the
variance. Factor loadings ranged from .62 to .84. No items were eliminated on the basis of the
factor analysis. Due to the relevance of self-reported weight status on the construct of W-RS,
separate factor analyses were also computed for normal weight and overweight participants.
Findings were remarkably similar for each group. The loadings for the overall sample are
presented in Table 1. A confirmatory factor analysis conducted with AMOS 17.0 (Arbuckle,
2008) also revealed that the one-factor solution was a good fit, χ2(94) = 1248.21, p < .001,
SRMR = .04, CFI = .93, RMSEA = .08, factor loadings > .59 and p < .001, and that the model
was gender invariant.
The scale had a high degree of internal consistency, Cronbach’s α = .94. No single item’s
WEIGHT-BASED REJECTION SENSITIVITY 13
removal elicited a higher consistency. Thus, all items were retained. Again, these analyses were
repeated separately for each weight status group, normal weight and overweight. Both alphas
were consistent with that of the overall sample (normal weight: α = .93; overweight: α = .95),
and no item’s removal in either subsample would achieve a higher degree of internal
consistency.
Test-retest reliability was evaluated with a subsample of participants in Study 1 (n =
220). The amount of time between the initial test and the re-test was 6-8 weeks. The scale had a
high degree of test-retest reliability, r = .75, p < .01, which is consistent with other rejection
sensitivity scales (Downey & Feldman, 1996; London, Downey, Romero-Canyas, Rattan, &
Tyson, 2012; Mendoza-Denton et al., 2002).
In sum, the purpose of Study 1 was to examine the factor structure, internal consistency,
and reliability of the W-RS scale. Together, the results of Study 1 indicate that the W-RS is a
cohesive, reliable scale. A single-factor solution of the scale was supported by a principal
components factor analysis and confirmatory factor analysis. Additionally, the W-RS scale had
high internal consistency and test-retest reliability. The final scale consists of 16 items.
Study 2a: Construct Validity
The purpose of Study 2a was to determine whether the newly created W-RS measure has
construct validity. Specifically, the W-RS was compared with several measures to determine
convergent and discriminant validity. There were two types of theoretically relevant categories
that were examined for convergent validity in the current study: weight stigma and
body/appearance concerns.
Weight stigma measures included two primary scales (SSI, Myers & Rosen, 1999; and
WBIS, Durso & Latner, 2008) that measure history of stigmatizing experiences and self-
WEIGHT-BASED REJECTION SENSITIVITY 14
stigmatization, respectively. An additional scale was adapted from a popular perceived
discrimination scale (Kessler, Mickelson, & Williams, 1999) to address perceived discrimination
based on weight specifically. These measures were expected to correlate with the W-RS scale,
but not so highly that they essentially capture the same construct.
Several different measures of body/appearance concerns were included (see section on
measures below). Weight is one aspect of appearance, and attractiveness can play a role in the
stigmatization of weight. However, weight and appearance are conceptually distinct. For
instance, there are specific stereotypes in regards to overweight that are not merely about
appearance, such as perceptions that people who are overweight are lazy and lack self-control.
Moreover, weight is often the subject of health criticism (see Puhl & Heuer, 2010) in a way that
appearance more broadly is not. Thus, it was expected that these body/appearance scales would
correlate, but not so highly that they could be considered analogous. Notably, appearance-based
rejection sensitivity was included in these measures (Park, 2007). Because both scales assess
rejection sensitivity within these similar status categories, the correlation between them was
expected to be high, particularly considering their shared method variance and the conceptual
overlap of some of the items. However, the W-RS scale asks participants to assess their anxious
expectations due to weight, whereas the appearance-based rejection sensitivity asks participants
to assess their anxious expectations due to appearance. Thus, we expected these two measures to
be both conceptually and empirically distinct in the constructs they capture.
Self-esteem and interpersonal rejection-sensitivity were also examined in relation to W-
RS. Although W-RS was expected to be related to self-esteem on the basis of previous research
(e.g., Ayduk, Downey, & Kim, 2001; Crocker, Cornwell, & Major, 1993), W-RS was expected
to represent a distinct construct. Likewise, W-RS was expected to be discriminant from
WEIGHT-BASED REJECTION SENSITIVITY 15
interpersonal rejection-sensitivity (RSQ; Downey & Feldman, 1996). The source of rejection
sensitivity for W-RS is a specific status-based characteristic, not a disposition toward rejection
sensitivity in general (as measured by the RSQ). Thus, although these measures were expected to
be correlated based on their shared method variance, this correlation was expected to be lower
than correlations between W-RS and other weight and appearance-related measures.
Method
Study 2a was a cross-sectional survey. Participants were recruited from the psychology
participant pool. The study was administered online.
Participants. Participants were 220 students who had previously completed
prescreening for the psychology participant pool. These participants were a subsample of those
in Study 1 (n = 1592) who agreed to participate in a separate study for course credit. Enrollment
was monitored in order to obtain roughly equal numbers of overweight and non-overweight
participants. This was done to ensure adequate variability on the W-RS and other measures, as
these were expected to have increased relevancy for those who are overweight. In total, 52.7% of
participants self-identified as overweight (BMI M = 26.90, SD = 3.86), and 46.8% identified
themselves as non-overweight (BMI M = 21.96, SD = 2.26; total sample BMI M = 24.56, SD =
4.04; range: 17.97 - 41.82). There were 157 women (71.4%), and one person who did not
indicate gender. The racial composition mirrored that of the participant pool, with 80.5% of the
sample identifying as White, 6.8% as Black, 6.8% as Asian, and 3.2% as other. Of these
participants, 7.3% identified as Hispanic/Latino. The mean age of the sample was 18.45 (SD =
1.06).
Measures. In addition to the W-RS scale, interpersonal rejection sensitivity was assessed,
which is a general disposition toward anxiously expecting rejection rather than rejection
WEIGHT-BASED REJECTION SENSITIVITY 16
specifically based on a status characteristic. Specifically, the 18-item Rejection Sensitivity
Questionnaire (RSQ; Downey & Feldman, 1996) was used and is the original scale from which
the more recent status-based rejection sensitivity scales (e.g., race, appearance, weight) have
been modeled. Responses ranged from 1 to 6 on each component, with higher numbers
indicating higher concern and expectations. Scores were calculated in the traditional way of
taking the cross-product between these components. Self-esteem was assessed with the 10-item
Rosenberg Self-Esteem Scale (RSE; Rosenberg, 1965), ranging from 1 to 7, and averaged such
that higher scores indicated higher self-esteem.
Stigma. Frequency of previous stigma experiences was assessed with 50-item
Stigmatizing Situations Inventory (SSI; Myers & Rosen, 1999). Responses ranged from
frequency of those situations from 0 (never) to 8 (daily), and an average frequency across all
items is calculated. Internalized stigma was assessed with the 11-item Weight Bias
Internalization Scale (WBIS, Durso & Latner, 2008). Responses ranged from 1 to 7 and were
averaged such that higher scores reflected higher internalization. Because the scale is tailored to
overweight people, it was subtly modified for the current study so that people of all sizes would
be able to respond. For instance, the item, “I don’t feel that I deserve to have a really fulfilling
social life, as long as I’m overweight,” was adapted to say, “I don’t feel that I deserve to have a
really fulfilling social life, because of my weight.” The adapted version of the scale had high
internal consistency in the current sample, α = .93. Kessler, Mickelson, and Williams’s (1999)
Perceived Discrimination Scale was also used, but modified to ask how much discrimination
participants receive on a day-to-day basis due to weight specifically. Some items were added to
address concerns related to weight stigma, such as, “People act as if they think you are not
attractive.” (α = .95). Scores were calculated by averaging weight discrimination on a daily basis
WEIGHT-BASED REJECTION SENSITIVITY 17
from 0 to 6.
Appearance and body concerns. Appearance-based rejection sensitivity was assessed
with a 15-item rejection sensitivity scale that includes items about general appearance (A-RS,
Park, 2007). Scores were calculated in the same manner as interpersonal rejection sensitivity,
with cross-products based on responses to two components ranging from 1 to 6. Appearance-
based self-worth was assessed using the 5-item Appearance subscale of the Contingencies of Self
Worth scale, (CSW-Appearance; Crocker, Luhtanen, Cooper, & Bouvrette, 2003). Responses
were scored by taking the average of responses that ranged from 1 to 7, with higher scores
reflecting higher appearance-based self-worth. Body dissatisfaction was measured with the Body
Dissatisfaction subscale of the Eating Disorder Inventory (EDI; Garner, Olmstead, & Polivy,
1983). Higher averaged scores ranging from 1 to 6 indicate higher dissatisfaction. The
Surveillance subscale from the Objectified Body Consciousness Scale (OBCS; McKinley &
Hyde, 1996) was also included, as was the Body Shame subscale. Both subscales had responses
ranging from 1 to 7, which were averaged with higher scores indicating higher surveillance and
body shame, respectively.
Results & Discussion
The mean W-RS in the current sample was 2.06 (SD = 0.98; range: 1.0 - 5.0; MW-RSanxiety
= 2.06; MW-RSexpectation = 2.06). Among those who self-identified as overweight, the mean was
2.50 (SD = 1.02). In addition to correlations between W-RS and measures of weight stigma and
appearance/body concerns, separate partial correlations were also conducted controlling for
interpersonal rejection sensitivity and self-esteem. The correlation between weight-based
rejection sensitivity and interpersonal rejection sensitivity was significant (r = .59, p <.01), as
was the correlation between weight-based rejection sensitivity and self-esteem (r = -.45, p <.01).
WEIGHT-BASED REJECTION SENSITIVITY 18
Correlation matrices for subgroups of gender and perceived weight status were also examined;
the magnitude of the correlations was very similar for each group. All correlations and partial
correlations between W-RS and other measures can be found in Table 2.
The W-RS scale was positively correlated with all weight stigma measures: perceived
discrimination, internalized stigma, and past experiences with stigma2. These correlations ranged
from .44 to .75 (all ps < .01). Correlations between W-RS and weight stigma measures
maintained a similar magnitude when controlling for interpersonal rejection sensitivity (.32 to
.65, all ps < .01) and self-esteem (.35 to .68, all ps < .001).
The W-RS scale was also positively correlated with all measures of appearance and body
concerns: appearance-based rejection sensitivity, appearance-based self-worth, body
dissatisfaction, body surveillance, and body shame. These correlations ranged from .32 to .63 (all
ps < .01). Correlations between W-RS and appearance/body concerns maintained a similar
magnitude when controlling for interpersonal rejection sensitivity (.20 to .51, all ps < .01) and
self-esteem (.20 to .53, all ps < .001).
Recall that theoretically, we expected W-RS to be distinct from appearance-based
rejection sensitivity (A-RS). The correlation between W-RS and A-RS was .62, suggesting that
the W-RS is not merely a duplicate of A-RS. Notably, the reduced correlation between W-RS
2 In light of the high correlation between W-RS and the WBIS (r = .75), we explored the interrelationships between
these weight stigma variables further. In a separate cross-sectional sample not reported here (N = 60), but with
similar sample characteristics as in Studies 2a and 3, the correlation between W-RS and WBIS was .57 (p < .01). In
order to explore the predictive validity of W-RS on psychological well-being and health behaviors in comparison to
the other weight stigma mechanisms, we also conducted regression analyses in which W-RS, WBIS, and SSI were
entered as predictors of weight control behaviors (Neumark-Sztainer et al., 2002) and of self-esteem (RSE;
Rosenberg, 1965). We also controlled for RSQ by entering it in Step 1 of the regression, and the weight stigma
variables in Step 2. In the self-esteem model, RSQ and W-RS were the only significant predictors of self-esteem (β
= -.45, p < .01 and β = -.34, p < .01, respectively). SSI did not predict self-esteem. In the weight control models, W-
RS emerged as the only significant predictor of healthy (β = .45, p < .01) and unhealthy weight control behaviors (β
= .39, p < .01). Thus, the empirical distinction and unique predictive validity of W-RS was supported in this separate
sample.
WEIGHT-BASED REJECTION SENSITIVITY 19
and appearance-based rejection sensitivity when controlling for interpersonal rejection sensitivity
(r = .41) may reflect the shared method variance and theoretical underpinnings of these three
rejection sensitivity measures. In order to tease apart these measures more rigorously, we
conducted a principal components factor analysis with Varimax rotation on all of the items from
the W-RS and A-RS scales. Results revealed that all of the A-RS items loaded on one factor
(loadings from .54 to .87) and all of the W-RS items loaded on a second factor (loadings from
.48 to .81). Thus, in addition to being conceptually distinct, these measures appear to be
empirically distinct.
Overall, the magnitude of each of the correlations was within an acceptable range for
establishing construct validity. No measure overlapped with W-RS so highly that it would be
considered a duplicate scale, yet all measures were related to W-RS enough so that it can be
considered a theoretically similar construct. We will return in Study 3 to examine whether W-RS
is a stronger predictor of long term outcomes than other appearance-based measures. The high
correlation between W-RS and interpersonal rejection sensitivity was unexpected. Although a
moderate correlation was expected between these scales due to shared method variance, the
magnitude of the correlation suggests that the two constructs overlap on more than just their
shared methodology. It is possible that respondents view multiple forms of rejection from the
lens of their weight given the pervasiveness of weight discrimination across multiple contexts
(e.g., Puhl & Heuer, 2009). Related, the high correlation may be partially due to the
methodology of the current study. Because participants were answering many questionnaires
about their weight and appearance, weight may have been salient for participants while they
were answering more general questions about rejection.
WEIGHT-BASED REJECTION SENSITIVITY 20
Study 2b: Discriminant Validity
In Study 2a, the correlation between weight-based rejection sensitivity and interpersonal
rejection-sensitivity was unexpectedly high. Thus, the purpose of Study 2b was to further
establish discriminant validity of the W-RS using additional measures.
The constructs examined in Study 2b were personality and social desirability. The Big-5
model of personality posits that there are five overarching components of personality:
Extraversion, Agreeableness, Conscientiousness, Emotional Stability, and Openness to
Experience. It was expected that the W-RS would not be correlated with Extraversion,
Agreeableness, Conscientiousness, or Openness to experience. However, a modest correlation
was expected between W-RS and Emotional Stability, as W-RS is theorized to be related to
psychological functioning, which is a component of Emotional Stability.
The W-RS scale was also examined in relation to social desirability. Social desirability
scales capture the extent to which participants are engaging in deception in their questionnaire
responses by responding in socially desirable ways. Social desirability was expected to be
unrelated to W-RS.
Method
Study 2b was conducted as part of a prescreening process for the introductory psychology
participant pool. W-RS, social desirability, and personality measures were three of many surveys
that participants took online at the beginning of the semester.
Participants. Participants were 612 introductory psychology students who received
course credit for their participation. The sample was 54.3% women, with 72.7% identifying as
White, 13.0% Asian, 6.9% Black, 1.0% Middle-Eastern, 0.2% Native American, and 6.4% other.
Separately, 6.7% of the sample identified as Hispanic/Latino. The average age of the sample was
WEIGHT-BASED REJECTION SENSITIVITY 21
19.04 (SD = 1.52) and the average BMI was 23.46 (SD = 4.03; range: 15.3 - 53.1).
Measures. In addition to the W-RS scale, measures of social desirability and personality
were included. Social desirability was assessed with the 10-item Impression Management
subscale of Paulhus’s (1984) social desirability scale (α = .74), which ranged from 1 to 9.
Personality was assessed with the Ten Item Personality Measure (TIPI; Gosling, Rentfrow, &
Swann, 2003), which represents each of the five personality traits: Extraversion, Agreeableness,
Conscientiousness, Emotional Stability, and Openness to Experience. These scores ranged from
1 to 7.
Results & Discussion
The mean W-RS was 1.75 (SD = 0.69; range: 1.0 - 5.1). The mean for the anxiety
component of W-RS was 1.66 (SD = 0.77) and the mean for the expectation component was 1.84
(SD = 0.69). The data for Study 2b were analyzed using correlations. As predicted, the W-RS
scale was not significantly correlated with social desirability (r = .07, p = .09), nor with
agreeableness (r = -.08, p = .07). Also consistent with predictions, W-RS was negatively related
to emotional stability (r = -.32, p < .01). W-RS was significantly correlated with extraversion (r
= -.15, p < .01), conscientiousness (r = -.10, p = .03), and openness to experience (r = -.14, p <
.01) but the correlations were quite low. Taken together, results show that the W-RS scale has
discriminant validity.
Study 3: Long-term Consequences
Studies 1 and 2 demonstrated that the 16-item W-RS scale is an empirically valid,
reliable measure. The purpose of Study 3 was to examine the predictive utility of the W-RS
scale. Study 3 was a longitudinal study, conducted toward the start and end of the Fall semester
for two separate cohorts of first year college students spanning two consecutive years. This time
WEIGHT-BASED REJECTION SENSITIVITY 22
frame was chosen because the first semester of college is a notable transition period within the
lifespan, and so the most change might be seen during this time.
Based on a synthesis of the literature on stigma, rejection sensitivity, and body concerns,
we had four primary hypotheses regarding the outcomes that could occur over time for those
who anxiously expect to be rejected based on their weight (see Figure 1).
Hypothesis 1: Poorer Psychological Well-being
Our first hypothesis was that W-RS would be associated with poorer psychological well-
being over time. Specifically, the anxiety and negative emotions that occur when one regularly
expects status-based rejection could predict higher psychological distress, including depression
(e.g., Ayduk et al., 2001; Marston, Hare, & Allen, 2010), lower self-esteem (e.g., Ayduk et al.,
2001; Downey & Feldman, 1996), higher anxiety (e.g., Marston et al., 2010), higher stress (e.g.,
Major, Eliezer, & Rieck, 2012; Tomiyama et al., 2014), and higher social anxiety (e.g., London,
Downey, Bonica, & Paltin, 2007; Park & Pinkus, 2009) over time.
Hypothesis 2: Poorer Adjustment to College
Our second hypothesis was that those high in W-RS would not adjust to college as
successfully as those low in W-RS. Over time, the chronic threat of rejection could lead to lower
performance on tasks, lower grades in school, poorer work performance, and so forth (see
Inzlicht & Good, 2006). Thus, those high in W-RS may be more likely to have difficulty
adjusting to their academics when entering college. Moreover, it has been posited that
institutions that espouse the values of a high-status group can lead those who are high in status-
based rejection sensitivity to feel less belonging to that institution (Mendoza-Denton et al.,
2002). Given that weight discrimination within educational institutions has been previously
documented (e.g., Burmeister, Kiefner, Carels, & Musher-Eizenman, 2013; Canning & Mayer,
WEIGHT-BASED REJECTION SENSITIVITY 23
1966), it may likewise be more difficult for those high in W-RS to adjust to educational
institutions.
Hypothesis 3: Poorer Physical Well-being
Our third hypothesis was that W-RS would be associated with poorer physical well-being
over time. We expected this to occur in context of disordered eating patterns and of general
health status.
Disordered eating patterns. Weight stigma and appearance/body concerns have
frequently been associated with disordered eating patterns (Grabe & Hyde, 2006; Puhl & Suh,
2015); likewise, we expected W-RS to influence the cognitive and behavioral components of
disordered eating patterns as well: drive for thinness, restrained eating, general eating disorder
symptoms, and bulimia symptoms. Notably, bulimia symptoms in particular are thought to be
triggered by negative affect and negative feelings regarding weight (Alpers & Tuschen-Caffier,
2001; American Psychiatric Association, 2013; Hawkins & Clement, 1984; Puhl, Moss-Racusin,
& Schwartz, 2007). Because a component of W-RS specifically targets negative affect regarding
weight, we expected the strongest association amongst these disordered eating pattern measures
to be between W-RS and bulimia symptoms.
General health. We predicted that W-RS would be associated with poorer general
health, including lower health-related quality of life and physical illness symptoms. Previous
studies that have examined those with either stigmatized identities or rejection sensitivity have
similarly documented poorer health across a range of indices (e.g., Cole et al., 1997; Hunger &
Major, 2015; Pascoe & Smart Richman, 2009; Quinn & Chaudoir, 2009; Sutin, Stephan,
Luchetti, & Terracciano, 2014).
WEIGHT-BASED REJECTION SENSITIVITY 24
Hypothesis 4: Mediation
Our fourth hypothesis was that the relationship between weight-based rejection
sensitivity and poorer physical well-being would be partially mediated by poorer psychological
well-being. Many have posited that psychological distress is a mediator between experiencing
stigma and poorer physical health, and have called for more research in this area (e.g., Pascoe &
Smart Richman, 2009; Puhl & Latner, 2007; Williams & Mohammed, 2009). Recent research
has begun to provide empirical evidence for this relationship. For instance, psychological distress
has been found to mediate the relationship between experiences of weight stigma and such
outcomes as binge eating (Ashmore et al., 2008), decreased self-rated health, increased BMI, and
increased blood pressure (Rosenthal et al., 2015). In their studies of those with concealable
stigmatized identities, Quinn and Chaudoir (2009) found that psychological distress partially
mediated the relationship between anticipated stigma and illness symptoms, but anticipated
stigma also directly predicted illness symptoms. Taken together, we expected psychological
distress to mediate the relationship between W-RS and physical health.
Predictive Utility
In addition to testing our primary hypotheses, we also tested body dissatisfaction and
appearance-based self-worth alongside W-RS in the tests of direct effects in order to ascertain
their relative predictive validity. These measures were chosen because they have similar
theoretical underpinnings in common with W-RS, and they represent popular constructs that
have established value in predicting outcomes that W-RS was also expected to predict. Body
dissatisfaction has been used extensively in both psychological and health research (Grabe &
Hyde, 2006), and has been shown to predict poorer psychological functioning, especially
depression (Johnson & Wardle, 2005; Rierdan, Koff, & Stubbs, 1989; Stice & Bearman, 2001).
WEIGHT-BASED REJECTION SENSITIVITY 25
It has also been assigned a causal role in the development of eating disorders (Grabe & Hyde,
2006; Stice & Shaw, 2002; Thompson, Heinberg, Altabe, & Tantleff-Dunn, 1999).
Self-worth based on appearance (Appearance-CSW; Crocker et al., 2003) may be
especially important in considering the anticipated weight-based rejection that those high W-RS
would expect, because those who are high in Appearance-CSW require validation from others in
order to boost their self-esteem (Crocker et al., 2003; Crocker & Knight, 2005). Moreover,
Appearance-CSW has numerous costs in terms of learning, autonomy, self-regulation,
psychological well-being, and physical health (Crocker & Knight, 2005; Crocker & Park, 2004).
External contingencies of self-worth, such as appearance, have been shown to predict depressive
symptoms (Crocker, 2002; Sargent, Crocker, & Luhtanen, 2006), psychological and physical
well-being (Sanchez & Crocker, 2005), and appearance self-worth in particular has been related
to disordered eating symptoms (Crocker, 2002). Overall, the inclusion of appearance-based self-
worth and body dissatisfaction add theoretical value to the test of W-RS because their inclusion
allows for comparisons of their respective utility.
Summary
In sum, weight-based rejection sensitivity was hypothesized to predict psychological
distress, poorer college adjustment, and poorer physical well-being over students’ first semester
in college. Moreover, psychological distress was hypothesized to play a mediating role in the
relationship between weight-based rejection sensitivity and poorer physical health. Finally,
similar model tests were conducted with body dissatisfaction and appearance-based self-worth as
predictors in order to explore their relative predictive utility for the aforementioned hypothesized
outcomes.
WEIGHT-BASED REJECTION SENSITIVITY 26
Method
Participants. Data were collected for two cohorts in two consecutive years. Only first-
semester college students were eligible. Enrollment was monitored and adjusted to obtain
roughly equal numbers of overweight and non-overweight participants. In total, 292
undergraduates participated in at least one timepoint of data collection. Only those who
completed the survey at both timepoints (n = 265) were retained for analysis. Those completed
the survey at one timepoint (n = 27) did not differ meaningfully on any variable from those who
completed the survey at both timepoints (all ps > .10). Of the 265 participants retained for
analysis, the mean age of the sample was 18.12 (SD = 0.96) at Time 1. There were 210 women
and 55 men who participated in the study. Mean BMI at Time 1 was 24.36 (SD = 4.71; range:
16.9 - 44.5) and mean BMI at Time 2 was 24.38 (SD = 4.71; range: 16.2 - 41.6). In the sample,
79.6% identified as White, 7.5% as African American, 12.5% as Asian or Pacific Islander, 2.3%
as American Indian, and 1.5% as other. Of these, 7.5% also identified as Hispanic/Latino.
Procedure. The study was conducted online. Participants took a survey toward the
beginning and end of the Fall semester (approximately 10 weeks apart). The survey contained
the same questionnaires at both Times 1 and 2 with the exception of four measures that were
included at a single timepoint for theoretical reasons. Body dissatisfaction and appearance-based
self-worth were administered only at Time 1, and adjustment to college and physical illness
symptoms were included only at Time 2. All study protocols were approved by the university’s
Institutional Review Board.
Measures. In addition to the W-RS scale, measures were included to assess
psychological distress, adjustment to college, and physical well-being. In some instances,
assessment of these constructs involved specifying and evaluating latent measurement models. In
WEIGHT-BASED REJECTION SENSITIVITY 27
these two-factor models, the Time 1 variables were specified as indicators on the first factor, and
the Time 2 variables were specified as indicators on the second factor. Descriptions and model fit
statistics for these models are presented below.
Body dissatisfaction and appearance-based self-worth were also included to examine
their relative predictive validity. Measures of social support and physical activity were included
in the survey, but are not presented here.3 Finally, demographic information was collected.
Body dissatisfaction. The Contour Drawing Scale (Thompson & Gray, 1995) was used to
assess body dissatisfaction. The Contour Drawing Scale is a popular measure that displays
drawings of nine adult body sizes to participants, numbered in order from 1 (thinnest) to 9
(heaviest). Males were shown figures of adult males, and females were shown figures of adult
females. With the Contour Drawing Scale, participants first indicate which drawing best
represents their current body size, and then indicate which drawing represents their ideal body
size. The discrepancy between these sizes represents body dissatisfaction, and is calculated by
taking the absolute value of the difference between the two reported sizes.
Appearance-CSW. Appearance concerns were assessed using the Appearance subscale of
the Contingencies of Self Worth scale (Appearance-CSW; Crocker et al., 2003; α = .66),
described in Study 2a.
Psychological distress. Measures within this category included self-esteem, depression,
trait anxiety, social interaction anxiety, and stress. Self-esteem was assessed with the Rosenberg
Self-Esteem Scale (RSE; α = .77 - .88; Rosenberg, 1965), described in Study 2a. Depression was
assessed with the 20-item Center for Epidemiologic Studies Depression Scale (CES-D, α = .84 -
.91; Radloff, 1977). Participants are asked to rate how frequently they felt or behaved like each
3 These constructs were excluded from the current study because they did not represent key tests of hypotheses;
more information about these variables are available from the authors upon request.
WEIGHT-BASED REJECTION SENSITIVITY 28
item during the past week, ranging from 0 to 3 and summed. Trait-level anxiety was assessed
with the State-Trait Anxiety Inventory (STAI-T, Spielberger, Vagg, Barker, Donham, &
Westberry, 1980). The STAI-T has 20 items. Responses were averaged and ranged from 1 to 4
with higher numbers indicating higher anxiety. Perceived stress over the past month was
assessed with the 10-item Perceived Stress Scale (PSS, α = .84 - .86; Cohen, Kamarck, &
Mermelstein, 1983). Frequency of perceived stress is rated on a scale of 0 to 4, and responses are
averaged such that higher scores indicate higher stress. Finally, social interaction anxiety was
assessed using the Social Interaction Anxiety Scale (SIAS; α = .94, Mattick & Clarke, 1998).
These items are averaged on a scale of 1 to 5. A latent variable representing psychological
distress was created using these five measures. After testing and respecifying the measurement
model, the final specified latent variable was good fit to the data, CFI = .99, χ2(18) = 35.64, p =
.008, RMSEA = .06 (90% CI = .03-.09), pclose = .25, factor loadings > .59 and p < .001.
Adjustment to college. Adjustment to college was assessed with the Student Adaptation
to College Questionnaire (SACQ; Baker & Siryk, 1989). The scale has 67 items and has the
option of being broken down into four subscales: Academic Adjustment, Personal-Emotional
Adjustment, Social Adjustment, and Institutional Attachment (full scale α = .92 - .95 in previous
research). The full questionnaire was examined in the current study. Scores range from 67 to
603, with higher scores indicating better adaptation to college.
Physical well-being. Physical well-being was conceptualized through two separate but
important indices of health: disordered eating patterns and general health.
Disordered eating patterns. Included in this category was restrained eating, drive for
thinness, disordered eating patterns, and bulimia patterns. Restrained eating was measured with
the Restraint Scale (Polivy, Herman, Younger, & Erskine, 1979). Responses range from either 0-
WEIGHT-BASED REJECTION SENSITIVITY 29
3 or 0-4 based on the specific item, and are summed to create a composite of restrained eating.
Drive for thinness represents a preoccupation and excessive concern with weight and was
measured with the Drive for Thinness subscale of the Eating Disorder Inventory (EDI, α = .80 –
.91, Garner, Olmstead, & Polivy, 1983). Responses range from 0 to 5 and are averaged. General
disordered eating patterns were measured with the EAT-26 (Garner, Olmsted, Bohr, & Garfinkel,
1982). The EAT-26 is used to obtain an assessment of potential for disordered eating rather than
for diagnosis. Responses to the 26 items range from 0 to 3 and are summed. Bulimia patterns
were measured with the Bulimia subscale of the Eating Disorder Inventory (EDI, α = .83 –.90,
Garner et al., 1983; current sample: Time 1 α = .88, Time 2 α = .89). Responses on a scale of 0 to
5 are averaged such that higher scores reflect higher bulimia symptoms.
Drive for thinness, restrained eating, and eating disorder symptoms were examined
together within a single latent variable representing general disordered eating patterns. We
separated bulimia from the latent variable and allowed it to correlate instead. This allowed us to
test our hypothesis that W-RS would predict bulimia symptoms more strongly than other
disordered eating symptoms. The final specification of the latent variable elicited a good fit to
the data, CFI = .99, χ2(13) = 31.07, p = .003, RMSEA = .07 (90% CI = .04-.11), pclose = .12,
factor loadings > .74 and p < .001.
General health. This category included self-report measures of health-related quality of
life and physical illness symptoms. Health-related quality of life was assessed with the core
version of the Healthy Days scale (Centers for Disease Control and Prevention, 2000), often
used to study health disparities. Items include perceived overall health status (ranging from 1 to
5), number of poor mental health days per month, number of poor physical health days per
month, and number of days in which daily life was impeded by poor health per month. The items
WEIGHT-BASED REJECTION SENSITIVITY 30
were combined into a single latent variable with higher scores indicating higher health-related
quality of life. We report the means in their original metric in Table 3, but conducted analyses
with scores reversed so that higher values would reflect higher health-related quality of life.
Physical illness symptoms were measured using the Pennebaker Inventory of Limbic
Languidness (PILL; Pennebaker, 1982). There were 54 symptoms with responses from 1 (Have
never or almost never experienced the symptom) to 5 (More than once every week), which are
subsequently summed. Because the PILL was included at Time 2 only, it was examined as a
separate observed variable within this category and allowed to correlate with Time 2 health-
related quality of life. The final model of general health was a good fit, CFI = .97, χ2(21) =
38.39, p = .012, RMSEA = .06 (90% CI = .03-.08), pclose = .33, factor loadings > .37 and p <
.001.
Results & Discussion
Descriptives. Means and standard deviations for all variables at each time point can be
found in Table 3. Intercorrelations between variables are available in the supplemental material.
Test-retest reliability of W-RS was computed in order to further establish scale reliability, and
was high in the current sample, r = .82, p < .001.
Analysis strategy. The data for Study 3 were analyzed using structural equation
modeling in AMOS 17.0 (Arbuckle, 2008). Due to missing data across several variables,
maximum likelihood estimation was used. Model fit was assessed with Comparative Fit Index
(CFI), χ2, Root Mean Square Error of Approximation (RMSEA) and a test of close fit
(PCLOSE). All variables in the model were standardized prior to inclusion in order to maximize
interpretability. Testing a full hybrid model including all interrelationships between variables
was not achievable in the current study given its number of variables, sample size, and specific
WEIGHT-BASED REJECTION SENSITIVITY 31
aims (e.g., Kenny & McCoach, 2003); thus, we created separate models for each outcome, using
a theoretically-driven approach to select key relationships to test. All references to W-RS are
specific to its Time 1 properties unless otherwise specified.
Models of key hypotheses. Conceptually, each model tested the central hypothesis that
W-RS predicts constructs at Time 2 when controlling for those same constructs at Time 1.
Separately, in order to rule out the alternative hypothesis that the variables specified as outcomes
actually predict W-RS rather than the hypothesized reverse, alternate causality models were
tested. In all models, the alternative hypothesis was rejected, and our hypothesized directionality
was maintained4. Thus, we retained the models testing our key hypotheses.
Model results. Figure 2 shows the results of the tests of direct effects for our key
hypotheses.
Psychological distress. W-RS and psychological distress at Time 1 were correlated, r =
.61. As expected, W-RS predicted Time 2 psychological distress when controlling for Time 1
psychological distress, β = .12, p = .028. Specifically, students who scored higher in W-RS at the
beginning of the semester had higher psychological distress at the end of the semester.
Adjustment to college. In the hypothesized model, the path between W-RS and
adjustment to college was significant, β = -.40, p < .001. Those higher in W-RS at the beginning
of the semester had poorer adjustment to college at the end of their first semester at college.
Physical well-being.
Disordered eating patterns. Disordered eating at Time 1 was correlated with bulimia
symptoms at Time 1, r = .65, and with W-RS at Time 1, r = .55. Contrary to the hypothesis, W-
RS did not predict Time 2 disordered eating when controlling for Time 1 disordered eating, β = -
4 Results available from the authors by request.
WEIGHT-BASED REJECTION SENSITIVITY 32
.03, p = .487. However, in support of the hypothesis, W-RS predicted Time 2 bulimia symptoms
controlling for Time 1 bulimia symptoms, β = .11, p = .032. Those who anxiously expected
weight-based rejection at the beginning of the semester presented more bulimia symptoms at the
end of the semester.
General health. Controlling for health-related quality of life at Time 1, higher W-RS
predicted lower Time 2 health-related quality of life, β = -.15, p = 040. Because the PILL was
included at Time 2 only, we controlled for health-related quality of life at Time 1 when running
the analysis. Controlling for health-related quality of life, W-RS predicted physical illness
symptoms, β = .21, p < .001. Those who were higher in W-RS reported having experienced more
physical illness symptoms over the course of the semester.
Predictive validity. In separate tests that explored the predictive validity of W-RS, we
added two additional predictors in each model: body dissatisfaction and appearance-based self-
worth. When they were added to each model, W-RS consistently emerged as the strongest
predictor across every measure of psychological distress, adjustment to college, and physical
well-being (see Table 4). Moreover, in contrast to W-RS, body dissatisfaction and appearance-
based self-worth never significantly predicted any outcomes when all three predictors were
included in the models.
Mediation. It was hypothesized that psychological distress would mediate the
relationship between W-RS and physical well-being. This hypothesis was tested by integrating
the psychological distress model with the disordered eating model and with the general health
model. In integrating the models, paths were added between Time 2 psychological distress and
each of the Time 2 measures of physical well-being. We tested the hypothesis that psychological
distress would mediate the relationship between W-RS and physical well-being. This involved
WEIGHT-BASED REJECTION SENSITIVITY 33
testing psychological distress as a mediator in the disordered eating and general health models.
Sobel estimates of indirect effects were calculated with an online Sobel Test Calculator
(Preacher & Leonardelli, 2012) to accommodate missing data.
Disordered eating patterns. In the model testing psychological distress as a mediator
between W-RS and disordered eating patterns, the path between psychological distress and
bulimia symptoms was significant, β = .28, p < .001, such that higher psychological distress was
associated with more bulimia symptoms. With the inclusion of psychological distress as a
mediator between W-RS and bulimia, the direct effect between W-RS and bulimia was non-
significant, β < .01, p = .936. The Sobel test indicated that indirect effect between W-RS and
bulimia through psychological functioning was significant z = -2.08, p = .038. Thus,
psychological distress was found to mediate the relationship between W-RS and bulimia
symptoms.
General health. In the model testing psychological distress as a mediator between W-RS
and general health, the path between psychological distress and quality of life was significant, β
= -.53, p < .001, such that higher psychological distress predicted lower health-related quality of
life. The direct effect between W-RS and quality of life was no longer significant, β = .004, p =
.96. The indirect effect between W-RS and quality of life through psychological distress was
significant, z = -2.01, p = .04. Thus, psychological distress mediated the relationship between W-
RS and health-related quality of life.
The path between psychological distress and the PILL was significant, β = .28, p < .001,
such that higher psychological distress was associated with more physical illness symptoms at
the end of the semester. In this case, with the inclusion of psychological distress as a mediator,
the direct effect between W-RS and the PILL remained significant, β = .13, p = .04. There was a
WEIGHT-BASED REJECTION SENSITIVITY 34
significant indirect effect between W-RS and the PILL through psychological distress, z = 2.15,
p = .04. Thus, psychological distress partially mediated the relationship between W-RS and
physical illness symptoms.
Summary. In the current study, those who were more likely to anxiously expect weight-
based rejection at the beginning of the semester had higher psychological distress and poorer
adjustment to college. W-RS also predicted poorer physical well-being in a number of ways,
though the influence of W-RS was more complex in the context of disordered eating patterns.
Anxiously expecting weight-based rejection at the beginning of the semester predicted increased
bulimia symptoms, but not general disordered eating. Despite the nonsignificant relationship
between W-RS and disordered eating, these results support our hypothesis that W-RS would
more strongly predict bulimia symptoms because of their shared affective underpinnings. In a
test of the indirect effect, the relationship between W-RS and bulimia symptoms was indeed
found to be mediated by psychological distress. In the context of general health, those who
anxiously expected weight-based rejection at the beginning of the semester experienced lower
health-related quality of life and increased physical illness symptoms at the end of their first
semester at college. Psychological distress played a role in mediating the relationship between
W-RS and these outcomes as well. Taken together, W-RS adversely impacts many psychological
and physical health outcomes, and can be considered an important factor in specifying who is
most at risk for the negative consequences of living with the stigmatized identity of overweight.
General Discussion
The goals of this research were two-fold. The first goal was to develop a new measure of
weight-based rejection sensitivity and test its psychometric properties (Studies 1 & 2) in order to
fill important gaps in the weight stigma literature. The second goal was to examine the long-term
WEIGHT-BASED REJECTION SENSITIVITY 35
outcomes and predictive validity of weight-based rejection sensitivity in a longitudinal study
(Study 3). A new measure of weight-based rejection sensitivity was created and evaluated to
assess anxious expectations of weight-based rejection. This measure was psychometrically
evaluated in three cross-sectional studies. The final W-RS scale contained 16 items. Study 1
established the W-RS as a reliable, single-factor measure. Studies 2a and 2b established the
construct validity of the W-RS scale. Specifically, Study 2a established convergent validity with
theoretically related measures, and Study 2b established discriminant validity from theoretically
unrelated measures. Taken together, Studies 1 and 2 demonstrated that W-RS scale is a valid,
reliable measure of weight-based rejection sensitivity.
Study 3 tested the effects of W-RS longitudinally across college students’ first semester.
In a series of tests, W-RS at the beginning of the semester predicted higher psychological
distress, poorer college adjustment, increased bulimia symptoms, and decreased physical health
at the end of the semester. W-RS did not predict general disordered eating patterns over time. In
order to examine potential mediation, analyses were conducted that tested psychological distress
as a mediator. W-RS had indirect effects on bulimia symptoms, health-related quality of life, and
physical health symptoms through psychological distress. Thus, psychological distress was
shown to be an important mechanism through which W-RS leads to negative outcomes.
The results of Study 3 not only show the effects of W-RS over time, but also show its
predictive value in relation to other current measures. Two additional predictors, body
dissatisfaction and appearance self-worth, were also included in each model. For each outcome,
W-RS was the strongest predictor. Moreover, body dissatisfaction and appearance self-worth
never emerged as significant predictors. This is notable because they were included based on
their established ability to predict outcomes that we hypothesized W-RS would predict. Thus, the
WEIGHT-BASED REJECTION SENSITIVITY 36
predictive validity of W-RS in comparison to these measures supports the notion that W-RS
plays a unique and important role in psychological and physical well-being. Also of note is that
levels of W-RS in each sample were relatively low overall. However, our research findings
suggest that even these small levels of W-RS can have a profound impact on psychological and
physical well-being, and predict these outcomes over and above other key measures.
The current work makes several contributions to literature on weight stigma. W-RS
represents a personal characteristic that theoretically develops from previous experiences of
weight-based stigmatization. It is the first measure of its kind to capture the day-to-day, dynamic
interpersonal experience of living with the stigmatized identity of overweight. In doing so, W-RS
addresses the stigma mechanism of anxiously anticipating rejection, a mechanism which has
previously been ascribed theoretical and empirical significance (e.g., Earnshaw & Chaudoir,
2009; Earnshaw & Quinn, 2012; Hunger & Major, 2015; Link, 1987; Meyer, 1995) and which
has been missing in the weight stigma literature. Moreover, W-RS may be a stigma mechanism
that can help to explain who is more prone to the negative consequences of weight stigma, which
is important because not all people living with a stigmatized identity experience harmful effects
from that identity (see Major, 2006). Notably, W-RS is also able to capture the experience of
stigma for those who are not necessarily overweight considering clinical standards, but who may
consider themselves overweight in comparison to a thin ideal.
Experiences with rejection and stigma have often been associated with increased
psychological distress, and W-RS is no exception. However, W-RS also predicted poorer
adjustment to college at the end of college students’ first semester in the current study. This
finding lends more support for the notion that rejection sensitivity can negatively influence the
college experience, given the precedent of similar findings in such rejection sensitivity domains
WEIGHT-BASED REJECTION SENSITIVITY 37
as race (Mendoza-Denton et al., 2002) and gender (London et al., 2012). To the extent that high
rejection sensitivity based on any status characteristic can negatively influence adjustment to
college, that status characteristic can further disadvantage marginalized groups in their
attainment of higher education. Thus, those high in W-RS could have heightened risk for
systematic disadvantage, beyond that which has previously been shown to occur for those who
are overweight (Puhl & Heuer, 2009).
The finding that W-RS can increase risk for bulimia symptoms adds to a growing
literature on the relationship between stigma and disordered eating patterns (see Puhl & Suh,
2015). The notion that weight stigma can lead to negative health outcomes generally is a
particularly important contribution to the literature. Although recent studies have begun to show
physical consequences of experiencing weight stigma, studies linking weight stigma with
negative health outcomes are relatively rare, particularly longitudinal studies (see Puhl,
Brownell, & DePierre, 2014; Puhl & Heuer, 2009). Moreover, our results challenge the notion
that stigmatizing overweight people will lead them to adopt healthy behaviors in order to reduce
their weight. The current work provides evidence that the experience of weight stigma can lead
to negative health behaviors and consequences rather than positive ones. The broad implication
of these findings is that over time, W-RS may contribute to health disparities (Hatzenbuehler,
Phelan, & Link, 2013).
Limitations and Future Directions
One of the major contributions of this research is that it assesses anticipated status-based
rejection, an important stigma mechanism that had previously been missing in the weight stigma
literature. As such, future research can explore the interrelationships and predictions of these
stigma mechanisms more fully in the context of weight. For instance, it is possible that
WEIGHT-BASED REJECTION SENSITIVITY 38
internalized weight stigma predicts weight-based rejection sensitivity (e.g., Earnshaw & Quinn,
2012). However, it is also possible that those who anxiously expect weight-based rejection come
to internalize stigma (e.g., Quinn, Williams, & Weisz, 2015). Future research can more clearly
distinguish these pathways. Additionally, part of the theoretical basis of interpersonal rejection
sensitivity is that it originates from previous rejecting experiences (Feldman & Downey, 1994).
Thus, future research can also explore whether W-RS originates from increased weight-based
stigmatizing experiences.
Apart from exploring stigma mechanisms, there are many exciting avenues for future
research with W-RS. It is possible, for example, that W-RS could be particularly activated
through weight-related social control, others’ attempts to influence weight control behaviors.
Weight-related social control has been associated with negative health and well-being outcomes
(Brunson, Øverup, Nguyen, Novak, & Smith, 2014), and serves as a prime example of the type
of interpersonal processes W-RS was designed to capture. These comments and attempts made
by others may activate W-RS and together undermine psychological and physical well-being.
Despite the evidence we present of W-RS’s adverse consequences within a college
population, the generalizability of the results is limited in several ways. First, in light of the
importance of weight in college populations and for consistency with other rejection sensitivity
scales, we chose to focus on college students as our first step in developing the construct.
However, it is unclear how W-RS may be experienced outside of a college population. Perhaps
some weight-related concerns tend to decrease as people age (such as potential judgments of
attractiveness), whereas other weight-related concerns might increase (such as potential
judgments about laziness and/or health). One of the most important avenues for future research is
to examine W-RS in a more representative sample. A representative sample would also address
WEIGHT-BASED REJECTION SENSITIVITY 39
our other limitations; namely, the lack of racial and ethnic diversity in our samples, the gender
imbalance, and the few people with severe obesity in our samples. It is imperative to determine
how W-RS is experienced in the broader population, particularly given the potential implications
for psychological and physical well-being. However, the implications discovered in our college
samples are still noteworthy, particularly for those who work to increase the well-being of
college students.
Future research should also examine these processes within clinical weight-loss
populations specifically, because identifying who is most at risk for the negative consequences of
weight stigma can provide important information in designing interventions to promote healthy
behaviors. Most behavioral weight loss interventions do not explicitly consider the effects of
stigma, but the current work provides evidence that expecting stigma can be especially important
in shaping the outcomes of those who experience it, and other recent research suggests that
weight stigma may lead to weight gain (Sutin et al., 2014; Tomiyama, 2014). Interventions that
address stigma may help increase the likelihood of treatment success.
Conclusions
In summary, our findings provide insight into a previously neglected process in the
experience of weight stigma. Weight-based rejection sensitivity was shown to lead to negative
academic, psychological, and physical health outcomes. Given the high prevalence of overweight
and obesity (Ogden et al., 2006) and the high prevalence of weight-based discrimination (Puhl &
Brownell, 2001; Puhl & Heuer, 2009), a tendency to anxiously expect this weight-based rejection
could adversely impact many. Future research can examine this important construct within
broader populations and develop interventions to address its negative effects.
WEIGHT-BASED REJECTION SENSITIVITY 40
Acknowledgements
We thank Amy Gorin, Kerry Marsh, Hart Blanton, Blair Johnson, and Ryan Thibodeau
for their feedback on research design and/or for their comments on earlier versions of the
manuscript. We thank David Kenny and Randi Garcia for their assistance with data analysis. We
thank Associate Editor Rachel Calogero, Editor-in-Chief Thomas Cash, and two anonymous
reviewers for their thoughtful feedback on the manuscript.
WEIGHT-BASED REJECTION SENSITIVITY 41
References
Allport G. W. (1954). The nature of prejudice. Reading, MA: Addison-Wesley.
Alpers, G. W., & Tuschen-Caffier, B. (2001). Negative feelings and the desire to eat in bulimia
nervosa. Eating Behaviors, 2, 339-352. doi:10.1016/S1471-0153(01)00040-X
American Psychiatric Association. (2013). Diagnostic and statistical manual of mental disorders
(5th ed.). Washington, DC: Author.
Arbuckle, J. L. (2008). AMOS 17.0. Spring House: Amos Development Corporation.
Ashmore, J. A., Friedman, K. E., Reichmann, S. K., & Musante, G. J. (2008). Weight-based
stigmatization, psychological distress, & binge eating behavior among obese treatment-
seeking adults. Eating Behaviors, 9, 203-209. doi: 10.1016/j.eatbeh.2007.09.006
Ayduk, O., Downey, G., & Kim, M. (2001). Rejection sensitivity and depressive symptoms in
women. Personality and Social Psychology Bulletin, 27, 868-877. doi:
10.1177/0146167201277009
Baker, R. W., & Siryk, B. (1989). Student Adaptation to College Questionnaire (SACQ):
Manual. Los Angeles, CA: Western Psychological Services.
Baumeister, R. F., & Leary, M. R. (1995). The need to belong: Desire for interpersonal
attachments as a fundamental human motivation. Psychological Bulletin, 117, 497-529.
doi: 10.1037/0033-2909.117.3.497
Blanton, H., & Jaccard, J. (2006). Arbitrary metrics in psychology. American Psychologist, 61,
27-41. doi: 10.1037/0003-066X.61.1.27
Brunson, J. A., Øverup, C. S., Nguyen, M. L., Novak, S. A., & Smith, C. V. (2014). Good
intentions gone awry? Effects of weight-related social control on health and well-being.
Body Image, 11, 1-10. doi: 10.1016/j.bodyim.2013.08.003
WEIGHT-BASED REJECTION SENSITIVITY 42
Burmeister, J. M., Kiefner, A. E., Carels, R. A., & Musher‐Eizenman, D. R. (2013). Weight bias
in graduate school admissions. Obesity, 21, 918-920. doi: 10.1002/oby.20171
Canning, H., & Mayer, J. (1966). Obesity—its possible effect on college acceptance. New
England Journal of Medicine, 275, 1172-1174. doi: 10.1056/NEJM196611242752107
Carels, R. A., Domoff, S. E., Burmeister, J. M., Koball, A. M., Hinman, N. G., Davis, A. K., ...
& Hoffmann, D. A. (2013). Examining perceived stereotype threat among
overweight/obese adults using a multi-threat framework. Obesity Facts, 6, 258-268. doi:
10.1159/000352029
Centers for Disease Control and Prevention. (2000). Measuring healthy days. Atlanta, Georgia:
CDC.
Cohen, S., Kamarck, T., & Mermelstein, R. (1983). A global measure of perceived stress.
Journal of Health and Social Behavior, 24, 385-396.
http://www.jstor.org.pluma.sjfc.edu/stable/2136404
Cole, S. W., Kemeny, M. E., & Taylor, S. E. (1997). Social identity and physical health:
Accelerated HIV progression in rejection-sensitive gay men. Journal of Personality and
Social Psychology, 72, 320-335. doi: 10.1037/0022-3514.72.2.320
Crandall, C. S. (1994). Prejudice against fat people: Ideology and self-interest. Journal of
Personality and Social Psychology, 66, 882-894. doi: 10.1037/0022-3514.66.5.882
Crocker, J. (2002). The costs of seeking self-esteem. Journal of Social Issues, 58, 597-615. doi:
10.1111/1540-4560.00279
Crocker, J., & Knight, K. M. (2005). Contingencies of self-worth. Current Directions in
Psychological Science, 14, 200-203. doi: 10.1037/0033-295X.108.3.593
Crocker, J., & Major, B. (1989). Social stigma and self-esteem: The self-protective properties of
WEIGHT-BASED REJECTION SENSITIVITY 43
stigma. Psychological Review, 96, 608-630. doi: 10.1037/0033-295X.96.4.608
Crocker, J., & Park, L. E. (2004). The costly pursuit of self-esteem. Psychological Bulletin, 130,
392–414. doi: 10.1037/0033-2909.130.3.392
Crocker, J., Cornwell, B., & Major, B. (1993). The stigma of overweight: Affective
consequences of attributional ambiguity. Journal of Personality and Social Psychology,
64, 60-70. doi: 10.1037/0022-3514.64.1.60
Crocker, J., Luhtanen, R. K., Cooper, M., & Bouvrette, A. (2003). Contingencies of self-worth in
college students: Theory and measurement. Journal of Personality and Social
Psychology, 85, 894-908. doi: 10.1037/0022-3514.85.5.894
Downey, G., & Feldman, S. I. (1996). Implications of rejection sensitivity for intimate
relationships. Journal of Personality and Social Psychology, 70, 1327-1343. doi:
10.1037/0022-3514.70.6.1327
Durso, L. E., & Latner, J. D. (2008). Understanding self-directed stigma: Development of the
weight bias internalization scale. Obesity, 16, S80-S86. doi: 10.1038/oby.2008.448
Earnshaw, V. A., & Chaudoir, S. R. (2009). From conceptualizing to measuring HIV stigma: a
review of HIV stigma mechanism measures. AIDS and Behavior, 13, 1160-1177. doi:
10.1007/s10461-009-9593-3
Earnshaw, V. A., & Quinn, D. M. (2012). The impact of stigma in healthcare on people living
with chronic illnesses. Journal of Health Psychology, 17, 157-168. doi:
10.1177/1359105311414952
Feather, N. T. (1996). Reactions to penalties for an offense in relation to authoritarianism,
values, perceived responsibility, perceived seriousness, and deservingness. Journal of
Personality and Social Psychology, 71, 571-587. doi: 10.1037/0022-3514.71.3.571
WEIGHT-BASED REJECTION SENSITIVITY 44
Feldman. S., & Downey, G. (1994). Rejection sensitivity as a mediator of the impact of
childhood exposure to family violence on adult attachment behavior. Development and
Psychopathology, 6, 231-247. doi: 10.1017/S0954579400005976
Friedman, K. E., Reichmann, S. K., Costanzo, P. R., Zelli A., Ashmore J. A., & Musante, G. J.
(2005). Weight stigmatization and ideological beliefs: Relation to psychological
functioning in obese adults. Obesity Research, 13, 907–916. doi: 10.1038/oby.2005.105
Garner, D. M., Olmstead, M. P., & Polivy, J. (1983). Development and validation of a
multidimensional eating disorder inventory for anorexia nervosa and bulimia.
International Journal of Eating Disorders, 2, 15-34. DOI: 10.1002/1098-
108X(198321)2:2<15::AID-EAT2260020203>3.0.CO;2-6
Garner, D. M., Olmsted, M. P., Bohr, Y., & Garfinkel, P. E. (1982). The Eating Attitudes Test:
Psychometric features and clinical correlates. Psychological Medicine: A Journal of
Research in Psychiatry and the Allied Sciences, 12, 871-878. doi:
10.1017/S0033291700049163
Goffman, E. (1963). Stigma: Notes on the management of spoiled identity. Englewood Cliffs,
N.J: Prentice-Hall.
Gosling, S. D., Rentfrow, P. J., & Swann, W. B. (2003). A very brief measure of the Big Five
personality domains. Journal of Research in Personality, 37, 504-528. doi:
10.1016/S0092-6566(03)00046-1
Grabe, S., & Hyde, J. (2006). Ethnicity and body dissatisfaction among women in the United
States: A meta-analysis. Psychological Bulletin, 132, 622-640. doi: 10.1037/0033-
2909.132.4.622
Hawkins, R. C., & Clement, P. F. (1984). Binge eating: Measurement problems and a conceptual
WEIGHT-BASED REJECTION SENSITIVITY 45
model. In R. C. Hawkins, W. J. Fremouw, & P. F. Clement (Eds.), The binge purge
syndrome: Diagnosis, treatment, and research (pp. 229–251). New York, NY: Springer.
Hatzenbuehler, M.L., Phelan, J.C., & Link, B.G. (2013). Stigma as a fundamental cause of
population health inequalities. American Journal of Public Health, 103, 813-821. doi:
10.2105/AJPH.2012.301069
Hebl, M. R., & Heatherton, T. F. (1998). The stigma of obesity in women: The difference is
black and white. Personality and Social Psychology Bulletin, 24, 417-426. doi:
10.1177/0146167298244008
Hunger, J. M., & Major, B. (2015). Weight stigma mediates the association between BMI and
self-reported health. Health Psychology, 34, 172-175. doi: 10.1037/hea0000106
Inzlicht M., & Good C. (2006). How environments threaten academic performance, self-
knowledge, and sense of belonging. In S. Levin & C. van Laar (Eds.), Stigma and group
inequality: Social psychological approaches (pp. 129-150). Mahwah, NJ: Erlbaum.
Jackson, T. D., Grilo, C. M., & Masheb, R. M. (2000). Teasing history, onset of obesity, current
eating disorder psychopathology, body dissatisfaction, and psychological functioning in
binge eating disorder. Obesity Research, 8, 451-458. doi: 10.1038/oby.2000.56
Johnson, F., & Wardle, J. (2005). Dietary restraint, body dissatisfaction, and psychological
distress: A prospective analysis. Journal of Abnormal Psychology, 114, 119–125. doi:
10.1037/0021-843X.114.1.119
Kang, S. K., & Chasteen, A. L. (2009). The development and validation of the Age-Based
Rejection Sensitivity Questionnaire. The Gerontologist, 49, 303-316. doi:
10.1093/geront/gnp035
Kenny, D. A., & McCoach, D. B. (2003). Effect of the number of variables on measures of fit in
WEIGHT-BASED REJECTION SENSITIVITY 46
structural equation modeling. Structural Equation Modeling, 10, 333-3511. doi:
10.1207/S15328007SEM1003_1
Kessler, R. C., Mickelson, K. D., & Williams, D. R. (1999). The prevalence, distribution, and
mental health correlates of perceived discrimination in the United States. Journal of
Health and Social Behavior, 40, 208-230. doi: 10.2307/2676349
Latner, J. D., Durso, L. E., & Mond, J. M. (2013). Health and health-related quality of life
among treatment-seeking overweight and obese adults: Associations with internalized
weight bias. Journal of Eating Disorders, 1, 1-6. doi:10.1186/2050-2974-1-3
Lerner, M. J. (1980). Belief in a just world: A fundamental delusion. New York: Plenum Press.
Lillis, J., Luoma, J. B., Levin, M. E., & Hayes, S. C. (2010). Measuring weight self-stigma: The
Weight Self-stigma Questionnaire. Obesity, 18, 971-976. doi: 10.1038/oby.2009.353
Link, B. G. (1987). Understanding labeling effects in the area of mental disorders: An
assessment of the effects of expectations of rejection. American Sociological Review, 52,
96-112. http://www.jstor.org/stable/2095395
London, B. E. (2008). Gender rejection sensitivity: Theory, validation, and implications for the
psychosocial well-being and achievement outcomes of women. ProQuest Information &
Learning. Dissertation Abstracts International: Section B: The Sciences and Engineering,
69. (2008-99140-388)
London, B., Downey, G., Bonica, C., & Paltin, I. (2007). Social causes and consequences of
rejection sensitivity in adolescents. Journal of Research in Adolescence, 17, 481–506.
doi: 10.1111/j.1532-7795.2007.00531.x
London, B., Downey, G., Romero-Canyas, R., Rattan, A., & Tyson, D. (2012). Gender-based
rejection sensitivity and academic self-silencing in women. Journal of Personality and
WEIGHT-BASED REJECTION SENSITIVITY 47
Social Psychology, 102, 961-979. doi: 10.1037/a0026615
Major, B. (2006). New perspectives on stigma and psychological well-being. In S. Levin & C.
van Laar (Eds.), Stigma and group inequality: Social psychological perspectives (pp.
193–210). Mahwah, NJ: Erlbaum.
Major, B., Eliezer, D. & Rieck, H. (2012). The psychological weight of weight stigma. Social
Psychological and Personality Science, 3, 651-658. doi: 10.1177/1948550611434400
Major, B., Hunger, J.M., Bunyan, D., & Miller, C.T. (2014). The ironic effects of weight stigma.
Journal of Experimental Social Psychology, 51, 74-80. doi: 10.1016/j.jesp.2013.11.009
Marston, E. G., Hare, A., & Allen, J. P. (2010). Rejection sensitivity in late adolescence: Social
and emotional sequelae. Journal of Research on Adolescence, 20, 959-982. doi:
10.1111/j.1532-7795.2010.00675.x
Mattick, R. P., & Clarke, J. C. (1998). Development and validation of measures of social phobia
scrutiny fear and social interaction anxiety. Behaviour Research and Therapy, 36, 455–
470. doi: 10.1016/S0005-7967(97)10031-6
McClure, K. J., Puhl, R. M., & Heuer, C. A. (2011). Obesity in the news: Do photographic
images of obese persons influence antifat attitudes?. Journal of Health Communication,
16, 359-371. doi: 10.1080/10810730.2010.535108
McKinley, N. M., & Hyde, J. S. (1996). The objectified body consciousness scale. Psychology of
Women Quarterly, 20, 181–215. doi: 10.1111/j.1471-6402.1996.tb00467.x
Mendoza-Denton, R., Downey, G., Purdie, V. J., Davis, A., & Pietrzak, J. (2002). Sensitivity to
status-based rejection: Implications for African American students' college experience.
Journal of Personality and Social Psychology, 83, 896-918. doi: 10.1037/0022-
3514.83.4.896
WEIGHT-BASED REJECTION SENSITIVITY 48
Meyer, I. H. (1995). Minority stress and mental health in gay men. Journal of Health and Social
Behavior, 36, 38-56. http://www.jstor.org/stable/2137286
Myers, A., & Rosen, J. C. (1999). Obesity stigmatization and coping: relation to mental health
symptoms, body image, and self-esteem. International Journal of Obesity, 23, 221–230.
http://www.nature.com/ijo/journal/v23/n3/pdf/0800765a.pdf
Neumark-Sztainer, D., Falkner, N., Story, M., Perry, C., Hannan, P. J., & Mulert, S. (2002).
Weight-teasing among adolescents: Correlations with weight status and disordered eating
behaviors. International Journal of Obesity, 26, 123–131. doi: 10.1038/sj/ijo/0801853
Ogden, C. L., Carroll, M. D., Curtin, L. R., McDowell, M. A., Tabak, C. J., & Flegal, K. M.
(2006). Prevalence of overweight and obesity in the United States, 1999-2004. JAMA:
The Journal of the American Medical Association, 295(13), 1549-1555. doi:
10.1001/jama.295.13.1549.
Park, L. E. (2007). Appearance-based rejection sensitivity: Implications for mental and physical
health, affect, and motivation. Personality and Social Psychology Bulletin, 33, 490-504.
doi: 10.1177/0146167206296301
Park, L. E., & Pinkus, R. T. (2009). Interpersonal effects of appearance-based rejection
sensitivity. Journal of Research in Personality, 43, 602-612. doi:
10.1016/j.jrp.2009.02.003
Park, L. E., Calogero, R. M., Harwin, M. J., & DiRaddo, A. M. (2009). Predicting interest in
cosmetic surgery: Interactive effects of appearance-based rejection sensitivity and
negative appearance comments. Body Image, 6, 186-193. doi:
10.1016/j.bodyim.2009.02.003
Pascoe, E. A., & Smart Richman, L. (2009). Perceived discrimination and health: A meta-
WEIGHT-BASED REJECTION SENSITIVITY 49
analytic review. Psychological Bulletin, 135, 531-554. doi: 10.1037/a0016059
Paulhus, D. L. (1984). Two-component models of socially desirable responding. Journal of
Personality and Social Psychology, 46, 598-609. doi: 10.1037/0022-3514.46.3.598
Pennebaker, J.W. (1982). The psychology of physical symptoms. New York: Springer-Verlag.
Polivy, J. C., Herman, P., Younger, J. C., & Erskine, B. (1979). Effects of a model on eating
behavior: The induction of a restrained eating style. Journal of Personality, 47, 100-117.
doi: 10.1111/j.1467-6494.1979.tb00617.x
Preacher, K. J. & Leonardelli, G. J. (2012). Calculation for the Sobel Test [Computer software].
Retrieved on March 28, 2012, from http://quantpsy.org/sobel/sobel.htm/
Puhl, R. M., & Brownell, K. D. (2006). Confronting and coping with weight stigma: An
investigation of overweight and obese adults. Obesity, 14, 1802-1815. doi:
10.1038/oby.2006.208
Puhl, R. M., & Heuer, C. A. (2009). The stigma of obesity: A review and update. Obesity, 17,
941-964. doi: 10.1038/oby.2008.636
Puhl, R. M., & Heuer, C. A. (2010). Obesity stigma: Important considerations for public health.
American Journal of Public Health, 100, 1019-1028. doi: 10.2105/AJPH.2009.159491
Puhl, R. M., Moss-Racusin, C. A., Schwartz, M. B., & Brownell, K. D. (2008). Weight
stigmatization and bias reduction: Perspectives of overweight and obese adults. Health
Education Research, 23, 347-358. doi: 10.1093/her/cym052
Puhl, R., & Brownell, K. D. (2001). Bias, discrimination, and obesity. Obesity Research, 9, 788-
805. doi: 10.1038/oby.2001.108
Puhl, R. M., Brownell, K. D., & DePierre, J. A. (2014). Bias, discrimination, and obesity. In G.
A. Bray & C. Bouchard (Eds.), Handbook of obesity: Clinical applications (pp. 461-470).
WEIGHT-BASED REJECTION SENSITIVITY 50
Boca Raton, FL: CRC Press.
Puhl, R. M., & Latner, J. D. (2007). Stigma, obesity, and the health of the nation's children.
Psychological Bulletin, 133, 557-580. doi: 10.1037/0033-2909.133.4.557
Puhl, R., Moss-Racusin, C. A., & Schwartz, M. B. (2007). Internalization of weight bias:
Implications for binge eating and emotional well-being. Obesity, 15, 19–23. doi:
10.1038/oby.2007.521
Puhl, R., & Suh, Y. (2015). Stigma and eating and weight disorders. Current Psychiatry
Reports, 17, 1-10. doi: 10.1007/s11920-015-0552-6
Quinn, D. M., & Chaudoir, S. R. (2009). Living with a concealable stigmatized identity: The
impact of anticipated stigma, centrality, salience, and cultural stigma on psychological
distress and health. Journal of Personality and Social Psychology, 97, 634-651. doi:
10.1037/a0015815
Quinn, D. M., Williams, M. K., & Weisz, B. M. (2015). From discrimination to internalized
mental illness stigma: The mediating roles of anticipated discrimination and anticipated
stigma. Psychiatric Rehabilitation Journal, 38, 103-108. doi: 10.1037/prj0000136
Radloff, L. S. (1977). The CES-D scale: A self-report depression scale for research in the general
population. Applied Psychological Measurement, 1, 385-401. doi:
10.1177/014662167700100306
Rierdan, J., Koff, E., & Stubbs, M. L. (1989). A longitudinal analysis of body image as a
predictor of the onset and persistence of adolescent girls’ depression. Journal of Early
Adolescence, 9, 454–466. doi: 10.1177/0272431689094006
Rosenberg, M. (1965). Society and the adolescent self-image. Princeton, NJ: Princeton
University Press.
WEIGHT-BASED REJECTION SENSITIVITY 51
Rosenberger, P. H., Henderson, K. E, Bell, R. L., & Grilo, C. M. (2007). Associations of weight-
based teasing history and current eating disorder features and psychological functioning
in bariatric surgery patients. Obesity Surgery, 17, 470-477. doi: 10.1007/s11695-007-
9082-6
Rosenthal, L., Earnshaw, V. A., Carroll-Scott, A., Henderson, K. E., Peters, S. M., McCaslin, C.,
& Ickovics, J. R. (2015). Weight-and race-based bullying: Health associations among
urban adolescents. Journal of Health Psychology, 20, 401-412. doi:
10.1177/1359105313502567.
Sanchez, D. T., & Crocker, J. (2005). How investment in gender ideals affects well-being: The
role of external contingencies of self-worth. Psychology of Women Quarterly, 29, 63-77.
doi: 10.1111/j.1471-6402.2005.00169.x
Sargent, J. T., Crocker, J., & Luhtanen, R. K. (2006). Contingencies of self-worth and depressive
symptoms in college students. Journal of Social and Clinical Psychology, 25, 628-646.
doi: 10.1521/jscp.2006.25.6.628
Sheets, V., & Ajmere K. (2005). Are romantic partners a source of college students' weight
concern? Eating Behaviors, 6, 1-9. doi: 10.1016/j.eatbeh.2004.08.008
Spielberger, C., Vagg, P. R., Barker, L., Donham, G. W., & Westberry, L. G. (1980). The factor
structure of the State-Trait Anxiety Inventory. In I. G. Sarason & C. Spielberger (Eds.),
Stress and anxiety (Vol. 7). Washington: Hemisphere.
Stice, E., & Bearman, S. K. (2001). Body-image and eating disturbances prospectively predict
increases in depressive symptoms in adolescent girls: A growth curve analysis.
Developmental Psychology, 37, 597–607. doi: 10.1037/0012-1649.37.5.597
Stice, E., & Shaw, H. E., (2002). Role of body dissatisfaction in the onset and maintenance of
WEIGHT-BASED REJECTION SENSITIVITY 52
eating pathology: A synthesis of research findings. Journal of Psychosomatic Research,
53, 985–993. doi: 10.1016/S0022-3999(02)00488-9
Sutin, A. R., Stephan, Y., Luchetti, M., & Terracciano, A. (2014). Perceived weight
discrimination and C‐reactive protein. Obesity, 22, 1959-1961. doi: 10.1002/oby.20789
Thompson, J. K., Heinberg, L. J., Altabe, M. N., & Tantleff-Dunn, S. (1999). Exacting beauty:
Theory, assessment, and treatment of body image disturbance. Washington, DC:
American Psychological Association.
Thompson, M. A., & Gray, J. J. (1995). Development and validation of a new body-image
assessment scale. Journal of Personality Assessment, 64, 258-269. doi:
10.1207/s15327752jpa6402_6
Tomiyama, A. J. (2014). Weight stigma is stressful. A review of evidence for the Cyclic
Obesity/Weight-Based Stigma model. Appetite, 82, 8-15. doi:
10.1016/j.appet.2014.06.108
Tomiyama, A. J., Epel, E. S., McClatchey, T. M., Poelke, G., Kemeny, M. E., McCoy, S. K., &
Daubenmier, J. (2014). Associations of weight stigma with cortisol and oxidative stress
independent of adiposity. Health Psychology, 33, 862-867. doi: 10.1037/hea0000107
Weiner, B., Perry, R. P., & Magnusson, J. (1988). An attributional analysis of reactions to
stigmas. Journal of Personality and Social Psychology, 55, 738-748. doi: 10.1037/0022-
3514.55.5.738
Williams, D. R., & Mohammed, S. A. (2009). Discrimination and racial disparities in health:
Evidence and needed research. Journal of Behavioral Medicine, 32, 20-47. doi:
10.1007/s10865-008-9185-0
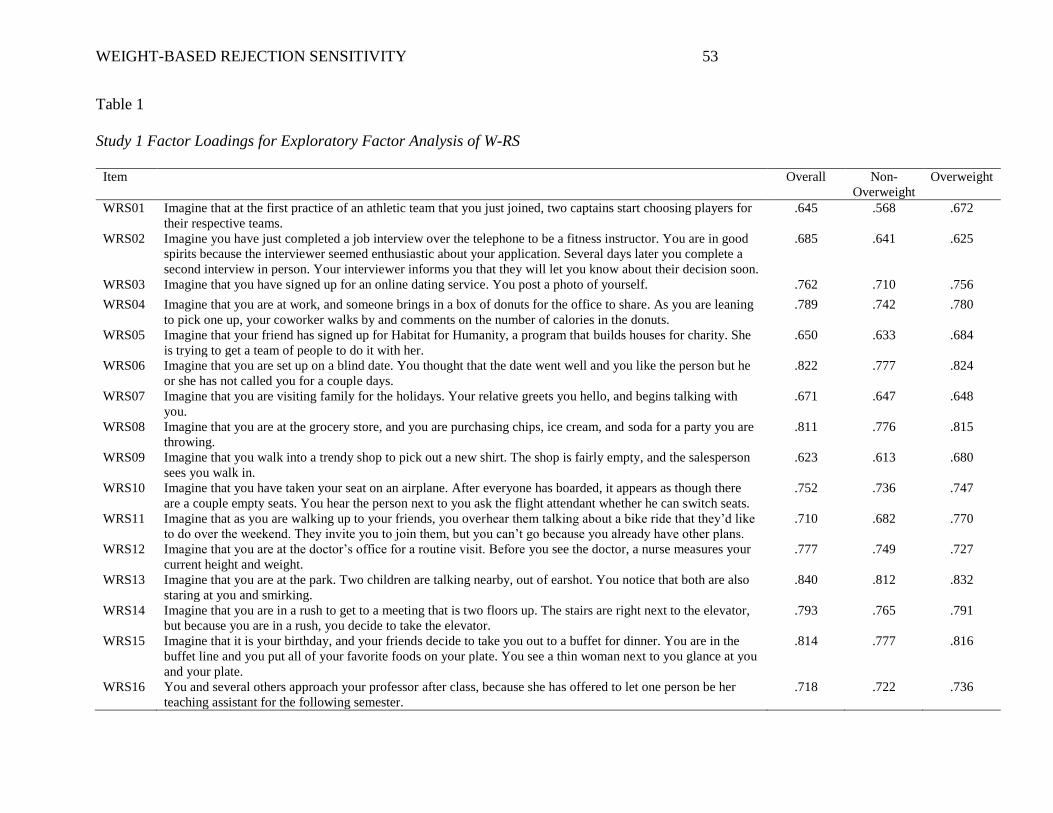
WEIGHT-BASED REJECTION SENSITIVITY 53
Table 1
Study 1 Factor Loadings for Exploratory Factor Analysis of W-RS
Item Overall Non-
Overweight
Overweight
WRS01 Imagine that at the first practice of an athletic team that you just joined, two captains start choosing players for
their respective teams.
.645 .568 .672
WRS02 Imagine you have just completed a job interview over the telephone to be a fitness instructor. You are in good
spirits because the interviewer seemed enthusiastic about your application. Several days later you complete a
second interview in person. Your interviewer informs you that they will let you know about their decision soon.
.685 .641 .625
WRS03 Imagine that you have signed up for an online dating service. You post a photo of yourself. .762 .710 .756
WRS04 Imagine that you are at work, and someone brings in a box of donuts for the office to share. As you are leaning
to pick one up, your coworker walks by and comments on the number of calories in the donuts.
.789 .742 .780
WRS05 Imagine that your friend has signed up for Habitat for Humanity, a program that builds houses for charity. She
is trying to get a team of people to do it with her.
.650 .633 .684
WRS06 Imagine that you are set up on a blind date. You thought that the date went well and you like the person but he
or she has not called you for a couple days.
.822 .777 .824
WRS07 Imagine that you are visiting family for the holidays. Your relative greets you hello, and begins talking with
you.
.671 .647 .648
WRS08 Imagine that you are at the grocery store, and you are purchasing chips, ice cream, and soda for a party you are
throwing.
.811 .776 .815
WRS09 Imagine that you walk into a trendy shop to pick out a new shirt. The shop is fairly empty, and the salesperson
sees you walk in.
.623 .613 .680
WRS10 Imagine that you have taken your seat on an airplane. After everyone has boarded, it appears as though there
are a couple empty seats. You hear the person next to you ask the flight attendant whether he can switch seats.
.752 .736 .747
WRS11 Imagine that as you are walking up to your friends, you overhear them talking about a bike ride that they’d like
to do over the weekend. They invite you to join them, but you can’t go because you already have other plans.
.710 .682 .770
WRS12 Imagine that you are at the doctor’s office for a routine visit. Before you see the doctor, a nurse measures your
current height and weight.
.777 .749 .727
WRS13 Imagine that you are at the park. Two children are talking nearby, out of earshot. You notice that both are also
staring at you and smirking.
.840 .812 .832
WRS14 Imagine that you are in a rush to get to a meeting that is two floors up. The stairs are right next to the elevator,
but because you are in a rush, you decide to take the elevator.
.793 .765 .791
WRS15 Imagine that it is your birthday, and your friends decide to take you out to a buffet for dinner. You are in the
buffet line and you put all of your favorite foods on your plate. You see a thin woman next to you glance at you
and your plate.
.814 .777 .816
WRS16 You and several others approach your professor after class, because she has offered to let one person be her
teaching assistant for the following semester.
.718 .722 .736
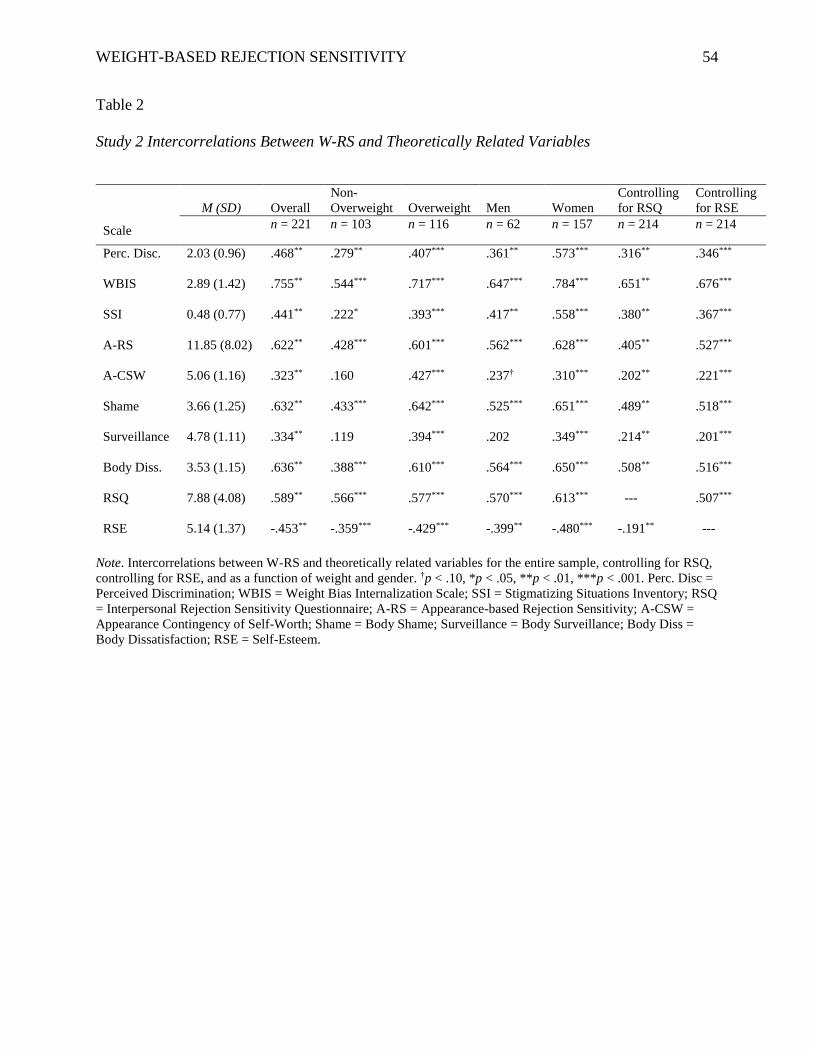
WEIGHT-BASED REJECTION SENSITIVITY 54
Table 2
Study 2 Intercorrelations Between W-RS and Theoretically Related Variables
Note. Intercorrelations between W-RS and theoretically related variables for the entire sample, controlling for RSQ,
controlling for RSE, and as a function of weight and gender. †p < .10, *p < .05, **p < .01, ***p < .001. Perc. Disc =
Perceived Discrimination; WBIS = Weight Bias Internalization Scale; SSI = Stigmatizing Situations Inventory; RSQ
= Interpersonal Rejection Sensitivity Questionnaire; A-RS = Appearance-based Rejection Sensitivity; A-CSW =
Appearance Contingency of Self-Worth; Shame = Body Shame; Surveillance = Body Surveillance; Body Diss =
Body Dissatisfaction; RSE = Self-Esteem.
M (SD) Overall
Non-
Overweight Overweight Men Women
Controlling
for RSQ
Controlling
for RSE
Scale n = 221 n = 103 n = 116 n = 62 n = 157 n = 214 n = 214
Perc. Disc. 2.03 (0.96) .468** .279** .407*** .361** .573*** .316** .346***
WBIS 2.89 (1.42) .755** .544*** .717*** .647*** .784*** .651** .676***
SSI 0.48 (0.77) .441** .222* .393*** .417** .558*** .380** .367***
A-RS 11.85 (8.02) .622** .428*** .601*** .562*** .628*** .405** .527***
A-CSW 5.06 (1.16) .323** .160 .427*** .237† .310*** .202** .221***
Shame 3.66 (1.25) .632** .433*** .642*** .525*** .651*** .489** .518***
Surveillance 4.78 (1.11) .334** .119 .394*** .202 .349*** .214** .201***
Body Diss. 3.53 (1.15) .636** .388*** .610*** .564*** .650*** .508** .516***
RSQ 7.88 (4.08) .589** .566*** .577*** .570*** .613*** --- .507***
RSE 5.14 (1.37) -.453** -.359*** -.429*** -.399** -.480*** -.191** ---
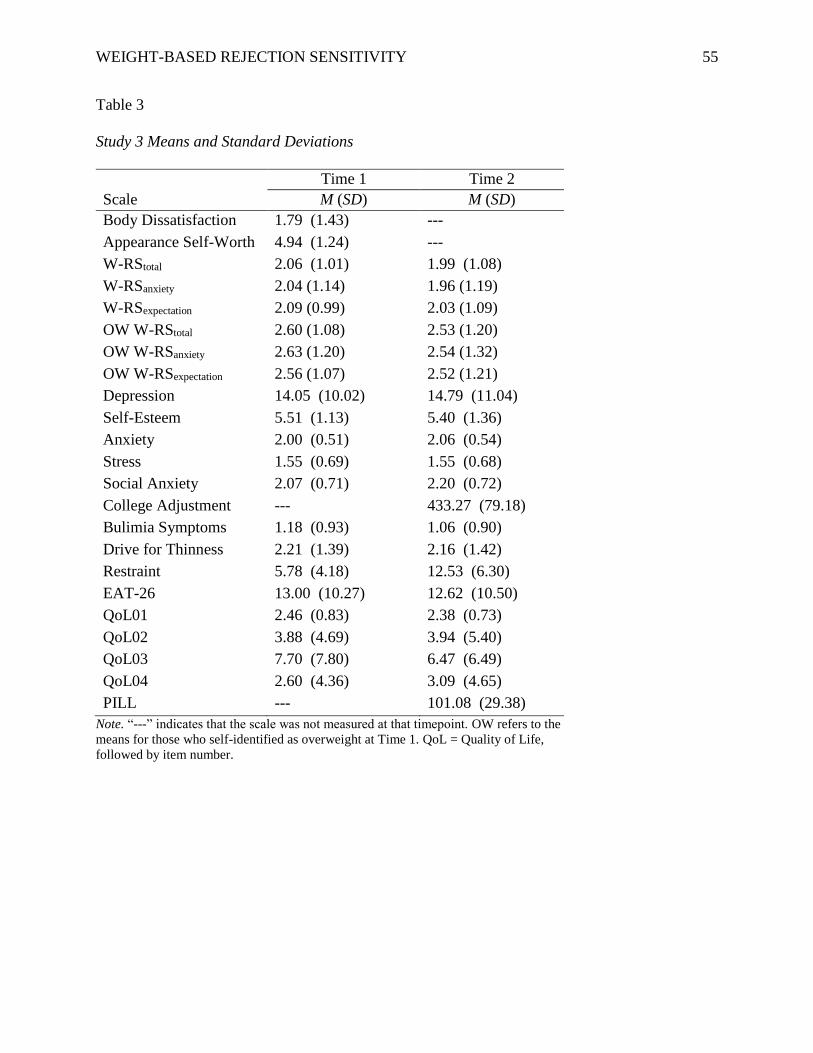
WEIGHT-BASED REJECTION SENSITIVITY 55
Table 3
Study 3 Means and Standard Deviations
Time 1 Time 2
Scale M (SD) M (SD)
Body Dissatisfaction 1.79 (1.43) ---
Appearance Self-Worth 4.94 (1.24) ---
W-RStotal 2.06 (1.01) 1.99 (1.08)
W-RSanxiety 2.04 (1.14) 1.96 (1.19)
W-RSexpectation 2.09 (0.99) 2.03 (1.09)
OW W-RStotal 2.60 (1.08) 2.53 (1.20)
OW W-RSanxiety 2.63 (1.20) 2.54 (1.32)
OW W-RSexpectation 2.56 (1.07) 2.52 (1.21)
Depression 14.05 (10.02) 14.79 (11.04)
Self-Esteem 5.51 (1.13) 5.40 (1.36)
Anxiety 2.00 (0.51) 2.06 (0.54)
Stress 1.55 (0.69) 1.55 (0.68)
Social Anxiety 2.07 (0.71) 2.20 (0.72)
College Adjustment --- 433.27 (79.18)
Bulimia Symptoms 1.18 (0.93) 1.06 (0.90)
Drive for Thinness 2.21 (1.39) 2.16 (1.42)
Restraint 5.78 (4.18) 12.53 (6.30)
EAT-26 13.00 (10.27) 12.62 (10.50)
QoL01 2.46 (0.83) 2.38 (0.73)
QoL02 3.88 (4.69) 3.94 (5.40)
QoL03 7.70 (7.80) 6.47 (6.49)
QoL04 2.60 (4.36) 3.09 (4.65)
PILL --- 101.08 (29.38)
Note. “---” indicates that the scale was not measured at that timepoint. OW refers to the
means for those who self-identified as overweight at Time 1. QoL = Quality of Life,
followed by item number.
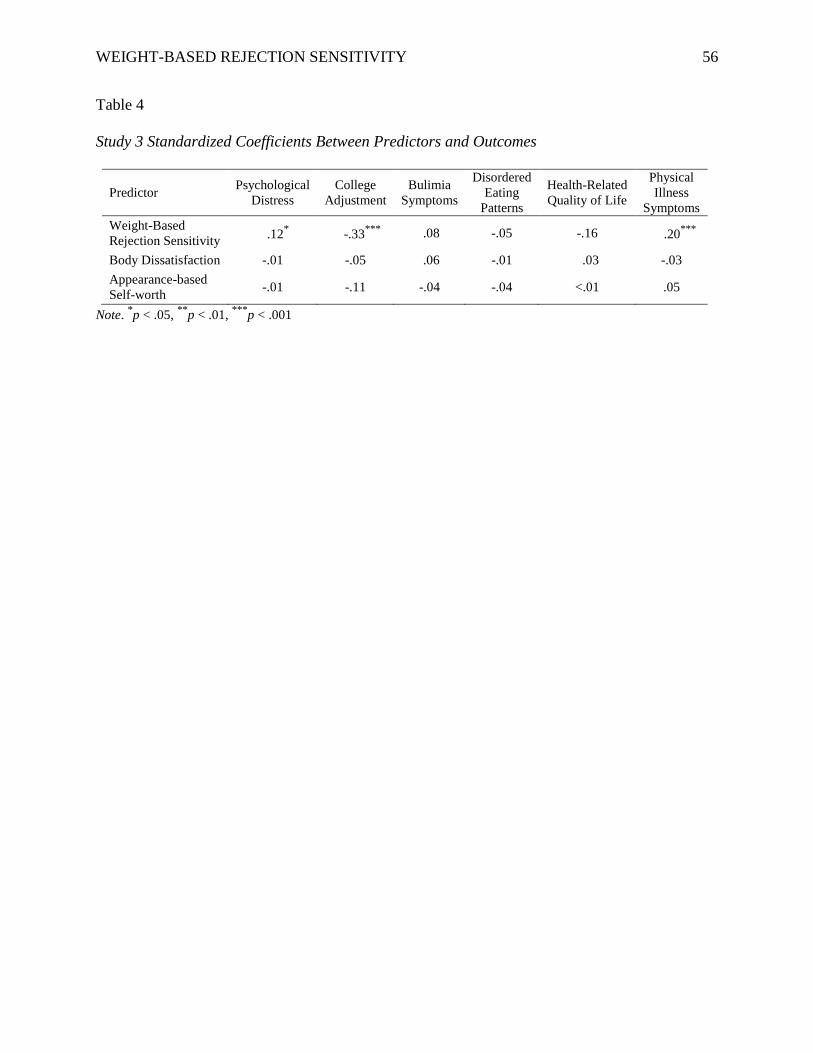
WEIGHT-BASED REJECTION SENSITIVITY 56
Table 4
Study 3 Standardized Coefficients Between Predictors and Outcomes
Predictor Psychological
Distress
College
Adjustment
Bulimia
Symptoms
Disordered
Eating
Patterns
Health-Related
Quality of Life
Physical
Illness
Symptoms
Weight-Based
Rejection Sensitivity .12
* -.33
*** .08 -.05 -.16 .20
***
Body Dissatisfaction -.01 -.05 .06 -.01 .03 -.03
Appearance-based
Self-worth -.01 -.11 -.04 -.04 <.01 .05
Note. *p < .05,
**p < .01,
***p < .001
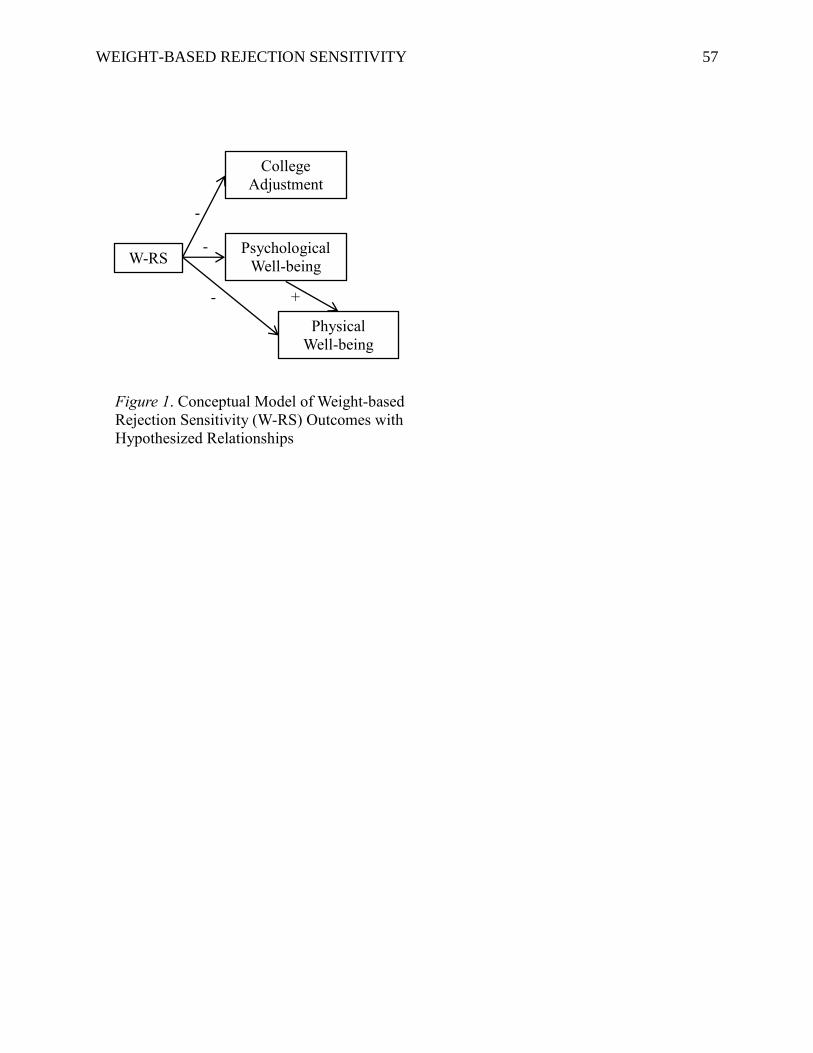
WEIGHT-BASED REJECTION SENSITIVITY 57
W-RS Psychological
Well-being
College
Adjustment
Physical
Well-being
Figure 1. Conceptual Model of Weight-based
Rejection Sensitivity (W-RS) Outcomes with
Hypothesized Relationships
+
-
-
-
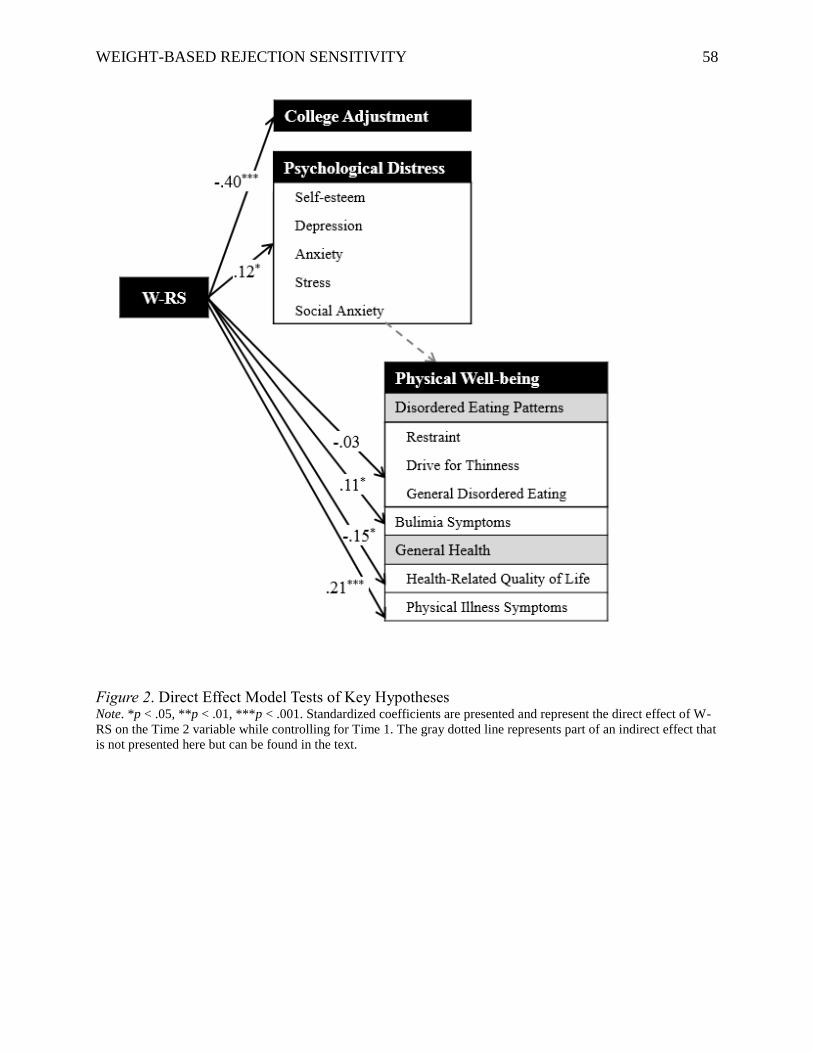
WEIGHT-BASED REJECTION SENSITIVITY 58
Figure 2. Direct Effect Model Tests of Key Hypotheses Note. *p < .05, **p < .01, ***p < .001. Standardized coefficients are presented and represent the direct effect of W-
RS on the Time 2 variable while controlling for Time 1. The gray dotted line represents part of an indirect effect that
is not presented here but can be found in the text.