Embed Size (px)
Citation preview

Computers d Structures Vol. 31, No. 5, pp. 115-781, 1989 Printed in G-eat Britain.
w45-7949189 s3.@3+0.00 0 1989PergamonPnsaplc
WEIGHT-STRENGTH-REDUNDANCY INTERACTION IN OPTIMUM DESIGN OF THREE-DIMENSIONAL
BRITTLE-DUCTILE TRUSSES
DAN M. FRANGOPOL and MAREK KLISINSKI~
Department of Civil Engineering, University of Colorado, Boulder, CO 80309, U.S.A.
(Received 4 February 1988)
Abatraet-The effects of optimi~tion on both reserve strength and redundancy of thr~-dimensional brittle-ductile trusses are demonstrated. The optimum design is defined as the truss of least weight, subject to a prescribed set of side and behavior constraints. The weight-strength-redundancy interaction in optimum design of three-dimensional indeterminate trusses is illustrated with numerical examples of minimum-weight design of a 25-bar space truss having brittle, ductile, or brittle-ductile members.
1. ~RODU~ON
By and large, the methods for structural optimization of three-dimensional systems assume oversimplified models of material behavior: elastic and/or perfectly plastic. However, as shown recently by Klisinski and Frangopol [I], the capability to handle more realistic stress-strain relationships can be important when optimizing structural systems. This paper extends a previously developed optimization program for two- dimensional systems reported in [2] to three-dimen- sional trusses having brittle, ductile, or brittleductile members. The optimum design is defined as the truss of least weight, subject to a prescribed set of side and behavior constraints.
It is the aim of this paper to briefly review the fundamentals of both the constitutive model and the optimization program, to present the definitions of reserve strength, residual strength, redundancy, and damage factors in a concise manner, and to demon- strate the effects of optimization on both the reserve strength and the redundancy of three-dimensional brittle-ductile trusses by means of numerical examples.
2 CONS~UT~E MODEL AND O~MIZATION PROGRAM
Recent work by the authors [l, 21 to obtain opti- mum solutions of plane truss systems will be briefly reviewed in this section.
2.1 ~~~tit~tive modei
In the development of the constitutive model for truss elements the following capabilities have been incorporated: (a) representation of any general stress-strain relation comprised of linear segments; (b) ability to model both softening and hardening
t On leave from Institute of Fundamental Technological Research, Warsaw, Poland.
behavior; and (c) complete description of member behavior in the elastic and postelastic region to failure.
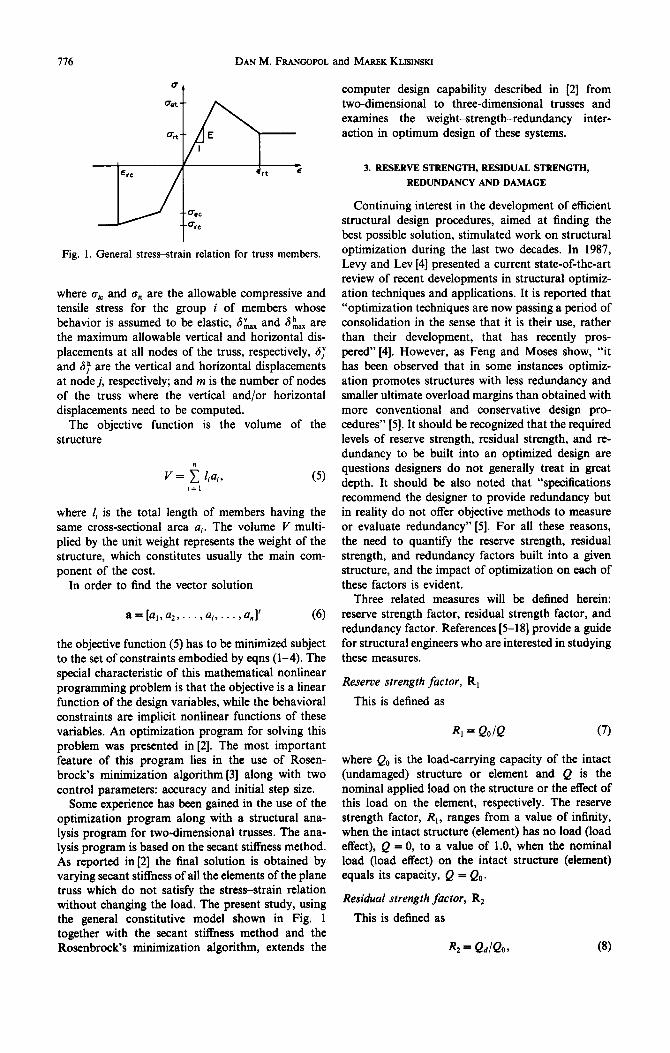
The general stress-strain relation of a truss mem- ber is shown in Fig. 1. It depends on seven parameters as follows: the initial slope E (i.e. modulus of elas- ticity); the tensile and compressive limits of the linear elastic range, a,, and o,, respectively; the residual tensile and compressive stresses, u, and uK, respect- ively; and the strains at which CY,~ and u, are reached,
s, and a,, respectively.
2.2 Upt~rn~zat~~~ program
The structural optimization problem considered in this paper is restricted to the weight minimization of three-dimensional truss systems with fixed geometry and material properties. The cross-sectional and material properties of truss members are assumed to be constant within the entire length of each member. The cross-sectional areas of structural members are the design variables ai, subjected to the side constraints
ai,min G a, < ai,mx; i= ,...,n, 1 (1)
where a;,,,i,, and ai,max are the minimum and maximum allowable member areas and are taken here to be the same for all members: aiTmin = 0.1 in2 and a,,,,= is not limited; and n is the number of group of members having the same cross-sectional area (i.e. any two or more members may be required to be the same throughout the optimization process). The design is required to satisfy stress and displacement constraints as follows:
aiCGuSuit; i=l,,..,n, (2)
]s;/ Q&L,; j=l,...,m, (3)
[S)[<C~;,; j=l,...,m, (4)
716 DAN M. FRANC~P~L and MAREK KLISINSKI
Fig. 1. General stress-strain relation for truss members.
where oic and uit are the allowable compressive and tensile stress for the group i of members whose behavior is assumed to be elastic, SL,, and Sk,, are the maximum allowable vertical and horizontal dis- placements at all nodes of the truss, respectively, SJ and SF are the vertical and horizontal displacements at node j, respectively; and m is the number of nodes of the truss where the vertical and/or horizontal displacements need to be computed.
The objective function is the volume of the structure
V = i &a,, i=l
where 1, is the total length of members having the same cross-sectional area a,. The volume V multi- plied by the unit weight represents the weight of the structure, which constitutes usually the main com- ponent of the cost.
In order to find the vector solution
a=[a,,a, ,..., ai ,..., a,]’ (6)
the objective function (5) has to be minimized subject to the set of constraints embodied by eqns (1-4). The special characteristic of this mathematical nonlinear programming problem is that the objective is a linear function of the design variables, while the behavioral constraints are implicit nonlinear functions of these variables. An optimization program for solving this problem was presented in [2]. The most important feature of this program lies in the use of Rosen- brock’s minimization algorithm [3] along with two control parameters: accuracy and initial step size.
Some experience has been gained in the use of the optimization program along with a structural ana- lysis program for two-dimensional trusses. The ana- lysis program is based on the secant stiffness method. As reported in [2] the final solution is obtained by varying secant stiffness of all the elements of the plane truss which do not satisfy the stress-strain relation without changing the load. The present study, using the general constitutive model shown in Fig. 1 together with the secant stiffness method and the Rosenbrock’s minimization algorithm, extends the
computer design capability described in [2] from two-dimensional to three-dimensional trusses and examines the weight-strength-redundancy inter- action in optimum design of these systems.
3. RESERVE STRENGTH, RESIDUAL STRENGTH, REDUNDANCY AND DAMAGE
Continuing interest in the development of efficient structural design procedures, aimed at finding the best possible solution, stimulated work on structural optimization during the last two decades. In 1987, Levy and Lev [4] presented a current state-of-the-art review of recent developments in structural optimiz- ation techniques and applications. It is reported that “optimization techniques are now passing a period of consolidation in the sense that it is their use, rather than their development, that has recently pros- pered” [4]. However, as Feng and Moses show, “it has been observed that in some instances optimiz- ation promotes structures with less redundancy and smaller ultimate overload margins than obtained with more conventional and conservative design pro- cedures” [5]. It should be recognized that the required levels of reserve strength, residual strength, and re- dundancy to be built into an optimized design are questions designers do not generally treat in great depth. It should be also noted that “specifications recommend the designer to provide redundancy but in reality do not offer objective methods to measure or evaluate redundancy” [5]. For all these reasons, the need to quantify the reserve strength, residual strength, and redundancy factors built into a given structure, and the impact of optimization on each of these factors is evident.
Three related measures will be defined herein: reServe strength factor, residual strength factor, and redundancy factor. References [5-181 provide a guide for structural engineers who are interested in studying these measures.
Reserve strength factor, R,
This is defined as
R, = QolQ (7)
where Q, is the load-carrying capacity of the intact (undamaged) structure or element and Q is the nominal applied load on the structure or the effect of this load on the element, respectively. The reserve strength factor, RI, ranges from a value of infinity, when the intact structure (element) has no load (load effect), Q = 0, to a value of 1.0, when the nominal load (load effect) on the intact structure (element) equals its capacity, Q = Q,.
Residual strength factor, R,
This is defined as
R2 = QcdQo, (8)
Optimum design of t~~~rn~s~onal brittle-ductile trusses
where Q,, is the load-carrying capacity of the dam- aged structure and Q, is the load-carrying capacity of the intact structure.
The residual strength factor, R,, refers to the strength of the system in a damaged condition (for example, after one structural component has failed). This factor ranges from a value of 0, when the damaged structure results in system collapse (Qd = O), to a value of 1.0, when the structural damage has no influence on the load-carrying capacity of the struc-
ture tQd = Qd.
R~d~~du~~~ factor, R
This is defined as
R = l/(1 - R2). (91
The redundancy factor for a structural system, R, ranges from a value of LO, when the damaged structure results in system collapse CR, = 0), to a value of infinity, when the structural damage has no influence on the strength of the system (R2 = 1).
As shown by Frangopol and Curley [I I, 121 the factors, R, , Rt and R are good and objective measures of strength and redundancy of structural systems because they correlate directly with overall system strength for both undamaged (i.e. R,) and damaged (Le. Rz and R) situations.
Damage factor, D
For truss elements, a damage factor D was proposed in [l, 21 as
D = 1 - (a~~~~~, (I@
where ad is the cross-sectional area of the damaged element of the truss and a, is the intact area of this element. The following categories of damage will be used [12]:
(1) “‘slight” member damage = 25% reduction in crass-sectional area;
(2) ‘“moderate” member damage 3 50% reduction in cross-sectional area;
(3) “severe” member damage c 75% reduction in cross-sectional area; and
(4) “complete” member damage= removal of member from the system.
The damage factors associated with these damage categories are as follows:
D = 0.25 for “slight” member damage;
D = 0.50 for “moderate” member damage;
D = 0.75 for “severe” member damage; and
fz = 1.00 for “complete” member damage. (11)
X
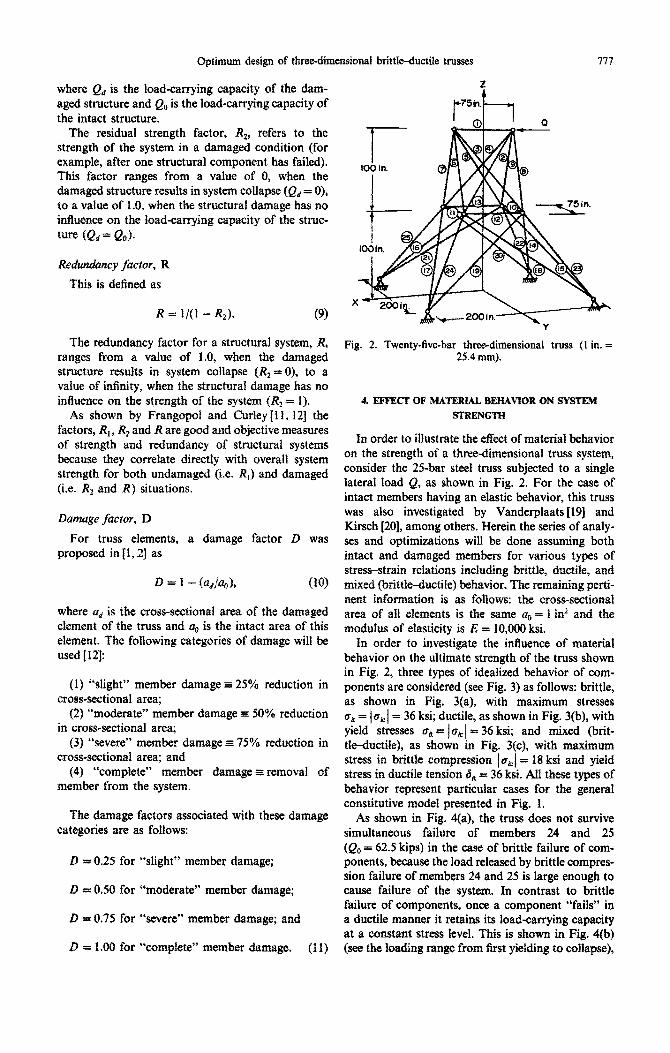
Fig. 2. Twenty-the-bar three-dimensional truss (1 in. = 25.4 mm).
In order to illustrate the effect of material behavior on the strength of a three-dimensional truss system, consider the 25-bar steel truss subjected to a single lateral load Q, as shown in Fig. 2. For the case of intact members having an elastic behavior, this truss was also investigated by Vanderplaats [19] and Kirsch 1201, among others. Herein the series of analy ses and optimizations will be done assuming both intact and damaged members for various types of stress-strain relations including brittle, ductile, and mixed (b~ttl~u~tjl~~ behavior. The remaining perti- nent information is as foltows: the cross-~tion~ area of ah elements is the same a, = I in’ and the modulus of elasticity is E = 10,000 ksi.
In order to investigate the inffuenee of material behavior on the ultimate strength of the truss shown in Fig. 2, three types of idealized behavior of com- ponents are considered (see Fig. 3) as follows: brittle, as shown in Fig. 3(a), with maximum stresses a, = juti/ = 36 ksi; ductile, as shown in Fig. 3(b), with yield stresses 6, = la,/ = 36 ksi; and mixed (brit- tle-ductile), as shown in Fig. 3(c), with maximum stress in brittle compression ] sic/ = 18 ksi and yield stress in ductile tension S, = 36 ksi. All these types of behavior represent particular cases for the genera1 constitutive model presented in Fig. 1.
As shown in Fig. 4(a), the truss does not survive simultaneous failure of members 24 and 25 (QO = 62.5 kips) in the case of brittle failure of com- ponents, because the load released by brittle compres- sion failure of members 24 and 25 is large enough to cause failure of the system. In contrast to brittle failure of components, once a component “fails” in a ductile manner it retains its load-carrying capacity at a constant stress level. This is shown in Fig. 4(b) (see the loading range fram first yielding to coIlapse),

778 DAN M. FRANGOWL and MAREKKLEINSKI
ff (bt
t 36Lsi /
Fig. 3. Idealized behavior of truss members: (a) brittle; (b) ductile; and (c) brittle-ductile (1 ksi = 6890 kPa).
where the members 24 and 2.5 after reaching (compression yielding of members 2 and 4 at their maximum compression capacity at a force Q, = 74.9 kips). Finally, the ductile truss collapses
Q, = 62.5 kips (first yield) retain their maximum load when member 1 yields in compression at a force
until the truss collapses at Q. = 77.3 kips. Two other Q,= 77.3 kips. Figure 4(c) shows the effect of the
significant events are also shown in Fig. 4(b), as applied force Q on the stress in each member of
follows: second yield (tension yielding of members the intact brittle-ductil truss [see Fig. 3(c)]. After
22 and 23 at Q2 = 62.9 kips), and third yield members 24 and 25 fail simultaneously in brittle
AppCied load
22.23
10 6.7
16,1?
Olkipd - -40 1 I I 1 ’ 1 ’ ’ J
0 ,O 20 30 40 60 60 70 60 60
0 Ikipd ‘24&J -20 1 I I I
0 S 10 IS 20 26 30 56
Applied load
Fig. 4. Twenty-five-bar initial intact truss. Members stress vs applied load: (a) brittle; (b) ductile; and (c) brittle-ductile behavior (1 kip = 4.45 kN; 1 ksi = 6890 kPa).
Optimum design of three-dimensional brittfe-ductile trusses 779
compression the released load is large enough to cause failure of the system without redistribution at Q. = 31.3 kips. This example indicates that the ductile truss [Fig. 3(b)] has an increase in ultimate load capacity compared with the brittle [Fig. 3(a)] and brittle+ductile [Fig. 3(c)] trusses of 24 and 147%, respectively. As was expected, the truss whose mem- bers are brittle in compression with 36 ksi allowable stress [Fig. 3(a)] has an increase in ultimate load- carrying capacity compared with the truss whose members are also brittle in compression but with only 18 ksi allowable stress [Fig. 3(c)] of 100%.
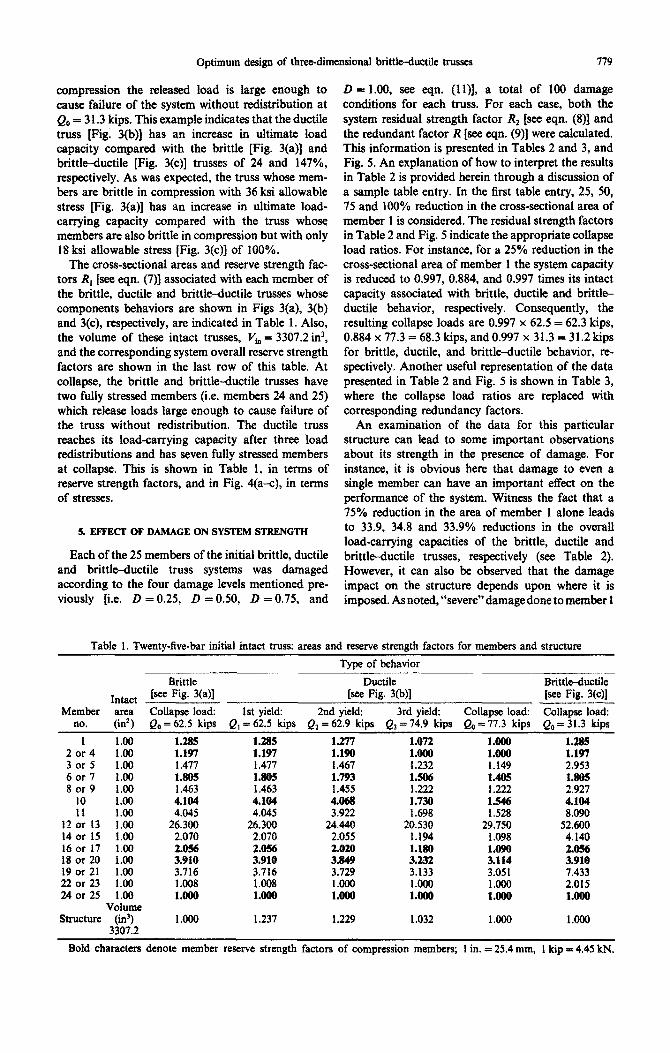
The cross-sectional areas and reserve strength fac- tors R, [see eqn. (7)] associated with each member of the brittle, ductile and brittle-ductile trusses whose components behaviors are shown in Figs 3(a), 3(b) and 3(c), respectively, are indicated in Table 1. Also, the volume of these intact trusses, V, = 3307.2 in3, and the corresponding system overall reserve strength factors are shown in the last row of this table. At collapse, the brittle and brittle-ductile trusses have two fully stressed members (i.e. members 24 and 25) which release loads large enough to cause failure of the truss without redistribution. The ductile truss reaches its load-carrying capacity after three load r~ist~butions and has seven fully stressed members at collapse. This is shown in Table 1, in terms of reserve strength factors, and in Fig. 4(a-c), in terms of stresses.
5. EFFECT OF DAMAGE ON SYSTEM STRENGTH
Each of the 25 members of the initial brittle, ductile and brittle-ductile truss systems was damaged according to the four damage levels mentioned pre- viously [i.e. D =0.25, D =OSO, D =0.75, and
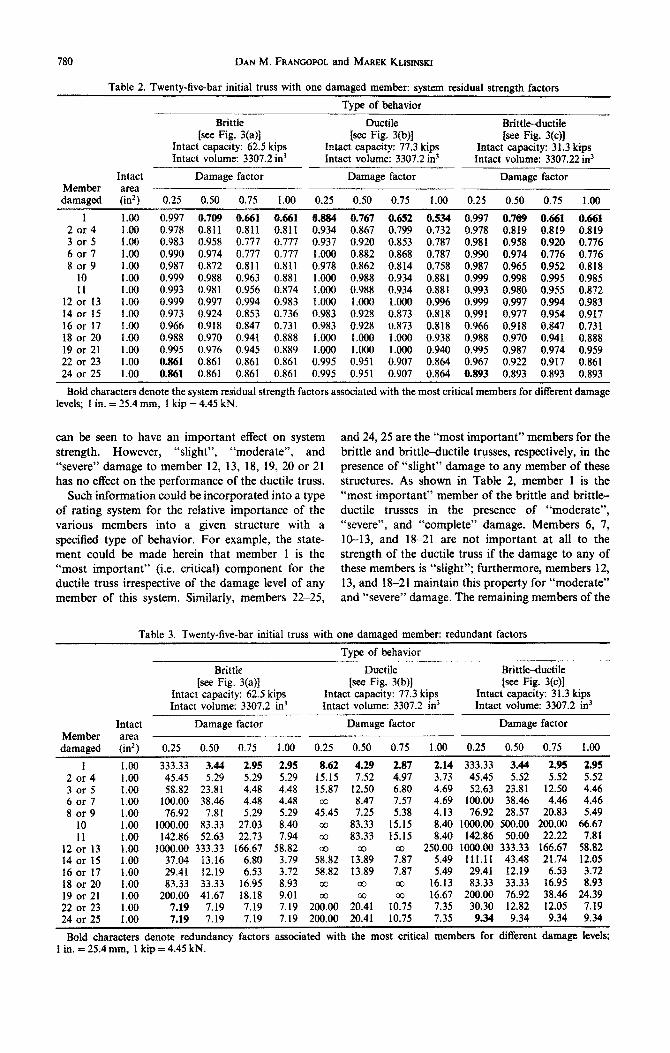
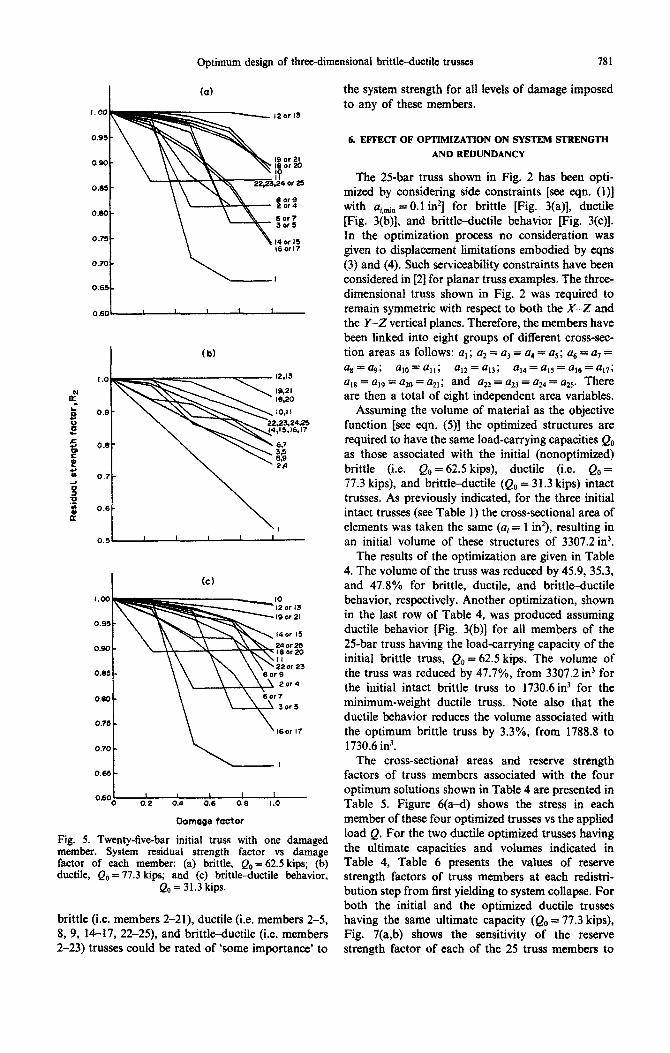
D = 1.00, see eqn. (1 I)], a total of 100 damage conditions for each truss. For each case, both the system residual strength factor R, [see eqn. (8)] and the redundant factor R [see eqn. (9)] were calculated. This information is presented in Tables 2 and 3, and Fig. 5. An explanation of how to interpret the results in Table 2 is provided herein through a discussion of a sample table entry. In the first table entry, 25, 50, 75 and 100% reduction in the cross-sectional area of member 1 is considered. The residual strength factors in Table 2 and Fig. 5 indicate the appropriate collapse load ratios. For instance, for a 25% reduction in the cross-sectional area of member 1 the system capacity is reduced to 0.997, O.SM, and 0.997 times its intact capacity associated with brittle, ductile and brittle ductile behavior, respectively. Consequently, the resulting collapse loads are 0.997 x 62.5 = 62.3 kips, 0.884 x 77.3 = 68.3 kips, and 0.997 x 31.3 = 31.2 kips for brittle, ductile, and brittle-ductile behavior, re- spectively. Another useful representation of the data presented in Table 2 and Fig. 5 is shown in Table 3, where the collapse load ratios are replaced with corresponding redundancy factors.
An examination of the data for this particular structure can lead to some important observations about its strength in the presence of damage. For instance, it is obvious here that damage to even a single member can have an important effect on the performance of the system. Witness the fact that a 75% reduction in the area of member 1 alone leads to 33.9, 34.8 and 33.9% reductions in the overall load-carrying capacities of the brittle, ductile and brittle-ductile trusses, respectively (see Table 2). However, it can also be observed that the damage impact on the structure depends upon where it is imposed. As noted, “severe” damage done to member 1
Table 1. Twenty-five-bar initial intact truss: areas and reserve strength factors for members and structure
Type of behavior
Brittle Ductile Brittle-ductile Tntact [see Fig. WI [see Fig. 3(b)] [see Fig. 3(c)]
Member area Collapse load: 1st yield: 2nd yield: 3rd yield: Collapse load: Collapse load: no. (in2) Q, = 62.5 kips Q , = 62.5 kips Q, = 62.9 kips Q, = 74.9 kips Q, = 77.3 kips Q, = 31.3 kips
1 1.00 1.285 1.285 1.277 1.072 l.tNUl 1.285 2or4 1.80 1.197 1.197 1.190 1.000 1.000 1.197 3 or 5 1.00 1.477 I .477 1.467 1.232 1.149 2.953 6 or 7 1.00 1.8OS 1.8OS 1.793 1.506 1.405 1.805 8or9 1.00 1.463 I .463 1.455 1.222 1.222 2.927
10 1.00 4.104 dlQ4 4.868 1.730 1.546 4.104 11 1.00 4.045 4.045 3.922 1.698 1.528 8.090
12 or 13 1.00 26.308 26.308 24.440 20.530 29.750 52600 14 or 15 1.00 2.070 2.070 2.055 1.194 1.098 4.140 16 or 17 1.00 2.056 18 or 20 1.00 3.910 ;:ZZ
2.028 1.180 1.090 3.849 3.232 3.114 :zz
19 or 21 1.00 3.716 8.716 3.729 3.133 3.051 7.433 22 or 23 1.00 1.008 1.008 1.000 1.008 1.000 2.015 24or25 1.00 1.008 1.008 1.008 1.000 1.000 1.000
Volume Structure (in’) 1.000 1.237 1.229 1.032 1.000 1.000
3307.2
Bold characters denote member reserve strength factors of compression members; 1 in. = 25.4 mm, 1 kip = 4.45 kN.
780 DAN M. FRANCOPOL and MAREK KLWNSKI
Table 2. Twenty-five-bar initial truss with one damaged member: system residual strength factors
Type of behavior
Brittle Ductile Brittleductile [see Fig. 3(a)] [see Fig. 3(b)] [see Fig. 3(c)]
Intact capacity: 62.5 kips Intact capacity: 77.3 kips Intact volume: 3307.2 in3 Intact volume: 3307.2 in3
Intact capacity: 31.3 kips Intact volume: 3307.22 in3
Intact Damage factor Damage factor Damage factor Member area damaged (in2) 0.25 0.50 0.75 1.00 0.25 0.50 0.75 1.00 0.25 0.50 0.75 1.00
1 1.00 0.997 0.709 0.661 0.461 0.884 0.767 0.652 0.534 0.997 0.709 0.661 0.661 2 or 4 1.00 0.978 0.811 0.811 0.811 0.934 0.867 0.799 0.732 0.978 0.819 0.819 0.819 3 or 5 1 .oo 0.983 0.958 0.777 0.777 0.937 0.920 0.853 0.787 0.981 0.958 0.920 0.776 6or7 1.00 0.990 0.974 0.777 0.777 1.000 0.882 0.868 0.787 0.990 0.974 0.776 0.776 8 or 9 1.00 0.987 0.872 0.811 0.811 0.978 0.862 0.814 0.758 0.987 0.965 0.952 0.818
t: 1.00 1.00 0.993 0.999 0.988 0.981 0.963 0.956 0.881 0.874 1.000 1.000 0.988 0.988 0.934 0.934 0.881 0.881 0.999 0.993 0.998 0.980 0.955 0.995 0.985 0.872 12 or I3 1.00 0.999 0.997 0.994 0.983 1.000 l.ooO 1.000 0.996 0.999 0.997 0.994 0.983 14 or 15 1.00 0.973 0.924 0.853 0.736 0.983 0.928 0.873 0.818 0.991 0.977 0.954 0.917 16 or 17 1.00 0.966 0.918 0.847 0.731 0.983 0.928 0.873 0.818 0.966 0.918 0.847 0.731 18 or 20 1.00 0.988 0.970 0.941 0.888 1.000 1.000 1.000 0.938 0.988 0.970 0.941 0.888 19 or 21 1.00 0.995 0.976 0.945 0.889 1.000 1.000 1.000 0.940 0.995 0.987 0.974 0.959 22or23 1.00 0.861 0.861 0.861 0.861 0.995 0.951 0.907 0.864 0.967 0.922 0.917 0.861 24 or 25 1.00 0.861 0.861 0.861 0.861 0.995 0.951 0.907 0.864 0.893 0.893 0.893 0.893
Bold characters denote the system residual strength factors associated with the most critical members for different damage levels; I in. = 25.4 mm, 1 kip = 4.45 kN.
can be seen to have an important effect on system strength. However, “slight”, “moderate”, and “severe” damage to member 12, 13, 18, 19, 20 or 21 has no effect on the performance of the ductile truss.
Such info~ation could be inco~orated into a type of rating system for the relative importance of the various members inta a given structure with a specified type of behavior. For example, the state- ment could be made herein that member 1 is the “most important” (i.e. critical) component for the ductile truss irrespective of the damage level of any member of this system. Similarly, members 22-25,
and 24,25 are the “most important” members for the brittle and brittle-ductile trusses, respectively, in the presence of “slight” damage to any member of these structures. As shown in Table 2, member 1 is the “most important” member of the brittle and brittle- ductile trusses in the presence of “moderate”, “severe”, and “complete” damage. Members 6, 7, 10-13, and l&21 are not important at all to the strength of the ductile truss if the damage to any of these members is “slight”; furthermore, members 12, 13, and 18-21 maintain this property for “moderate” and “severe” damage. The remaining members of the
Table 3. Twenty-five-bar initial truss with one damaged member: redundant factors
Type of behavior
Brittle Ductile Brittle-ductile [see Fig. 3(a)] [see Fig. 3(b)] [see Fig. 3(c)]
Intact capacity: 62.5 kips Intact capacity: 77.3 kips Intact capacity: 3 1.3 kips Intact volume: 3307.2 in’ Intact volume: 3307.2 in3 Intact volume: 3307.2 in3
Intact Damage factor Damage factor Damage factor Member area damaned (in*) 0.25 0.50 0.75 1 .oo 0.25 0.50 0.75 1 .oo 0.25 0.50 0.75 1.00
1 1.00 2or4 1.00 3or5 1.00 6 or 7 1.00 8 or 9 1 .oo
t; 1 1.00 .oo
12 or 13 1 .oo 14 or 15 1.00 16 or 17 1.00 18 or 20 1 .oo 19 or 21 1.00 22 or 23 1.00
333.33 3.44 2.95 2.95 45.45 5.29 5.29 5.29 58.82 23.81 4.48 4.48
100.00 38.46 4.48 4.48 76.92 7.81 5.29 5.29
1000.00 83.33 27.03 8.40 142.86 52.63 22.73 7.94
1000.00 333.33 166.67 58.82 37.04 13.16 6.80 3.79 29.41 12.19 6.53 3.72 83.33 33.33 16.95 8.93
200.00 41.67 18.18 9.01 7.19 7.19 7.19 7.19
8.62 15.15 15.87
4:45 aJ co
5282 58.82 co
2zo.00
4.29 7.52
12.50 8.47 7.25
83.33 83.33
1359 13.89
a,
203341
2.87 2.14 333.33 3.44 2.95 4.97 3.73 45.45 5.52 5.52 6.80 4.69 52.63 23.81 12.50 7.57 4.69 100.00 38.46 4.46 5.38 4.13 76.92 28.57 20.83
15.15 8.40 1000.00 500.00 200.00 15.15 8.40 142.86 50.00 22.22
7:7 250.00 1000.00 333.33 166.67
5.49 111.11 43.48 21.74 7.87 5.49 29.41 12.19 6.53 al 16.13 83.33 33.33 16.95
10;s 16.67 200.00 76.92 38.46 7.35 30.30 12.82 12.05
2.95 5.52 4.46 4.46 5.49
66.67 7.81
58.82 12.05 3.72 8.93
24.39 7.19
24 or 25 1 .oo 7.19 7.19 7.19 7.19 200.00 20.41 10.75 7.35 9.34 9.34 9.34 9.34
Bold characters denote redundancy factors associated with the most critical members for different damage levels; 1 in. = 25.4 mm, 1 kip = 4.45 kN.
Optimum design of three-dimensional brittle-ductile trusses 781
(b)
0.70
0.66 I 0601
0 0.2 0.4 0.6 0.2 I.0
Damage factor
Fig. 5. Twenty-five-bar initial truss with one damaged member. System residual strength factor vs damage factor of each member: (a) brittle, Q,=62.5 kips; (b) ductile, Q, = 77.3 kips; and (c) brittle-ductile behavior,
Q, = 31.3 kips.
brittle (i.e. members 2-21), ductile (i.e. members 2-5, 8, 9, 14-17, 22-25), and brittle-ductile (i.e. members 2-23) trusses could be rated of ‘some importance’ to
the system strength for all levels of damage imposed to any of these members.
6. EFFECT OF OPTIMIZATION ON SYSTEM STRENGTH AND REDUNDANCY
The 25-bar truss shown in Fig. 2 has been opti- mized by considering side constraints [see eqn. (l)] with aimin = 0.1 ir?] for brittle [Fig. 3(a)], ductile [Fig. 3(b)], and brittle-ductile behavior [Fig. 3(c)]. In the optimization process no consideration was given to displacement limitations embodied by eqns (3) and (4). Such affability constraints have been considered in [Z] for planar truss examples. The three- dimensional truss shown in Fig. 2 was required to remain symmetric with respect to both the X-2 and the Y-Z vertical planes. Therefore, the members have been linked into eight groups of different cross-sec- tion areas as follows: a, ; a, = a3 = a, = as; a, = a, =
a, = a,; alo=%l; a,2 = 43; a14 = a,5 = a16 = a,7;
al8 = u,~ = uzo = a,,; and a22 = az3 = a24 = az5. There are then a total of eight independent area variables.
Assuming the volume of material as the objective function [see eqn. (511 the optimized structures are required to have the same load-carrying capacities Q. as those associated with the initial (nonoptimi~) brittle (i.e. Q, = 62.5 kips), ductile (i.e. Q. = 77.3 kips), and brittle-ductile (Q, = 31.3 kips) intact trusses. As previously indicated, for the three initial intact trusses (see Table I) the cross-sectional area of elements was taken the same (ai = 1 in2), resulting in an initial volume of these structures of 3307.2in3.
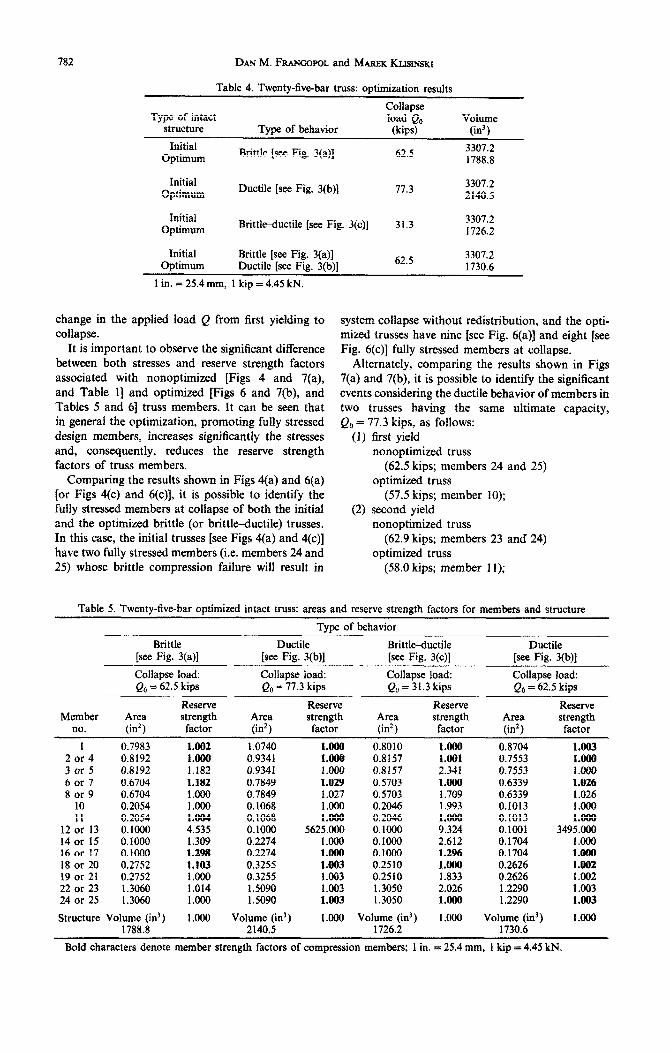
The results of the optimization are given in Table 4. The volume of the truss was reduced by 45.9, 35.3, and 47.8% for brittle, ductile, and brittle-ductile behavior, respectively. Another optimization, shown in the last row of Table 4, was produced assuming ductile behavior [Fig. 3(b)] for all members of the 25-bar truss having the load-carrying capacity of the initial brittle truss, Q, = 62.5 kips. The volume of the truss was reduced by 47.7%, from 3307.2in3 for the initial intact brittle truss to 1730.6 in3 for the minimum-weight ductile truss. Note also that the ductile behavior reduces the volume associated with the optimum brittle truss by 3.3%, from 1788.8 to 1730.6 in3.
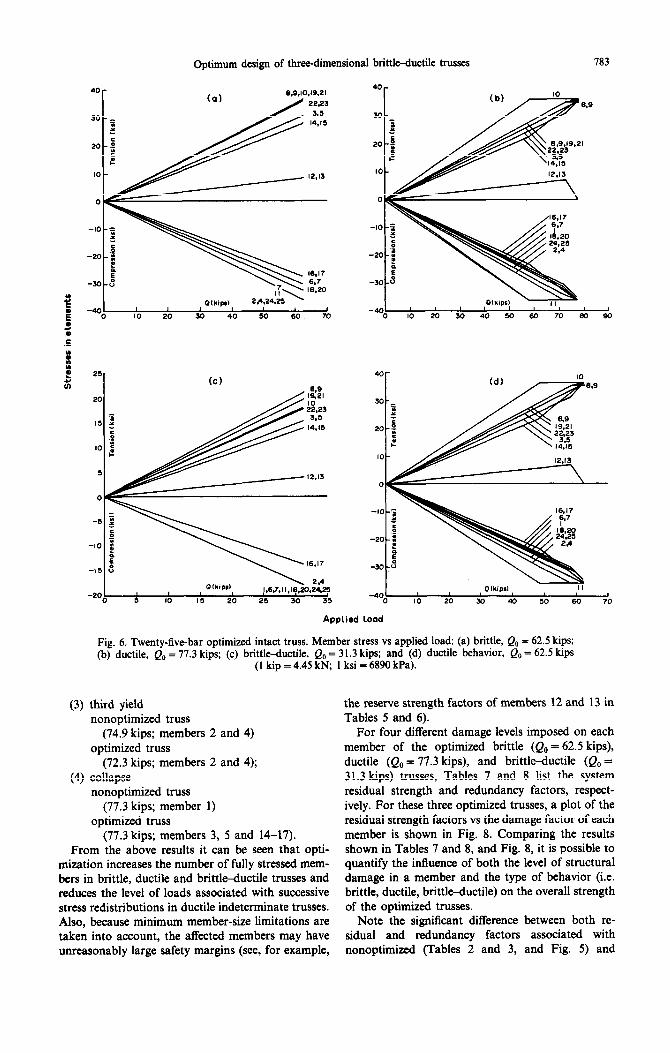
The cross-sectional areas and reserve strength factors of truss members associated with the four optimum solutions shown in Table 4 are presented in Table 5. Figure 6(a-d) shows the stress in each member of these four optimized trusses vs the applied load Q. For the two ductile optimized trusses having the ultimate capacities and volumes indicated in Table 4, Table 6 presents the vaiues of reserve strength factors of truss members at each redistri- bution step from first yielding to system collapse. For both the initial and the optimized ductile trusses having the same ultimate capacity (Q,, = 77.3 kips), Fig. 7(a,b) shows the sensitivity of the reserve strength factor of each of the 25 truss members to
782 DAN M. FRANGOPOL and MAREK KLISINSKI
Table 4. Twenty-five-bar truss: optimization results
Collapse Type of intact load 0, Volume
structure
Initial Optimum
Type of behavior
Brittle [see Fig. 3(a)]
-” (kips)
62.5
(in3)
3307.2 1788.8
Ductile [see Fig. 3(b)] 17.3
B~ttI~uctile [see Fig. 3(c)] 31.3
Initial Optimum
Initial Optimum
3307.2 2140.5
3307.2 1726.2
Initial Brittle [see Fig. 3(a)] Optimum Ductile [see Fig. 3(b)] 62.5 3307.2
1730.6
1 in. = 25.4 mm, 1 kip = 4.45 kN.
change in the applied load Q from first yielding to collapse.
It is important to observe the significant difference between both stresses and reserve strength factors associated with nonoptimized [Figs 4 and 7(a), and Table i] and optimized [Figs 6 and 7(b), and Tables 5 and 61 truss members. It can be seen that in general the optimization, promoting fully stressed design members, increases significantly the stresses and, consequently, reduces the reserve strength factors of truss members.
Comparing the results shown in Figs 4(a) and 6(a) [or Figs 4(c) and 6(c)], it is possible to identify the fully stressed members at collapse of both the initial and the optimized brittle (or brittle-ductile) trusses. in this case, the initial trusses [see Figs 4(a) and 4(c)] have two fully stressed members (i.e. members 24 and 25) whose brittle compression failure will result in
system collapse without redist~bution, and the opti- mized trusses have nine [see Fig. 6(a)] and eight [see Fig. 6(c)] fully stressed members at collapse.
Alternately, comparing the results shown in Figs 7(a) and 7(b), it is possible to identify the significant events considering the ductile behavior of members in two trusses having the same ultimate capacity, Q. = 77.3 kips, as follows:
(1) first yield nonoptimized truss
(62.5 kips; members 24 and 25) optimized truss
(57.5 kips; member 10); (2) second yield
nonoptimized truss (62.9 kips; members 23 and 24)
optimized truss (58.0 kips; member I I);
Table 5. Twenty-five-bar optimized intact truss: areas and reserve strength factors for members and structure
Type of behavior
Brittle Ductile Brittle-ductile Ductile [see Fig. 3(a)] [see Fig. 3(b)] [see Fig. 3(c)] [see Fig. 3(b)]
Collapse load: Collapse load: Collapse load: Collapse load: Q, = 62.5 kips Q, = 77.3 kips Q,= 31.3 kips Q0 = 62.5 kips
Reserve Reserve Reserve Reserve Member Area strength Area strength Area strength Area strength
no. (in’) factor (in2) factor (in2) factor (in’) factor
1 0.7983 1.002 1.0740 1.000 0.8010 1,000 0.8704 1.003 2 or 4 0.8192 i.ooo 0.9341 l.ooo 0.8157 1.001 0.7553 1.000 3 or 5 0.8192 1.182 0.9341 ::g 0.8157 2.341 0.7553 1.000 6 or 7 0.6704 1.182 0.7849 0.5703 1.000 0.6339 1.026 8 or 9 0.6704 1.000 0.7849 1.027 0.5703 1.709 0.6339 1.026
10 0.2054 1.000 0.1068 1.000 0.2046 1.993 0.1013 1.000 11 0.2054 1.004 0.1068 1.000 0.2046
12 or 13 0.1000 4.535 0.1000 5625.000 0.1000 ;E 0.1013 l.ooO 0.1001 3495.000
14 or 15 0.1000 1.309 0.2274 1.000 0.1000 21612 0.1704 1.000 16 or 17 0.1000 1.298 0.2274 1.000 0.1000 1.2% 0.1704 1.ooo 18 or 20 0.2752 1.103 0.3255 1.003 0.2510 1.000 0.2626 1.002 19 or 21 0.2752 1.000 0.3255 1.003 0.2510 1.833 0.2626 I .#2 22 or 23 1.3060 1.014 1 so90 1.003 1.3050 2.026 1.2290 1.003 24 or 25 1.3060 1.000 1.5090 1.003 1.3050 1.000 1.2290 1.003
Structure Volume (in)) I .ooo Volume (in’) 1.000 Volume (in’) 1.000 Volume (in3) 1.000 1788.8 2140.5 1726.2 1730.6
Bold characters denote member strength factors of compression members; 1 in, = 25.4 mm, 1 kip = 4.45 kN.
Optimum design of three-dimensional brittle-ductile trusses 783
0 10 20 30 40 SO 60 m
,I -40 I I I 1 I I ,
0 10 20 30 40 so 60 70 80 90
Applied load
Fig. 6. Twenty-five-bar optimized intact truss. Member stress vs applied load: (a) brittle, Q,, = 62.5 kips; (b) ductile, Q0 = 77.3 kips; (c) brittleductile, Q. = 31.3 kips; and (d) ductile behavior, Q, = 62.5 kips
(1 kip = 4.45 kN; 1 ksi = 6890 kPa).
(3) third yield the reserve strength factors of members 12 and 13 in nonoptimized truss Tables 5 and 6).
(74.9 kips; members 2 and 4) optimized truss
(72.3 kips; members 2 and 4); (4) collapse
nonoptimized truss (77.3 kips; member 1)
optimized truss (77.3 kips; members 3, 5 and 14-17).
From the above results it can be seen that opti- mization increases the number of fully stressed mem- bers in brittle, ductile and brittle-ductile trusses and reduces the level of loads associated with successive stress redistributions in ductile indeterminate trusses. Also, because minimum member-size limitations are taken into account, the affected members may have unreasonably large safety margins (see, for example,
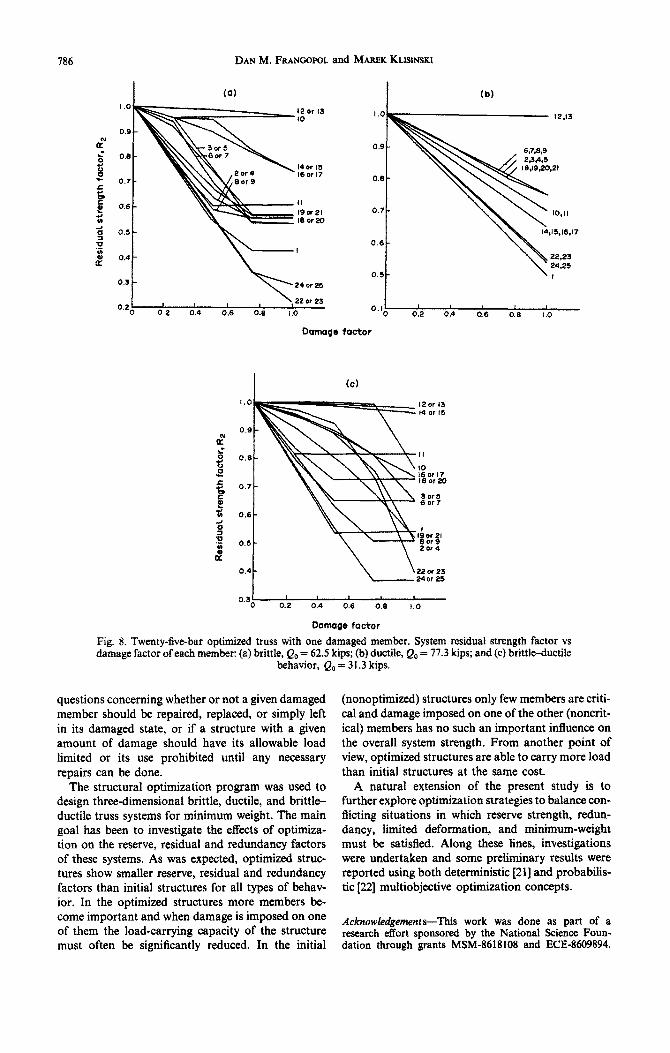
For four different damage levels imposed on each member of the optimized brittle (Q, = 62.5 kips), ductile (Q,, = 77.3 kips), and brittltiuctile (Q, = 31.3 kips) trusses, Tables 7 and 8 list the system residual strength and redundancy factors, respect- ively. For these three optimized trusses, a plot of the residual strength factors vs the damage factor of each member is shown in Fig. 8. Comparing the results shown in Tables 7 and 8, and Fig. 8, it is possible to quantify the influence of both the level of structural damage in a member and the type of behavior (i.e. brittle, ductile, brittle-ductile) on the overall strength of the optimized trusses.
Note the significant difference between both re- sidual and redundancy factors associated with nonoptimized (Tables 2 and 3, and Fig. 5) and

784 DAN M. FRANGOPOL and MAREK KLISNSKI
Table 6. Twenty-five-bar optimized intact ductile truss: reserve strength factors for members and structure at different loading levels
Type of behavior
Member no.
1
Ductile Ductile [see Fig. 3(b)] [see Fig. 3(b)]
Intact capacity: 77.3 kips Intact capacity: 62.5 kips Intact volume: 2140.5 in3 Intact volume: 1730.6 in3
1st yield: 2nd yield: 3rd yield: Collapse: 1st yield: 2nd yield: 3rd yield: Collapse: Q, = Q*= Q, = Q,= Q, = Q*= Q,= QO =
57.5 kips
IA48
58.0 kips
1.435
72.3 kips
1.149
77.3 kips 48.3 kips 48.7 kips 58.2 kips 62.5 kips
l&O@ 1.398 1.388 1.159 1.083 2 or 4 1.255 1.244 1.000 l.ooo 1.205 3 or 5 1.448 1.435 1.149 1.000 1.395 6 or 7 1.486 I.473 1.180 1.029 1.430 8 or 9 1.288 I .278 1.027 1.027 1.236
10 1 .oOO 1.000 1.000 1.000 l.ooo 11 1.009 1.000 1.000 1.000 1.007
12 or 13 6.192 6.132 5.055 5625.000 6.601 14 or 15 1.575 1.552 1.102 1.000 1.535 16 or 17 1.566 1.552 1.102 1.000 1.527 18 or 20 1.415 1.402 1.124 1.003 1.352 19 or 21 1.290 1.279 1.028 1.003 1.244 22 or 23 1.336 1.325 1.077 1.003 1.284 24 or 25 1.318 1.307 1.061 1.003 1.268
1.1% 1.384 1.420 1.227 1.000
zz 1:515 1.515 1.342 1.235 1.275 1.259
I.888 1.000 1.156 l.ooo 1.186 1.026 I.026 1.026 1.000 1.000 1.000 1.000 5.493 3495,ooo 1.116 1.000 1.116 1.000 1.121 1.002 1.032 1.002 1.078 1.003 1.064 1.003
Structure 1.344 1.333 1.069 1.000 1‘294 1.283 1.074 l.ooo
Bold characters denote reserve strength factors of compression members; 1 in. = 25.4 mm; 1 kip = 4.45 kN.
optimized (Tables 7 and 8, and Fig. 8) trusses. From the results, it follows that if damage conditions will occur over the desired lifetime of a system, optimized systems have less residual strength and redundancy than obtained with current (nonoptimization) design procedures. For instance, “complete” damage con- ditions imposed on members 24 or 25 (i.e. removal of member 24 or 25 from the truss) will result in a reduction of the load-carrying capacity of the non- optimized brittle, ductile, and brittl~uctile trusses of 13.9, 13.6 and 10.7%, respectively (see Table 2). Alternately, “complete” damage conditions imposed
4.2) I ¶t yiotd (a) collclpso
I aikipd
o'5M 60 65 d 70 73 80 9s 1
Applied load
on members 24 or 25 will result in a reduction of the load-carrying capacity of the optimized brittle, ductile, and brittle-ductile trusses of 71.2, 46.1 and 63.2%, respectively (see Table 7).
Lastly, it is important to note that damage con- ditions imposed on members 12 or 13 have a neg- ligible (say, <5X) influence on the collapse loads associated with the optimized intact trusses having brittle, ductile, and brittle-ductile behavior. The explanation is due to the inco~oration of mini- mum member size constraints in the optimization process.
PIllpr~ 0 I 1 I 60 33 60 65 70 76
Applied load
Fig. 7. Twenty-five-bar intact ductile truss. Member reserve strength factor vs applied load: (a) initial structure, Q, = 77.3 kips; and (b) optimized structure, Q, = 77.3 kips (1 kip = 4.45 kN).

Optimum design of three-dimensional brittle-ductile trusses 785
Table 7. Twenty-five-bar optimized truss with one damaged element: system residual strength factors
Type of behavior
Brittle [see Fig. 3(a)]
Intact capacity: 62.5 kips Intact volume: 1788.8 in’
Ductile [see Fig. 3(b)]
Intact capacity: 77.3 kips Intact volume: 2140.5 in’
Brittle-ductile [see Fig. 3(c)]
Intact capacity: 31.3 kips Intact volume: 1726.2 in3
Member Damage factor Damage factor Damage factor
damaged 0.25 0.50 0.75 1.00 0.25 0.50 0.75 1.00 0.25 0.50 0.75 1.00
1 0.772 0.543 0.423 0.423 0875 0.749 0.625 0.499 0.770 0.539 0.539 0.539 2 or 4 0.818 0.637 0.553 0.553 0.937 0.875 0.812 0.749 0.815 0.630 0.509 0.509 3 or 5 0.957 0.752 0.537 0.533 0.937 0.8’75 0.812 0.749 0.959 0.900 0.810 0.650 6 or 7 0.940 0.699 0.533 0.533 0.942 0.877 0.8 14 0.749 0.801 0.650 0.650 0.650 8 or 9 0.796 0.591 0.553 0.553 0.942 0.871 0.814 0.749 0.955 0.889 0.754 0.509
10 0.959 0.959 0.959 0.959 0.925 0.850 0.776 0.701 0999 0.998 0.991 0.762 11 0.780 0.607 0.607 0.607 0.925 0.850 0.776 0.701 0.815 0.815 0.815 0.815
12 or 13 0.994 0.986 0.974 0.959 1.000 1.000 0.999 0.997 0.997 0.993 0.987 0.978 14 or 15 0.959 0.948 0.820 0.738 0.912 0.824 0.736 0.648 0.994 0.987 0.976 0.961 16 or 17 0.955 0.896 0.813 0.738 0.912 0.824 0.736 0.648 0.951 0.893 0.809 0.734 18 or 20 0.922 0.741 0.563 0.563 0.939 0.876 0.801 0.750 0.839 0.727 0.727 0.727 19 or 21 0.836 0.672 0.567 0.567 0.939 0.876 0.801 0.750 0.911 0.804 0.676 0.518 22 or 23 0.790 0.565 0.341 0.215 0.889 0.775 0.662 0.546 0.972 0.926 0.729 0.396 24 or 25 0.779 0.557 0.336 0.288 0.887 0.772 0.656 0.539 0.778 0.555 0.368 0.368
Bold characters denote system residual strength factors associated with the most critical members for different damage levels; 1 in. = 25.4 mm; t kip = 4.45 kN.
7. CONCLUSIONS
A general constitutive model, a nonlinear struc- tural analysis capability, and an optimization pro- gram developed in previous theoretical work [I, 21 have been combined to form a tool for efficient design of three-dimensional trusses having brittle, ductile, or brittle-ductile behavior. In this context, the concepts of reserve strength, residual strength and redundancy factors have been presented.
The structural analysis capability was used to study the effects of material behavior and damage on the
overall system strength of three-dimensional trusses. The goal has been to show how damage studies can be performed for brittle, ductile and brittleductile systems to identify members that are critical to the integrity of a structure and should be given consider- ation in adopting special design and inspection strat- egies. For instance, members identified as critical could be subjected to more rigid design and inspec- tion requirements. Furthermore, the data from dam- age studies could also provide guidance during inspections as to how damaged structures must be repaired. Such info~ation could help in answering
Table 8. Twenty-five-bar optimized truss with one damaged element: redundancy factors
Type of behavior
Brittle [see Fig. 3(a)]
Intact capacity: 62.5 kips Intact volume: 1788.8 in3
Ductile [see Fig. 3(b)]
Intact capacity: 77.3 kips Intact volume: 2140.5 in’
Brit~~uctile [see Fig. 3(c)]
Intact capacity: 31.3 kips Intact volume: 1726.2 in3
Member Damage factor Damage factor Damage factor
damaged 0.25 0.50 0.75 1.00 0.25 0.50 0.75 1.00 0.25 0.50 0.75 1.00
1 4.39 2.19 1.73 1.73 8.80 3.98 2.67 2.80 4.35 2.17 2.17 2.17 2 or 4 5.49 2.75 2.24 2.24 15.87 8.00 5.32 3.98 5.41 2.70 2.04 2.04 3 or 5 23.26 4.03 2.16 2.14 15.87 8.00 5.32 3.98 24.39 10.00 5.26 2.86 6 or 7 16.67 3.32 2.14 2.14 17.24 8.13 5.38 3.98 5.03 2.86 2.86 2.86 8 or 9 4.90 2.44 2.24 2.24 17.24 8.13 5.38 3.98 22.22 9.01 4.07 2.04
:‘: 24.39 4.55 24.39 2.54 24.39 2.54 24.39 2.54 13.33 13.13 6.67 6.67 4.46 4.46 3.34 3.34 1000.00 5.41 500.00 5.41 111.11 5.41 4.20 5.41 12 or 13 166.67 71.43 38.46 24.39
Il:6 5% 1WO.00 333.33 333.33 142.86 76.92 45.45
14 or 15 24.39 19.23 5.56 3.82 3.79 2.84 166.67 76.92 41.67 25.64 16 or 17 22.22 9.62 5.35 3.82 11.36 5.68 3.79 2.84 20.41 9.35 5.24 3.76 18 or 20 12.82 3.86 2.29 2.29 16.39 8.06 5.03 4.00 6.21 3.66 3.66 3.66 19 or 21 6.10 3.05 2.31 2.31 16.39 8.06 5.03 4.00 Il.24 5.10 3.09 2.07 22 or 23 4.76 2.30 1.52 1.27 9.01 4.44 2.95 2.20 35.71 13.51 3.69 1.66 24 or 25 4.52 2.26 1.51 1.40 8.85 4.39 2.91 2.91 4.50 2.25 1.58 1.58
1 Bold characters denote redundancy factors associated with the most critical members for different damage levels;
in. = 25.4 mm; 1 kip = 4.45 kN.
786 DAN M. FRANGOPOL and MAREK KLISNSKI
0.9
a” 3 0.8
8 - 0.7 Jz '; E 0.6
%I
Ti 0.5
0 g n" a
::t , , , yq::.:: 0 0 2 0.4 0.6 0.8 1.0
Damage
I.0
0.6
o.fof 0.2 0.4 0.6 0.6 1.0
factor
o.sc a? g 0.0..
e t 0.7 -
I? 0.6-
3 ; 0.5 -
a” 0.4-
1.0 12~~13 14 WI5
0.3; I , 0.2 0.4 0.6 0.6 I.0
Damage factor
Fig. 8. Twenty-Eve-bar optimized truss with one damaged member. System residual strength factor vs damage factor of each member: (a) brittle, Q, = 62.5 kips; (b) ductile, Q0 = 77.3 kips; and (c) brittle-ductile
behavior, Q0 = 31.3 kips.
questions concerning whether or not a given damaged member should be repaired, replaced, or simply left in its damaged state, or if a structure with a given amount of damage should have its allowable load limited or its use prohibited until any necessary repairs can be done.
The structural optimization program was used to design thy-dimensional brittle, ductile, and brittl+ ductile truss systems for minimum weight. The main goal has been to investigate the effects of optimiza- tion on the reserve, residual and redundancy factors of these systems. As was expected, optimized struc- tures show smaller reserve, residual and redundancy factors than initial structures for all types of behav- ior. In the optimized structures more members be- come important and when damage is imposed on one of them the load-carrying capacity of the structure must often be significantly reduced. In the initial
(nonoptimized) structures only few members are criti- cal and damage imposed on one of the other (noncrit- ical) members has no such an important influence on the overall system strength. From another point of view, optimized structures are able to carry more load than initial structures at the same cost.
A natural extension of the present study is to further explore optimization strategies to balance con- ilicting situations in which reserve strength, redun- dancy, limited defo~ation, and burns-weight must be satisfied. Along these lines, investigations were undertaken and some preliminary results were reported using both deterministic [21] and probabilis- tic [22] multiobjective optimization concepts.
Acknowledgements-This work was done as part of a research effort sponsored by the National Science Foun- dation through grants MSM-8618108 and ECE-8609894.

Optimum design of three-dimensional brittle-ductile trusses 787
1.
2.
3.
4.
5.
6.
I.
8.
9.
10.
11.
REFERENCES
M. Klisinski and D. M. Frangopol, Multilevel optimiz- ation of structural systems, Phase 1: Deterministic optimization of truss systems. Struct. Res. Ser. 8710, Denartment of Civil Enaineerina. Universitv of Col- orado, Boulder (1987). - -. D. M. Frangopol and M. Klisinski, Material behavior and optimum design of structural systems. (Submitted for publication). H. H. Rosenbrock, An automative method for finding the greatest or least value of a function. Comput. J. 3, 175-184 (1960). R. Levy and 0. E. Lev, Recent developments in struc- tural optimization. J. Struct. Ertgng ASCE K+(9), 1939-1962 (1987). Y. S. Feng and F. Moses, Optimum design, redundancy and reliability of structural systems. Comput. Struct. 24(2), 239-251 (1986). F. Moses and J. T. P. Yao, Safety evaluation of buildings and bridges. Presented at Symp. Structural Design, Inspection and Redundancy. Williamsburg, VA, November 1983. J. R. Lloyd and W. C. Clawson, Reserve and residual strength of pile founded offshore platforms. Proc. Inr. Symp. Role of Design, Inspection and Redundancy in Marine Structural Reliability. National Academy Press, Washington DC (I 984). P. W. Marshall, Strategy for monitoring, inspections and repair for fixed offshore structures. Proc. In?. Symp. Role of Design, Inspection and Rebury in atone St~ctura~ Re~~b~Iity. National Academy Press, Wash- ington DC (1984). J. T. P. Yao, Safety and Reliability of Existing Struc- fures. Pitman, Boston (1985). H. Furuta, M. Shinozuka and J. T. P. Yao, Probabilistic and fuzzy representation of redundancy in structural systems. Presented at the 1st Int. Fuzzy Systems Asso- ciated Congress, Palma de Mallorca (1985). D. M. Frangopol and J. P. Curley, Effects of damage and redundancy on structural reliability. J. Struct. Engng ASCE 113, 1533-1549 (1987).
12.
13.
14.
1.5.
16.
17.
18.
19.
20.
21.
22.
D. M. Frangopol and J. P. Curley, Damage states, redundancy and system strength. E&cts of Damage rmd Redundancy on Structural Performance (Edited by D. M. Frangopol), pp. 23-46. ASCE, New York (1987). D. M. Frangopol, G. G. Goble, J. J. Trautner and M. M. Scholfield, Redundancy evaluation of existing bridges. In Bridge and Transmission Line Structures (Edited by L. Tall), pp. I-16. ASCE, New York (1987). D. M. Frangopol and G. G. Goble, Development of a redundancy measure for existing bridges. Presented at U.S.-European Workshop on Bridge Evaluation, Repair and Rehabilitation, Paris (1987). D. M. Frangopol, The redundancy factor in bridges. Presented at ASCE Int. Civil Engineering Convention and Exposition, Anaheim, CA (1987). J. P. Tang and J. T. P. Yao, Evaluation of structural damage and redundancy. In E&cts of Damage and Redundancy on Structural Performance (Edited by D. M. Frangopol), pp. 47-62. ASCE, New York (1987). R. A. Parmelee and H. R. Sandberg, If it’s redundant, prove it. Civil Engng, ASCE, October, 57-58 (1987). N. Youssef, The redundancy factor in buildings. Pre- sented at ASCE Int. Civil Engineering ConventTon and Exposition, Anaheim, CA (1987). 0. N. Vanderplaats, Automated design of elastic trusses for optimum geometry. Rep. 45. Division of Solid Mechanics, Structures, and Mechanical Design, School of Engineering, Case Western Reserve University, Cleveland, OH (1971). U. K&h, ~pt~urn St~~turaI Design. McGraw-Hill, New York (1981). M. Klisinski and D. M. Frangopol, Multilevel optimization of structural systems, Phase 2: Multi- objective optimization in deterministic structural design with applications to truss systems. Struct. Res. Ser. 8714, Department of Civil Engineering, University of Colorado, Boulder (1987). G. Fu and D. M. Frangopol, Reliability-based multi- objective structural optimization, Phase 1: Applications to truss systems. Struct. Res. Ser. 8715, Department of Civil Engineering, University of Colorado, Boulder (1987).