Embed Size (px)
Citation preview

Welcome!
Please get out objectives #10-15 for a stamp.
Please read the board.

What do these have in common?

Climate and civilization
Human civilizations change when climate changes
20,000 ybp (years before present) ice age: Bering strait freezes, people migrate to the Americas
8,000-7,000 ybp – warming period Mesopotamia flourishing, Jericho established

Mayan civilization – collapses suddenly 950 CE (common era – used to be called AD)Leif Erikson – 950 CE sails to Greenland

Black Death in Europe – famine 1315-1317 – needed to import grain from China
Little Ice age – 1550-1850Irish Potato Famine
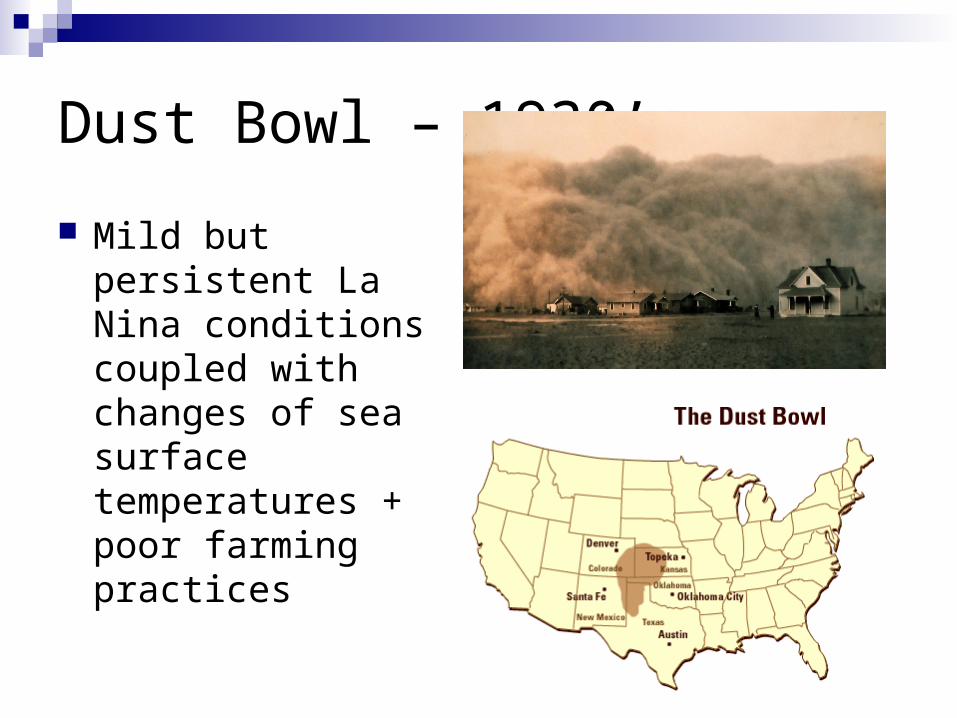
Dust Bowl – 1930’s
Mild but persistent La Nina conditions coupled with changes of sea surface temperatures + poor farming practices
Predicting future climate
How do they do that anyway?

Global Circulation model
Global Climate Models: GCM’s
Computer model divides atmosphere into chunks.
Current conditions programmed into each chunk: temp, wind, [GHGs], etc
Computer can generate current and future global temperature averages based on [GHGs]

Limitations of GCMs
Complexity Feedback loops (not included in GCMs)
(+)Melting tundra permafrost and lower geologic formations– 500 billion tons CH4
(+)Loss of albedo effect with ice (-)Increasing albedo effect with clouds (+) Increasing greenhouse effect with evaporating water
Role of ocean and CO2 absorption

Lesson from the Ozone Hole:
1930’s – CFCs invented 1970’s – mechanism of O3 destruction
understood; models of possible effects suggest general thinning of O3 layer
1985 – Ozone hole documented as complete surprise – models were wrong.
1987 – Montreal Protocol ratified

IPCC: Intergovernmental Panel on Climate Change UN group of 1,200+ scientists representing
almost every country Jan 2007 –Absolute agreement on
anthropogenic cause of current climate change. “Warming of the climate system is unequivocal”
(100% confidence level)
“There is very high confidence that the net effect of human activities since 1750 has been one of warming.” (90% confidence level)

How hot will it get? Depends on CO2 output: IPCC 2013 graphs
Predictions:
If CO2 goes to 450ppm by 2050, +2oC (3.6oF) CO2 to 550ppm by 2050, +3oC (5.4oF) In 50 yrs, expect 4oC warming (2012 World Bank Report)
CO2 of 350ppm is considered sustainable by climatologists
Tipping point is probably at 2oC (the point at which change due to human activity
brings about sufficient new processes in nature to make any human reversal of the change impossible. )

Mauna Loa CO2 levels

Observations
Europe – 2011/2012 – record winter snows and cold
Texas – 2011 record 10,000 year drought? Australia 2013 – extreme heat – new colors on
weather maps California – severe drought, wildfire seasons
starting in January 2012-2013 -United States experienced 25
climate- and weather-related disasters that claimed 1,141 lives and each exceeded $1 billion ($175 billion total) in damages.

From the National Oceanographic and Atmospheric Administration (NOAA) The year 2012 was the 10th warmest year since
records began in 1880. 2013 was the 7th warmest year.
The 37th consecutive year that the yearly global temperature was above average.
Arctic ice melting at record rate Frost free season has increased by 21 days in CA, 9
days in TX, 10 days in CT Including 2013, all 12 years to date in the 21st century
(2001–2012) rank among the 14 warmest in the 133-year period of record. Only one year during the 20th century—1998—was warmer than 2012.
Chasing Ice –ice core graphs, effects, glaciers

Big seven Change in precipitation patterns More severe weather events (droughts, floods,
extreme hot/cold) Rising sea levels (glaciers melting) Changing seasons – earlier spring and shift of
biomes away from equator Increased insect-borne disease Decreased availability of fresh water Acidification of ocean and bleaching of coral reefs
(H2CO3)

Sea level rise .7 m by 2100
Melting glaciers add water volume to ocean (Greenland ice sheet stores enough water to raise seal level by 5-7 meters)
Thermal expansion creates most of the increase

Where will the environmental refuges go? 50% of global population lives within 100 miles of a coastline.
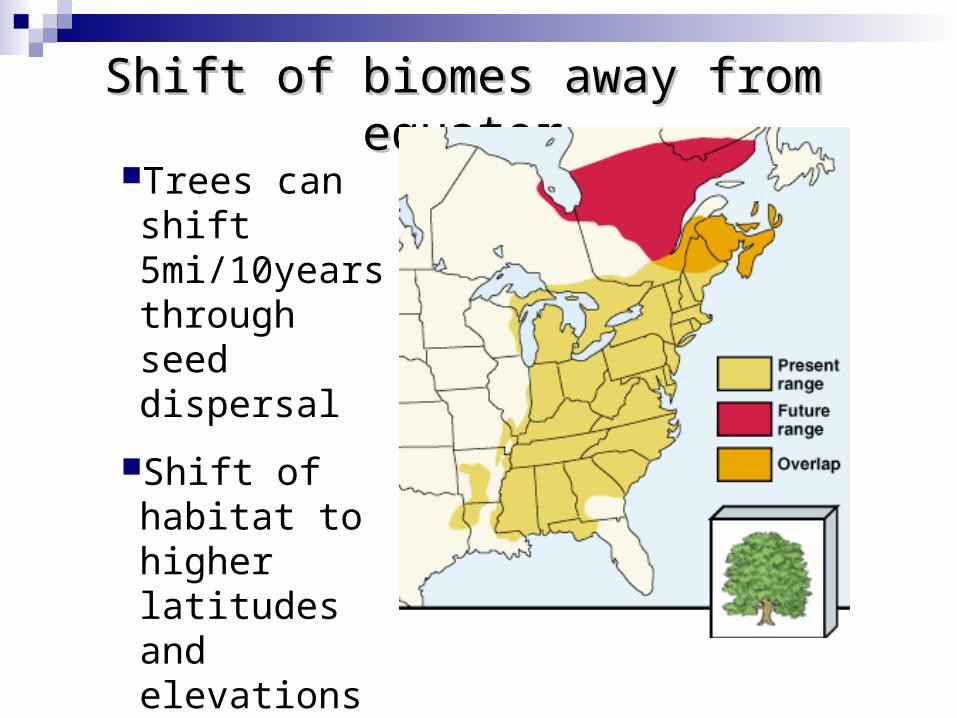
Fig. 11–9
Shift of biomes away from equatorShift of biomes away from equator
Trees can shift 5mi/10years through seed dispersal
Shift of habitat to higher latitudes and elevations
Potential large loss of biodiversity © Brooks/Cole Publishing Company / ITP


Don’t forget!


How would you rank these possible effects of climate change: which would you say is the greatest concern and why?