Embed Size (px)
Citation preview

Welcome!
Project H2-Photobioreactor(PBR)
http://web.mit.edu/~pweigele/www/being

Outline
• Motivation
• H2
• Photosynthesis
• Photobioreactors
• Project PBR!

Human activities and global warming
•Keeling curve shows trend of increasing [CO2] occurring over 4 decades•seasonal variation in northern hemisphere due to vegetation•amount of CO2 increase from 280 ppm (pre-1860) to 370 ppm, at present•increase of 30 ppm in last 20 years alone•see Carbon Cycle Greenhouse Gasses Group at NOAA (http://www.cmdl.noaa.gov/ccgg/index.html)

Human activities and global warming
•ice core measurments of atmospheric [CO2]•cycles correlate with ice ages
•average temperature deviationover last 150 years

CO2, NOx, and CH4 are effective “greenhouse” gases

Worldwide demand for energy
•current consumption: 12.8 TW/year
•3.3 TW consumed by the United States
•10.2 TW from coal, oil, methane
•conservative model predicts 25-30 TW
annual consumption within 50 years
•1.2 x 10⁵ TW/year reaches earth from Sun
(Hoffert et al. (1998) Nature)
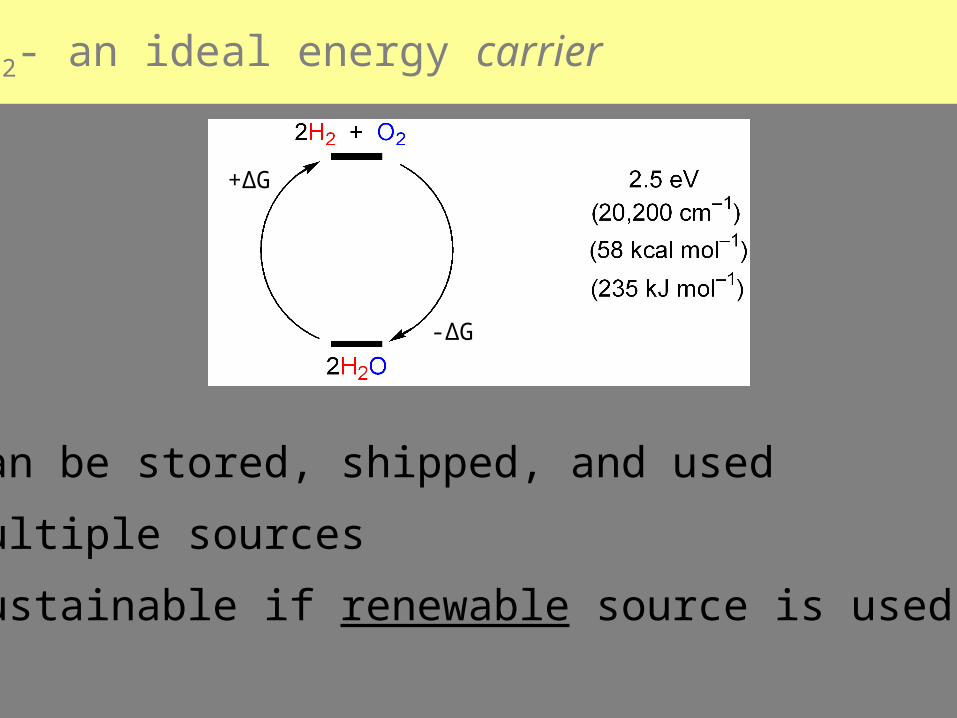
H2- an ideal energy carrier
•can be stored, shipped, and used
•multiple sources
•sustainable if renewable source is used
+∆G
-∆G

• merchant market ~$7 billionspecialty chemicals manufacturemetallurgyfoodlaboratorytransport
• captive-use market ~$20 billionpetroleum refining (59%)ammonia synthesis (fertilizer)
Current H2 markets

Origin Amount in billions Percent Nm3/year
Natural gas 240 48
Oil 150 30
Coal 90 18
Electrolysis 20 4
Total 100 500
Used mostly in the production of ammonia-based fertilizers and oil refining
Current global H2 production
release of CO2
asH2 is produced
Provided by the SeaWiFS ProjASA/Goddard Space Flight Center and ORBIMAGE
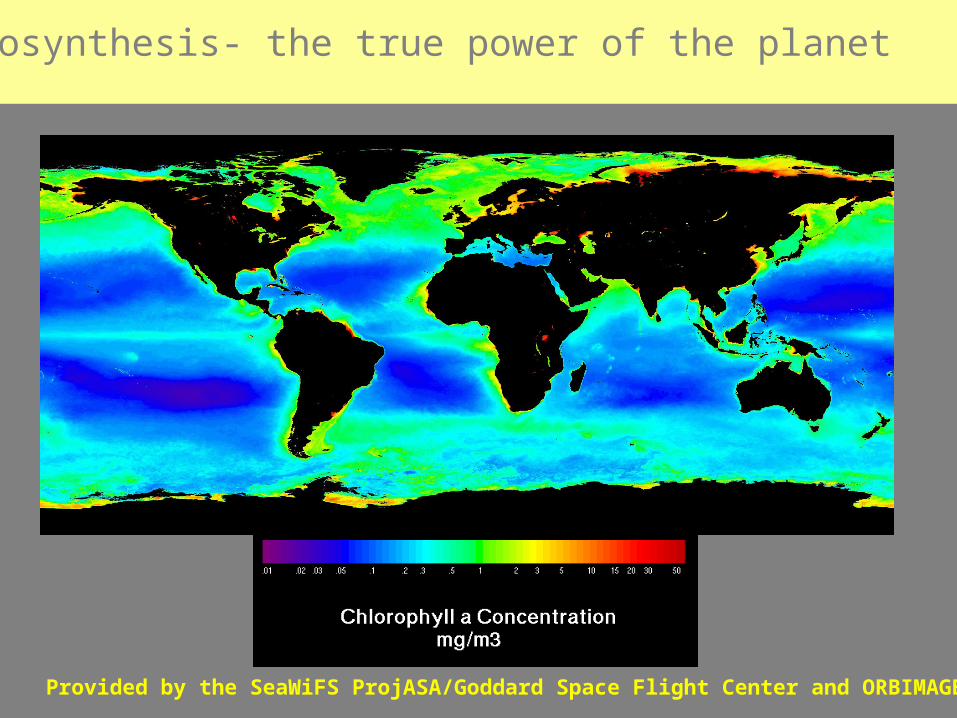
Photosynthesis- the true power of the planet
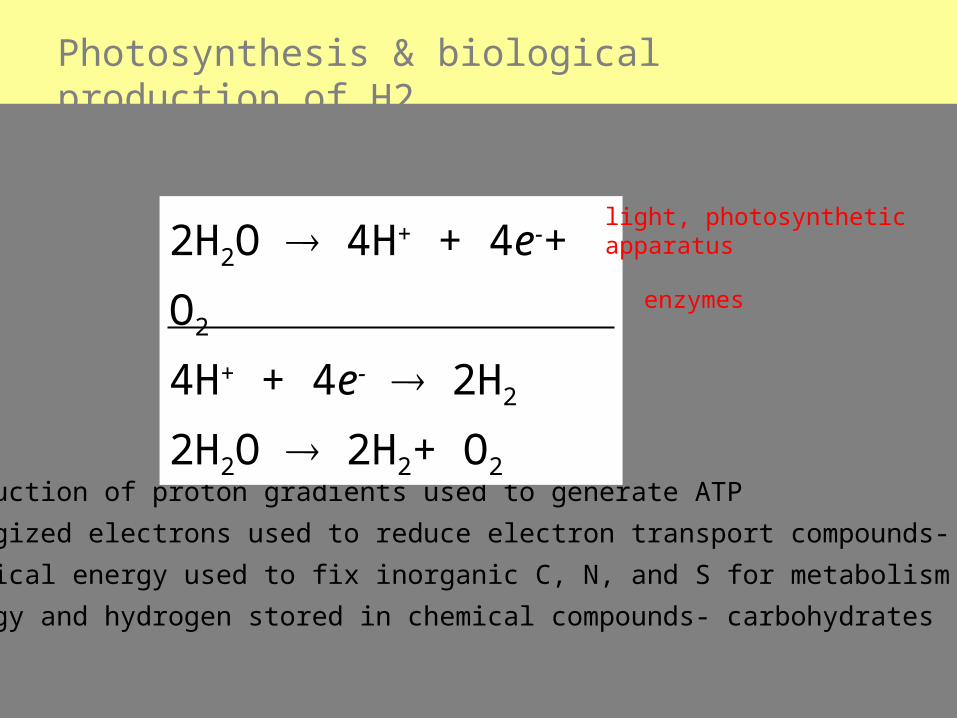
Photosynthesis & biological production of H2
•production of proton gradients used to generate ATP
•energized electrons used to reduce electron transport compounds- NADP+
•chemical energy used to fix inorganic C, N, and S for metabolism
•energy and hydrogen stored in chemical compounds- carbohydrates
2H2O 4H+ + 4e-+
O2
4H+ + 4e- 2H2
2H2O 2H2+ O2
light, photosyntheticapparatus
enzymes

Outline of electron and proton movement in photosynthetic architecture
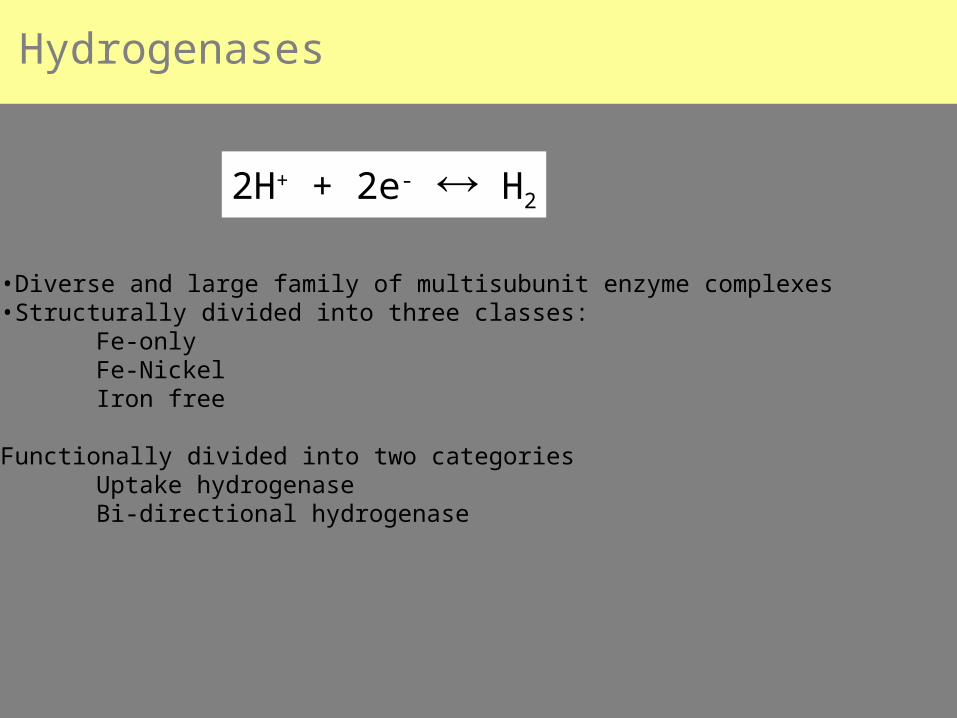
Hydrogenases
•Diverse and large family of multisubunit enzyme complexes•Structurally divided into three classes:
Fe-onlyFe-NickelIron free
Functionally divided into two categoriesUptake hydrogenaseBi-directional hydrogenase
2H+ + 2e- H2

Photosynthesis
Photosynthesis

Photosynthesis

Biological pathways for H2 production
•direct photobiolysis
•indirect photobiolysis
•photofermentation
•dark fermentation
•biological water-gas shift reaction
•biomass gasification

Direct biophotolysis
•reducing power generated by photosynthetic apparatus used to reduce protons to H2
•continuous production of H2 in the light
•hydrogenase is inhibited by O2 produced by PSII

Indirect biophotolysis
•reducing power is used to first fix inorganic carbon; carbohydrates act as storage medium for hydrogen (C6H12O6 with H2O theoretically yields 12 H2)
•reducing energy and hydrogen are released by fermentation
•O2 generating and O2 sensitive processes are temporally separated

Reported outputs of biohydrogen schemes
•from Resnick, R. J. (2004) The economics of biological methods of hydrogen production. M.S. Thesis, Management of Technology, MIT-Sloan

•cost for steam methane reformation is $19.08/GJ•costs listed above underestimated (labor cost not factored in)•from Resnick, R. J. (2004) The economics of biological methods of hydrogen production. M.S. Thesis, Management of Technology, MIT-Sloan
Cost ($/GJ) of biologically produced hydrogen

Energy prices (in £ per GJ) for Great Britain 1914-2000
bottom line: coal and natural gas cost ≤ $10/GJ (from Energy Systems and Sustainability Oxford Press)

Bioreactors- real world parameters
•biological process engineering
•capital costs
•operating costs
•gas separation, culture mixing, aerobic/anaerobic
•primary resource is area
•light and climate
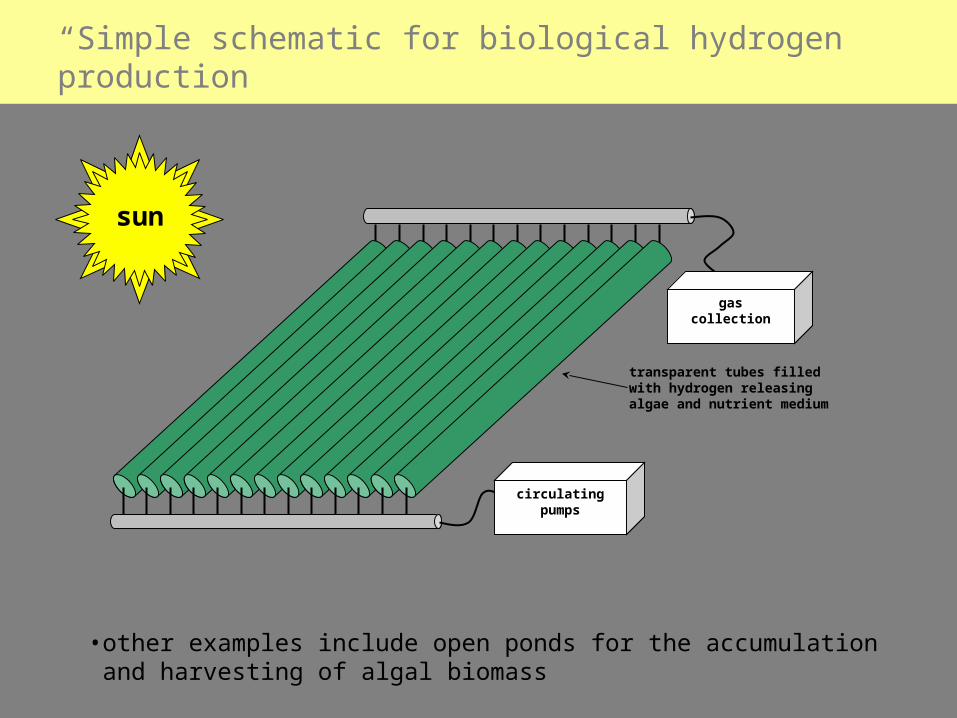
“Simple”schematic for biological hydrogen production
circulatingpumps
gas collection
sun
transparent tubes filled with hydrogen releasing algae and nutrient medium
•other examples include open ponds for the accumulation and harvesting of algal biomass

from Photosynthetic Prokaryotes, Mann and Carr, eds.
Real world photobioreactor

Hillbilly photobioreactor

Project PBR- Scale up proven technology
Design and Build Working Photobioreactor!Design phase- Summer 2005Assembly- Summer/Fall 2005Run/Experiment- through Spring 2006
Background:http://web.mit.edu/~pweigele/www/PBH2

Laboratory scale PBR
from Kosourov et al. (2002)

Project PBR- basic considerations
Vessel materials- H2, O2 impermeable
Mixing- mechanical v.s. gas driven
Organism- eukaryotic v.s. prokaryotic
Ports- culture injection, sterility
Sensors- monitoring, pH, O2, H2
Fuel cell- gas mixture, transit time

Basic PBR schematic
pump
fuel cell battery

PBR- Greenfuel design
gas diffuser
clear tubing

Project PBR model #1

Project PBR model #2

Resources
Edgerton Center- workspace, Bridgeport machines, $, truck
Printed materials to:Biological Energy Interest Groupc/o Edgerton Center77 Massachusetts Ave, Bldg. 4-405Cambridge, MA 02139
Packages:Biological Energy Interest Groupc/o Edgerton Center32 Vassar Street, 4-405Cambridge, MA 02139
Steve Banzaert, [email protected] Moriarty, [email protected] Lipnoski, [email protected]

What we need!
$$$ (Edgerton Matching Funds)
PBR site location
Storage/assembly space

Tasks for next meeting…
Preliminary sketches for subsystem
Find supplier for clear tubing
Approach departments for funding, space
Web development- Athena locker, downloadables, blog?