Embed Size (px)
Citation preview

WELCOME
TOPLACEMENTS
2014 – 2015
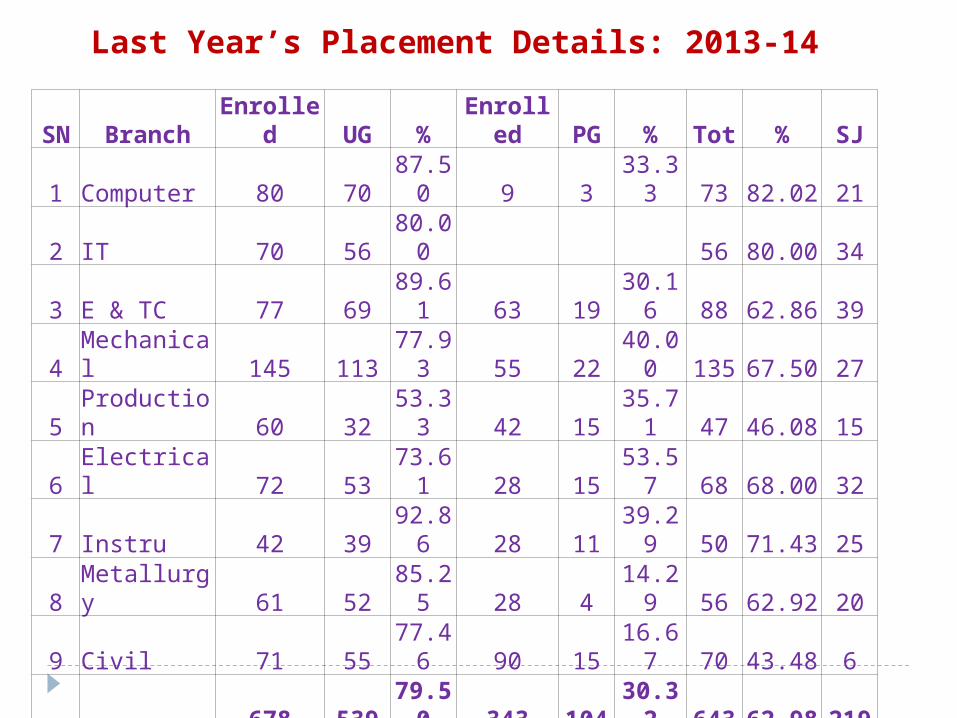
Last Year’s Placement Details: 2013-14
SN Branch Enrolled UG % Enrolled PG % Tot % SJ
1 Computer 80 70 87.50 9 3 33.33 73 82.02 21
2 IT 70 56 80.00 56 80.00 34
3 E & TC 77 69 89.61 63 19 30.16 88 62.86 39
4 Mechanical 145 113 77.93 55 22 40.00 135 67.50 27
5 Production 60 32 53.33 42 15 35.71 47 46.08 15
6 Electrical 72 53 73.61 28 15 53.57 68 68.00 32
7 Instru 42 39 92.86 28 11 39.29 50 71.43 25
8 Metallurgy 61 52 85.25 28 4 14.29 56 62.92 20
9 Civil 71 55 77.46 90 15 16.67 70 43.48 6
678 539 79.50 343 104 30.32 643 62.98 219
As On 30TH JULY, 2014 Total No of Companies visited: 149

B.Tech Placement Stats for Last 3 Years
B. Tech : Computer
Year Enrolled UG % SJ2013-14 80 70 87.50 212012-13 83 76 91.57 212011-12 78 74 94.87 21
B. Tech : Information Technology
Year Enrolled UG % SJ2013-14 70 56 80.00 342012-13 69 57 82.61 172011-12 76 65 85.53 14
B. Tech : Electronics and Telecommunication
Year Enrolled UG % SJ2013-14 77 69 89.61 392012-13 85 70 82.35 192011-12 79 77 97.47 29
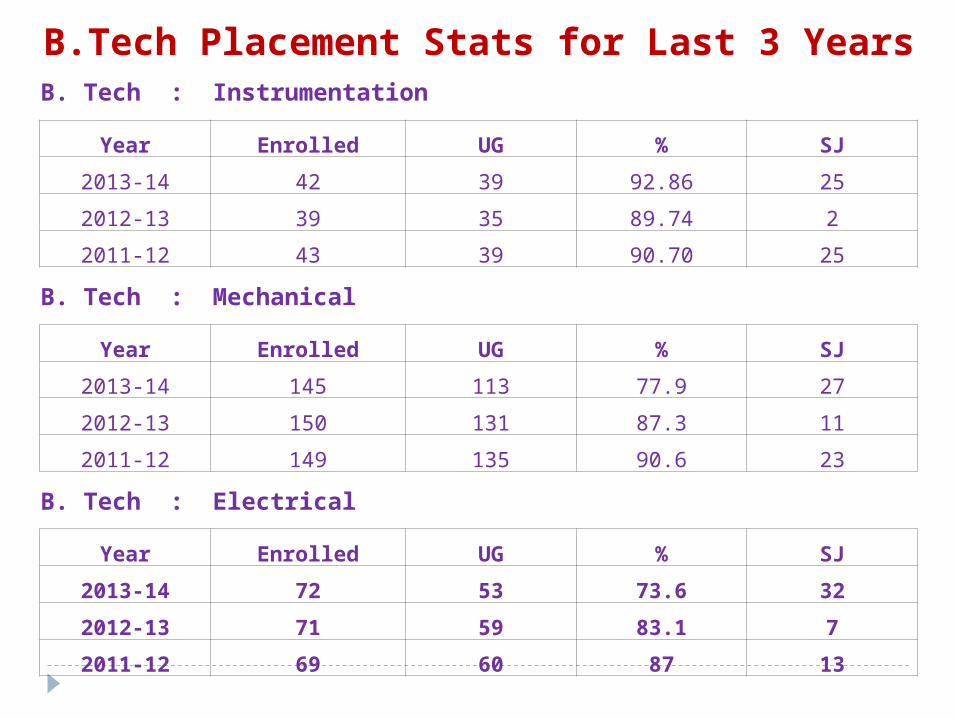
B.Tech Placement Stats for Last 3 YearsB. Tech : Instrumentation
Year Enrolled UG % SJ
2013-14 42 39 92.86 25
2012-13 39 35 89.74 2
2011-12 43 39 90.70 25
B. Tech : Mechanical
Year Enrolled UG % SJ
2013-14 145 113 77.9 27
2012-13 150 131 87.3 11
2011-12 149 135 90.6 23
B. Tech : Electrical
Year Enrolled UG % SJ
2013-14 72 53 73.6 32
2012-13 71 59 83.1 7
2011-12 69 60 87 13

B.Tech Placement Stats for last 3 YearsB. Tech : Civil
Year Enrolled UG % SJ
2013-14 71 55 77.5 6
2012-13 52 46 88.5 -
2011-12 60 51 85 16
B. Tech : Production
Year Enrolled UG % SJ
2013-14 60 32 53.3 15
2012-13 58 50 86.2 2
2011-12 67 57 85.1 20
B. Tech : Metallurgy
Year Enrolled UG % SJ
2013-14 61 52 85.2 20
2012-13 67 60 89.6 19
2011-12 65 54 83.1 21

M.Tech Placement Stats for last 3 YearsCOMPUTER
S.N. SPECIALIZATION 2011-2012 2012-2013 2013-2014 Enrolled Placed Enrolled Placed Enrolled Placed
1COMPUTER ENGG. 13 12 13 9 9 3
TOTAL 13 12 13 9 9 3TOTAL % OF PLACEMENT 92.31% 69.23% 33.33%
ELECTRONICS AND TELECOMMUNICATION
S.N. SPECIALIZATION 2011-2012 2012-2013 2013-2014 Enrolled Placed Enrolled Placed Enrolled Placed1 DIGITAL SYSTEM 15 14 12 1 16 7
2VLSI & EMBD.SYSTEM 14 11 10 2 12 0
3
WIRED &WIRELESS COMM. 15 13 15 10 18 6
4 SIGNAL PROC. 15 9 15 7 17 6 TOTAL 59 47 52 20 63 19
TOTAL % OF PLACEMENT 79.66% 38.46% 30.16%
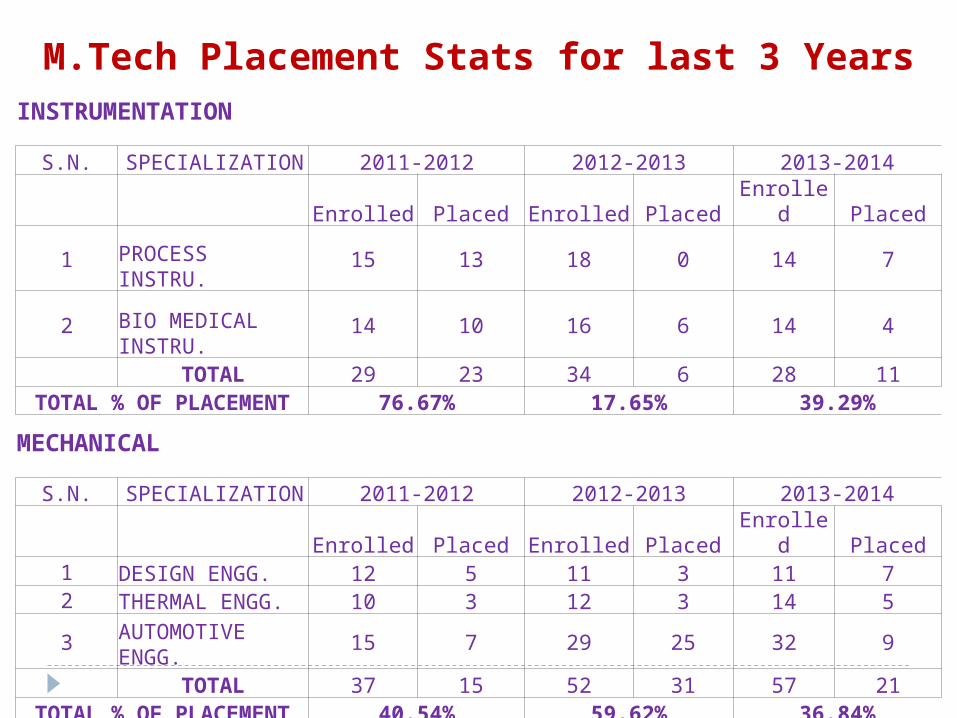
M.Tech Placement Stats for last 3 YearsINSTRUMENTATION
S.N. SPECIALIZATION 2011-2012 2012-2013 2013-2014 Enrolled Placed Enrolled Placed Enrolled Placed
1 PROCESS INSTRU.
15 13 18 0 14 7
2 BIO MEDICAL INSTRU.
14 10 16 6 14 4
TOTAL 29 23 34 6 28 11TOTAL % OF PLACEMENT 76.67% 17.65% 39.29%
MECHANICAL
S.N. SPECIALIZATION 2011-2012 2012-2013 2013-2014 Enrolled Placed Enrolled Placed Enrolled Placed1 DESIGN ENGG. 12 5 11 3 11 72 THERMAL ENGG. 10 3 12 3 14 5
3 AUTOMOTIVE ENGG.
15 7 29 25 32 9
TOTAL 37 15 52 31 57 21TOTAL % OF PLACEMENT 40.54% 59.62% 36.84%
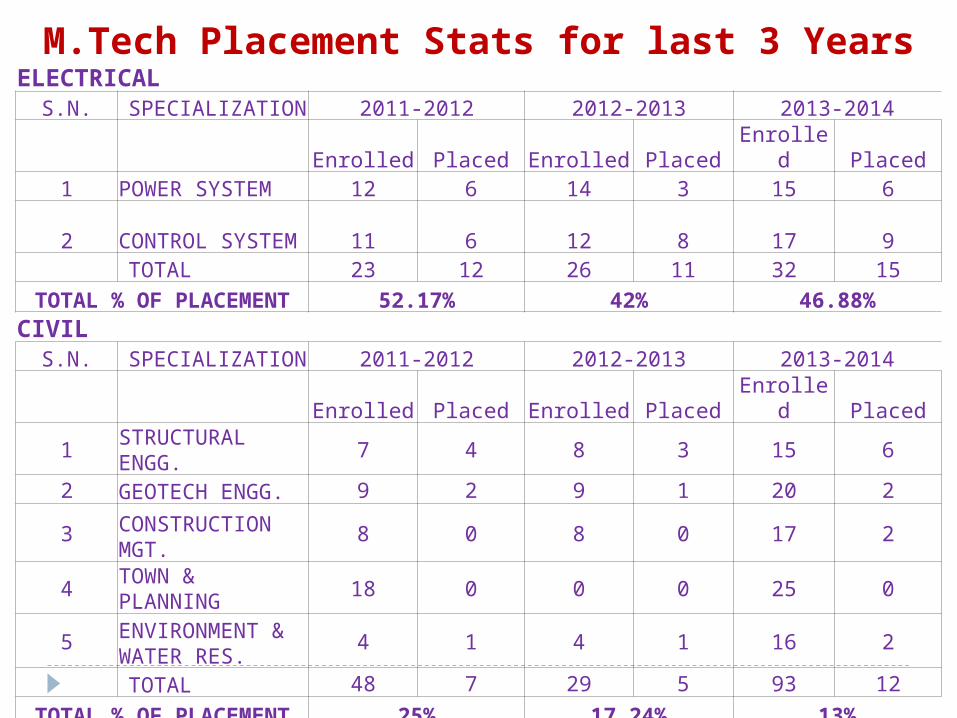
M.Tech Placement Stats for last 3 YearsELECTRICAL
S.N. SPECIALIZATION 2011-2012 2012-2013 2013-2014 Enrolled Placed Enrolled Placed Enrolled Placed1 POWER SYSTEM 12 6 14 3 15 6
2CONTROL SYSTEM 11 6 12 8 17 9
TOTAL 23 12 26 11 32 15
TOTAL % OF PLACEMENT 52.17% 42% 46.88%CIVIL
S.N. SPECIALIZATION 2011-2012 2012-2013 2013-2014 Enrolled Placed Enrolled Placed Enrolled Placed
1STRUCTURAL ENGG.
7 4 8 3 15 6
2 GEOTECH ENGG. 9 2 9 1 20 2
3 CONSTRUCTION MGT.
8 0 8 0 17 2
4TOWN & PLANNING
18 0 0 0 25 0
5 ENVIRONMENT & WATER RES.
4 1 4 1 16 2
TOTAL 48 7 29 5 93 12
TOTAL % OF PLACEMENT 25% 17.24% 13%

M.Tech Placement Stats for last 3 YearsPRODUCTION
S.N. SPECIALIZATION 2011-2012 2012-2013 2013-2014 Enrolled Placed Enrolled Placed Enrolled Placed
1 MGF & AUTOMATION
12 5 11 0 14 4
2 MECHATRONICS 15 7 15 6 12 7
3PROJECT MANAGEMENT
—- —- —- —- 16 4
TOTAL 27 12 26 6 42 15TOTAL % OF PLACEMENT 44.44% 23.08% 35.71%
METALLURGY
S.N. SPECIALIZATION 2011-2012 2012-2013 2013-2014 Enrolled Placed Enrolled Placed Enrolled Placed
1 PROCESS METALLURGY
4 1 9 2 15 1
2PHYSICAL METALLURGY
4 4 12 0 14 1
TOTAL 8 5 21 2 29 2TOTAL % OF PLACEMENT 62.50% 9.52% 6.90%
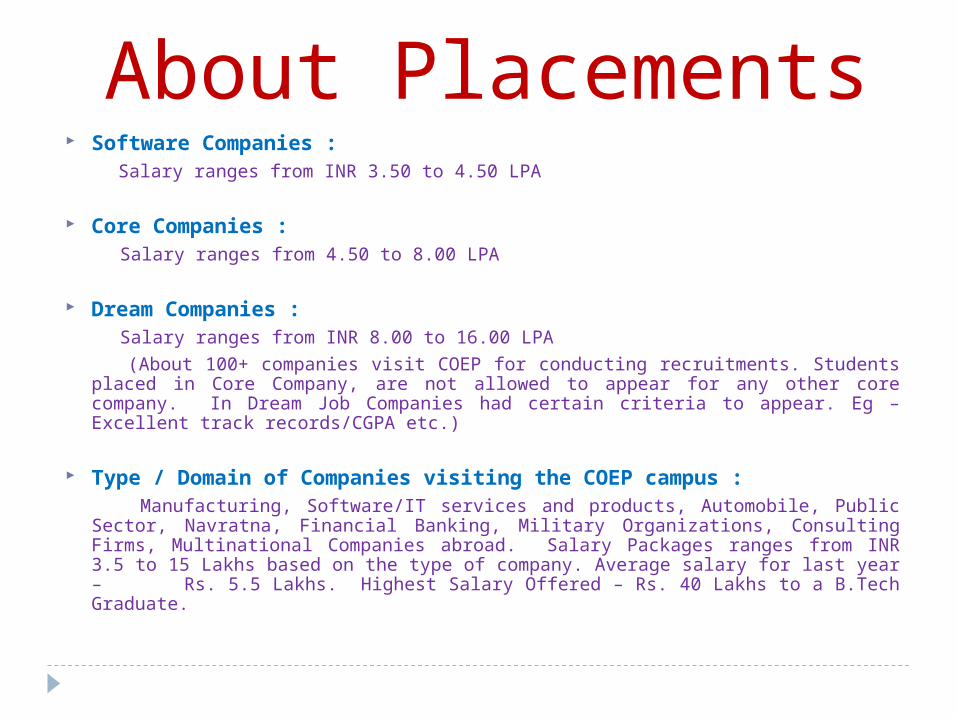
Software Companies : Salary ranges from INR 3.50 to 4.50 LPA
Core Companies : Salary ranges from 4.50 to 8.00 LPA
Dream Companies : Salary ranges from INR 8.00 to 16.00 LPA
(About 100+ companies visit COEP for conducting recruitments. Students placed in Core Company, are not allowed to appear for any other core company. In Dream Job Companies had certain criteria to appear. Eg – Excellent track records/CGPA etc.)
Type / Domain of Companies visiting the COEP campus : Manufacturing, Software/IT services and products, Automobile, Public Sector,
Navratna, Financial Banking, Military Organizations, Consulting Firms, Multinational Companies abroad. Salary Packages ranges from INR 3.5 to 15 Lakhs based on the type of company. Average salary for last year – Rs. 5.5 Lakhs. Highest Salary Offered – Rs. 40 Lakhs to a B.Tech Graduate.
About Placements
College of Engineering Pune (COEP)Forerunners in Technical Education