Embed Size (px)
Citation preview
Welcome to the CDC Enterprise Architecture Community of
Practice
November 20, 2009

Agenda
Introductory Remarks
NCCDPHP: Approaching a common chronic disease surveillance data model and early ROI (Jason Bonander, Akaki Lekiachvili)
Continue Discussion & Networking

Introductory Remarks
Enterprise-level DB Implementation for Data Dissemination
(Experience & lessons Learnt)November 20, 2009

Background
• 2007, January through May:– NCCDPHP surveillance system study from the informatics perspective

Background
• July 2007:– Focus to the data dissemination
• Type of summary data• Types of measures for statistical significance• Stratifications and classifications• Reuse across the programs
– Surveillance Data Model (SDM) is conceived• Fits with existing NCCD surveillance systems• Leverages best practices from the project’s research• Is scalable to support multiple surveillance data sets• Is appropriately normalized• Streamlines data exchange across surveillance systems


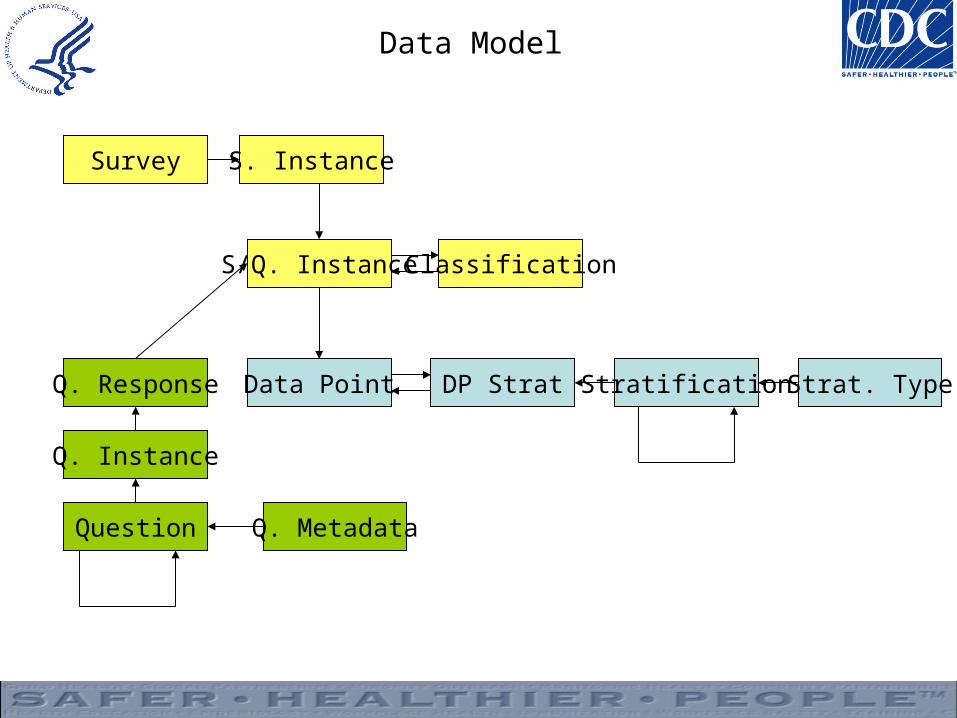
Data Model
Question
Survey
Q. Instance
Q. Response
S. Instance
S/Q. Instance Classification
Data Point DP Strat Stratification Strat. Type
Q. Metadata
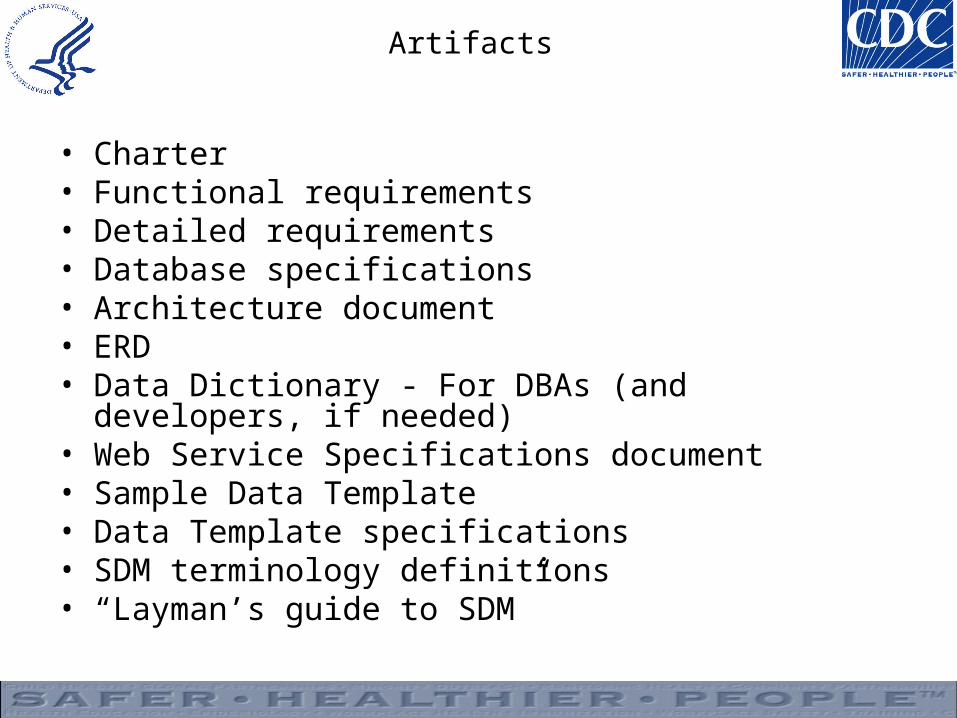
Artifacts
• Charter• Functional requirements• Detailed requirements• Database specifications• Architecture document • ERD • Data Dictionary - For DBAs (and developers, if needed)• Web Service Specifications document• Sample Data Template• Data Template specifications • SDM terminology definitions• “Layman’s guide to SDM”

Response of interest = positive response = numerator, etc. – For example: number of people with heart disease in Alabama – the actual number is the response
of interest: lets say it is 230,000 people. – Another example: Cost of healthcare in New York: lets say it is $200M.
Denominator = population of interest– For example: total number of subjects within the entity of interest – for the question above it would
be population of Alabama: lets say it is 5,000,000– Another example: Healthcare costs in NY might have total NY expenditures as a denominator if they
want to calculated the healthcare expenditures as a percent of total in the next step. Frequently, these types of indicators will not have any denominator.
Calculated value = measure/indicator/question value, etc.– Usually prevalence (point in time) or rate (within a timeframe)
• Prevalence is usually proportion of object of interest at a given time (usually measured at a mid-year point) and expressed as a percentage. For example: prevalence of people with heart disease (people walking around with heart disease at a given time divided by the total population).
• Rate is usually proportion of events during a time period. For example: rate of heart attacks (number of people who experienced heart attack during a given year divided by the total population.
– Calculated value can also be percent, mean, average, etc. – It may have supporting parameters that convey statistical significance/validity of the
calculated value. For example: CI, CL, P value, response rate, Cell size, etc. – From the previous examples: the calculated value will be prevalence of heart disease in
Alabama that is 4,200/5,000,000 = 4.6%. At the same time, NY health expenditures may or may not have calculated value.
The calculated value, and less often, the response of interest is considered a “main value” for an indicator/choice.
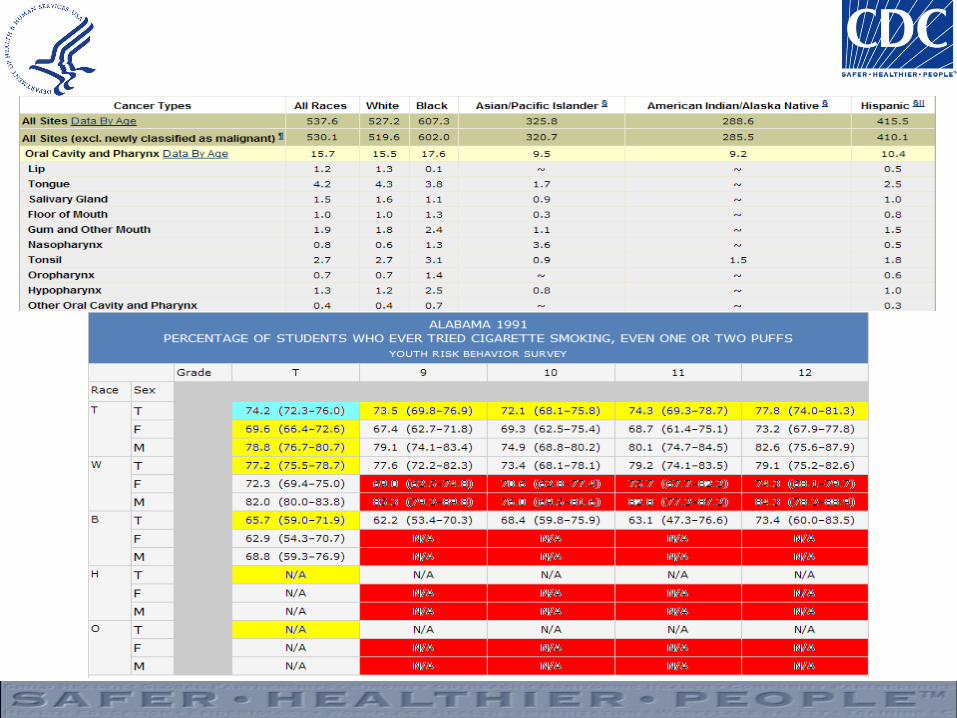
Disseminated data characteristics


Cost Analysis
Ad-hoc SDM
DB Design and construction 94/161 0/0
Initial data load 49/78 39/74
Subsequent data loads 16/30 17/32
QA, misc
Total 145/242 76/140

SDM Implementation Status
• In production:– OSH Global Youth Tobacco Survey
http://apps.nccd.cdc.gov/osh_gtss/default/default.aspx– DACH State of Mental Health and Aging (MAHA)
http://apps.nccd.cdc.gov/maha/MahaHome.aspx– DDT Vision Health Initiative (VHI)
• In Development:– DHDSP Data Trends and Maps– DCPC US Cancer Statistics (USCS)
• In Analysis/Design:– DASH YRBSS– DDT STRS– DDT CKD (Kidney disease)


Future
– Reusable Business Logic Layer for applications using SDM
– Reusable Application Controls

Lessons Learnt
• Acceptance• Buy in• Engagement

Questions?
Networking