Embed Size (px)
Citation preview
WELCOME
PERSONNEL DEVELOPMENT PROGRAM MEETING
@ OSEP PROJECT DIRECTORS’ VIRTUAL CONFERENCE
APRIL 27, 2015
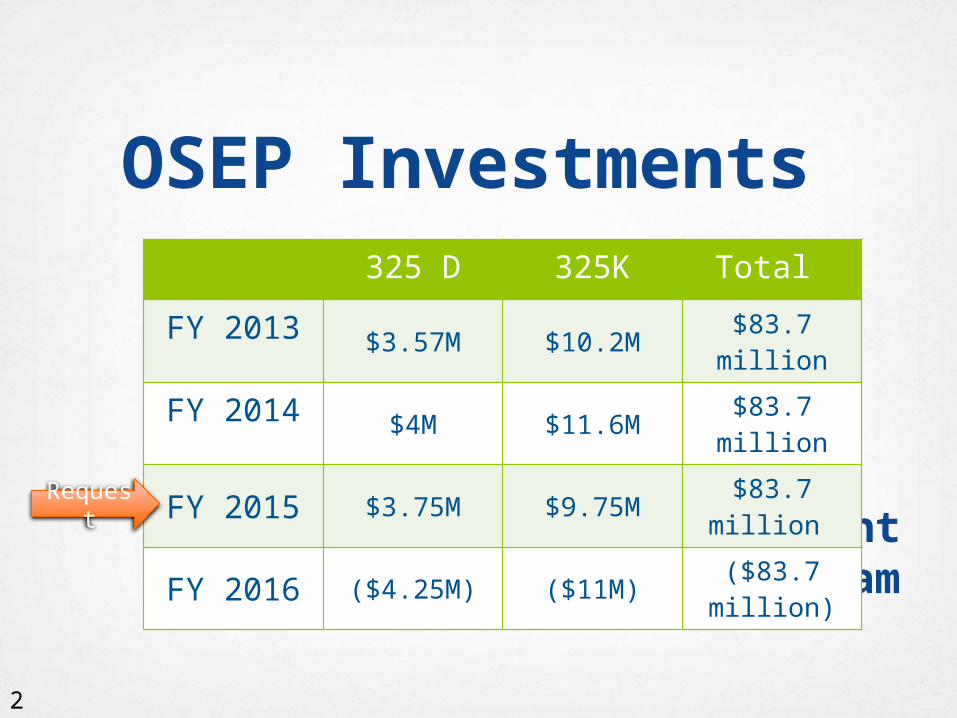
OSEP Investments
Personnel Development
Program
325 D 325K Total
FY 2013 $3.57M $10.2M$83.7 million
FY 2014 $4M $11.6M$83.7 million
FY 2015 $3.75M $9.75M$83.7
million
FY 2016 ($4.25M) ($11M)($83.7 million)
Request
2
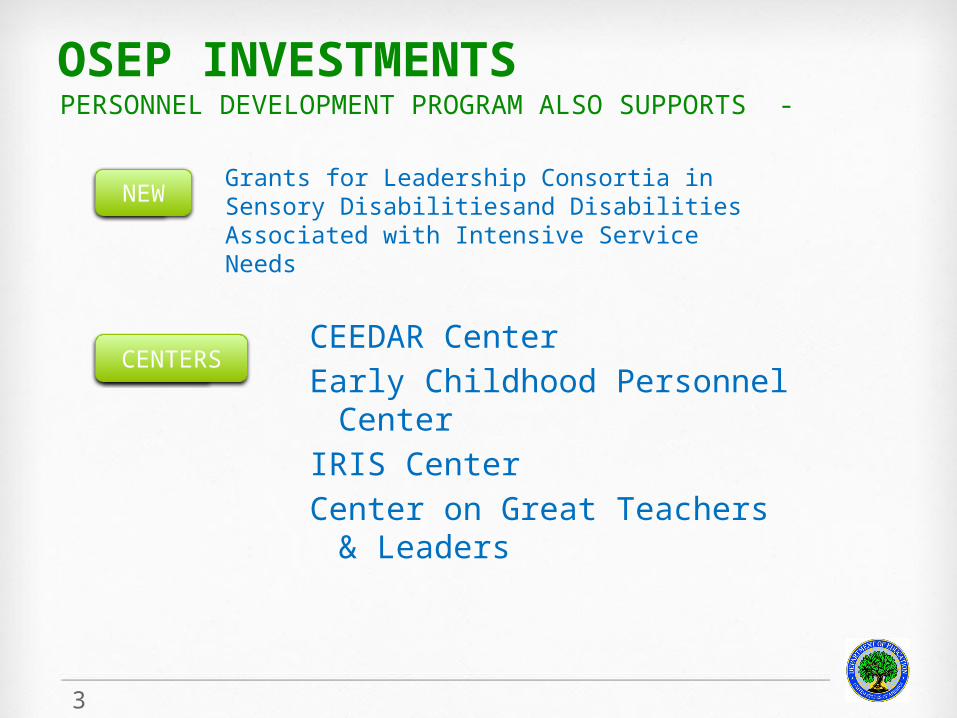
OSEP INVESTMENTS PERSONNEL DEVELOPMENT PROGRAM ALSO SUPPORTS -
NEWGrants for Leadership Consortia in Sensory Disabilitiesand Disabilities Associated with Intensive Service Needs
CENTERSCEEDAR CenterEarly Childhood Personnel
Center IRIS Center Center on Great Teachers &
Leaders
3
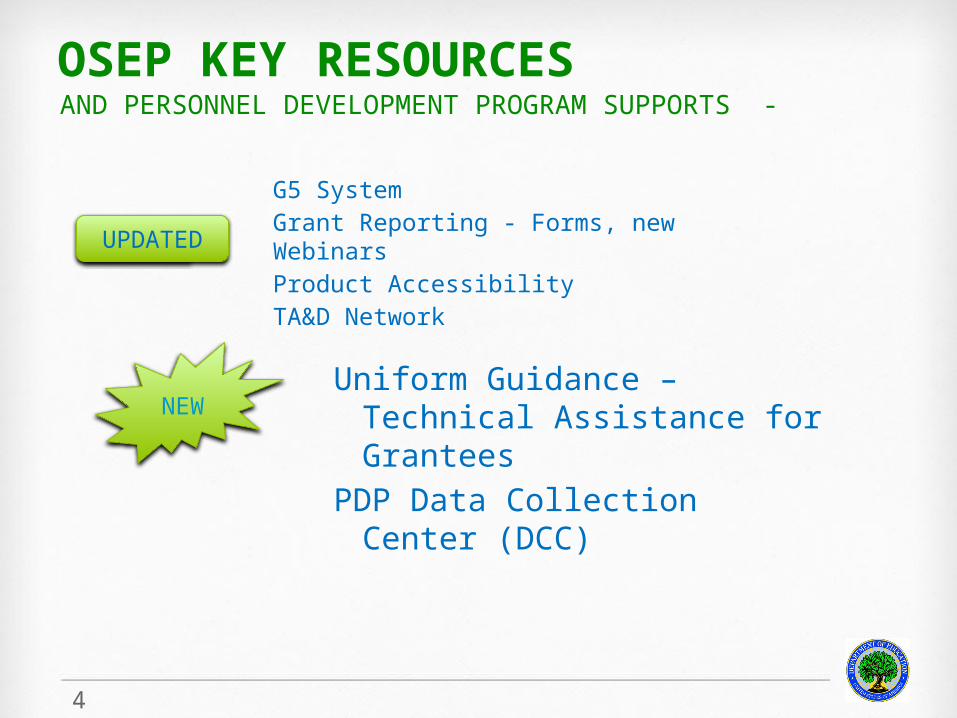
OSEP KEY RESOURCES AND PERSONNEL DEVELOPMENT PROGRAM SUPPORTS -
UPDATED
G5 SystemGrant Reporting - Forms, new WebinarsProduct Accessibility TA&D Network
NEWUniform Guidance – Technical
Assistance for GranteesPDP Data Collection Center
(DCC)
4
FY 2012 Data Collected & Reported in 2014Published in 2015
Search on “Special Education Budget Justification FY 2016” for more information
Personnel Development Program Performance Measures
April 27, 2015 OSEP Project Directors’ Virtual Conference
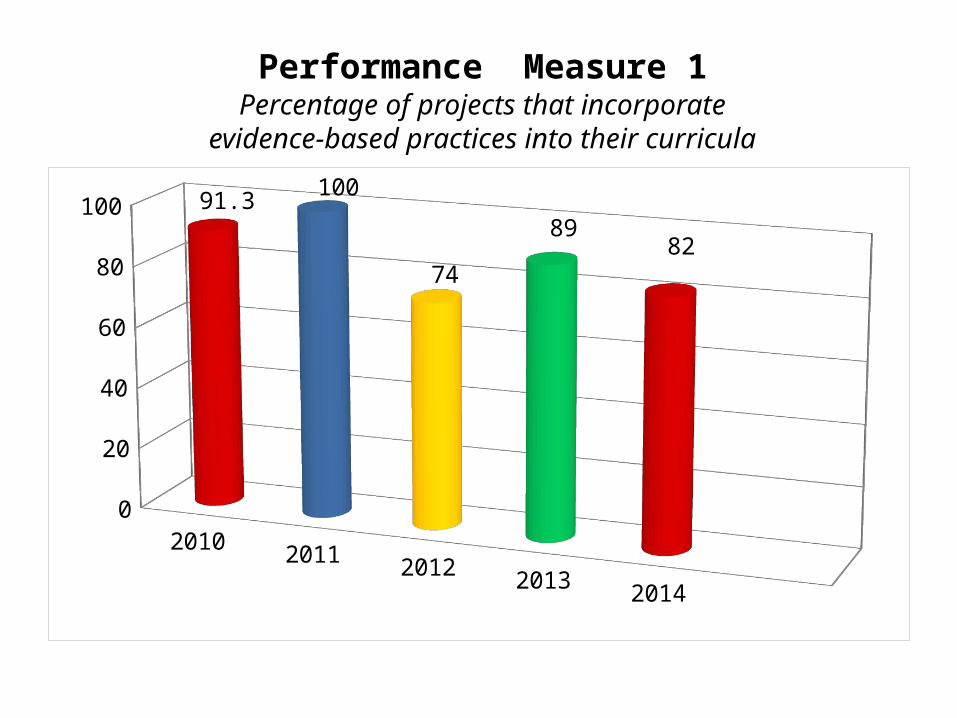
Performance Measure 1 Percentage of projects that incorporate
evidence-based practices into their curricula
2010 2011 2012 2013 2014
0102030405060708090
100 91.3 100
74
8982
7
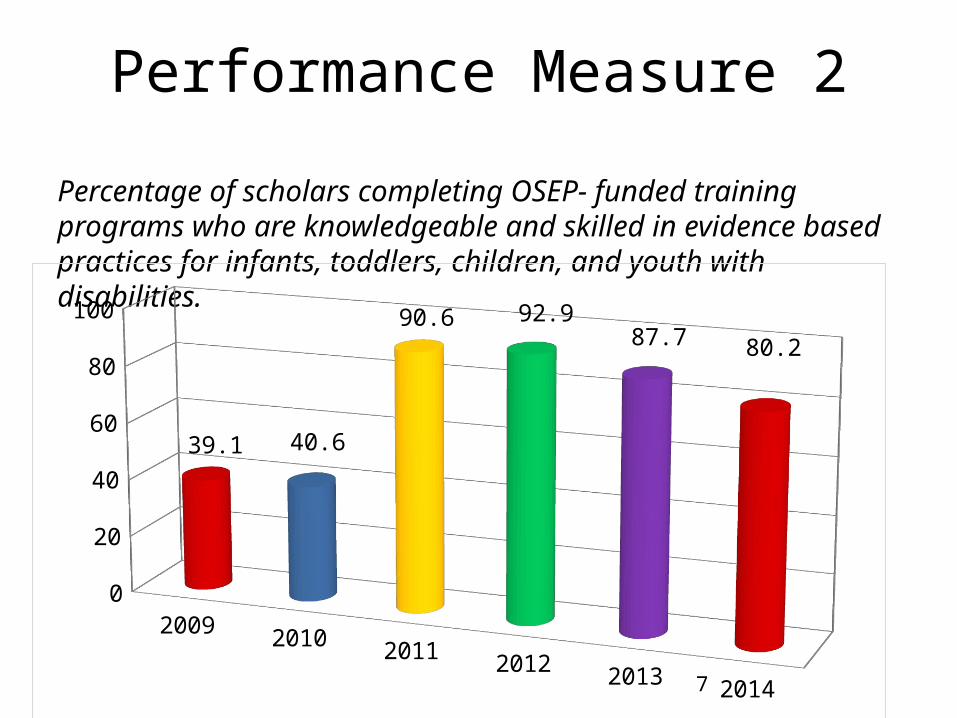
Performance Measure 2
Percentage of scholars completing OSEP- funded training programs who are knowledgeable and skilled in evidence based practices for infants, toddlers, children, and youth with disabilities.
2009 2010 2011 2012 2013 2014
0102030405060708090
100
39.1 40.6
90.6 92.987.7 80.2
8
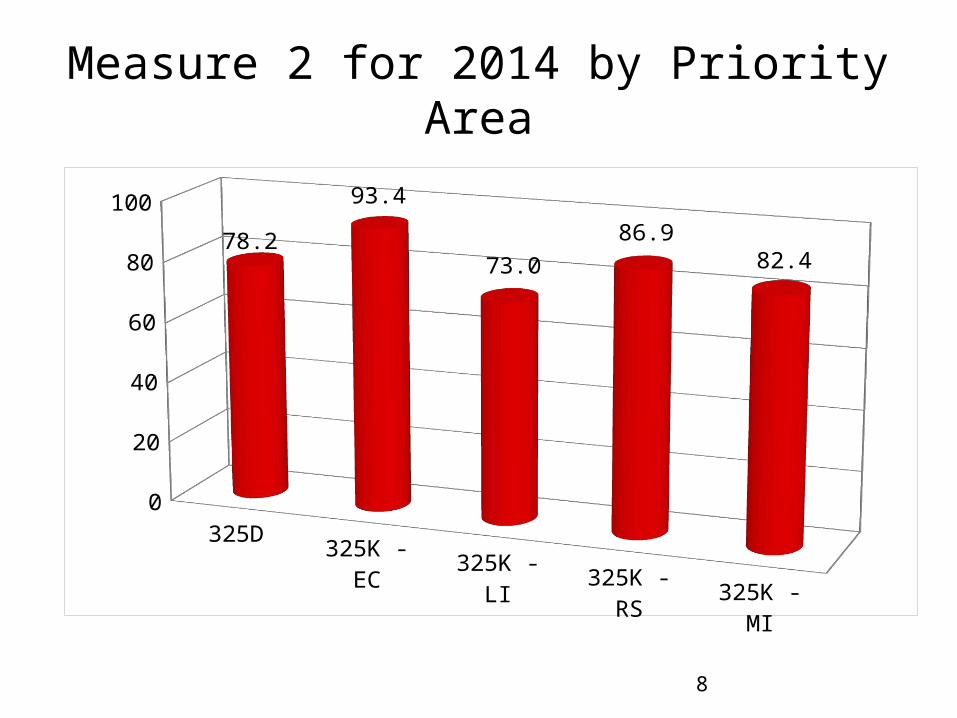
Measure 2 for 2014 by Priority Area
325D325K - EC
325K - LI325K - RS
325K - MI
0
20
40
60
80
100
78.2
93.4
73.086.9
82.4
9
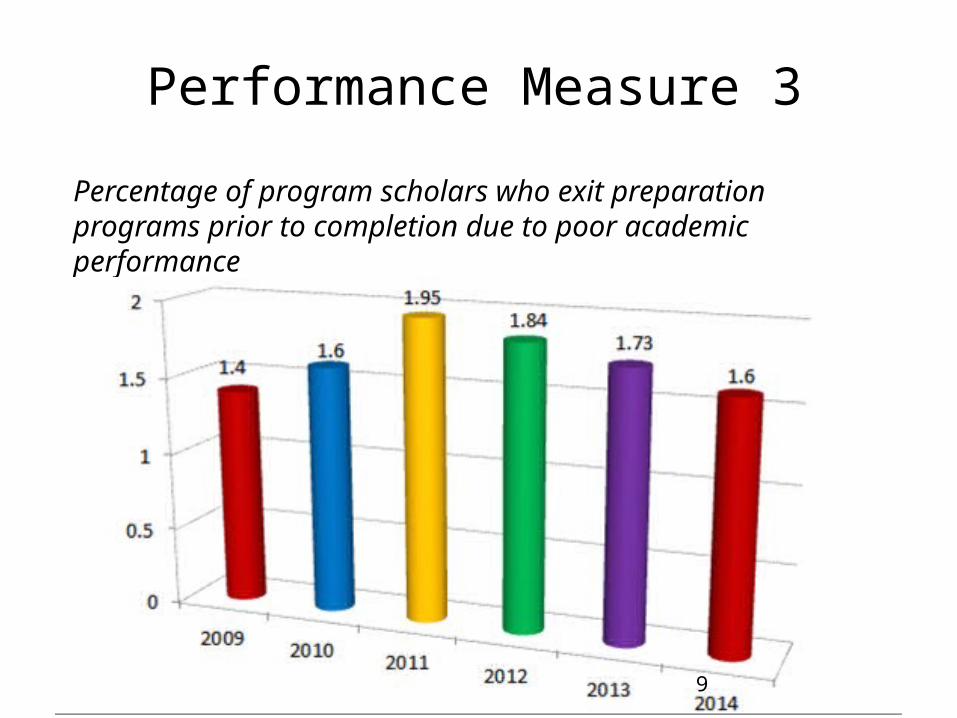
Performance Measure 3
Percentage of program scholars who exit preparation programs prior to completion due to poor academic performance
10
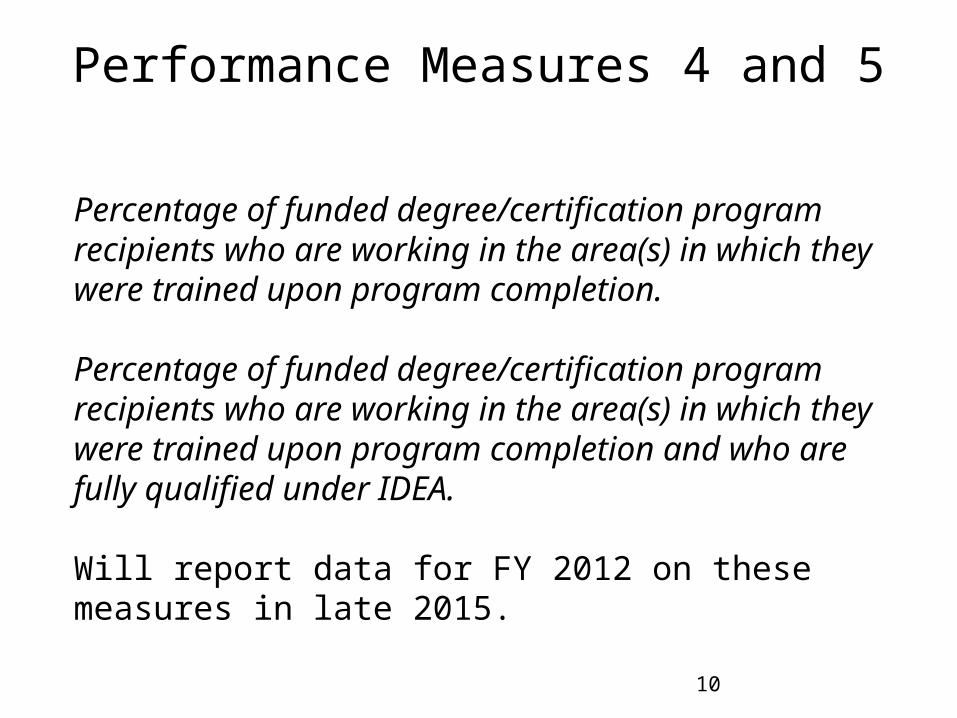
Performance Measures 4 and 5
Percentage of funded degree/certification program recipients who are working in the area(s) in which they were trained upon program completion.
Percentage of funded degree/certification program recipients who are working in the area(s) in which they were trained upon program completion and who are fully qualified under IDEA.
Will report data for FY 2012 on these measures in late 2015.
11
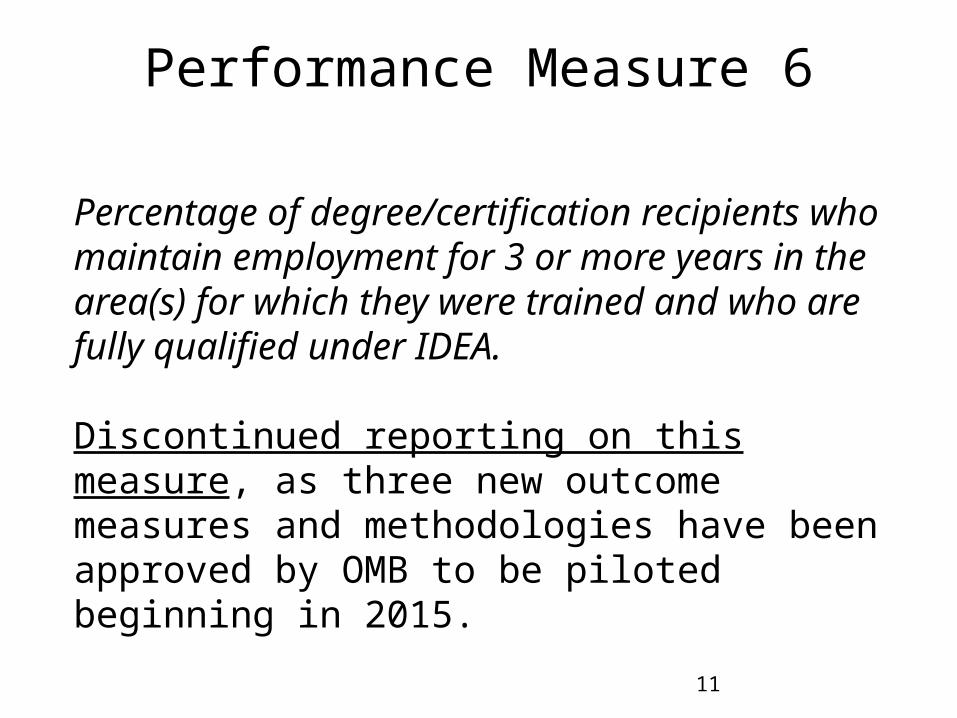
Performance Measure 6
Percentage of degree/certification recipients who maintain employment for 3 or more years in the area(s) for which they were trained and who are fully qualified under IDEA.
Discontinued reporting on this measure, as three new outcome measures and methodologies have been approved by OMB to be piloted beginning in 2015.
12
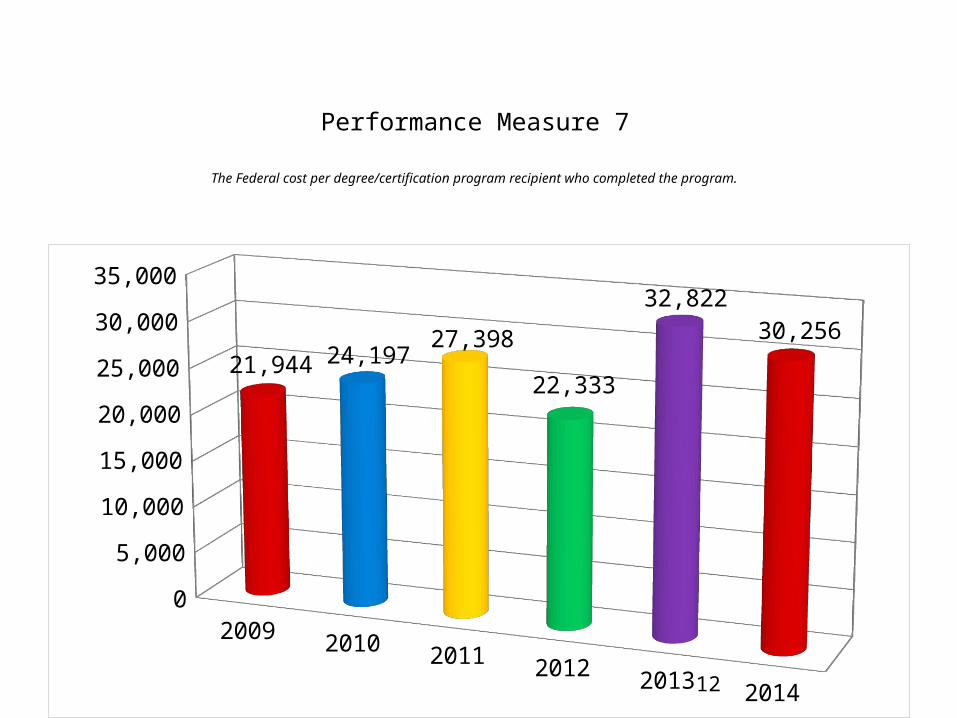
Performance Measure 7
The Federal cost per degree/certification program recipient who completed the program.
2009 2010 2011 2012 2013 2014
0
5,000
10,000
15,000
20,000
25,000
30,000
35,000
21,944 24,19727,398
22,333
32,82230,256
13
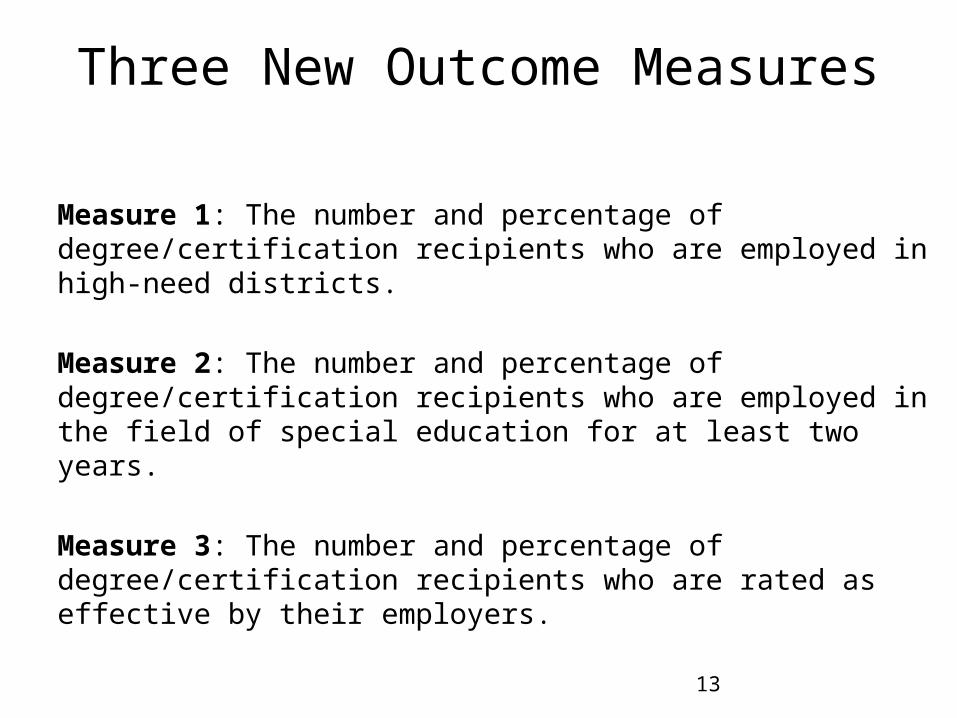
Three New Outcome Measures
Measure 1: The number and percentage of degree/certification recipients who are employed in high-need districts.
Measure 2: The number and percentage of degree/certification recipients who are employed in the field of special education for at least two years.
Measure 3: The number and percentage of degree/certification recipients who are rated as effective by their employers.
14
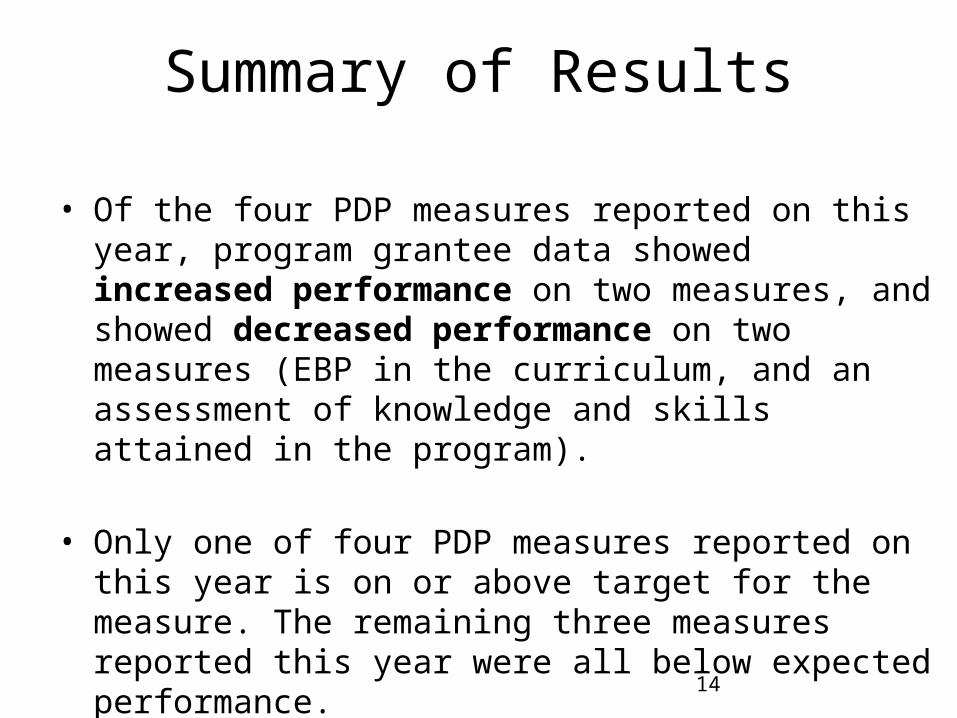
Summary of Results
• Of the four PDP measures reported on this year, program grantee data showed increased performance on two measures, and showed decreased performance on two measures (EBP in the curriculum, and an assessment of knowledge and skills attained in the program).
• Only one of four PDP measures reported on this year is on or above target for the measure. The remaining three measures reported this year were all below expected performance.

QUESTIONS? IDEAS?
16
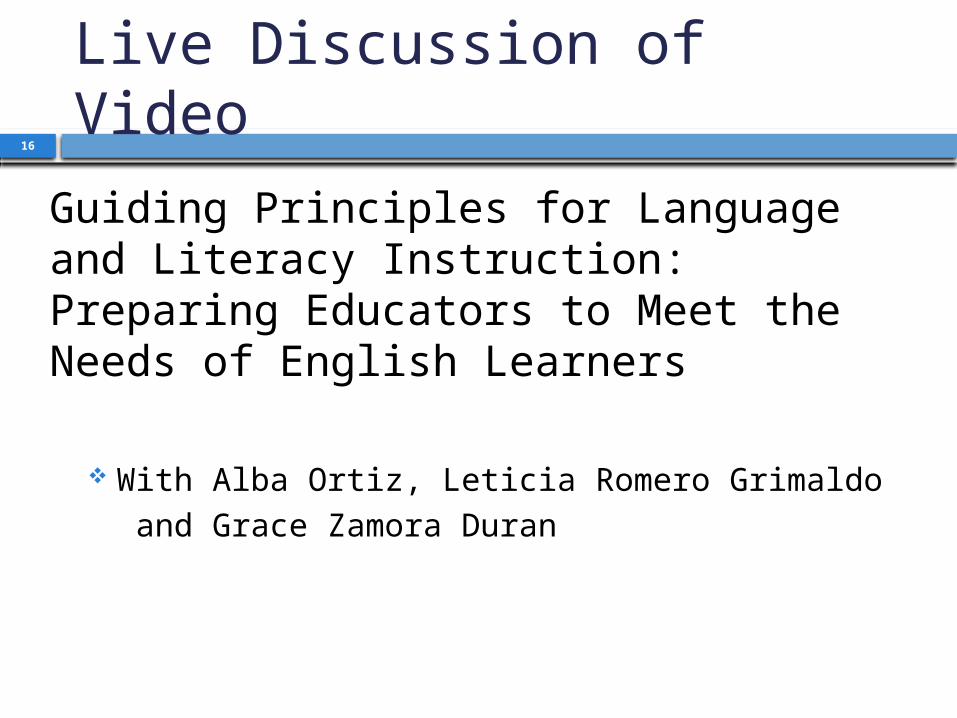
Live Discussion of Video
Guiding Principles for Language and Literacy Instruction: Preparing Educators to Meet the Needs of English Learners
With Alba Ortiz, Leticia Romero Grimaldo and Grace Zamora Duran
17
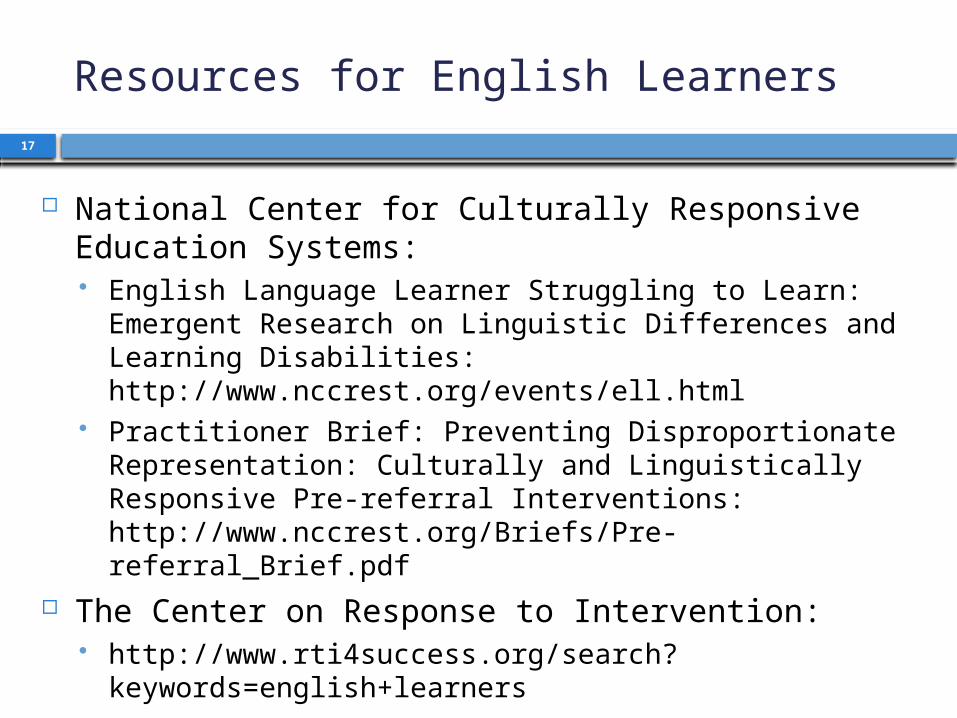
Resources for English Learners
National Center for Culturally Responsive Education Systems: English Language Learner Struggling to Learn: Emergent
Research on Linguistic Differences and Learning Disabilities: http://www.nccrest.org/events/ell.html
Practitioner Brief: Preventing Disproportionate Representation: Culturally and Linguistically Responsive Pre-referral Interventions: http://www.nccrest.org/Briefs/Pre-referral_Brief.pdf
The Center on Response to Intervention: http://www.rti4success.org/search?
keywords=english+learners
18
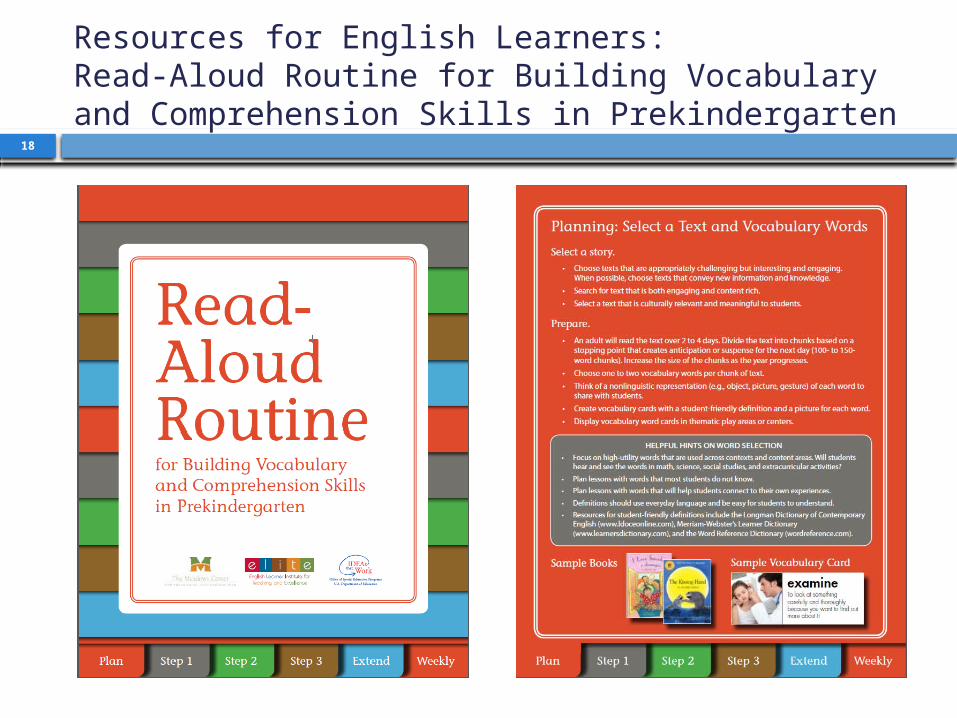
Resources for English Learners:Read-Aloud Routine for Building Vocabulary and Comprehension Skills in Prekindergarten
19
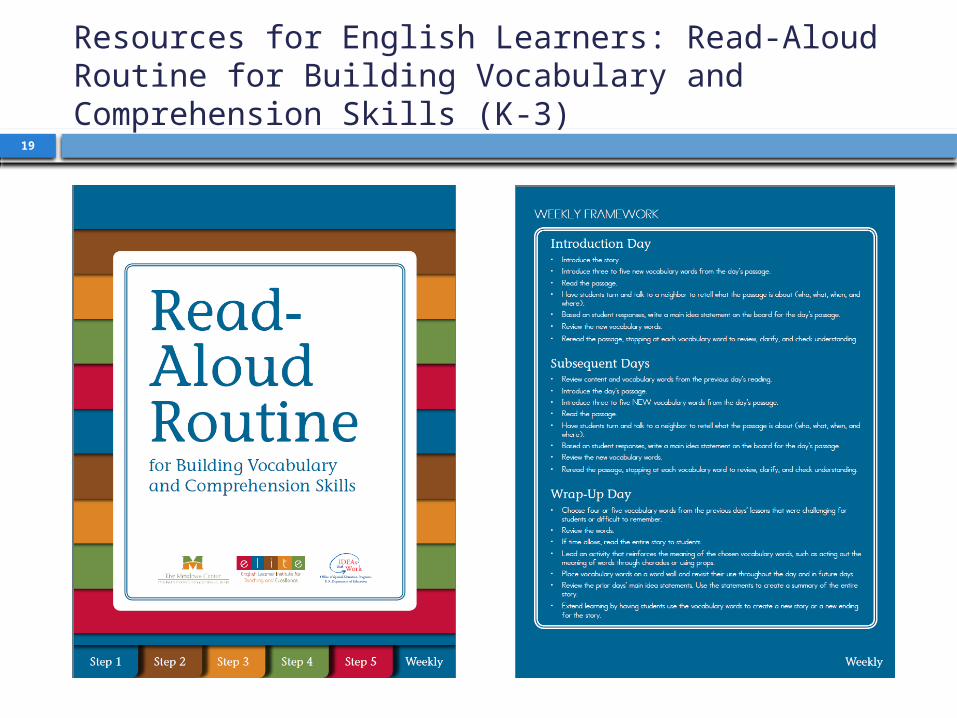
Resources for English Learners: Read-Aloud Routine for Building Vocabulary and Comprehension Skills (K-3)
20
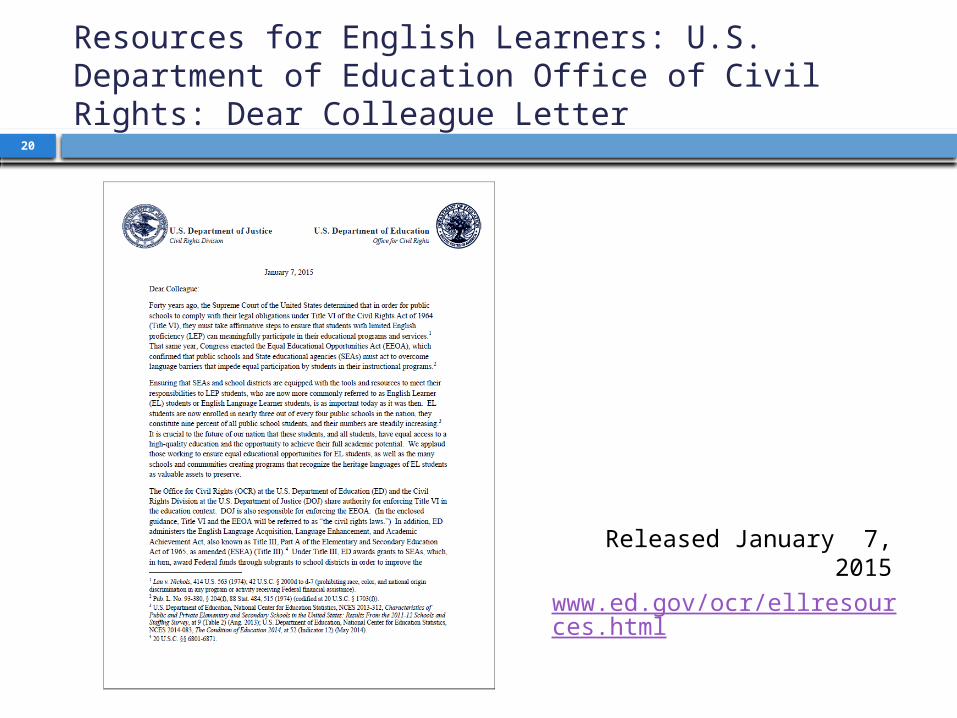
Resources for English Learners: U.S. Department of Education Office of Civil Rights: Dear Colleague Letter
Released January 7, 2015
www.ed.gov/ocr/ellresources.html
21
Considerations for Personnel Preparation Programs
What do scholars need to learn to be prepared for practice from the time they enter the school building?
What are you doing to address this priority area in your personnel preparation program?
How could personnel preparation be
enhanced to ensure program graduates will be effective in supporting practice aligned with priority area?
What could we do together to support this priority area?
For additional information -
Thanks for participating!