Embed Size (px)
Citation preview

WELCOMING+ SERIES: WELCOMING + ECONOMIC DEVELOPMENT
October 7, 2016
The webinar will begin shortly. If you experience a problem signing on, please contact the ReadyTalk Technical Support Line at 800.843.9166 for direct assistance.
#WelcomingPlus

Today’s Speakers
Ángel Ross
Research Associate,
PolicyLink
#WelcomingPlus
Justin Scoggins
Data Manager,
Program for Environmental and Regional Equity and the Center for the Study of Immigrant Integration at USC
Sloan Herrick
Deputy Director,
Global Detroit
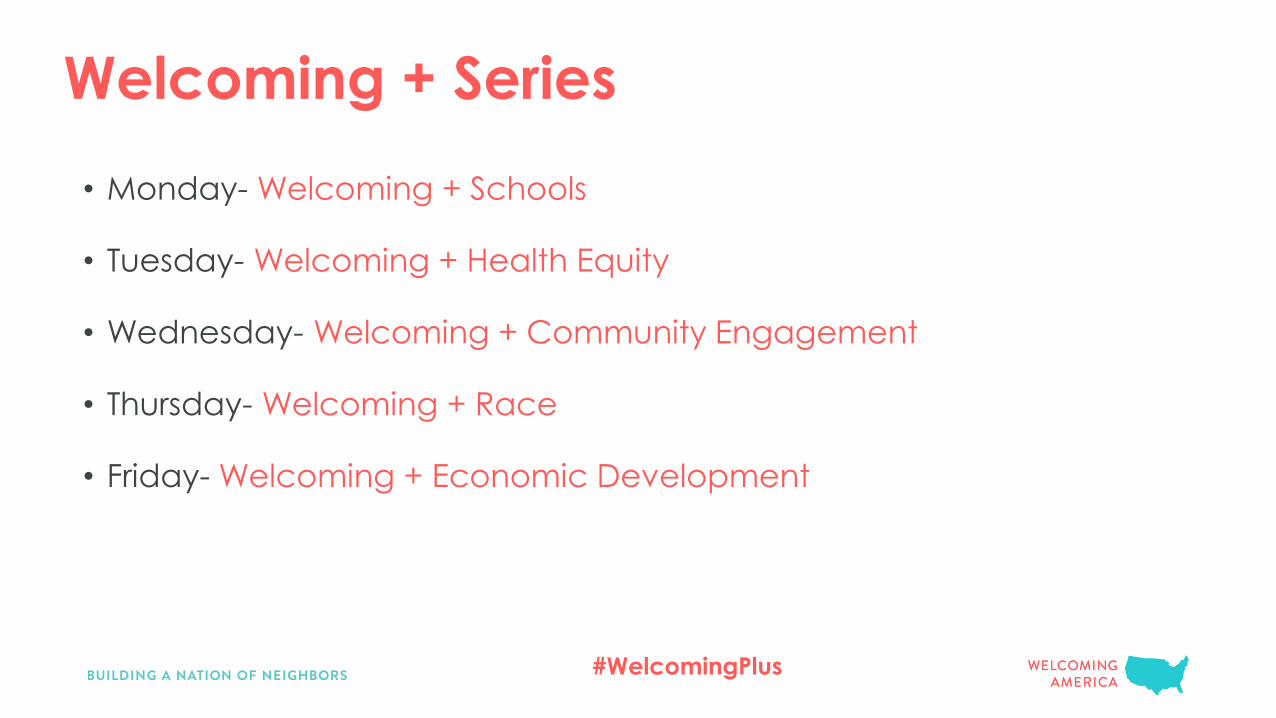
Welcoming + Series
• Monday- Welcoming + Schools
• Tuesday- Welcoming + Health Equity
• Wednesday- Welcoming + Community Engagement
• Thursday- Welcoming + Race
• Friday- Welcoming + Economic Development
#WelcomingPlus

Keep it Social
• Use the hashtag #WelcomingPlus
• Tweet something profound you hear
• Retweet something profound
• Tweet us your questions
(you can still send questions through ReadyTalkChat)
#WelcomingPlus

Welcoming America
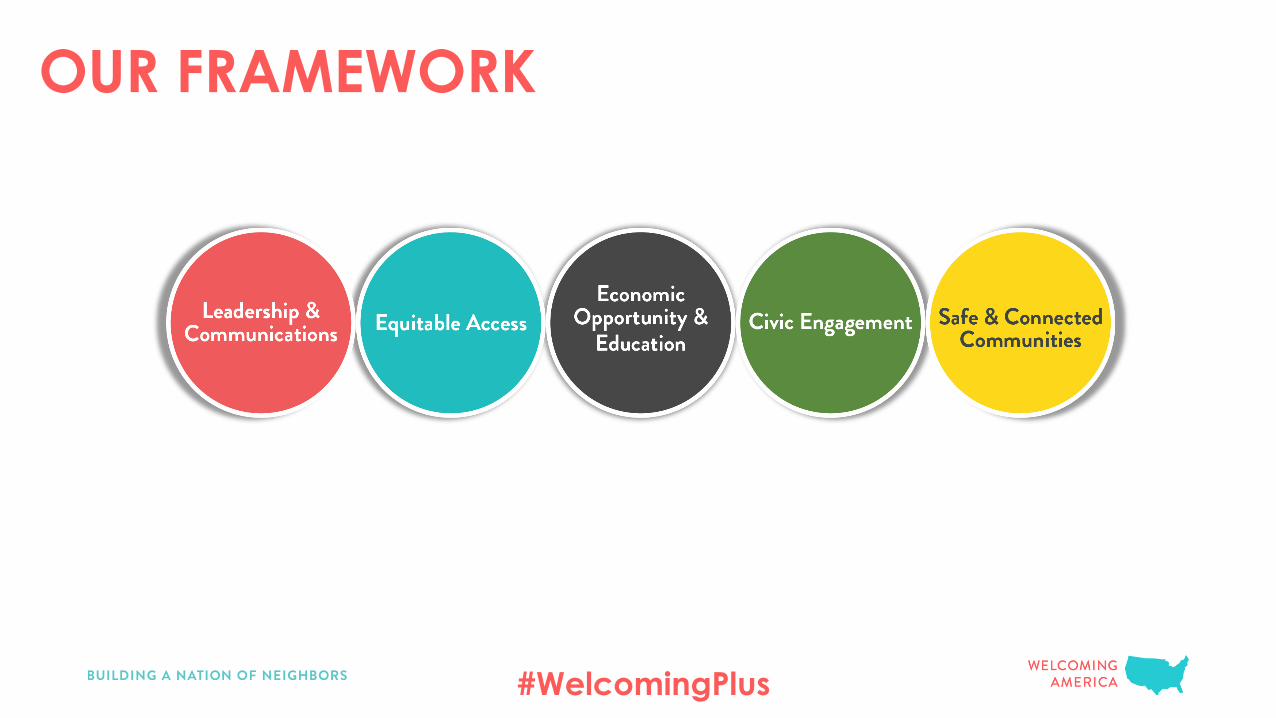
OUR FRAMEWORK
#WelcomingPlus
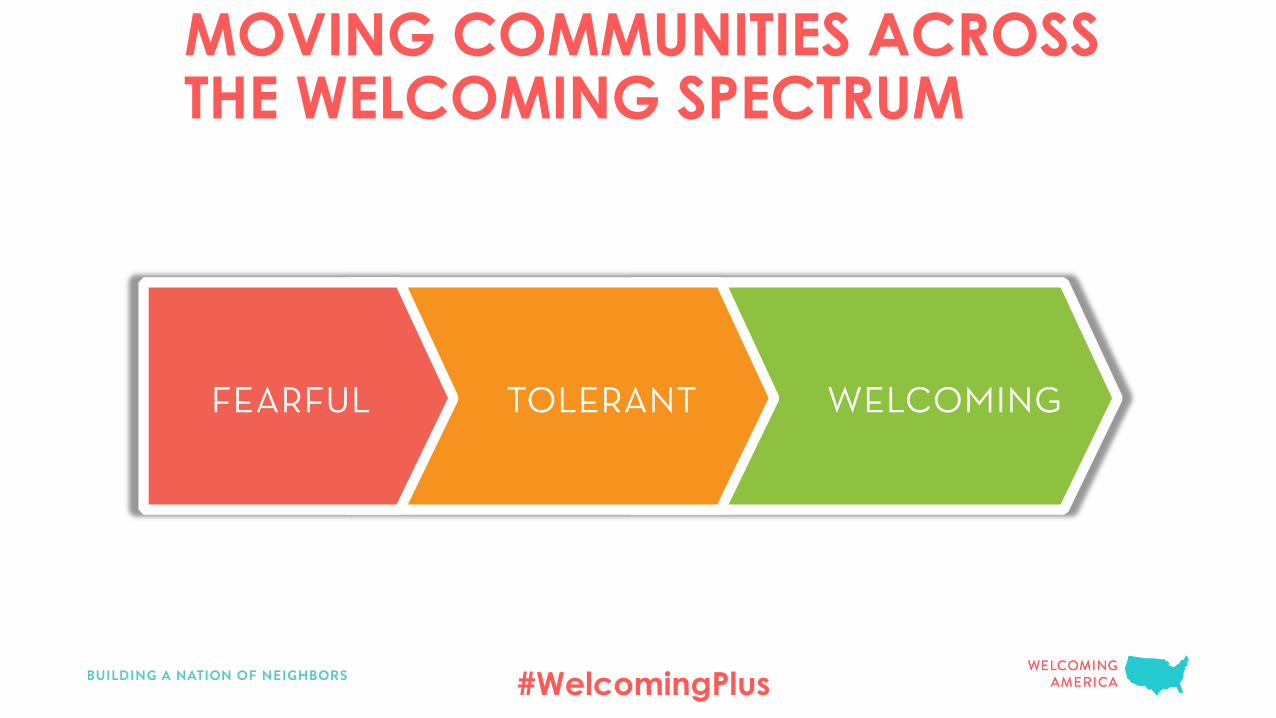
MOVING COMMUNITIES ACROSS THE WELCOMING SPECTRUM
#WelcomingPlus
The Economic Development Imperative of Welcoming
SLOAN HERRICK Global Detroit + Welcoming Economies Global Network

WHY A REGIONAL NETWORK?

DATA DRIVEN
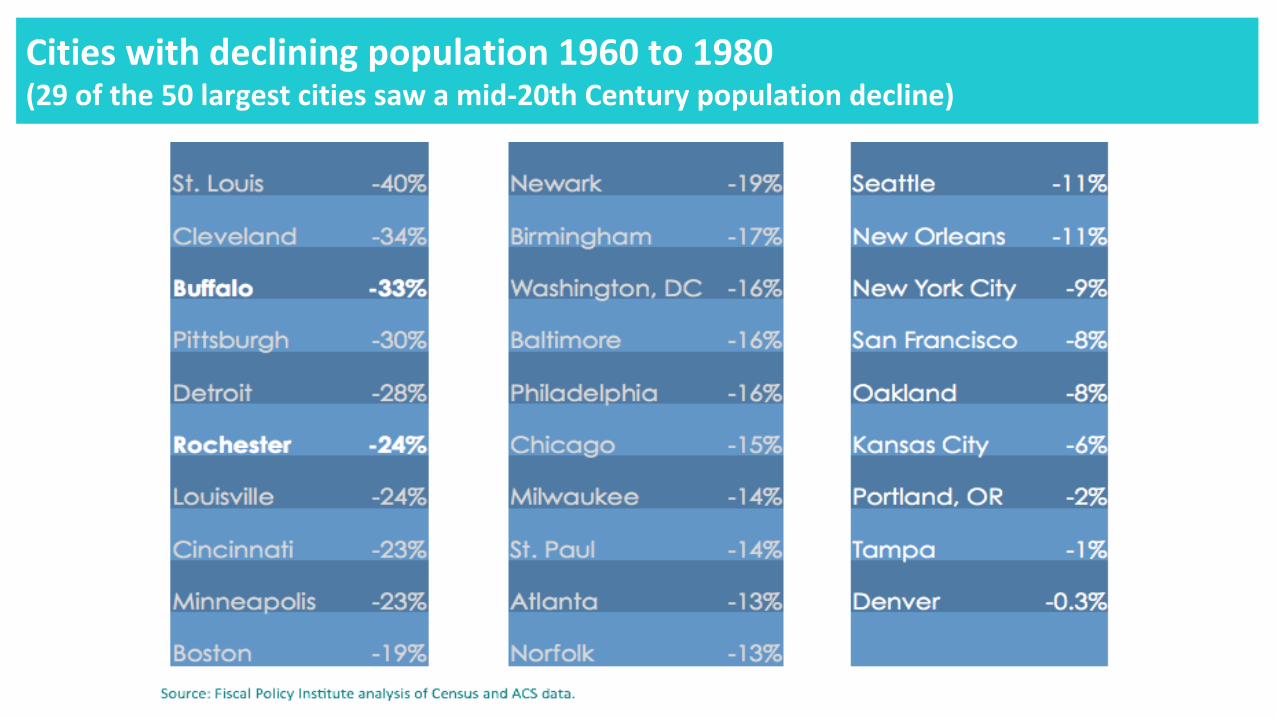
Cities with declining population 1960 to 1980(29 of the 50 largest cities saw a mid-20th Century population decline)
Of the 29 declining cities, 14 rebounded with an increase in population 1980 to 2013
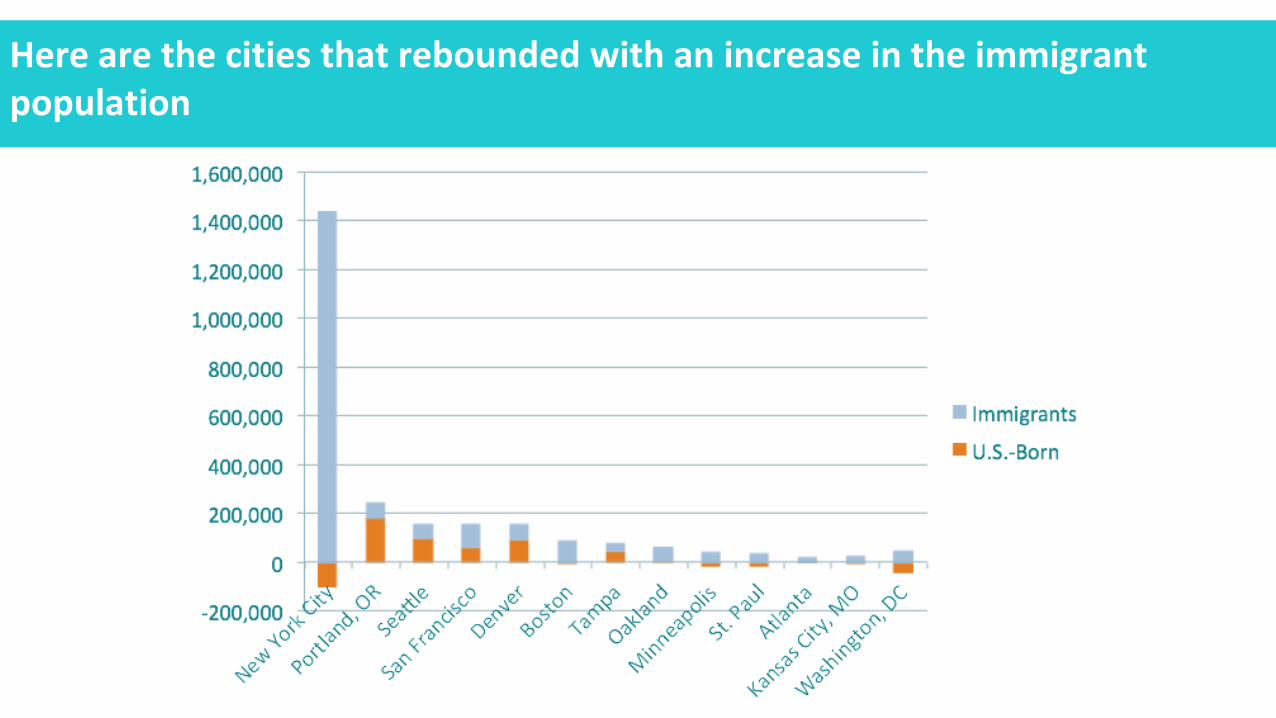
Here are the cities that rebounded with an increase in the immigrant population
Here are the cities that rebounded without an increase in immigrant
population

There are none
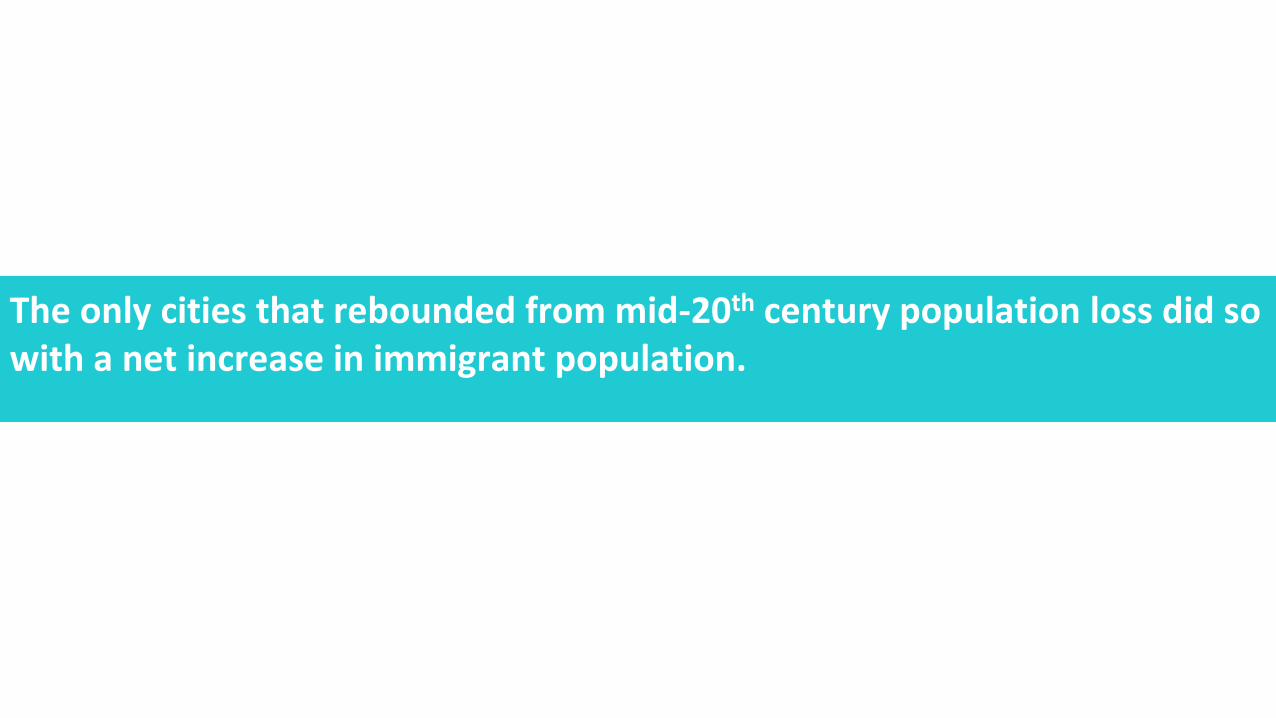
The only cities that rebounded from mid-20th century population loss did so with a net increase in immigrant population.
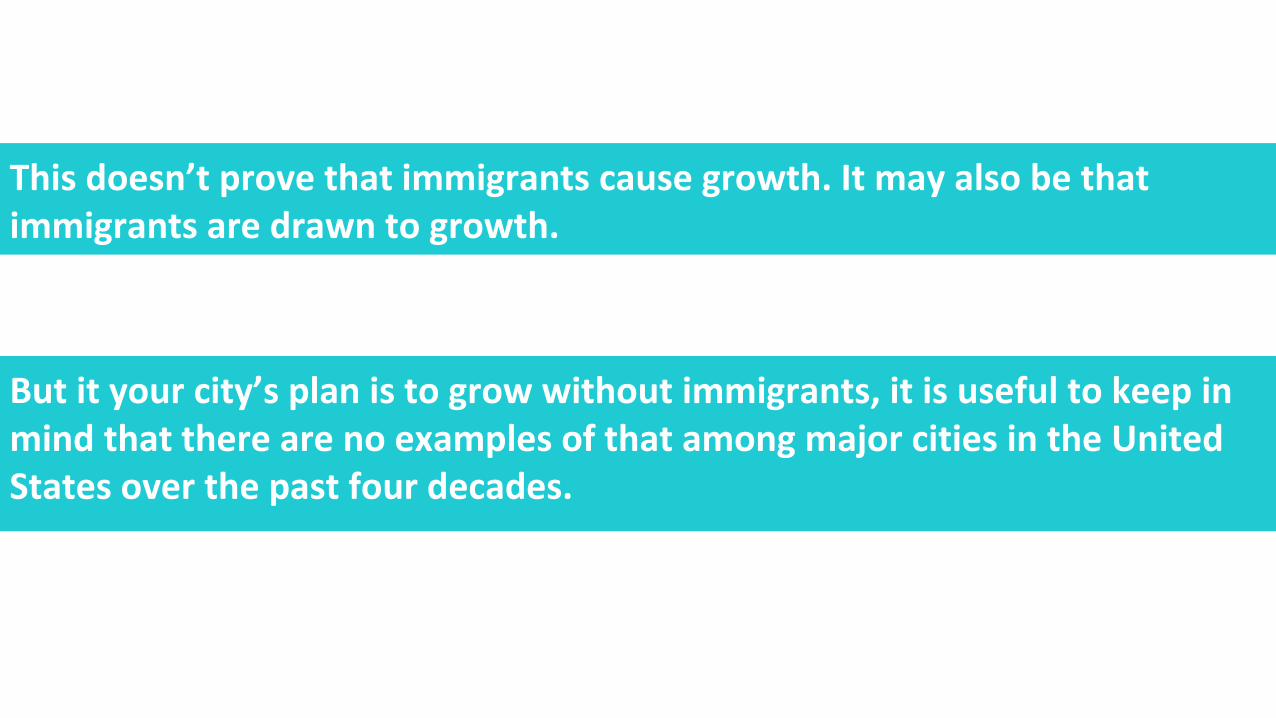
This doesn’t prove that immigrants cause growth. It may also be that immigrants are drawn to growth.
But it your city’s plan is to grow without immigrants, it is useful to keep in mind that there are no examples of that among major cities in the United States over the past four decades.

WHAT DOES ALL OF THIS HAVE TO DO
WITH WELCOMING?

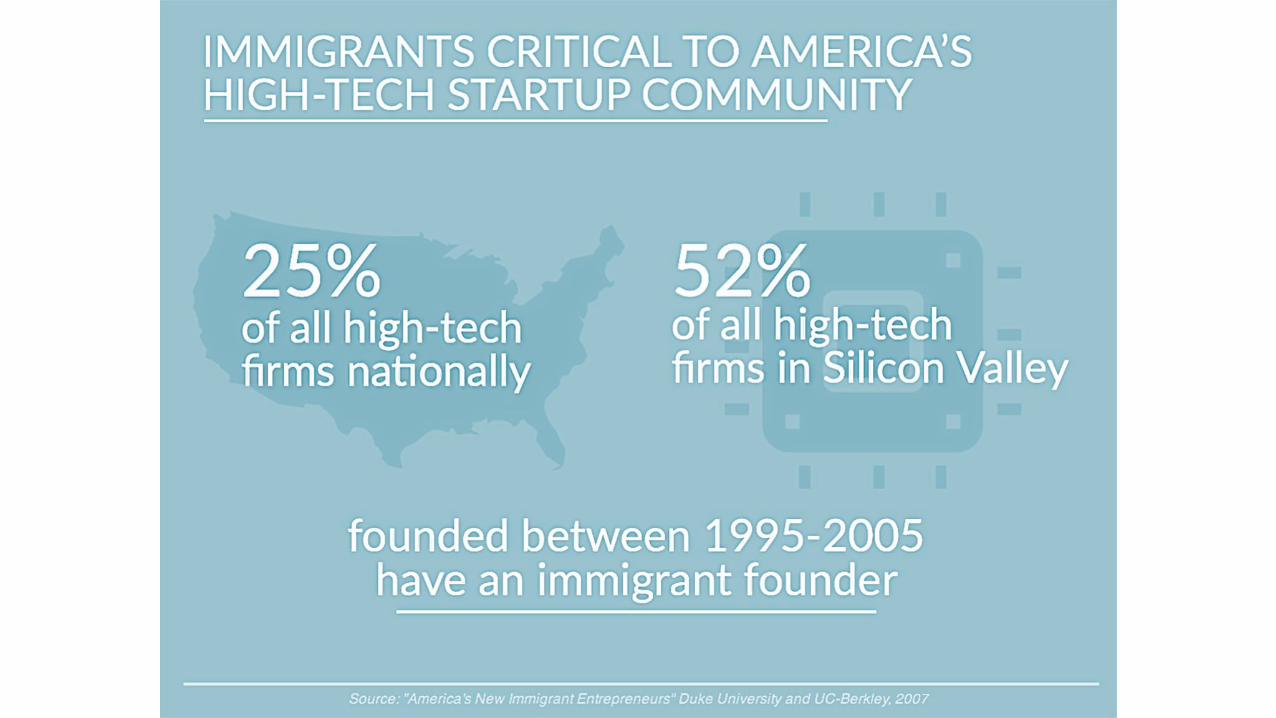
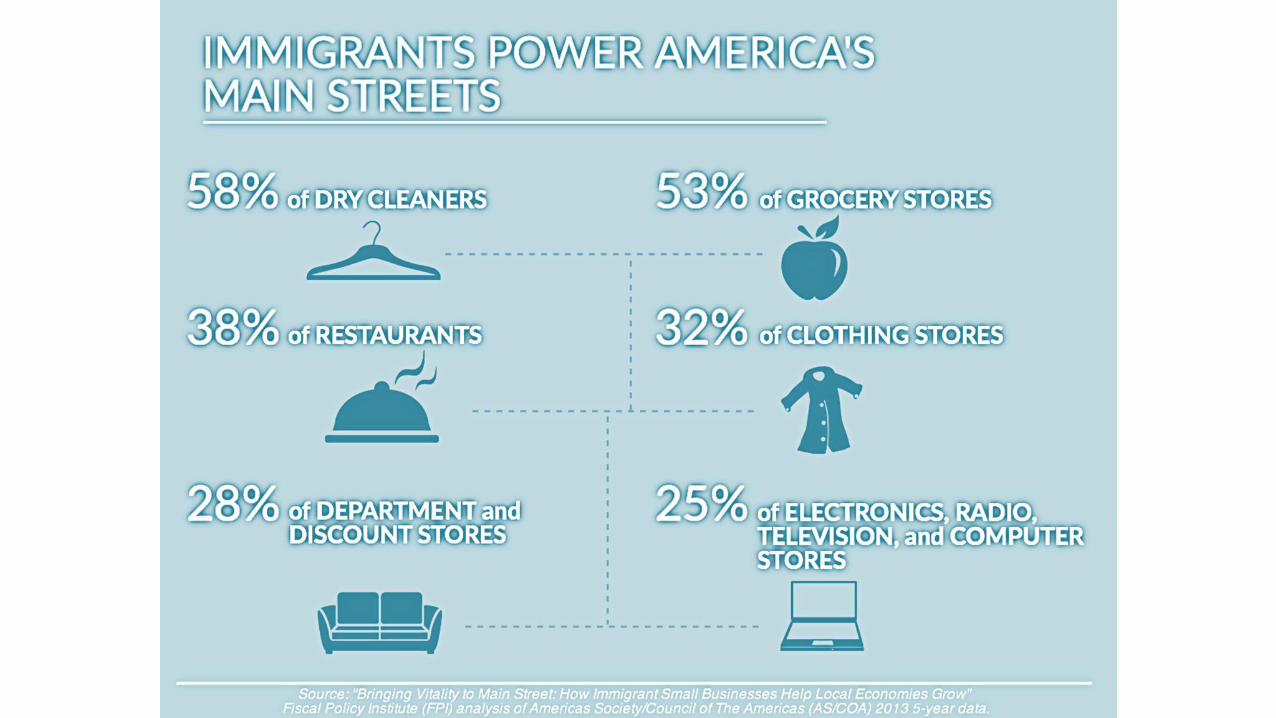
ENTREPRENEURSHIP

SEEDS OF GROWTH:
BUILDING YOUR
LOCAL ECONOMY BY
SUPPORTING
IMMIGRANT
ENTREPREURS
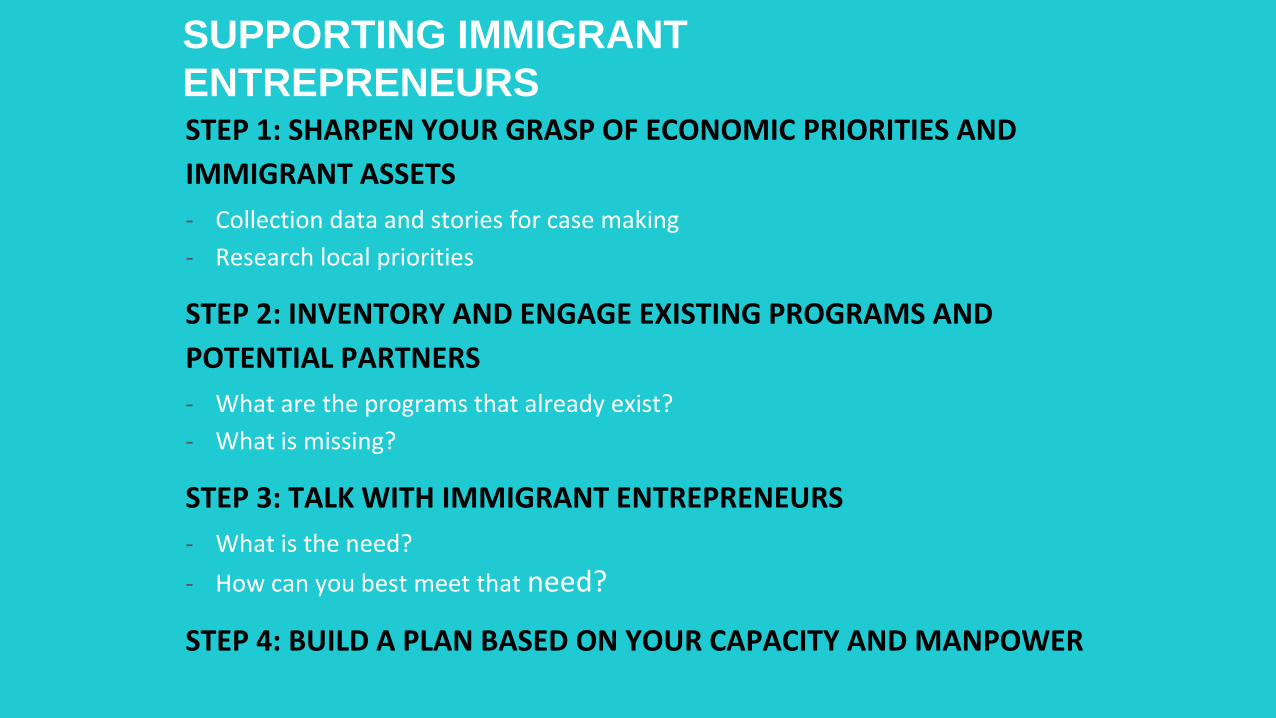
SUPPORTING IMMIGRANT
ENTREPRENEURSSTEP 1: SHARPEN YOUR GRASP OF ECONOMIC PRIORITIES AND
IMMIGRANT ASSETS
- Collection data and stories for case making
- Research local priorities
STEP 2: INVENTORY AND ENGAGE EXISTING PROGRAMS AND
POTENTIAL PARTNERS
- What are the programs that already exist?
- What is missing?
STEP 3: TALK WITH IMMIGRANT ENTREPRENEURS
- What is the need?
- How can you best meet that need?
STEP 4: BUILD A PLAN BASED ON YOUR CAPACITY AND MANPOWER
MEET THE NEEDS OF ALL LOCAL ENTREPRENEURS
“The barriers that immigrant [business owners] are
facing are often the same that residents are facing...
What’s good for immigrants is good for everyone.”
- Jennifer Rodriguez
President and CEO of the Greater Philadelphia Hispanic Chamber of
Commerce.
HOW CAN YOU SUPPORT IMMIGRANT AND MINORITY ENTREPRENEURS?
FOUR EASY WAYS TO START
- Be a champion
- Be a connector
- Fill program gaps
DEVELOPING A WELCOMING AND INCLUSIVE APPROACH
- Partner with trusted organizations
- Go to your customer
- Develop strong relationships
- Be culturally competent and linguistically accessible
- Be inclusive

WANT TO LEARN MORE ABOUT WELCOMING +
ECONOMIC DEVELOPMENT?

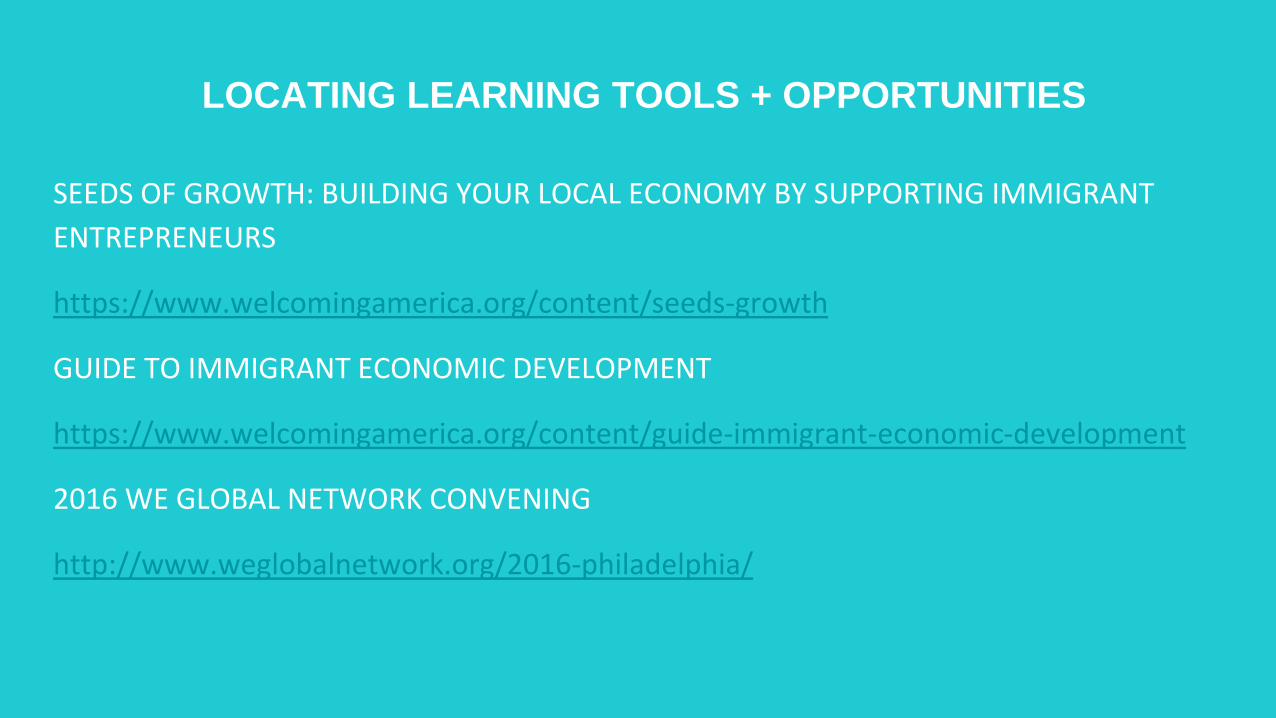
LOCATING LEARNING TOOLS + OPPORTUNITIES
SEEDS OF GROWTH: BUILDING YOUR LOCAL ECONOMY BY SUPPORTING IMMIGRANT
ENTREPRENEURS
https://www.welcomingamerica.org/content/seeds-growth
GUIDE TO IMMIGRANT ECONOMIC DEVELOPMENT
https://www.welcomingamerica.org/content/guide-immigrant-economic-development
2016 WE GLOBAL NETWORK CONVENING
http://www.weglobalnetwork.org/2016-philadelphia/


Thank you!
SLOAN HERRICK Global Detroit + Welcoming Economies Global Network
QUESTIONS?
Use the “Questions” box to submit questions
Or
Keep it Social: Tweet Your Questions
“Q: type your question #welcomingplus”

KEEP UP WITH WELCOMING AMERICA
WelcomingAmerica.org
Like us on Facebook
facebook.com/WelcomingAmerica
Follow us on Twitter
@WelcomingUSA
Subscribe to our YouTube Channel
youtube.com/WelcomingAmerica
Connect with us on LinkedIn
linkedin.com/company/welcoming-america
National Equity AtlasData to Advance Equitable GrowthOctober 7, 2016
The National Equity Atlas is a comprehensive resource for data to track, measure, and make the case for inclusive growth in America’s cities, regions, states, and nationwide.
• Produced by PolicyLink and the USC Program for Environmental and Regional Equity (PERE)
• A tool to help communities understand changing demographics and how well they are doing on a series of equity indicators
National Equity Atlas
What is an equitable region?
Regions are equitable with all residents – regardless of their race/ethnicity, nativity, gender, or neighborhood of residence – are fully able to participate in the region’s economic vitality, contribute to the region’s readiness for the future, and connect to the region’s assets and resources.
Immigrant Integration is…
improved economic mobility for,enhanced civic participation by,and receiving society openness to,
immigrants.
• Immigrants are drivers of population growth and economic prosperity
• But there are barriers to full economic and civic participation
• Removing barriers will benefit both immigrants and U.S.-born
Why does it matter?

The Face of America is Changing
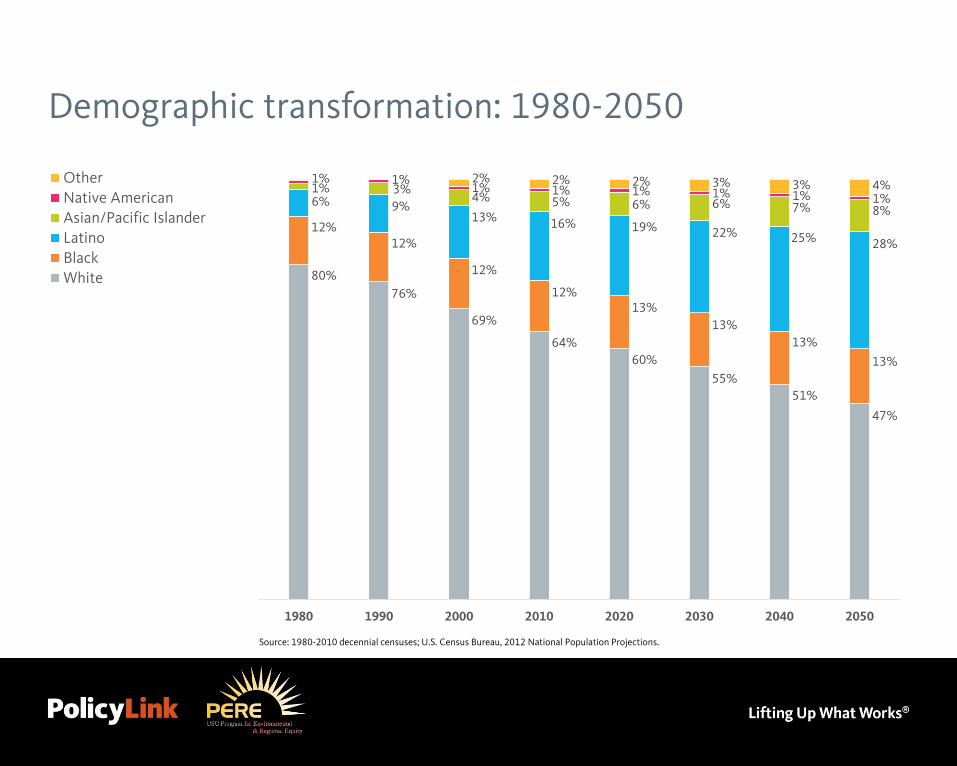
Demographic transformation: 1980-2050
80%
76%
69%
64%
60%
55%
51%
47%
12%12%
12%
12%13%
13%
13%
13%
6% 9%13% 16% 19% 22% 25% 28%
1% 3%4% 5% 6% 6% 7% 8%
1% 1%1% 1% 1% 1% 1% 1%
2% 2% 2% 3% 3% 4%
1980 1990 2000 2010 2020 2030 2040 2050
Source: 1980-2010 decennial censuses; U.S. Census Bureau, 2012 National Population Projections.
80%
76%
69%
64%60%
55%51%
47%
12%12%
12%
12%13%
13%13%
13%
6% 9%13% 16% 19% 22% 25% 28%
1% 3%4% 5% 6% 6% 7% 8%
1% 1%1% 1% 1% 1% 1% 1%
2% 2% 2% 3% 3% 4%
1980 1990 2000 2010 2020 2030 2040 2050
Other
Native American
Asian/Pacific Islander
Latino
Black
White
Source: 1980-2010 decennial censuses; U.S. Census Bureau, 2012 National Population Projections.
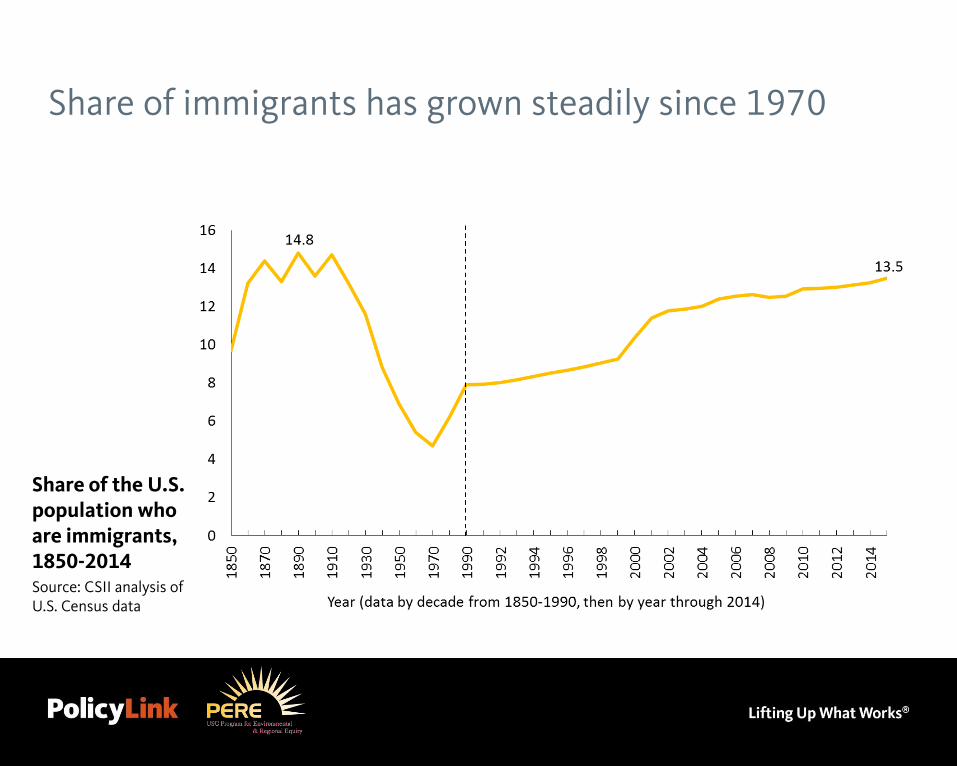
Share of immigrants has grown steadily since 1970
Share of the U.S. population who are immigrants, 1850-2014Source: CSII analysis of U.S. Census data
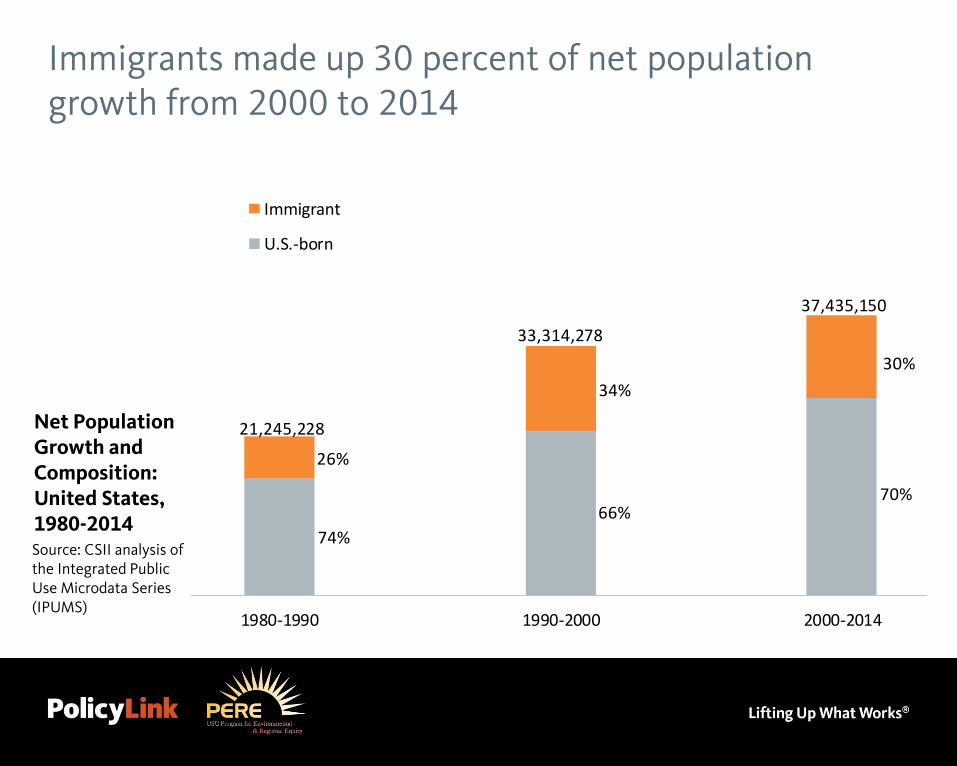
Net Population Growth and Composition: United States, 1980-2014Source: CSII analysis of the Integrated Public Use Microdata Series (IPUMS)
1980-1990 1990-2000 2000-2014
Net Population Growth and Composition, 1980-2014United States
Immigrant
U.S.-born
21,245,228
26%
33,314,278
37,435,150
74%
34%
66%
30%
70%
Source: CSII analysis of data from the Integrated Public Use Microdata Series (IPUMS).
Immigrants made up 30 percent of net population growth from 2000 to 2014
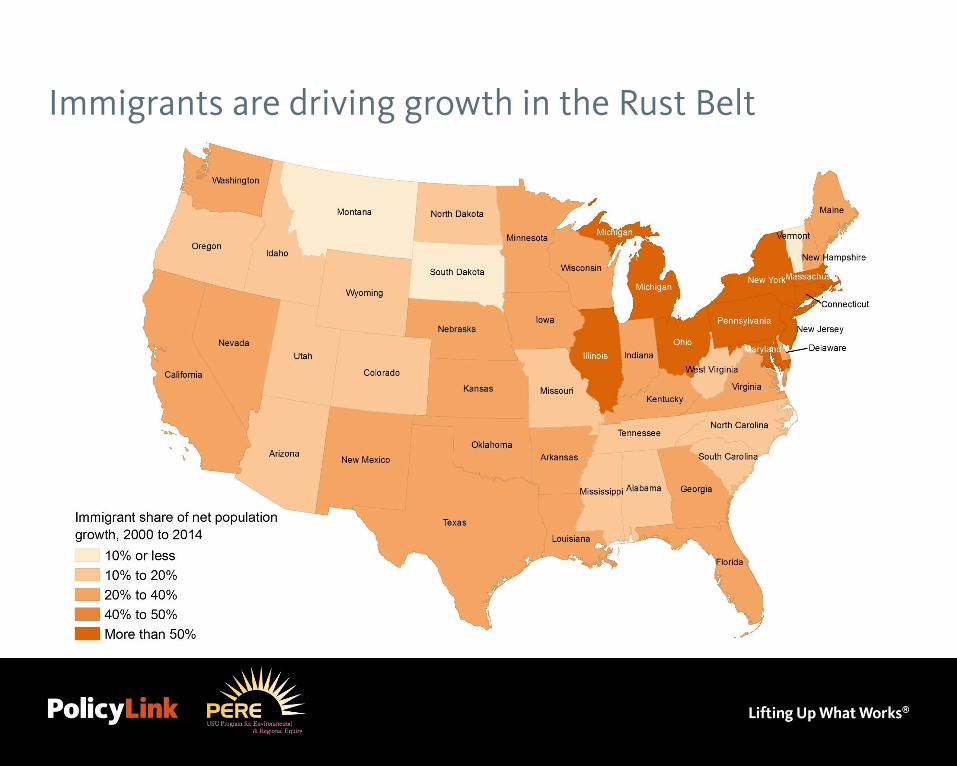
Immigrants are driving growth in the Rust Belt
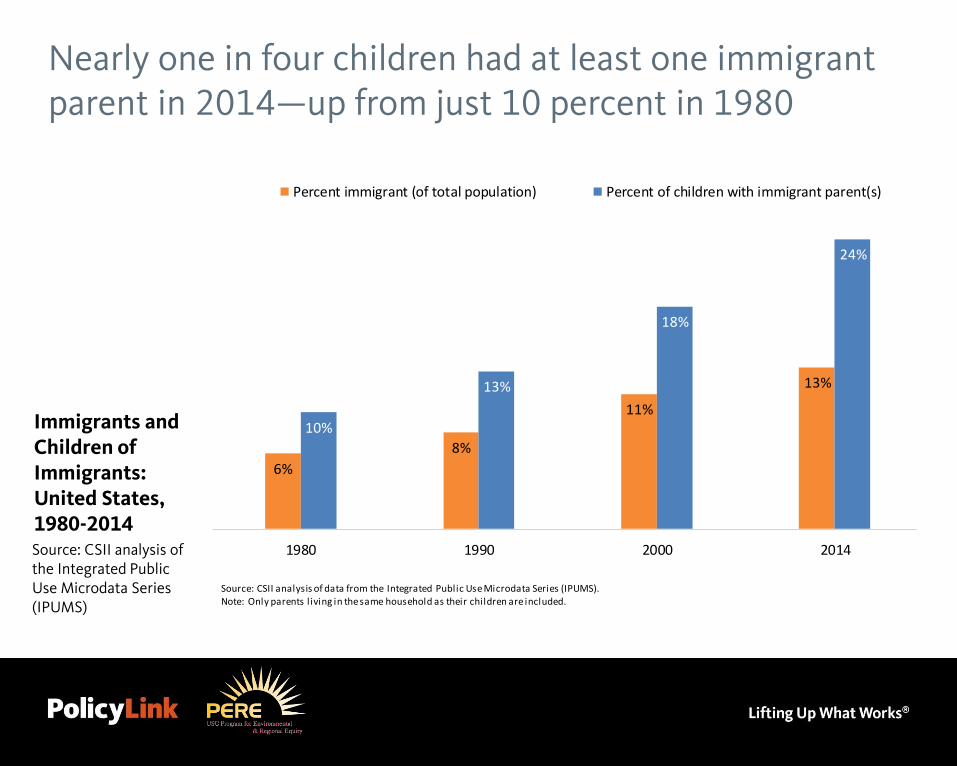
Immigrants and Children of Immigrants: United States, 1980-2014Source: CSII analysis of the Integrated Public Use Microdata Series (IPUMS)
6%
8%
11%
13%
10%
13%
18%
24%
1980 1990 2000 2014
Immigrants and Children of Immigrants, 1980-2014United States
Percent immigrant (of total population) Percent of children with immigrant parent(s)
Source: CSII analysis of data from the Integrated Public Use Microdata Series (IPUMS). Note: Only parents l iving in the same household as their children are included.
Nearly one in four children had at least one immigrant parent in 2014—up from just 10 percent in 1980
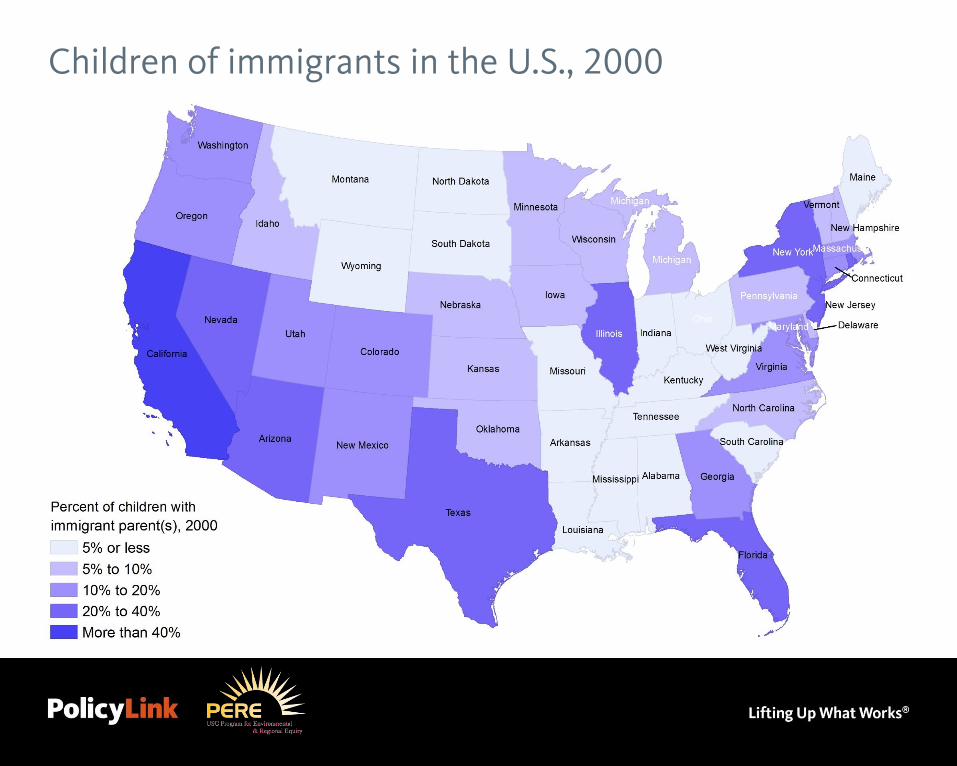
Children of immigrants in the U.S., 2000
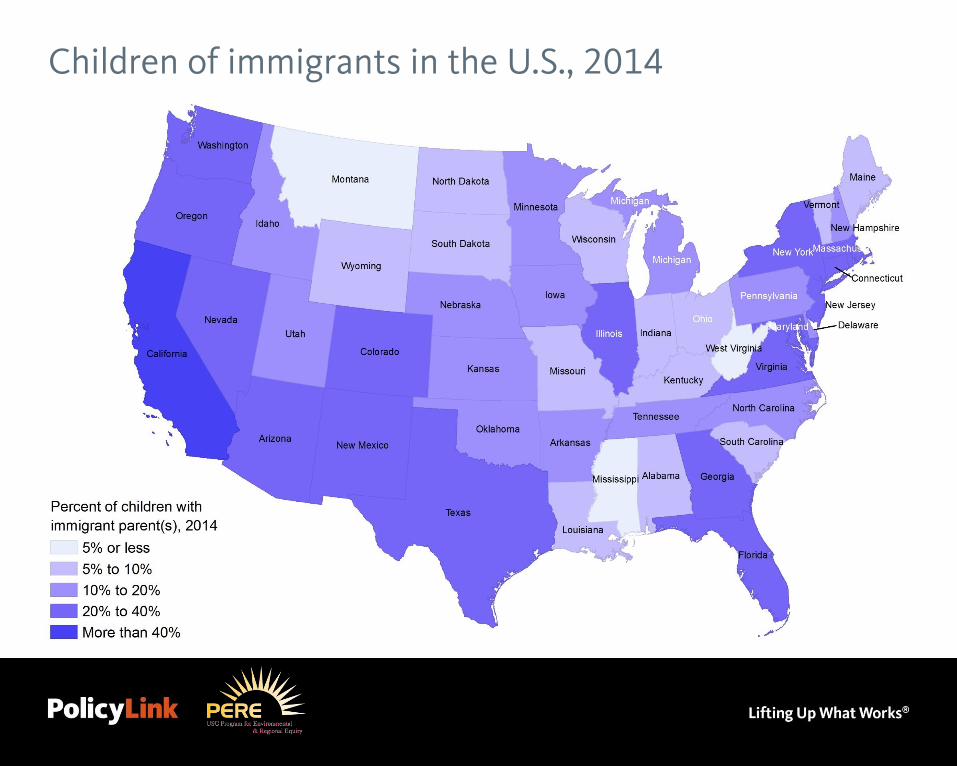
Children of immigrants in the U.S., 2014
Inequity Hinders Economic Prosperity
Image source: KCRW.
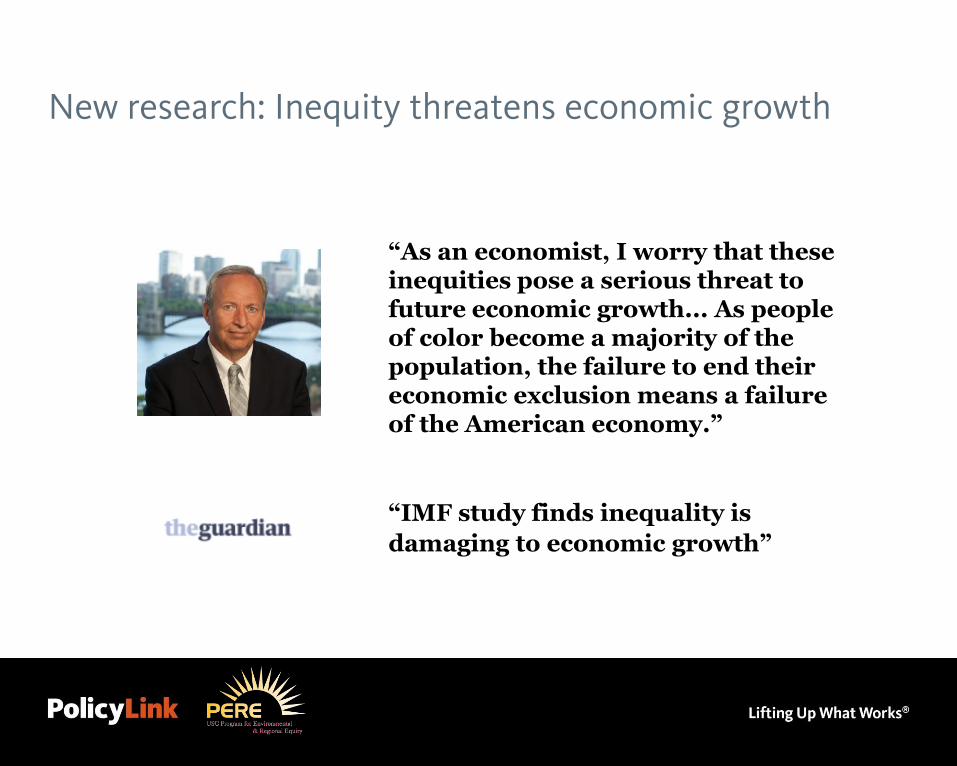
New research: Inequity threatens economic growth
“As an economist, I worry that these inequities pose a serious threat to future economic growth... As people of color become a majority of the population, the failure to end their economic exclusion means a failure of the American economy.”
“IMF study finds inequality is
damaging to economic growth”
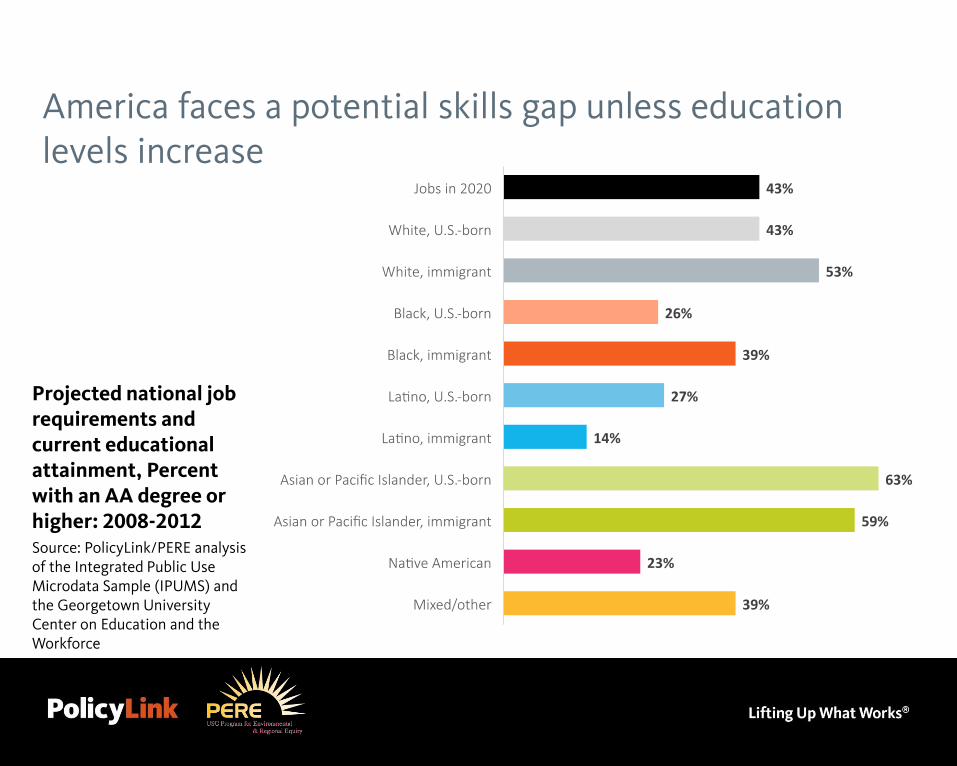
America faces a potential skills gap unless education levels increase
Projected national job requirements and current educational attainment, Percent with an AA degree or higher: 2008-2012Source: PolicyLink/PERE analysis of the Integrated Public Use Microdata Sample (IPUMS) and the Georgetown University Center on Education and the Workforce
Equity Is the Superior Growth Model
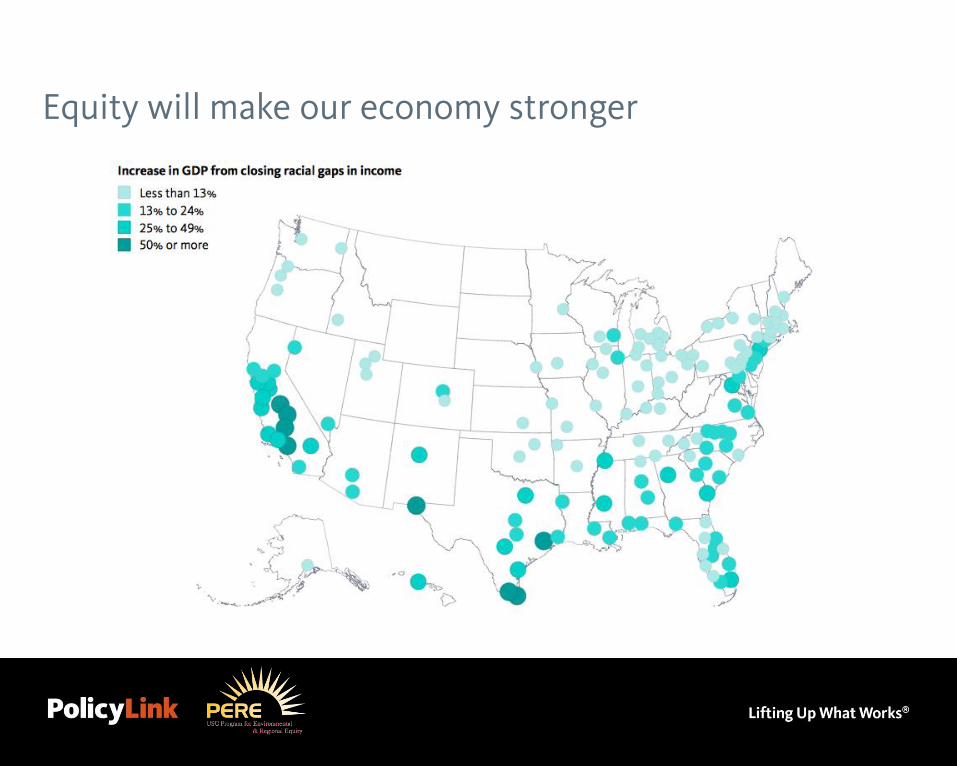
Equity will make our economy stronger
Getting to Inclusive Growth: Strategies
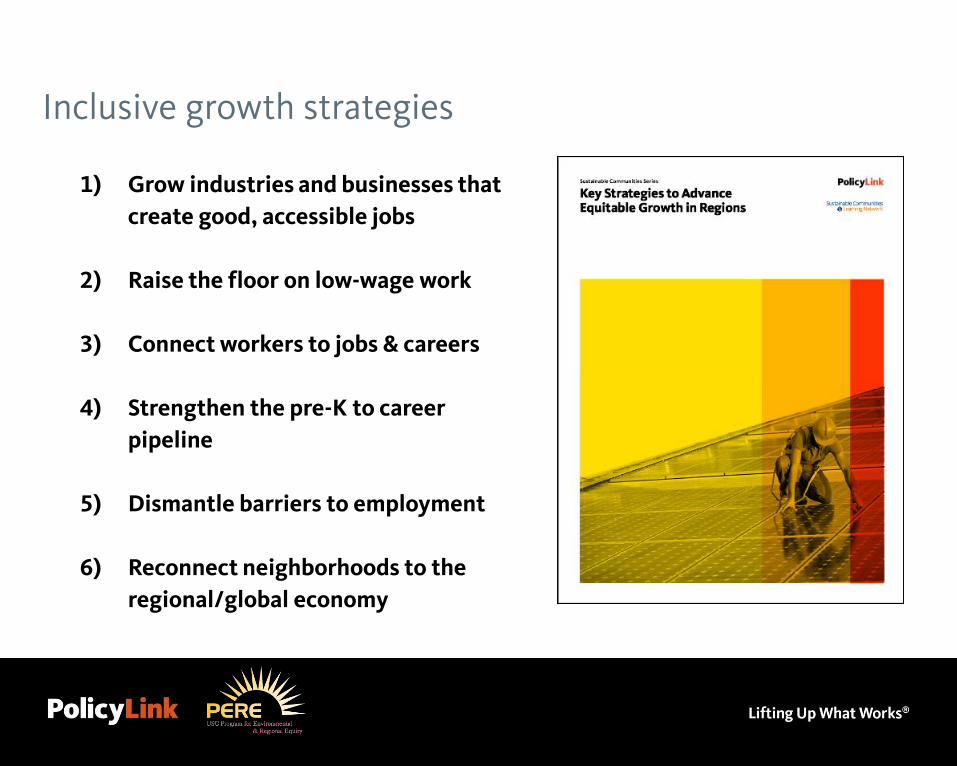
Inclusive growth strategies
1) Grow industries and businesses that
create good, accessible jobs
2) Raise the floor on low-wage work
3) Connect workers to jobs & careers
4) Strengthen the pre-K to career
pipeline
5) Dismantle barriers to employment
6) Reconnect neighborhoods to the
regional/global economy
Image source: KQED.
Tailoring the Frame: Going Regional
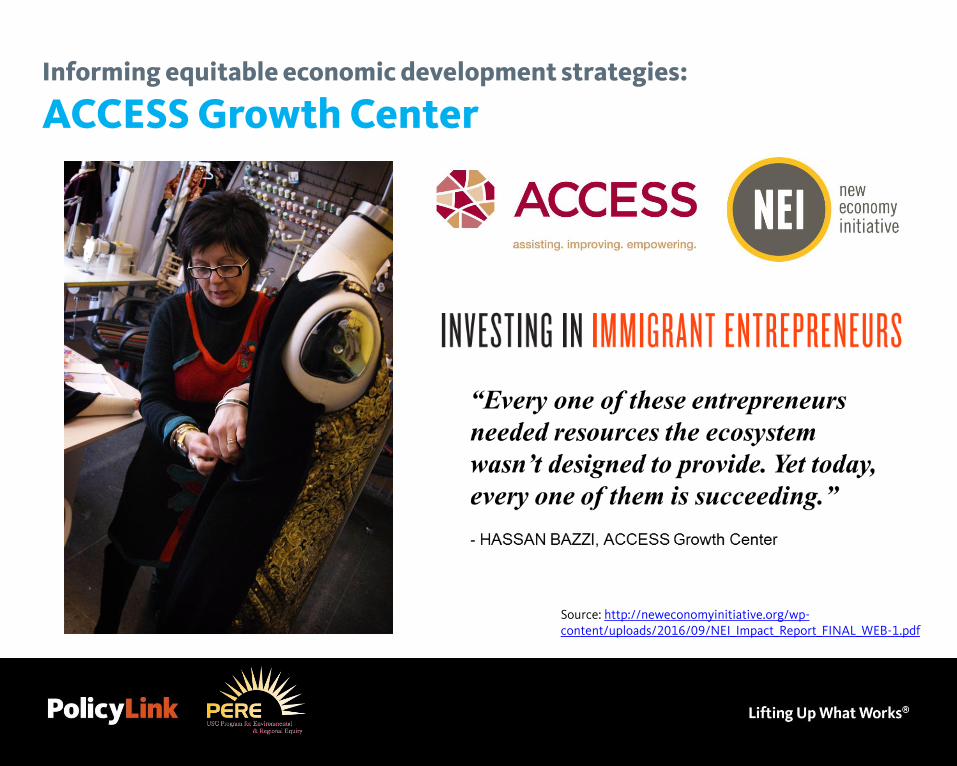
Informing equitable economic development strategies:
ACCESS Growth Center
Source: http://neweconomyinitiative.org/wp-content/uploads/2016/09/NEI_Impact_Report_FINAL_WEB-1.pdf
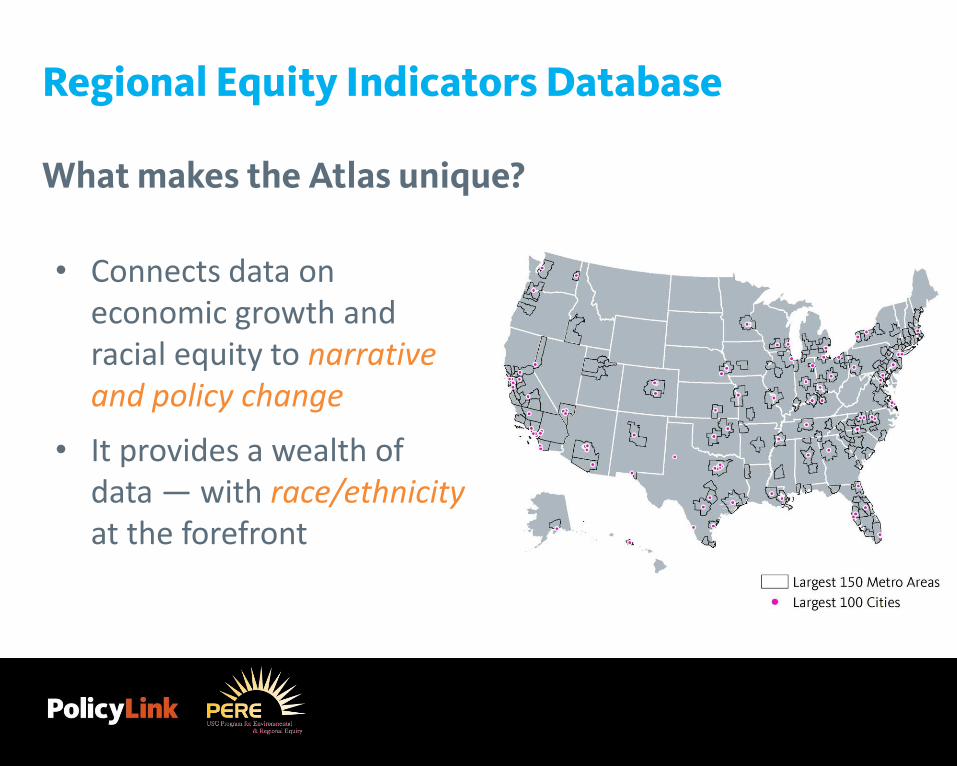
What makes the Atlas unique?
Regional Equity Indicators Database
• Connects data on economic growth and racial equity to narrative and policy change
• It provides a wealth of data — with race/ethnicityat the forefront
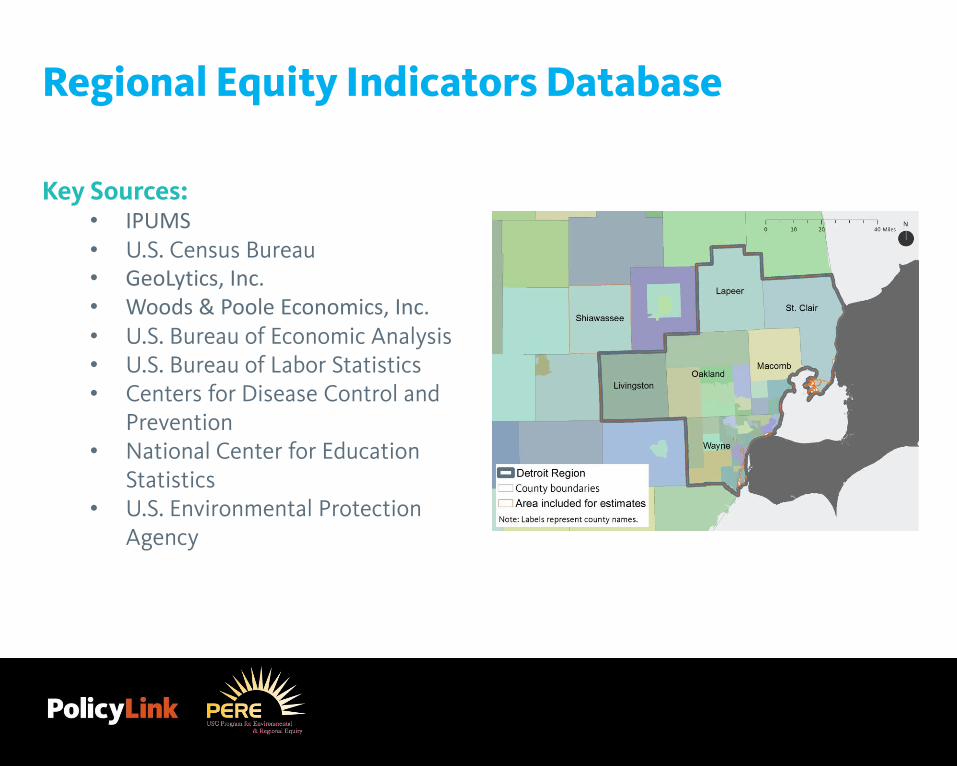
Key Sources:• IPUMS• U.S. Census Bureau• GeoLytics, Inc.• Woods & Poole Economics, Inc.• U.S. Bureau of Economic Analysis• U.S. Bureau of Labor Statistics• Centers for Disease Control and
Prevention• National Center for Education
Statistics• U.S. Environmental Protection
Agency
Regional Equity Indicators Database
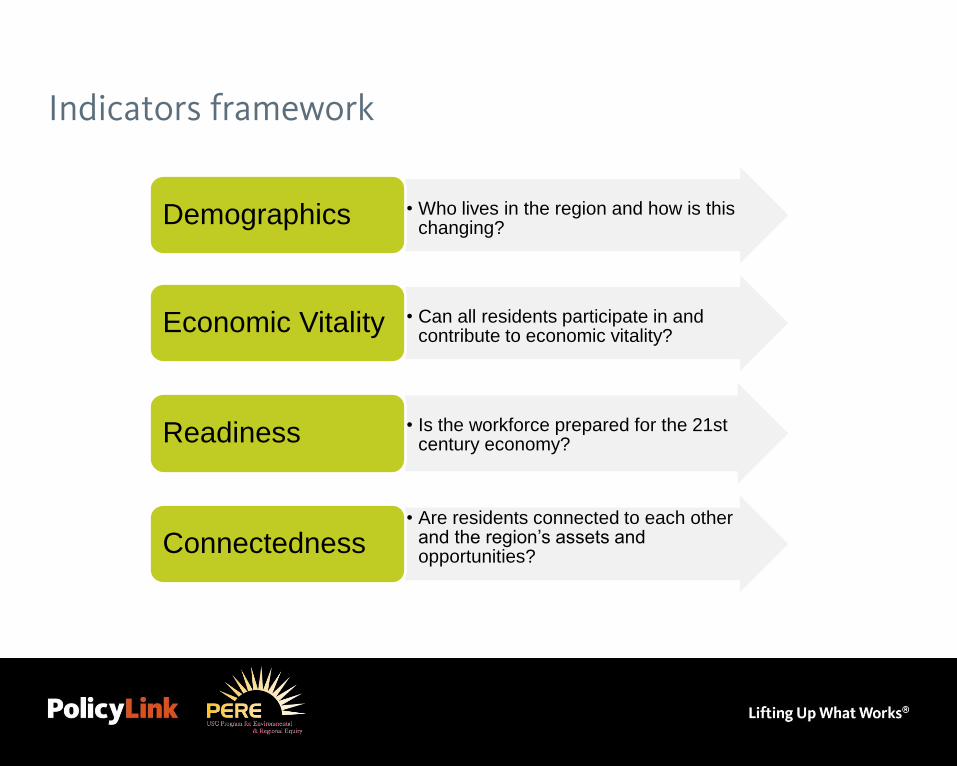
Indicators framework
• Who lives in the region and how is this changing?
Demographics
• Can all residents participate in and contribute to economic vitality?
Economic Vitality
• Is the workforce prepared for the 21st century economy?Readiness
• Are residents connected to each other and the region’s assets and opportunities?
Connectedness

Visit the National Equity Atlas at www.nationalequityatlas.org
Contact us:Ángel Ross: [email protected] Scoggins: [email protected]