Embed Size (px)
DESCRIPTION
erw weld quality
Citation preview
WELDING RESEARCH
-s71WELDING JOURNAL
ABSTRACT. In high-frequency electricresistance welding (HF-ERW), the weldquality is determined by the welding phe-nomenon in the welding spot proximity.Methods to eliminate or minimize defects,therefore, include real-time monitoring ofthe weld quality and problem solving asproblems arise. It is possible to estimateweld quality qualitatively by using the weldimage data during HF-ERW. A method topredict the weld quality using image pro-cessing in the heating process of the HF-ERW point is proposed. An algorithm,which predicts the weld quality by using avision sensor to obtain the image of thewelding spot proximity thus best express-ing the welding phenomenon, is devel-oped. The heated area, which shows theimage data with the highest correlation tothe weld quality and the smallest amountof noise, is consequently calculated.
Introduction
In high-frequency electric resistancewelding (HF-ERW), a high-frequencycurrent in the range of 300~1000 kHz isapplied to the welding area, and squeezeforce is added to the workpiece heatedfrom the heat resistance. The HF-ERWmethod is classified into the high-frequency induction method and the high-frequency resistance welding method, de-pending on the method employed in theapplication of high-frequency current onthe workpiece. In the high-frequency in-
duction welding method, an induction coilis used in inducing high-frequency currentto generate heat. In high-frequency resis-tance welding, on the contrary, a contac-tor is applied to the workpiece to directlyprovide the current (Ref. 1). High-frequency induction welding is primarilyused in joining small-diameter steel pipes,while HF-ERW is used in joining large-diameter steel pipes.
The characteristic of HF-ERW is the re-sistance generated through the use of high-frequency currents dissimilar from direct orlow-frequency currents. In high- frequencyelectric welding, the resistance heat is con-centrated on the welding surface due to theskin effect wherein the current is concen-trated on the conductor surface on accountof the high frequency, and the proximity ef-fect wherein the current is concentrated onthe surface of two conductors as they ap-proach each other. The area affected byheat can, therefore, be decreased and thewelding speed can be increased, producinga welding method with superior productiv-ity over the preceding methods.
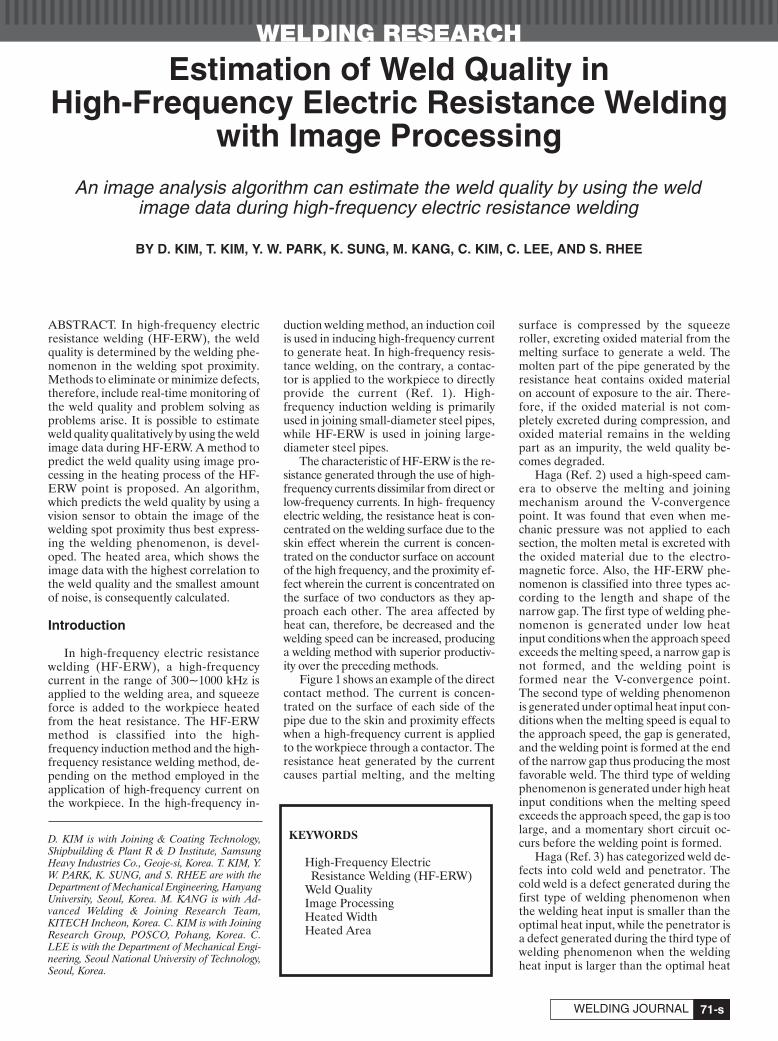
Figure 1 shows an example of the directcontact method. The current is concen-trated on the surface of each side of thepipe due to the skin and proximity effectswhen a high-frequency current is appliedto the workpiece through a contactor. Theresistance heat generated by the currentcauses partial melting, and the melting
surface is compressed by the squeezeroller, excreting oxided material from themelting surface to generate a weld. Themolten part of the pipe generated by theresistance heat contains oxided materialon account of exposure to the air. There-fore, if the oxided material is not com-pletely excreted during compression, andoxided material remains in the weldingpart as an impurity, the weld quality be-comes degraded.
Haga (Ref. 2) used a high-speed cam-era to observe the melting and joiningmechanism around the V-convergencepoint. It was found that even when me-chanic pressure was not applied to eachsection, the molten metal is excreted withthe oxided material due to the electro-magnetic force. Also, the HF-ERW phe-nomenon is classified into three types ac-cording to the length and shape of thenarrow gap. The first type of welding phe-nomenon is generated under low heatinput conditions when the approach speedexceeds the melting speed, a narrow gap isnot formed, and the welding point isformed near the V-convergence point.The second type of welding phenomenonis generated under optimal heat input con-ditions when the melting speed is equal tothe approach speed, the gap is generated,and the welding point is formed at the endof the narrow gap thus producing the mostfavorable weld. The third type of weldingphenomenon is generated under high heatinput conditions when the melting speedexceeds the approach speed, the gap is toolarge, and a momentary short circuit oc-curs before the welding point is formed.
Haga (Ref. 3) has categorized weld de-fects into cold weld and penetrator. Thecold weld is a defect generated during thefirst type of welding phenomenon whenthe welding heat input is smaller than theoptimal heat input, while the penetrator isa defect generated during the third type ofwelding phenomenon when the weldingheat input is larger than the optimal heat
Estimation of Weld Quality inHigh-Frequency Electric Resistance Welding
with Image ProcessingAn image analysis algorithm can estimate the weld quality by using the weld
image data during high-frequency electric resistance welding
BY D. KIM, T. KIM, Y. W. PARK, K. SUNG, M. KANG, C. KIM, C. LEE, AND S. RHEE
KEYWORDS
High-Frequency ElectricResistance Welding (HF-ERW)
Weld QualityImage ProcessingHeated WidthHeated Area
D. KIM is with Joining & Coating Technology,Shipbuilding & Plant R & D Institute, SamsungHeavy Industries Co., Geoje-si, Korea. T. KIM, Y.W. PARK, K. SUNG, and S. RHEE are with theDepartment of Mechanical Engineering, HanyangUniversity, Seoul, Korea. M. KANG is with Ad-vanced Welding & Joining Research Team,KITECH Incheon, Korea. C. KIM is with JoiningResearch Group, POSCO, Pohang, Korea. C.LEE is with the Department of Mechanical Engi-neering, Seoul National University of Technology,Seoul, Korea.
Kim March 2007 LAYOUT:Layout 1 2/8/07 2:30 PM Page 71
WELDING RESEARCH
MARCH 2007-s72
input. External variables frequently affectthe weld quality even when welding condi-tions are preset and welding is performedto produce favorable weld quality withoutdefects. Real-time monitoring and controlof the welding process, thus, are necessaryin order to prevent weld defects and effi-ciently manage the production procedure.Based upon the results of Haga’s research(Ref. 3) identifying the least weld defectsin the second type of welding phenome-non and the most weld defects in the heatinput conditions of the first and third typesof welding phenomena, Watanabe et al.(Ref. 4) have used the correlation betweenthe three types of welding phenomenafound in HF-ERW and the frequency ofthe welding currents to monitor the weld-ing frequency and to control the heat inputin welding.
Mihara et al. (Ref. 5) have used a one-dimensional photodiode to calculate theheated width of the welding part to controlthe heat input, where the photodiode is setto calculate the welding part 30 mm be-hind the V-convergence point. The heatedwidth of the welding part is calculated, anda feedback control system is established tomaintain the value at a constant level. Thismethod, however, retains a problem thatthe changing V-convergence point accord-ing to the welding conditions is excludedfrom consideration, and heated width cal-culated from a single point shows a highlevel of change according to the time thusundermining the correlation with the ac-tual weld quality. In addition, the weldquality is determined by the weldingmechanism near the welding point ratherthan the melting phenomenon behind thewelding point in HF-ERW. The data cal-culated behind the welding point are,therefore, not closely correlated to theweld quality. Tatsuwaki et al. (Ref. 6) haveformulated a system using a two-dimensional pattern thermometer to con-trol the heat input by calculating the two-dimensional temperature distribution ofthe welding part. A two-dimensional tem-
perature sensor is used inthis study to calculate andmonitor the two-dimen-sional temperature distribu-tion near the V-convergencepoint. The data controllingthe heat input in thismethod, however, use thetemperature distributionfrom only a particular line,and thus the method doesnot present a solution toovercome the shortcomingsfound in the studies of Mi-hara et al. (Ref. 5).
To date, the research re-sults regarding high-frequency resistance weld-ing have shown that theelectric resistance welding(ERW) weld quality isclosely correlated with themelting phenomenoncaused by the resistanceheat near the welding point.The data calculated fromthe welding phenomenon ofERW, however, are nothighly reliable, and theERW welding phenome-non, furthermore, fails toactively respond to thechanging V-convergencepoint. In order to overcomesuch problems in this study,active responses are madeto the changing V-conver-gence point in HF-ERW,and a welding phenomenonvalue highly correlated tothe weld quality is obtainedwith a method to estimate the real time weldquality proposed. Electric resistance weld-ing image data taken with a high-speedcamera are used in this study in order todevelop an algorithm, which obtains andcalculates data showing the highest corre-lation between the weld quality and weld-ing phenomenon.
Raw Image Acquisition System
A high-speed camera was used in orderto observe the melting phenomenon inHF-ERW with the filming speed set at1000 fps to capture the welding phenome-non around the V-convergence point. Thethickness of the base metal was 10 mm,
Fig. 1 — Schematic diagram of high-frequency electric resistance welding system.
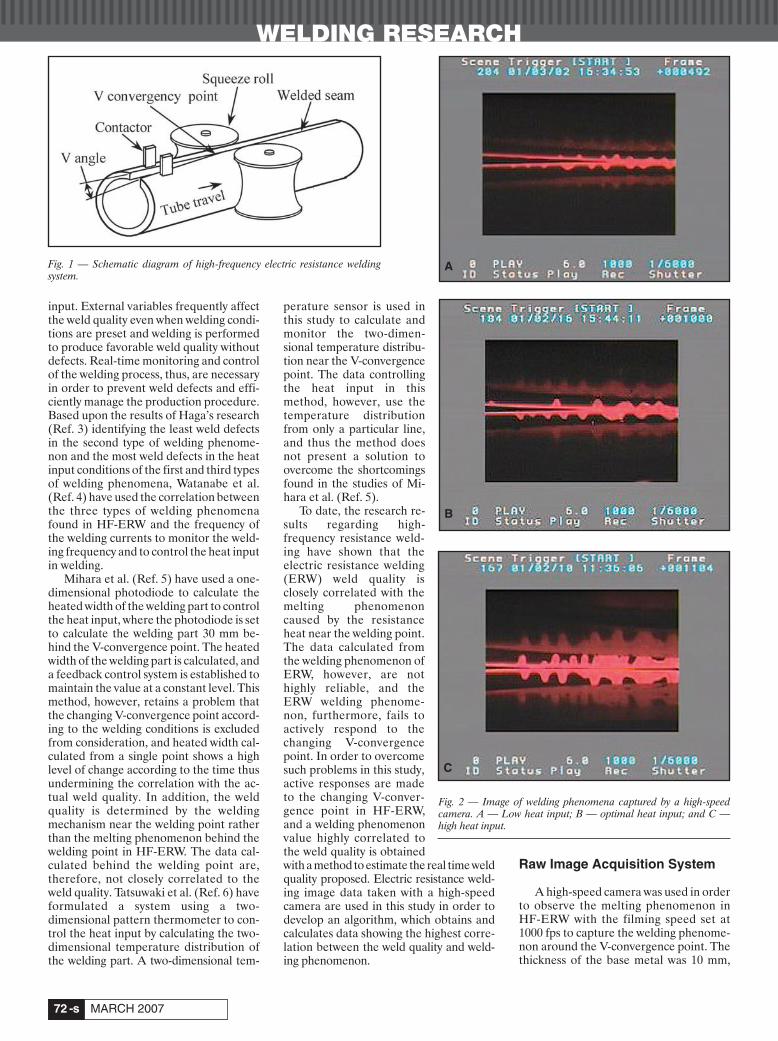
Fig. 2 — Image of welding phenomena captured by a high-speedcamera. A — Low heat input; B — optimal heat input; and C —high heat input.
A
B
C
Kim March 2007 LAYOUT:Layout 1 2/8/07 2:31 PM Page 72
-s73WELDING JOURNAL
WELDING RESEARCH
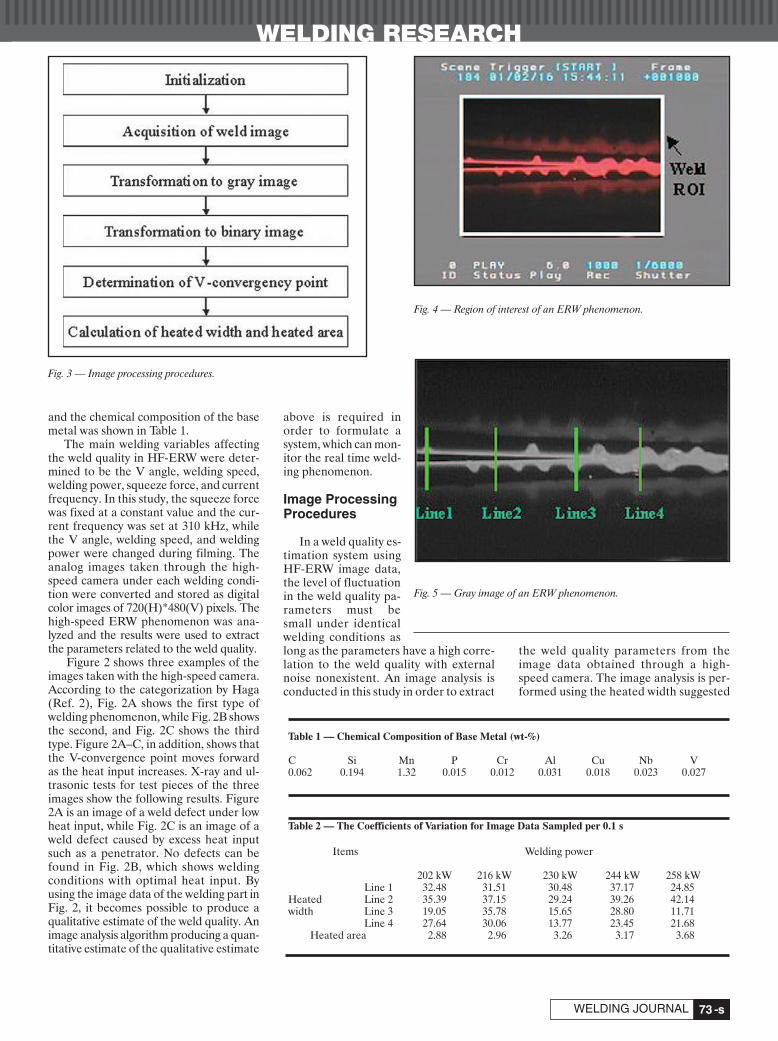
and the chemical composition of the basemetal was shown in Table 1.
The main welding variables affectingthe weld quality in HF-ERW were deter-mined to be the V angle, welding speed,welding power, squeeze force, and currentfrequency. In this study, the squeeze forcewas fixed at a constant value and the cur-rent frequency was set at 310 kHz, whilethe V angle, welding speed, and weldingpower were changed during filming. Theanalog images taken through the high-speed camera under each welding condi-tion were converted and stored as digitalcolor images of 720(H)*480(V) pixels. Thehigh-speed ERW phenomenon was ana-lyzed and the results were used to extractthe parameters related to the weld quality.
Figure 2 shows three examples of theimages taken with the high-speed camera.According to the categorization by Haga(Ref. 2), Fig. 2A shows the first type ofwelding phenomenon, while Fig. 2B showsthe second, and Fig. 2C shows the thirdtype. Figure 2A–C, in addition, shows thatthe V-convergence point moves forwardas the heat input increases. X-ray and ul-trasonic tests for test pieces of the threeimages show the following results. Figure2A is an image of a weld defect under lowheat input, while Fig. 2C is an image of aweld defect caused by excess heat inputsuch as a penetrator. No defects can befound in Fig. 2B, which shows weldingconditions with optimal heat input. Byusing the image data of the welding part inFig. 2, it becomes possible to produce aqualitative estimate of the weld quality. Animage analysis algorithm producing a quan-titative estimate of the qualitative estimate
above is required inorder to formulate asystem, which can mon-itor the real time weld-ing phenomenon.
Image ProcessingProcedures
In a weld quality es-timation system usingHF-ERW image data,the level of fluctuationin the weld quality pa-rameters must besmall under identicalwelding conditions aslong as the parameters have a high corre-lation to the weld quality with externalnoise nonexistent. An image analysis isconducted in this study in order to extract
the weld quality parameters from theimage data obtained through a high-speed camera. The image analysis is per-formed using the heated width suggested
Table 1 — Chemical Composition of Base Metal (wt-%)
C Si Mn P Cr Al Cu Nb V0.062 0.194 1.32 0.015 0.012 0.031 0.018 0.023 0.027
Table 2 — The Coefficients of Variation for Image Data Sampled per 0.1 s
Items Welding power
202 kW 216 kW 230 kW 244 kW 258 kWLine 1 32.48 31.51 30.48 37.17 24.85
Heated Line 2 35.39 37.15 29.24 39.26 42.14width Line 3 19.05 35.78 15.65 28.80 11.71
Line 4 27.64 30.06 13.77 23.45 21.68Heated area 2.88 2.96 3.26 3.17 3.68
Fig. 3 — Image processing procedures.
Fig. 4 — Region of interest of an ERW phenomenon.
Fig. 5 — Gray image of an ERW phenomenon.
Kim March 2007 LAYOUT:Layout 1 2/8/07 2:31 PM Page 73
WELDING RESEARCH
MARCH 2007-s74
in the previous study and the heated areasuggested in this study as parameters.The changes in the V-convergence pointaccording to the V angle and heat inputduring welding are taken into considera-tion, and thus the heated width andheated area are calculated based uponthe V-convergence point in order to re-duce changes in weld quality parameters
induced by the changes in the V-convergence point.
Figure 3 shows the image processingprocedure for each frame. Four factors in-cluding the region of interest (ROI), thethreshold value of the gray level to deter-mine the heated area of the image, the lo-cation where the heated area is to be mea-sured, and the location where the heated
width is to be measured are determined inorder to analyze the image in the firststage of initialization. In the second stage,the image signal obtained through thehigh-speed camera is transferred into adigital image. Figure 4 shows an imageconverted into a digital image. The size ofthe image is 720(H)*480(V) pixels, andthe area to be welded is marked by the
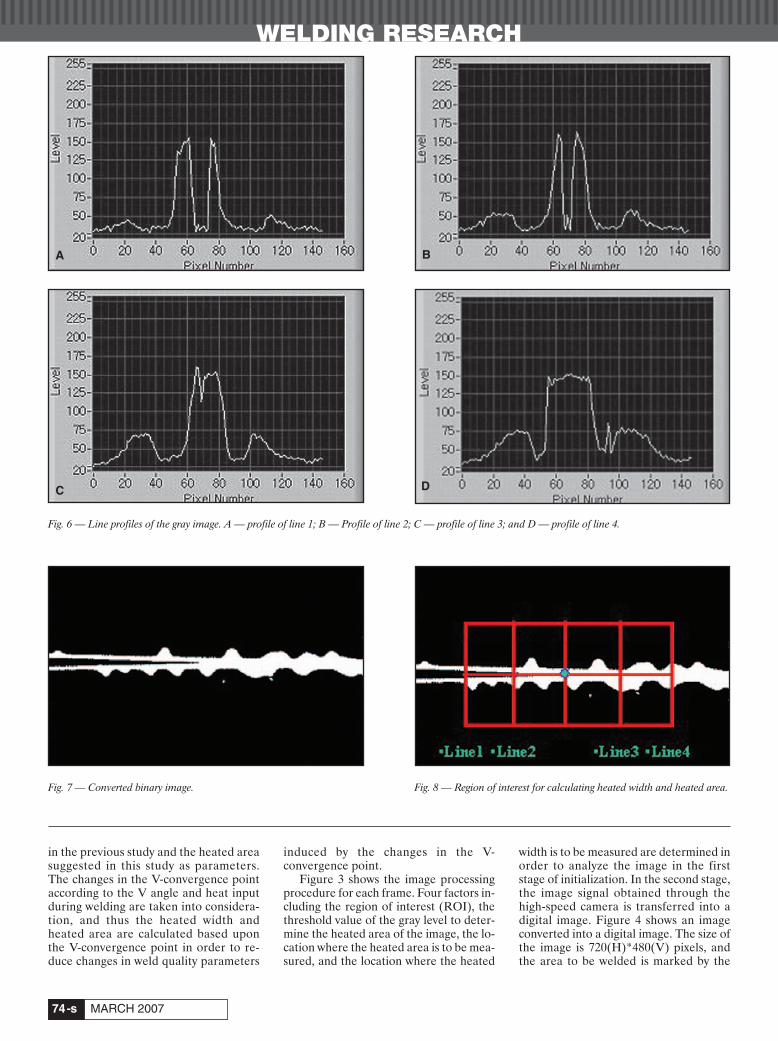
Fig. 6 — Line profiles of the gray image. A — profile of line 1; B — Profile of line 2; C — profile of line 3; and D — profile of line 4.
Fig. 7 — Converted binary image. Fig. 8 — Region of interest for calculating heated width and heated area.
A B
C D
Kim March 2007 LAYOUT:Layout 1 2/8/07 2:33 PM Page 74
-s75WELDING JOURNAL
WELDING RESEARCHweld ROI showing an area of436(H)*282(V) pixels. The correspondingROI of the actual welding part is60(H)*39(V) mm, and thus an algorithmis formulated to perform the actual imageprocessing only on the ROI.
In the third stage, the color image isconverted into a gray image. Figure 5shows an image wherein the ROI hasbeen converted into gray level (0~255).The more intense the heat caused by theheat resistance, the higher the gray level.This shows a shade closer to white asshown in the figure.
In the fourth stage, the line profile ofthe gray image is used to determine thethreshold value, and the areas below thethreshold value are considered 0 with theheated areas exceeding the thresholdvalue being considered 255. Figure 6shows the gray level of each point withinthe four lines marked in Fig. 5. It is neces-sary to select a threshold value, which doesnot influence the heated width or theheated area to the highest degree by cool-ing water and other disturbance factors. Inthis paper, gray level of 110 was selectedas the threshold value based on Fig. 6. Fig-
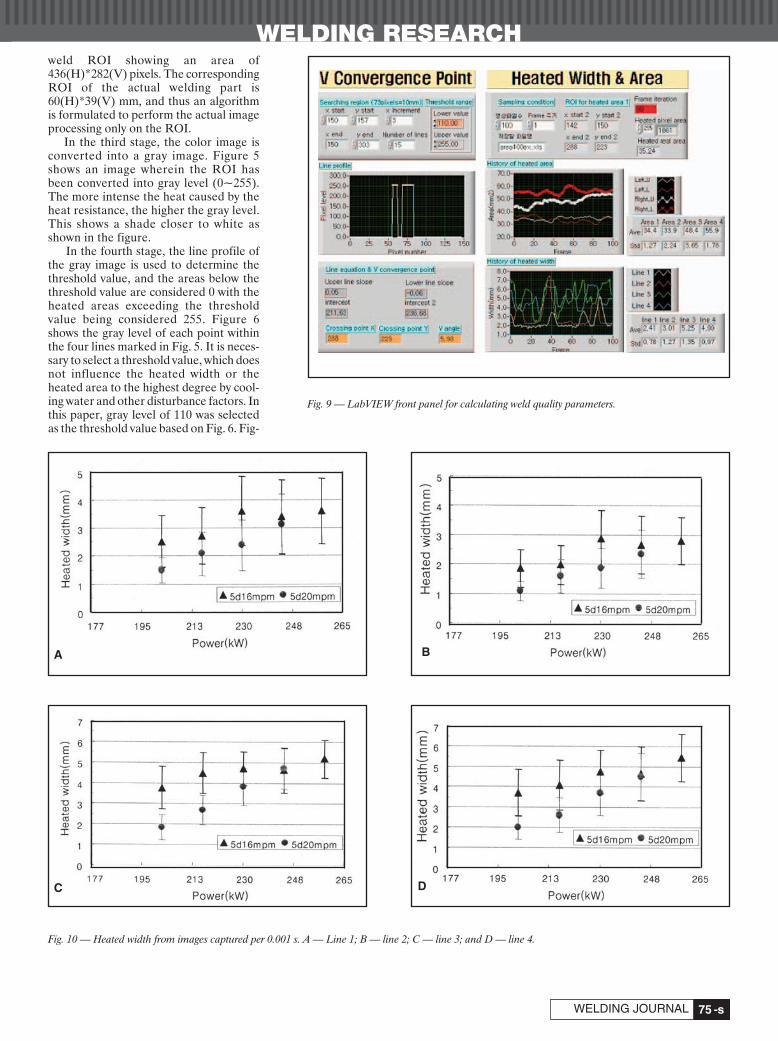
Fig. 9 — LabVIEW front panel for calculating weld quality parameters.
Fig. 10 — Heated width from images captured per 0.001 s. A — Line 1; B — line 2; C — line 3; and D — line 4.
A B
C D
Kim March 2007 LAYOUT:Layout 1 2/9/07 10:03 AM Page 75
WELDING RESEARCH
MARCH 2007-s76
ure 7 shows the image converted into a bi-nary image after determining the thresh-old value at 110. The gray level of areasbelow 110 is considered 0, and the graylevel of areas exceeding 110 is considered255. Hence the white areas in the figureshow the heated area.
In the fifth stage, the V-convergencepoint is obtained from the binary image.The V-convergence point is calculated afterdetecting the two lines comprising the Vangle. The gray level values of each row aresearched within the binary image data,which are stored in the matrix form. The setof points where the gray level value has beenconverted from 255 to 0 and a set of pointswhere the gray level has been convertedfrom 0 to 255 are extracted, and the leastsquare method is applied to each set to ob-tain the two line equations. The two lineequations are consequently used to deter-mine the V angle and the coordinates of theV-convergence point.
In the final stage, the V-convergencepoint obtained in stage 5 is used to calcu-late the heated width and area. Figure 8
shows the location within the image wherethe heated area and heated width are mea-sured. The heated width is measured atfour points in 10-mm intervals from the V-convergence point, while the heated areais calculated by searching the area 10 mmabove and below the V-convergence pointand 20 mm to each side. The pointswherein the gray level is 255 are extractedwithin the area to measure the heated area.
Result and Discussion
In order to induce a correlation be-tween the narrow gap and the weldingquality, Haga (Ref. 2) has measured thenarrow gap in the welding part in an imageof the welding phenomenon. The narrowgap can, however, only be observedthrough a high-speed camera. Hence, thenarrow gap cannot be observed through astandard 30-fps camera, and the measure-ment continually changes even underidentical welding conditions, making itdifficult to monitor and control the nar-row gap. It is necessary to select factors re-
taining a high correlation with the weldingquality when determining the factors forwelding quality monitoring, and to show aminimum level of fluctuation under iden-tical welding conditions when externalnoise is nonexistent. In this study, Lab-VIEW (Ref. 7) is used for image analysis,and Fig. 9 shows the front panel composedthrough LabVIEW. The front panel showsweld image parameters such as V-conver-gence point, heated area, etc. Images ofthe welding phenomenon are taken whilediffering the welding power under a 5-degV angle and welding speed at 60 and 20m/min. In addition, image processing isconducted with a sampling interval of notonly 0.001 s, but also 0.1 s in order to ob-serve the possibility of monitoring thewelding phenomenon using a standard 30-fps CCD camera, which is far more cost ef-ficient than a high-speed camera. Thenumber of samples acquired in the sam-pling interval of 0.001 s is 1500, while 15samples are obtained when the samplinginterval is set at 0.1 s.
Figure 10 shows the heated width mea-
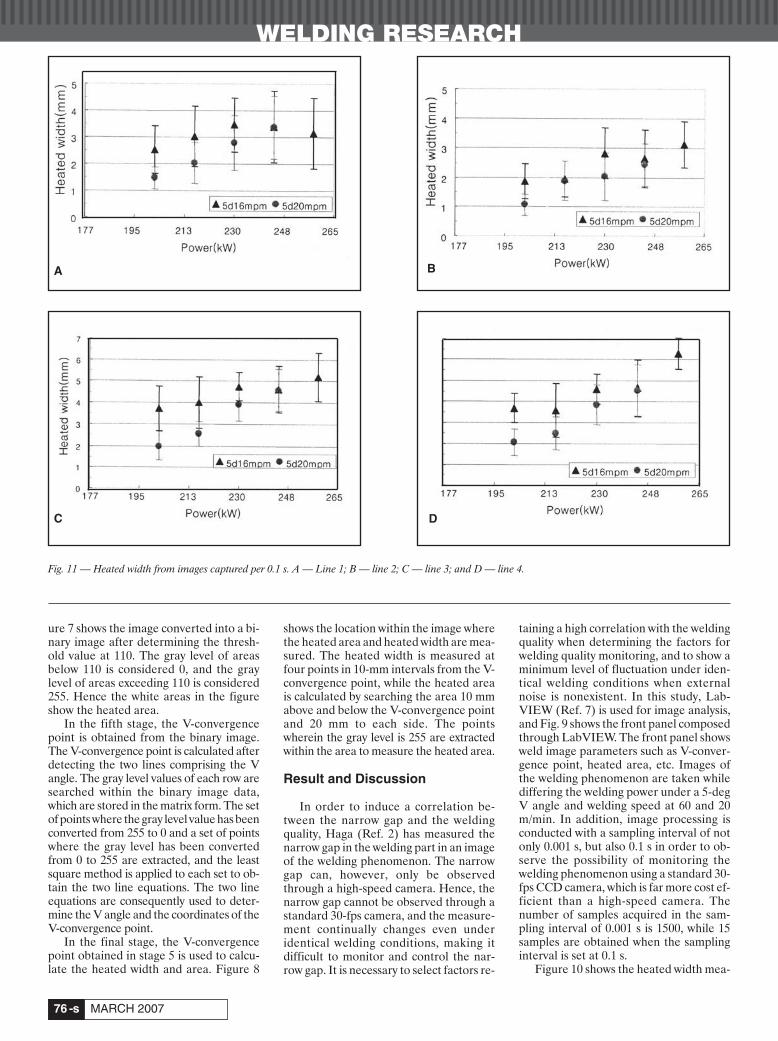
Fig. 11 — Heated width from images captured per 0.1 s. A — Line 1; B — line 2; C — line 3; and D — line 4.
A B
C D
Kim March 2007 LAYOUT:Layout 1 2/8/07 2:35 PM Page 76
WELDING RESEARCH
-s77WELDING JOURNAL
sured from the four lines obtainedthrough images taken in 0.001-s intervals.The ‘5d16mpm’ in the figure denotes thatthe V angle is 5 deg and the welding speedis 16 m/min. Each point shows the meanvalue of the heated width, and the fluctu-ation of the heated width is expressedthrough the standard deviation. Theheated width has a tendency to increase asthe welding power increases in all areas.The fluctuation shown in the figurethrough the standard deviation, however,is quite large under all welding conditions,showing that the heated width is not a suit-able factor to express the heat input inquantitative terms.
Figure 11 shows the heated width mea-sured from the image taken in 0.1-s inter-vals. The images taken in 0.1-s intervalsalso show that the heat width has a ten-dency to increase as the welding power in-creases similar to the images taken in0.001-s intervals. However, the fluctuationunder each welding condition is too great
to express the welding phenomenon inquantitative terms.
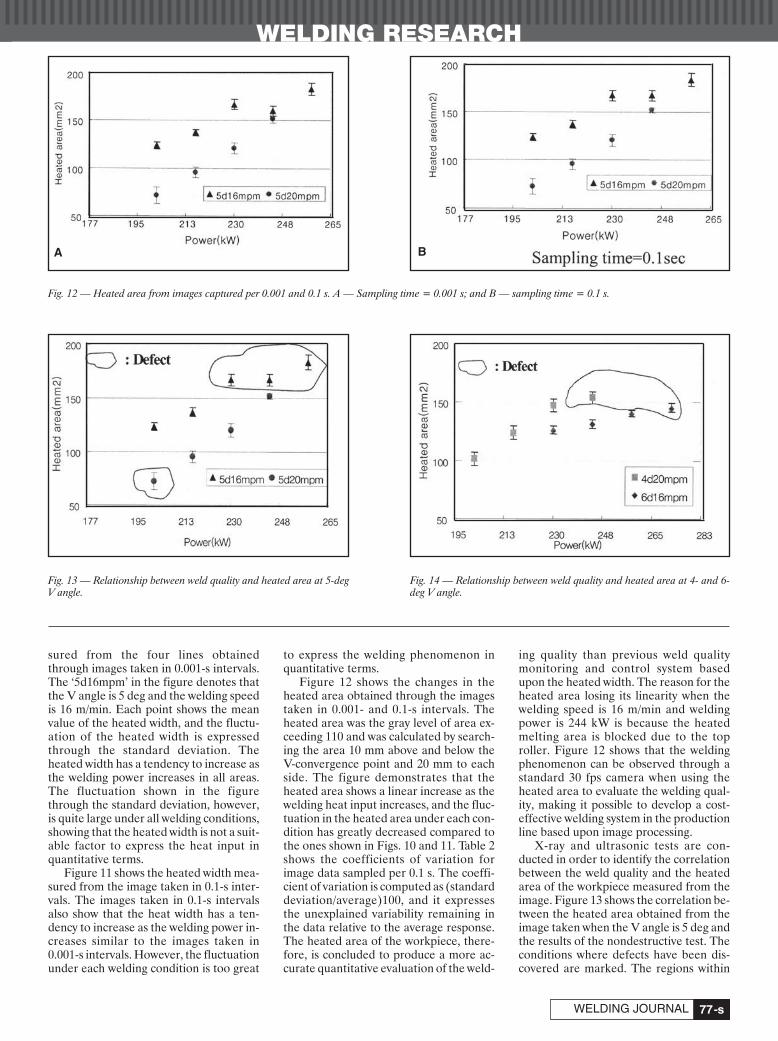
Figure 12 shows the changes in theheated area obtained through the imagestaken in 0.001- and 0.1-s intervals. Theheated area was the gray level of area ex-ceeding 110 and was calculated by search-ing the area 10 mm above and below theV-convergence point and 20 mm to eachside. The figure demonstrates that theheated area shows a linear increase as thewelding heat input increases, and the fluc-tuation in the heated area under each con-dition has greatly decreased compared tothe ones shown in Figs. 10 and 11. Table 2shows the coefficients of variation forimage data sampled per 0.1 s. The coeffi-cient of variation is computed as (standarddeviation/average)100, and it expressesthe unexplained variability remaining inthe data relative to the average response.The heated area of the workpiece, there-fore, is concluded to produce a more ac-curate quantitative evaluation of the weld-
ing quality than previous weld qualitymonitoring and control system basedupon the heated width. The reason for theheated area losing its linearity when thewelding speed is 16 m/min and weldingpower is 244 kW is because the heatedmelting area is blocked due to the toproller. Figure 12 shows that the weldingphenomenon can be observed through astandard 30 fps camera when using theheated area to evaluate the welding qual-ity, making it possible to develop a cost- effective welding system in the productionline based upon image processing.
X-ray and ultrasonic tests are con-ducted in order to identify the correlationbetween the weld quality and the heatedarea of the workpiece measured from theimage. Figure 13 shows the correlation be-tween the heated area obtained from theimage taken when the V angle is 5 deg andthe results of the nondestructive test. Theconditions where defects have been dis-covered are marked. The regions within
Fig. 12 — Heated area from images captured per 0.001 and 0.1 s. A — Sampling time = 0.001 s; and B — sampling time = 0.1 s.
Fig. 13 — Relationship between weld quality and heated area at 5-degV angle.
Fig. 14 — Relationship between weld quality and heated area at 4- and 6-deg V angle.
A B
Kim March 2007 LAYOUT:Layout 1 2/8/07 2:39 PM Page 77
WELDING RESEARCH
MARCH 2007-s78
the image where the heated areas aresmall are the areas where the heat input islow, causing weld defects. The regionswithin the image where the heated area islarge are the areas where the heat input isalso large, causing weld defects from ex-cessive heat input. As seen from the re-sults of studies published by Haga (Ref. 3),weld defects are equally found when theheat input is too small or too large. Coldweld, one representative weld defect inERW, is found when the heat input is toosmall. Penetrator, another representativeweld defect in ERW, is found when theheat input is too large. In particular, pen-etrators occur periodically along the weldseam. An optimal heat area is also shownto exist just as an optimal welding input ex-ists, and thus the weld quality can be esti-mated through the heated area. Thewelded joint with 10 mm thickness used inthis study display satisfactory weld quality,which don’t show any weld defect in thenondestructive test when the heated area
is 100~150 mm2, but display weld defectsoutside the heated area. Hence, it is pos-sible to monitor weld defects by establish-ing a standard heated area and acceptablelimits according to the material and thethickness of the workpiece.
The correlation between the heatedarea and weld quality obtained throughthe procedures above are applied to theimage data captured while differing thewelding power when the V angle is 4 and6 deg. The relationship between theheated area measured from the image ofthe welding area and the weld quality isshown in Fig. 14. The heat area when theV angle is 4 and 6 deg shows a tendency toincrease as the welding power increasessimilar to Fig. 13 where the V angle is 5deg. Weld defects are also shown to occurunder welding conditions where theheated area exceeds 150 mm2. When theV angle is 6 deg, weld defects can be foundwhere the heated area is less than 150 mm2
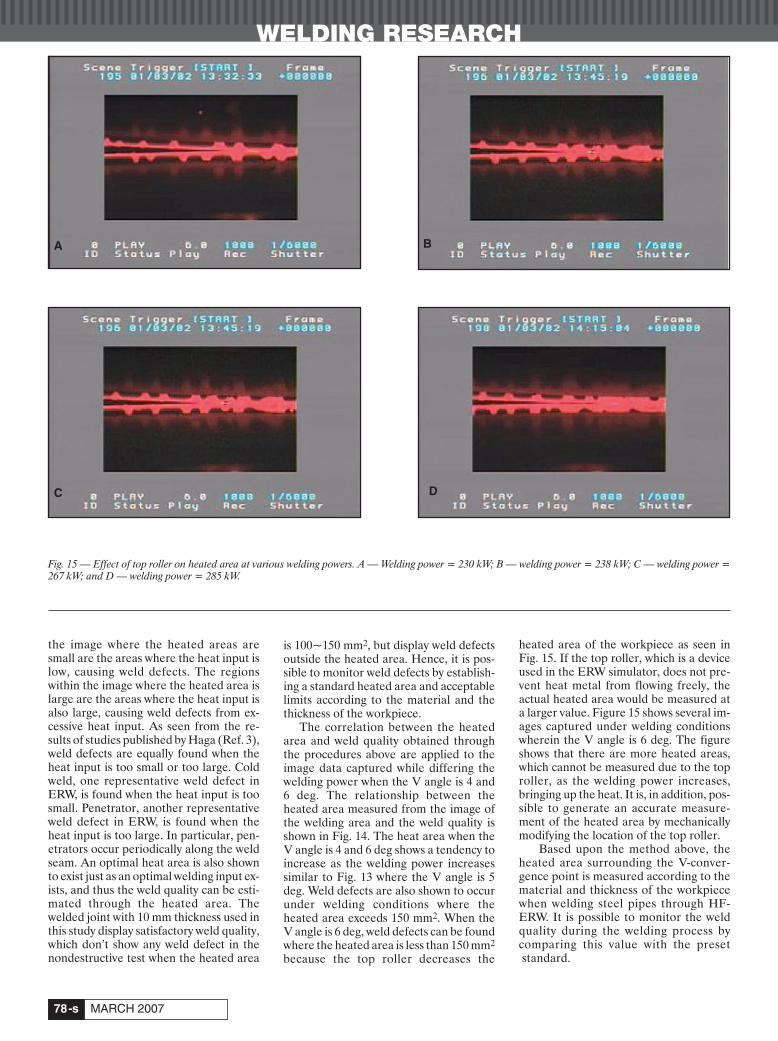
because the top roller decreases the
heated area of the workpiece as seen inFig. 15. If the top roller, which is a deviceused in the ERW simulator, does not pre-vent heat metal from flowing freely, theactual heated area would be measured ata larger value. Figure 15 shows several im-ages captured under welding conditionswherein the V angle is 6 deg. The figureshows that there are more heated areas,which cannot be measured due to the toproller, as the welding power increases,bringing up the heat. It is, in addition, pos-sible to generate an accurate measure-ment of the heated area by mechanicallymodifying the location of the top roller.
Based upon the method above, theheated area surrounding the V-conver-gence point is measured according to thematerial and thickness of the workpiecewhen welding steel pipes through HF-ERW. It is possible to monitor the weldquality during the welding process bycomparing this value with the presetstandard.
Fig. 15 — Effect of top roller on heated area at various welding powers. A — Welding power = 230 kW; B — welding power = 238 kW; C — welding power =267 kW; and D — welding power = 285 kW.
A B
C D
Kim March 2007 LAYOUT:Layout 1 2/8/07 2:41 PM Page 78

WELDING RESEARCH
-s79WELDING JOURNAL
Conclusion
In high-frequency electric resistancewelding (HF-ERW), the welding phe-nomenon surrounding the V-conver-gence greatly influences the weld quality.In this study, image data of the V-conver-gence point proximity are used in orderto estimate the weld quality. The heatedarea is used as the parameter to evaluatethe weld quality, and an optimal heatedarea is discovered just as an optimal heatinput is found. Weld defects, which canbe found when the heat input is too small,are discovered when the heated area issmaller than the optimal heated area.Weld defects, which occur under excessheat input, are also found when theheated area is larger than the optimal
area. Hence, the estimation of the weldquality is determined possible in thisstudy through heated area.
References
1. O’Brien, R. L., ed. 1991. Welding process.Welding Handbook, 8th Ed., Vol. 2, pp. 652–669.Miami, Fla.: American Welding Society.
2. Haga, H., Aoki, K., and Sato, T. 1980. Weld-ing phenomena and welding mechanisms in high-frequency electric resistance welding-1st report.Welding Journal 59(7): 208-s to 212-s.
3. Haga, H., Aoki, K., and Sato, T. 1981. Themechanisms of formation of weld defects inhigh-frequency electric resistance welding.Welding Journal 60(6): 104-s to 109-s.
4. Watanabe, N., Funake, M., Sanmiya, S.,Kosuge, N., Haga, H., and Mizuhashi, N. 1986.An automatic power input control system inhigh-speed frequency electric resistance weld-
ing. Transactions ISIJ 26: 453–460.5. Mihara, Y., Suzuki, K., Ohkawa, T.,
Harada, N., Komine, I., and Ishiro, S. 1986. Anew automatic heat input control for produc-tion of electric resistance welded pipe. Transac-tions ISIJ 26: 476–483.
6. Tatsuwaki, M., Takamadate, C., andHotta, K. 1984. Temperature pattern measure-ment and weld control in electric resistancewelded tube mill. Transactions ISIJ 24: 847–856.
7. National Instruments Corp., LabVIEWversion for Windows™, 2000 edition.
The conference begins with registration on Sunday, April 29, 2007. Monday will mark the opening of eight sessionsof presentations through Wednesday, May 2. AWS President Gerald Uttrachi will make an opening address to attendees,as well as chair one of the sessions and make a technical presentation. A sampling of the topics that will be coveredduring the three days include the following:
• Mechanical properties and microstructure of ultra high-strength steel• Metal powder laser deposition • Improving weld joints in oil and gas pipelines• Microbiological induced corrosion• Hybrid laser welding of pipe• Keyhole plasma arc welding • Vision systems for arc welding • Friction stir welding • Welding dual-phase steel • Metal transfer behavior• Submerged arc welding optimization • Solid-state welding• Resistance spot welding parameters • e-learning for welding• University welding education• ISO standardization and certification• Weld quality and gas waste in GMAW• Education and research• Modeling temperature distribution in pipe welding
For more information or conference registration contact JOM- Institute Gilleleje Strandvej 28. DK-3250 Gilleleje,Denmark; telephone: +45 48355458; e-mail [email protected].
JOM-14Fourteenth International Conference
On the Joining of Materials&
The 5th International Conference onEducation in WeldingApril 29–May 2, 2007Helsingør, Denmark
Kim March 2007 LAYOUT:Layout 1 2/8/07 2:42 PM Page 79

Guidelines for submitting electronic files
1. Platform:Macintosh or PC accepted
2. Files accepted:QuarkXpress, Adobe Photoshop, Adobe Illustrator, TIFF, EPS and PDF files only.
3. Color:Send all files in as CMYK (for color) or Grayscale (for b/w).
4. Images:Minimum resolution required for magazine printing is 300 dpi for full color artwork orgrayscale at least 1000 dpi for bitmap (B&W/line art). Images and logos from Web sitesare NOT usable for printing. They are low resolution images (72 dpi). Images taken witha digital camera are not acceptable unless they meet the minimum 300 dpi requirement.
5. Proof:A proof of the images should always be provided.
6. Electronic File Transfer:Files larger than 68k are not acceptable as an email attachment; please send it on a CD or Zip, you may also send files to the printer FTP site (a user name and password will be provided when requested)
Check list for submitting electronic files:
Colors: ❐ 4/C ❐ Grayscale ❐ B&W/line art
File Type: ❐ TIFF ❐ EPS
File sent via: ❐ Floppy disk ❐ Zip disk ❐ CD ❐ Email
❐ Proof supplied/faxed
❐ CMYK images at 300 dpi or higher, B&W/line art at 1000 dpi or higher.
❐ All color in all images set to CMYK process (not RGB)
When submitting ads, please send them to the attention of
Frank WilsonAdvertising Production ManagerAmerican Welding Society550 NW LeJeune Rd.Miami, Fla. 33126
Kim March 2007 LAYOUT:Layout 1 2/13/07 9:52 AM Page 80