Embed Size (px)
Citation preview
WELFARE AND NORDIC CRISIS
MANAGEMENT STRATEGIES
– A COMPARATIVE PROJECT –
Draft Report for the Nordic Council of Ministers
Stefán Ólafsson, Agnar Freyr Helgason, and Kolbeinn Stefánsson
November 2016
Welfare and Nordic Crisis Management Strategies
Page 2 of 85
This report is produced for the Nordic Welfare Watch initiative, supervised by
the Icelandic Ministry of Welfare. It has been produced with financial support
from the Nordic Council of Ministers. However, the contents of the report do not
necessarily reflect the views, policies or recommendations of the Nordic Council
of Ministers.
www.norden.org/nordpub
Nordicco-operation
Nordic co‐operation is one of the world’s most extensive forms of regional
collaboration, involving Denmark, Finland, Iceland, Norway, Sweden, and the
Faroe Islands, Greenland, and Åland.
Nordic co‐operation has firm traditions in politics, the economy, and culture. It
plays an important role in European and international collaboration, and aims at
creating a strong Nordic community in a strong Europe.
Nordic co‐operation seeks to safeguard Nordic and regional interests and
principles in the global community. Common Nordic values help the region
solidify its position as one of the world’s most innovative and competitive.
NordicCouncilofMinisters
Ved Stranden 18 DK-1061 Copenhagen K Phone (+45) 33960200
www.norden.org
Welfare and Nordic Crisis Management Strategies
Page 3 of 85
Summary
The Global Financial Crisis culminated in the winter of 2008-09 as financial
institutions around the world teetered on the brink of collapse. As the crisis
developed, significant differences in government policy choices across countries
became apparent. The response in several countries, including Greece, Ireland,
the UK, Spain, and Portugal, was characterized by harsh austerity measures,
which relied primarily on significant cuts to government spending. Iceland
stands out in this regard among deep crisis countries, as it emphasized revenue
increases more than expenditure cuts in their fiscal policy response.
While fiscal policy choices differed significantly during the crisis, overall changes
to social policy were more characterized by continuity than change, when
looking at all European countries. However, that differed greatly between
countries depending on depth of the crisis and capabilities for countries to
respond. Thus, the extent to which countries were prepared to deal with a deep
recession at the onset of the crisis mattered a great deal. While some countries,
such as the Nordic countries, had forceful automatic stabilizers and generous
unemployment benefit systems in place to cushion the most severe effects of the
crisis, other countries were neither fully prepared nor in a position to implement
measures to adequately redistribute the costs of the crisis. Thus, the social policy
setting at the onset of the crisis played a crucial role in shaping the effects of the
crisis on economic wellbeing.
Individuals who are economically vulnerable to start with are most often those
most sensitive to the effects of crises on their level of living. The welfare state
and government policy responses more generally, play a crucial role in
protecting those groups during crises episodes. Some welfare regimes are more
generous, provide stronger automatic stabilizers and redistribute incomes to a
greater extent, thus reducing poverty risks, in good as well as in bad years. When
correlating wellbeing developments to institutional factors and political-
economic positions we find that the depth of the crisis is the most consequential
factor for producing large wellbeing consequences in the crisis years. However,
welfare regimes are the second largest explanatory factor in wellbeing
consequences. Thus, how the welfare state is employed during times of economic
crises is crucial for the wellbeing consequences of the general population.
Welfare and Nordic Crisis Management Strategies
Page 4 of 85
Table of Contents
1 Introduction.................................................................................................................6
2 TheoriesandApproaches.......................................................................................8
2.1 FiscalPolicy:StimulusorAusterity?......................................................................9
2.1.1 The Keynesian Welfare State of the Post-War Era ................................................ 11
2.1.2 The Breakdown of Keynesianism ................................................................................. 11
2.1.3 The Case Against Discretionary Fiscal Stimulus ..................................................... 12
2.1.4 The Case for Discretionary Fiscal Stimulus .............................................................. 14
2.2 SocialPolicy:RetrenchmentorResilience?.......................................................16
2.2.1 The New Politics of the Welfare State ......................................................................... 17
2.2.2 The Welfare State Retrenched? ..................................................................................... 18
2.3 AnalyticalFramework...............................................................................................21
3 WelfareandGovernmentPolicyResponsestotheGreatRecession....23
3.1 TheGlobalFinancialCrisisUnfolds......................................................................25
3.1.1 Constraints on Government Responses ..................................................................... 26
3.1.2 A World in Recession ......................................................................................................... 28
3.2 EconomicWellbeingandGovernmentPolicyResponses.............................32
3.3 FiscalPolicy...................................................................................................................34
3.3.1 Automatic Stabilizers and Discretionary Fiscal Policy in the Crisis ............... 37
3.4 SocialProtection..........................................................................................................40
3.4.1 The Consequences of the Composition of Austerity Measures ........................ 40
3.4.2 Income Support for Working Households ................................................................ 41
3.4.3 Income Support for the Unemployed .......................................................................... 44
3.5 Discussion......................................................................................................................46
4 WellbeingConsequencesoftheCrisis.............................................................48
4.1UnemploymentExperiences...........................................................................................48
Welfare and Nordic Crisis Management Strategies
Page 5 of 85
4.2FinancialHardshipofHouseholds...............................................................................51
4.3PovertyDevelopments.....................................................................................................53
4.4RealIncomeDevelopments............................................................................................58
5 EconomicVulnerabilityduringtheCrisis......................................................64
5.1 Results.............................................................................................................................66
6.PolicyResponsesinaComparativeFocus..........................................................75
References..........................................................................................................................78
Welfare and Nordic Crisis Management Strategies
Page 6 of 85
1 Introduction
The effects of the global financial crisis of 2008 on the economic wellbeing of
individuals and societies were extensive. The crisis sparked the “Great
Recession”, the most severe economic contraction experienced by advanced
economies in the post-World War II period (Reinhart and Rogoff 2009). Millions
suffered from increasing economic insecurity, became unemployed, or were
plunged into poverty. Even so, the Great Recession is only the latest example of
the negative effects of economic turmoil on wellbeing. A multitude of prior crises
have adversely affected societies in recent history, with the infamous Great
Depression of the 1930s the quintessential example of the potential for economic
hardship to not only disrupt individual lives, but also the very fabric of society.
Government action — or inaction — during economic crises can have profound
effects on wellbeing. Whether governments take a hands off approach, are
actively involved in ameliorating the effects of the crisis, or a mix of the two can
matter a great deal for the human cost of economic crises. In this report we ask
what policies European governments pursued to ameliorate the disruptive
effects of the global financial crisis on individuals and societies during the past
eight years.
We bring two types of empirical evidence to bear on our research questions:
First, a number of country case studies by leading welfare state experts were
commissioned as part of the project, providing detailed information on policy
responses by governments. These case studies inform much of the qualitative
discussion in the empirical chapters. Second, we employ the European Union
Survey of Income and Living Conditions (EU-SILC) to provide an empirically rich
account of household wellbeing developments across Europe throughout the
Great Recession. Bringing the two types of empirical evidence together allows us
to compare and contrast how governments reacted to the economic crisis and
how those actions impacted upon the economic wellbeing of the general
population.

Welfare and Nordic Crisis Management Strategies
Page 7 of 85
The report consists of four substantive chapters, drawn from the forthcoming
book, Welfare and Nordic Crisis Management Strategies, edited by Stefán
Ólafsson, Mary Daly, Olli Kangas, and Joakim Palme. In chapter 2, we discuss
major theories used to account for government policy responses during times of
economic crises. Chapter 3 outlines the depth and duration of the Great
Recession and how governments employed fiscal and social policy to combat the
effects of the crisis on the economic wellbeing of the population. Chapter 4 turns
the attention to the effects of the crisis on individuals and households, while
chapter 5 combines the preceeding macro and micro discussions to account for
the major determinants of changes in wellbeing over the course of the crisis
through the lens of economic vulnerability. Chapter 6 provides a short summary
of the four substantive chapters.
Welfare and Nordic Crisis Management Strategies
Page 8 of 85
2 Theories and Approaches
Policymaking during times of economic crises has long been understood to be
qualitatively different than during “normal” times. While the latter is generally
characterized by public policy theorists as being times where only small-scale,
incremental changes to policies are possible and feasible (e.g. Lindblom 1959),
many argue that times of crises are more susceptible to radical reform. Kingdon
(1984), for example, argues that crises open a “window of opportunity” for
policy reform, while Gourevitch (1986) contends that crises can instigate
“critical realignments”, whereby existing political coalitions that sustain
particular policies are broken up, making dramatic changes to policy possible.
Yet another stream of research considers economic crises fertile ground for so-
called “critical junctures”; brief phases of institutional flux when structural
constraints on policymaking are temporarily relaxed and the range of possible
policy changes becomes larger (Capoccia and Kelemen 2007).
Policymaking — even in times of crisis — does not, however, occur in a vacuum.
Preexisting policies form what Mettler (2015) calls a “policyscape”: That is to
say, a mosaic of policies that generate feedback effects that influence political
behavior, policy agendas, and, ultimately, constrain subsequent policymaking.
Importantly, the policyscape not only defines the status quo faced by
policymakers during crises, but also forms the set of policies that are in effect at
the onset of a crisis. This suggest that the extent to which states are “prepared”
for crises, i.e. have in effect a set of policies which automatically ameliorate the
effects of crisis on the general population, reduces the need for explicit,
discretionary, reaction by the government (Starke et al. 2013).
While there are a variety of policies that can ameliorate the effects of economic
crises on wellbeing, they can broadly be classified according to their scope: On
the one hand, there are general policies that affect the broader population
throughout the crises. Such policies are generally meant to support aggregate
demand and stave of the loss of output, unemployment, and major economic
disruption. On the other hand, there are specific policies that directly affect those
individuals who have been affected by the crises – unemployed persons, those
Welfare and Nordic Crisis Management Strategies
Page 9 of 85
who have been pushed into poverty, and those struggling to make ends meet.
Those are ideal types, as many policies will have elements of both approaches in
their design.
Previous research on policy responses to economic crises has tended to focus on
either one of these broad categories of policies: Gourevitch (1986), for example,
focuses on economic policymaking, without considering social policy in
particular, while Starke et al. (2013) and van Kersbergen et al. (2014), for
example, give prominence to social policy, with economic policy playing a more
limited role. In the following two sections, we will discuss these separate
literatures and shed light on major theories of economic and social policymaking
both during normal times and during times of crises. In particular, we will
review the extent to which preexisting policies may automatically buffer the
effects of economic crises on the general population, but also cases in which
economic crises are likely to induce fundamental policy change that impact upon
the wellbeing of individuals and societies.
2.1 Fiscal Policy: Stimulus or Austerity?
When the Great Depression plunged societies into a deep economic crisis in the
1930s, the dominant view among economists and policymakers was that fiscal
policy had no effect on economic output and unemployment, and as such, the
government shouldn’t actively use fiscal policy to stimulate aggregate demand
and contain unemployment while the economy recovered from the downturn.
The view, often referred to as the “treasure view” of fiscal policy, since it
characterized the position of the British Chancellor of the Exchequer in the early
1930s, is based on the assumption that any government spending crowds out an
equal amount of private spending, such that any increases in public spending are
always matched by decreases in private spending. The premise of the
assumption is that money has to be spent on something and that any borrowing
(or tax increases) by the government to fund increased spending necessarily
implies that there is less money to borrow (or spend) for other actors in the
economy. As a consequence, government spending was assumed to have no net
effect on the economy.
Welfare and Nordic Crisis Management Strategies
Page 10 of 85
As the Great Depression unfolded and governments were unable to recover from
the crisis, the English economist John Maynard Keynes (1936) forcefully argued
against the prevailing view, offering instead a theory of how activist government
policies could raise aggregate demand and hasten the economic recovery. At the
core of Keynes’ theory is the suggestion that the biggest problem of any
economic crisis is involuntary unemployment caused by inadequate economic
demand and that such a situation wouldn’t necessarily self-correct with due
time. Indeed, a destructive cycle could be set in motion: As individuals and firms
prudentially start saving more of their income, aggregate demand falls even
more since less is consumed, which in turn reduces the aggregate income of
individuals and firms and, paradoxically, leads to less total saving (Krugman
2012). Keynes argued that this cycle, sometimes referred to as the “paradox of
thrift”, could entrap an economy in a permanent state of depression if the
government didn’t react appropriately.
Keynes argued that the government could stimulate the economy through either
monetary or fiscal policy or a combination of the two. On the one hand, by
increasing the money supply (“printing money”), monetary policy could be used
to hold back the drop in aggregate income, as well as reduce interest rates,
making savings less attractive and stimulating investment (Krugman 2012, 32).
On the other hand, by increasing government spending (or decreasing
government revenue), fiscal policy could be used to stimulate aggregate demand
and counteract the effects of underconsumption by individuals and firms. Such
fiscal policy measures could both be automatically induced by the state of the
economy (i.e. let lower tax receipts from households due to lower income and
corporations due to lower profits and higher spending on unemployment
benefits “automatically” stabilize the economy) or determined at the discretion
of the government in response to the state of the economy. In any case, Keynes’
argument implies that the two broad policy tools of monetary and fiscal policy
could collectively allow governments to break the cycle of more savings and less
income and, thus, return the economy to normal functioning.
Welfare and Nordic Crisis Management Strategies
Page 11 of 85
2.1.1 The Keynesian Welfare State of the Post-War Era
Keynes’s theory revolutionized the field of macroeconomics and was highly
influential among economists and policymakers in establishing the political-
economic institutional framework of advanced democracies following World
War II. At the international level, a multilateral system of embedded liberalism
was established, which involved the creation of a number of formal institutions,
such as the International Monetary Fund (IMF) and the General Agreement on
Tariffs and Trade (GATT) to regulate monetary and trade relations among
advanced economies (Eichengreen 2008; Ruggie 1982). The defining feature of
the system was that it was predicated upon interventionism at the domestic
level, allowing governments to pursue expansive social and economies policies.
This was the environment in which the Keynesian welfare state blossomed.
Economic policies were actively employed to stabilize economies and pursue the
goal of full employment, while generous welfare policies were developed to
provide income replacement to those needing further support. In most advanced
European countries, corporatism also played a key role, with unions accepting
wage restraint and employers committed to reinvest profits in human and
physical capital. While the extent to which such policies were followed differed
across countries due to a number of factors (e.g. Hall and Soskice 2001), on the
whole this was a period in which policymakers across advanced economies
subscribed to a similar set of views about the proper role of the state in the
economy (Hall 1989).
2.1.2 The Breakdown of Keynesianism
The Trente Glorieuses, the golden years of the Keynesian welfare state, came to
an abrupt end in the early 1970s. Multiple factors caused the decline: At the
domestic level, economic growth began to slow-down, productivity growth
stalled due to the increasing size of the service sector, and skill-biased
technological change put pressure on collective wage bargaining, while at the
international level, the Bretton Woods system of fixed exchange rates came to an
end, financial markets were becoming more open and integrated, and the price
of oil increased sharply. With slowing economic growth, rising inflation, and
Welfare and Nordic Crisis Management Strategies
Page 12 of 85
growing budget deficits, Keynesianism was seen by critics to have failed and the
consensus around the Keynesian welfare state dissolved (Hall 1999).
As Keynesianism lost credibility, monitarist economist theory gained ground and
played an important role in changing beliefs about the proper role of the state in
the economy at the beginning of the 1980s (Blyth 2002; Hall 1993). The primary
goal of macroeconomic policymaking shifted from maintaining full employment
to controlling inflation, with most advanced economies adopting an explicit
inflation target and endowing an independent central bank with the authority
over setting monetary policy. For many countries of the European Union, this
culminated in the establishment of a common currency, which further limited
the room to manoeuvre for national governments (McNamara 1998).
Importantly, the role of fiscal policy in stabilizing the economy was undermined,
and was mostly limited to automatic stabilizers rather than activist,
discretionary stimulus spending (Hall 1999). Indeed, following the 1970s and
right up until 2008, a period of “Great Moderation” in advanced economies, i.e. of
stable, but modest, economic growth and low inflation, lent strong confidence to
the belief that monetary policy was best suited to stabilize the economy
(Blanchard et al. 2010). As such, activist fiscal policy was considered by
mainstream economists to be ineffective and attempts at “fine tuning” the
economy were seen as bound to fail (Auerbach et al. 2010; Taylor 2000). Thus,
the overwhelming consensus within the economics profession and policymaking
circles at the onset of the Great Recession was rather aligned with the view that
governments should not use discretionary fiscal policy to ameliorate the effects
of recessions on the economy.
2.1.3 The Case Against Discretionary Fiscal Stimulus
Several reasons were given for such a strong position against activist fiscal
policy. First of all, policymaking occurs with a considerable lag. From the time
policymakers become aware of an economic recession, they must formulate a
policy response, enact legislation, and implement the policy, and there might be
some lag from the time a policy is implemented until it has the desired effect.
With such a long lag, critics argue that a recession might be over well before the
Welfare and Nordic Crisis Management Strategies
Page 13 of 85
fiscal policy response became effective. As such, this argument applies
specifically to discretionary fiscal policy, rather than automatic stabilizers, since
the latter are implemented automatically as the state of the economy changes.
Second, as suggested by Lucas’s (1976) critique, the rational expectations of
individuals, firms, and investors can undermine the effectiveness of any fiscal
stimulus during a recession. Thus, for example, if the government implements a
stimulus which is funded through government borrowing, rational actors should
reduce their own spending, since they anticipate higher taxes and higher interest
rates in the future, to repay the loans the government took out during the
recession. The net effect of increases in government spending should therefore
be minimal, since reactions by individuals, corporations, and investors to
government actions would counteract the effects of the stimulus itself.
Third, fiscal stimulus funded through government borrowing increases
sovereign debt, which can bring the long-term solvency of the country into
question and increase the interest rate premium charged by international
financial markets (Garrett 1998; Mosley 2003). As such, stimulating the economy
in the present might burden the future budget of the country with interest
payments, which in turn might limit the country’s potential for maintaining
current spending and tax levels in the future, as well as reducing economic
growth. In the extreme, countries which have a high risk of sovereign default
might lose access to international funding markets and face sovereign default
without external assistance.
In a series of influential papers, Alesina and collaborators (Alesina and Ardagna
1998, 2010, 2012; Alesina and Perotti 1997) warn of the dangers of
unsustainable spending during recessions for future economic growth and even
go on to argue that rather than use fiscal stimulus to recover from an economic
recession, austerity — or fiscal consolidation – is more likely to renew economic
growth. The strategy, generally referred to as “expansionary austerity”, suggests
that the confidence of households and markets in the solvency of the government
is critical for economic growth. By pursuing austere policies, authorities increase
confidence in the future solvency of the government, which reduces expectations
of high taxation and high interest rates in the future. As such, the theory implies
Welfare and Nordic Crisis Management Strategies
Page 14 of 85
that less public spending (austerity) leads to more private spending and, thus,
actually causes an economic expansion. Alesina et al., furthermore, maintain that
to be successful, a fiscal consolidation must be expenditure-based, or in other
words, that governments should focus on reducing transfer payments to benefit
recipients and the wages of public employees, rather than raising taxes on the
general public.
Collectively, these points suggest that governments should either refrain from
pursuing a plan of fiscal stimulus during downturns, as their actions would in
most likelihood have little or no effect, or actually pursue a plan of austerity, in
an effort to increase confidence in the solvency of the government. Thus, rather
than employing discretionary fiscal policy to stabilize the economy over the
business cycle, authorities should primarily employ monetary policy to affect
aggregate demand.
2.1.4 The Case for Discretionary Fiscal Stimulus
While this was the mainstream view prior to the crises, many argued that the
mainstream view was wrongheaded, both during minor recessions, but
especially when faced with major disruptions, such as the Great Recession.
Harking back to the prescripts of Keynes himself, many forcefully argued for a
policy of fiscal stimulus at the onset of the Great Recession, dismissing concerns
from major adherents of austerity (Blyth 2013; e.g. Krugman 2012). The case
against austerity builds on multiple pillars: Surely, Keynes’ theoretical insight
plays an important role, but so do concerns about the distributional fairness of
austerity, and the track record of austerity in the recent past.
On the one hand, austerity, especially the expenditure-based variety advocated
by Alesina and Ardagna, is distributionally unfair (Blyth 2013). In its simplest
form, governments pursuing an austere fiscal policy, aim to spend considerably
less than they collect in revenues, accumulating a budget surplus and lowering
government debt. There are, of course, many ways in which governments can go
about pursuing such a goal: Governments can raise taxes on the general public or
the wealthy, they can reduce spending overhead or operational costs, on
infrastructure spending, on defense spending, or a number of government
Welfare and Nordic Crisis Management Strategies
Page 15 of 85
programs that do not directly contribute to maintaining the economic wellbeing
of the national population. However, in the expenditure-based variety, the
individuals who bear the weight of austerity on their shoulders are the members
of society least likely to be able to do so, since such a policy is specifically aimed
at reducing the costs of welfare policy programs and the government wage bill.
As such, benefit recipients and government employees are likely to suffer
disproportionately under austerity. The effects are likely to be doubly harmful
during economic recessions, when more individuals are likely to seek benefits
due to unemployment and underemployment. Thus, austerity can have very
specific distributional implications, especially for the most vulnerable members
of society.
On the other hand, recent research suggests that austerity simply doesn’t have
the effects claimed by its advocates. A number of recent studies find that the
short-term effects of austerity are in line with arguments made by Keynesian
economists, rather than the expansionary effects argued by Alesina and others.
Romer and Romer (2010), for example, find that a tax increase of 1 percent of
GDP reduces output over the next three years by close to three percent, while
Guajardo et al. (2014) find that fiscal consolidations reduce economic output and
increase unemployment in the short-term and that the short-term effects are
contractionary regardless of whether a country is perceived to have a high
sovereign default risk. In addition to these findings, the case against austerity has
further been supported by the debunking of an influential paper by Reinhart and
Rogoff (2010), which argued that when a country’s external debt levels are in
excess of 90 percent of GDP, economic growth is considerably lower than at
lower debt levels. Indeed, Herndon et al. (2014) show that the findings are
largely due to serious methodological errors by the authors and, once the errors
are rectified, there does not appear to be a consistent relationship between debt
levels and economic growth.
While the overall verdict on the macroeconomic effects of fiscal stimulus and
austerity are becoming clearer, the distributional consequences are what matter
most for the effects of economic crisis on wellbeing. By maintaining economic
activity and containing unemployment, a plan of fiscal stimulus can limit the
Welfare and Nordic Crisis Management Strategies
Page 16 of 85
costs imposed by crises on individuals and societies. While it is important that
such plans are fiscally responsible, i.e. that they do not jeopordize the future
solvency of the government, it it important to note that they limit other kinds of
costs: Most importantly, human capital is protected from erosion and suffering
due to poverty and material deprivation is limited. In this regard, Keynesian
fiscal stimulus is likely to play a particularly important role in maintaining
economic wellbeing during crises.
2.2 Social Policy: Retrenchment or Resilience?
The welfare state is the primary policy mechanism through which governments
protect populations from the vagaries of the market economy. Unsurprisingly,
the increasing economic insecurity caused by economic turmoil often brings
about intense pressure for expanding the welfare state by those directly affected
by crises, as well as risk-averse individuals concerned for their economic
security. Thus, as Polanyi (1944) famously argued, the vagaries of the self-
regulating market can spontaneously bring about a movement towards
increasing social protection (the “double movement”).
There is much evidence to suggest that major economic downturns played such a
role in Western societies during the early 20th century. Cutler and Johnson
(2004), for example, attribute the introduction of major social insurance
programs in multiple countries to deep economic recessions and Miron and Weil
(1998) argue that without the Great Depression, Roosevelt’s landmark Social
Security Act of 1935 might not have been introduced in the United States.
Similarly, Castles (2010) suggests the Great Depression had a catalytic effect on
social policy developments in Sweden and New Zealand. More generally, rising
economic insecurity among the general public in the early 20th century is
commonly thought to have played an important role in the development of
generous welfare policies that protect individuals from a variety of social risks
associated with the market economy (Baldwin 1990).
The period following World War II marked what many consider to be the height
of welfare state expansion. However, much like with Keynesian fiscal policy, the
generous welfare state of advanced democracies came under increasing pressure
Welfare and Nordic Crisis Management Strategies
Page 17 of 85
from the 1970s onward (Hall 2013; Korpi 2003; Scharpf 2000). Many even went
so far as to predict the ultimate collapse of the welfare state (e.g. Offe 1984;
Svallfors and Taylor-Gooby 1999). The implications were clear: In the period
following the 1970s, the golden years of the Keynesian welfare state were gone
and a period of welfare state reconstruction or retrenchment was upon
advanced democracies.
2.2.1 The New Politics of the Welfare State
Even so, there is considerable disagreement over the extent of retrenchment
achieved. Writing about the governments of Margret Thatcher in the UK and of
Ronald Reagan in the US –– two most likely cases –– Paul Pierson claims that “the
welfare state stands out as an island of relative stability” (1994, 5), compared to
other policy areas. Pierson (1994, 1996) makes the central claim that welfare
states themselves have changed the context in which they operate. Because of
this, retrenchment is not simply expansion in reverse –– there are entirely
different factors at work. While the politics of expansion involve enacting
popular policies in an underdeveloped interest group environment, posing only
diffuse costs through taxation, retrenchment involves dismantling popular
policies with concentrated benefits that enjoy the support of entrenched interest
groups.
This path dependent nature of the welfare state constrains policy changes that
reform-minded politicians can pursue. Politicians, being both policy and office
seekers, will have to take that into account when balancing those two objectives.
Those wanting to retrench the welfare state due to ideological reasons and stay
in office, will try to minimize the associated political costs of retrenchment by
manipulating the information available to possible opponents and voters about
the policy changes. This can be achieved by lowering the visibility of unpopular
policies, obscuring responsibility, hiding information about possible
consequences of reform, making side-payments to politically important groups
for lost benefits, or achieving changes through decrementalism (Pierson 1994,
19–22). Whenever possible, governments will seek to gain broad support for
their agenda and thus spread the blame. For governments that do not enjoy a
Welfare and Nordic Crisis Management Strategies
Page 18 of 85
wide electoral margin to “buffer” unpopular decisions, such “blame avoidance”
will become even more important (Weaver 1986).
Pierson argues that in this new environment it is justifiable to talk about an
entirely “new politics” of retrenchment, which is quite different from the “old
politics” of expansion. Pierson thus challenges the relevance of the power
resources approach in this new context, maintaining that labor unions, left-wing
parties and other social movements that expanded the state are no longer of
central relevance to its sustainability. Instead, the welfare state has taken on a
life of its own with the continuation of individual programs depending on their
popularity and the associated interest groups. Retrenchment will thus only be
possible when politicians can pursue the strategies outlined above and “hide”
their success from the watchful eyes of the public and beneficiaries. More recent
work by Huber and Stephens (2014) suggests that this is indeed the case for
political partisanship — i.e. while left-wing parties played an important role in
the expansion of the welfare state, they are less important for the sustainability
of the welfare state, once it is in place.
2.2.2 The Welfare State Retrenched?
Pierson’s claim about the resilience of the welfare state to radical restructuring
has, however, been met with considerable skepticism, with himself
acknowledging more recently that the resilience of the welfare state might be
overstated in his earlier work (Pierson 2015). Three lines of arguments are
especially salient.
First, as Pierson focuses on the US and the UK in his study, two liberal welfare
states, he disregards potential differences in institutional dynamics under
alternative welfare state regimes. Later studies critiqued Pierson for exactly this
and pointed out that his main conclusions did not hold in different settings (e.g.
Anderson 2001; Swank 2001). This is especially so regarding his treatment of
the “old politics” and thus, the distinctiveness of the “new politics”. While the
liberal welfare states are dominated by narrow, fragmented interest groups, the
social democratic welfare states are characterized by encompassing, solidaristic
labor market movements. In such an environment, the interests of those that
Welfare and Nordic Crisis Management Strategies
Page 19 of 85
depend on the social programs in question will not be represented by client-
based interest groups, but rather the encompassing labor movement (Anderson
2001, 1069). As Swank (2001, 208) shows, such large encompassing interest
groups are likely to constitute a major barrier to radical reform of the welfare
state. Thus, Pierson’s argument about the dominance of concentrated interest
groups has limited relevance in the social democratic regimes.
Second, Korpi and Palme (2003) argue that Pierson overstates the
distinctiveness of politics in mature welfare states vis-a-vis politics during
welfare state expansion. As they suggest, the expansion of the welfare state was
not simply a popular credit claiming affair, welcomed by all voters. Indeed,
concerns over high levels of taxation and the growth of “big government” were
highly salient throughout the golden years of the welfare state, suggesting that
the politics of expansion are not qualitatively different from the politics of
retrenchment. Korpi and Palme (2003), furthermore, claim that the primary
beneficiaries of the welfare state are not necessarily client-based interest groups,
but rather the mass of risk-averse citizens, who benefit from the existence of
social insurance schemes, whether or not they actually claim benefits over their
lifetime. Again, the implication is that the two periods of welfare state
developments are not as different as Pierson maintains.
Finally, a number of scholars critique Pierson’s narrow conceptualization of the
welfare state and his policy-based approach. By focusing only on observable
changes in policy, Pierson overlooks the social context of those policies and the
goals they are meant to achieve (Hacker 2004). Thus, while the working class
predominantly used its resources to protect male breadwinners from losing
their ability to provide for their families due to unemployment, sickness,
invalidity or old age at the dawn of the modern welfare state, the risks facing
citizens have changed substantially in the last thirty years (Bonoli 2001).
Furthermore, as Clayton and Pontusson (1998) point out, in the context of rising
inequality and insecurity an unchanged welfare state will effectively have been
retrenched. Ignoring these changes and focusing only on spending cuts or
reforms of social programs will thus overlook how the welfare state affects the
labor market and vice versa.
Welfare and Nordic Crisis Management Strategies
Page 20 of 85
In later work, Pierson (2001) makes his analysis of welfare state change and how
governments deal with pressures differently more nuanced. Instead of focusing
only on retrenchment per se, he accepts that reducing change to a single
dimension is counterproductive. The resulting dimensions suggested by Pierson
are three: i) re-commodification, which entails dismantling social programs and
making individuals more reliant on the market, ii) cost containment, which
consists of those measures taken to make the welfare state more efficient and
streamlined without sacrificing quality services, and iii) recalibration, which
entails modifying programs to better achieve historical goals (rationalization)
and adapting them to changing risks and norms (updating). These three
dimensions do not play out in the same way in all welfare state regimes. Indeed,
Pierson argues that “there is not a single ‘new politics’ of the welfare state, but
different politics in different configurations” (2001, 455). Consequently, the
welfare states of advanced industrial societies do not seem to be converging, as
many have predicted, but rather growing apart (Swank 2002).
What are the implications of these developments for wellbeing in times of
economic turmoil? On the one hand, they suggest that preexisting policies of
social protection are likely to matter a great deal for the effects of economic
crises on wellbeing. Generous social policies already in place will be difficult to
retrench and are likely to enjoy support from a large part of the population.
Moreover, since they will “automatically” be triggered at the onset of an
economic crisis, they will buffer the effects of turmoil on wellbeing without any
lags in policymaking. On the other hand, however, they suggest that focusing
solely on preexisting policies might be misguided. As Hacker (2004) highlights,
“hidden” retrenchment can undermine preexisting policies, making it critical to
analyze not only what governments do, what also what they do not do in
response to changes in social risks faced by the general population. Indeed, as
Hacker and Pierson (2010) argue, such “hidden” retrenchment has played a
critical role in undermining welfare policy and economic equality in the United
States.
Welfare and Nordic Crisis Management Strategies
Page 21 of 85
2.3 Analytical Framework
The preceding discussion suggests that we can analyze policy responses to
economic crises along two dimensions, each with implications for the wellbeing
of the general population. First, we can analyze the extent to which governments
expand, maintain, or retrench, social policy programs which provide income
replacement or income support for economically vulnerable individuals and
households. These can be individuals who are directly affected by the economic
crises due to the loss of their employment or increased debt burden, but also
recipients of benefits due to old age, disability, and sickness, social assistance, or
family benefits (e.g. children’s allowance or parental leave). Second, we can
analyze the extent to which governments seek to stimulate the economy to
maintain aggregate demand while the private sector recovers, or alternatively,
the extent to which they pursue austerity, with limited concern for stimulating
demand. This latter dimension primarily affects the wellbeing of the general
population indirectly and indiscriminately, i.e. such policies are not targeted
specifically at those affected by the crisis condition.
These two dimensions are commonly collapsed into a single dimension, with
welfare state retrenchment associated with austere fiscal policies and, likewise,
welfare state expansion (or maintenance) associated with Keynesian fiscal
stimulus. However, while the two pairs of policies can certainly go together, they
do not necessarily go together. Thus, a government might pursue austere
policies, but at the same time protect important social policy programs to protect
the economically vulnerable. Likewise, a government might stimulate the
economy by deficit spending, but pursue welfare state reforms that curtail social
rights. Furthermore, each of these different combinations might impact upon the
wellbeing of individuals and household differently.
In the following chapter, we will analyze government crises strategies using a
variety of indicators that map onto these two dimensions. Our primary focus will
be on whether countries pursued a strategy of austerity or stimulus in fiscal
policy, on the one hand, and to what extent social policies were employed to
buffer the effects of the crises on the affected population, on the other hand. This
entails outlining both discretionary policymaking during and in the aftermath of
Welfare and Nordic Crisis Management Strategies
Page 22 of 85
the crisis, but also analyzing the extent to which policy at the onset of the crisis
was equipped with dealing with the sudden changes in wellbeing due to the
crises, for example through automatic stabilizers.
Welfare and Nordic Crisis Management Strategies
Page 23 of 85
3 Welfare and Government Policy Responses to the Great
Recession
In the fall of 2007, the first casualties of the Global Financial Crisis emerged. The
U.S. subprime mortgage crisis erupted and several other countries experienced
difficulties due to slowdowns in construction and real estate. In the next couple
of months, the trouble spread from one country to another, culminating in a full-
blown global crisis following the fall of Lehman Brothers in September 2008
(Cameron 2012). The deepest recession to hit advanced economies since the
Great Depression ensued (Reinhart and Rogoff 2009), commonly dubbed the
“Great Recession”. As the recession abated, the Eurozone crisis erupted, which
further impacted societies on the European periphery (Copelovitch et al. 2016).
While the initial policy response by governments was focused on saving financial
institutions and staving off a global recession, the effects of the crisis on the
economic wellbeing of individuals and households came to the fore as the crisis
unfolded. Unsurprisingly, such effects were particularly consequential in the
countries hit hardest by the crisis, as painful, and highly controversial, austerity
measures were implemented in efforts to consolidate government finances, often
under the tutelage of international institutions (Bermeo and Pontusson 2012).
In the following two sections, we begin by outlining the macroeconomic
environment that formed the backdrop of government policy responses in the
aftermath of the Global Financial Crisis.1 We then take up the task of describing
the main contours of government policy responses, focusing on how
governments employed fiscal policy to ameliorate the effects of the crisis on the
general population and, in particular, to what extent policies of social protection
were altered in response to the economic turmoil that ensued.
We find that there are broad similarities in how governments initially responded
to the crisis, although the direct costs of refinancing financial institutions and the
1 For detailed discussions of the various causes of the crisis, see Reinhart and Rogoff (2009) and Baldwin et al. (2015).
Welfare and Nordic Crisis Management Strategies
Page 24 of 85
precarious fiscal position of the state limited the policy options available to the
countries that were hardest hit by the crisis. The pre-crisis situation in Greece
was particularly dire, although several other economies, including the Baltics,
Iceland, and Ireland, were particularly vulnerable to the effects of sudden
changes in the flow of international capital. At the same time, core EU countries
were relatively well positioned financially to respond effectively to an economic
contraction.
As it turned out, the most vulnerable countries at the onset of the crisis stand out
in terms of the size of the economic contraction caused by the financial crisis.
The contraction in Greece was particularly large, with GDP dropping by over
25% from the pre-crisis peak to the post-crisis trough. The Baltics, Iceland, and
Ireland, also suffered large decreases in GDP following the financial crisis, but
unlike Greece, economic recovery began soon after the global recession in the
winter of 2008-09. The same cannot be said for Spain, Portugal, and Italy, which,
like Greece, were strongly affected by the Eurozone crisis, which culminated in
2012. Eight years after the financial crisis erupted, the effects of the crisis still
linger across OECD countries. Thus, GDP in a third of the 30 countries under
consideration is still below the pre-crisis peak value of GDP, underlining the
long-term disruptive effects of the crisis on economic activity. Again, Greece
stands out as the country most affected by the crisis. However, there are also
countries which have enjoyed significant economic recoveries since the depths
of the crisis: Both the Icelandic and Irish economies, for example, suffered
greatly during the crisis, but have since than surpassed their pre-crisis peak GDP.
As the crisis developed, significant differences in fiscal policy choices across
countries became apparent. The response in several countries, including Greece,
Ireland, the UK, Spain, and Portugal, was characterized by harsh austerity
measures, which relied primarily on significant cuts to government spending.
Iceland stands out in this regard, as it was the only deep crisis country which
emphasized revenue increases rather than expenditure cuts in their fiscal policy
response. Other countries, less affected by the crisis, pursued a mix of
stimulating fiscal policies that were more conducive to maintaining aggregate
demand and supporting economic wellbeing.
Welfare and Nordic Crisis Management Strategies
Page 25 of 85
While fiscal policy choices differed significantly during the crisis, overall changes
to social policy were rather characterized by continuity than change. Thus, the
extent to which countries were prepared to deal with a deep recession at the
onset of the crisis mattered a great deal. While some countries, such as the
Nordic countries, had forceful automatic stabilizers and generous unemployment
benefit systems in place to cushion the most severe effects of the crisis, other
countries were neither fully prepared nor in a position to implement measures
to adequately redistribute the costs of the crisis. Even so, Ireland and Greece
stand out as cases of significant social policy retrenchment, while Iceland and
Slovenia stand out as cases where redistributive measures played a larger role as
the crisis evolved. In any case, the social policy setting at the onset of the crisis
played a crucial role in shaping the effects of the crisis on economic wellbeing.
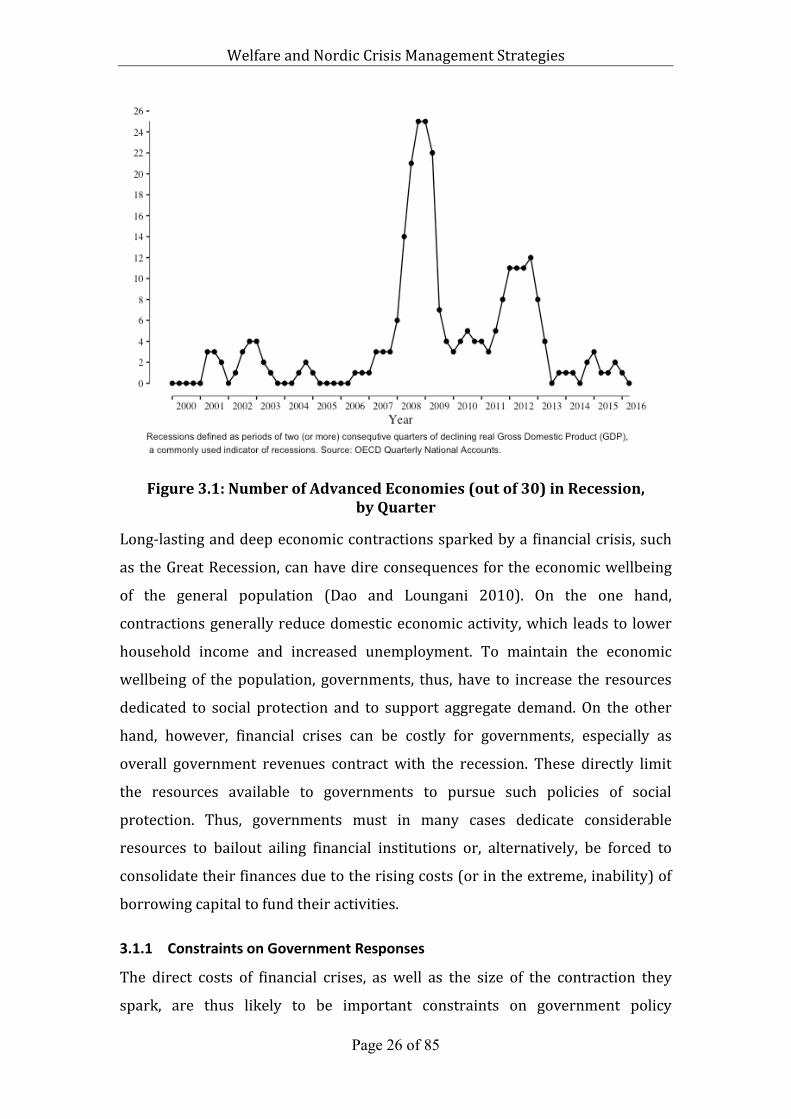
3.1 The Global Financial Crisis Unfolds
Less than a year after the U.S. subprime mortgage crisis erupted, the global
economy teetered on the brink of collapse. Figure 3.1 traces the international
scope of the crisis in over 30 advanced economies from 2000 onward, showing
the number of countries experiencing recession in any given quarter. While only
three of the economies were in recession in the final quarter of 2007, 22 were in
recession in the fall of 2008 and 26 out of 30 countries were in recession at the
peak of the crisis, in the first quarter of 2009. The global economy picked up
steam later in 2009, with GDP recovering in most countries. However, as the
Eurozone crisis unfolded another widespread downturn took place between
2011 and 2012, with just under half of the economies experiencing another deep
recession. In 2013, economic recovery had resumed in most countries, albeit at
differing speeds.
Welfare and Nordic Crisis Management Strategies
Page 26 of 85
Figure3.1:NumberofAdvancedEconomies(outof30)inRecession,byQuarter
Long-lasting and deep economic contractions sparked by a financial crisis, such
as the Great Recession, can have dire consequences for the economic wellbeing
of the general population (Dao and Loungani 2010). On the one hand,
contractions generally reduce domestic economic activity, which leads to lower
household income and increased unemployment. To maintain the economic
wellbeing of the population, governments, thus, have to increase the resources
dedicated to social protection and to support aggregate demand. On the other
hand, however, financial crises can be costly for governments, especially as
overall government revenues contract with the recession. These directly limit
the resources available to governments to pursue such policies of social
protection. Thus, governments must in many cases dedicate considerable
resources to bailout ailing financial institutions or, alternatively, be forced to
consolidate their finances due to the rising costs (or in the extreme, inability) of
borrowing capital to fund their activities.
3.1.1 Constraints on Government Responses
The direct costs of financial crises, as well as the size of the contraction they
spark, are thus likely to be important constraints on government policy
Welfare and Nordic Crisis Management Strategies
Page 27 of 85
responses, especially for countries that enter a recession already in a precarious
financial situation.
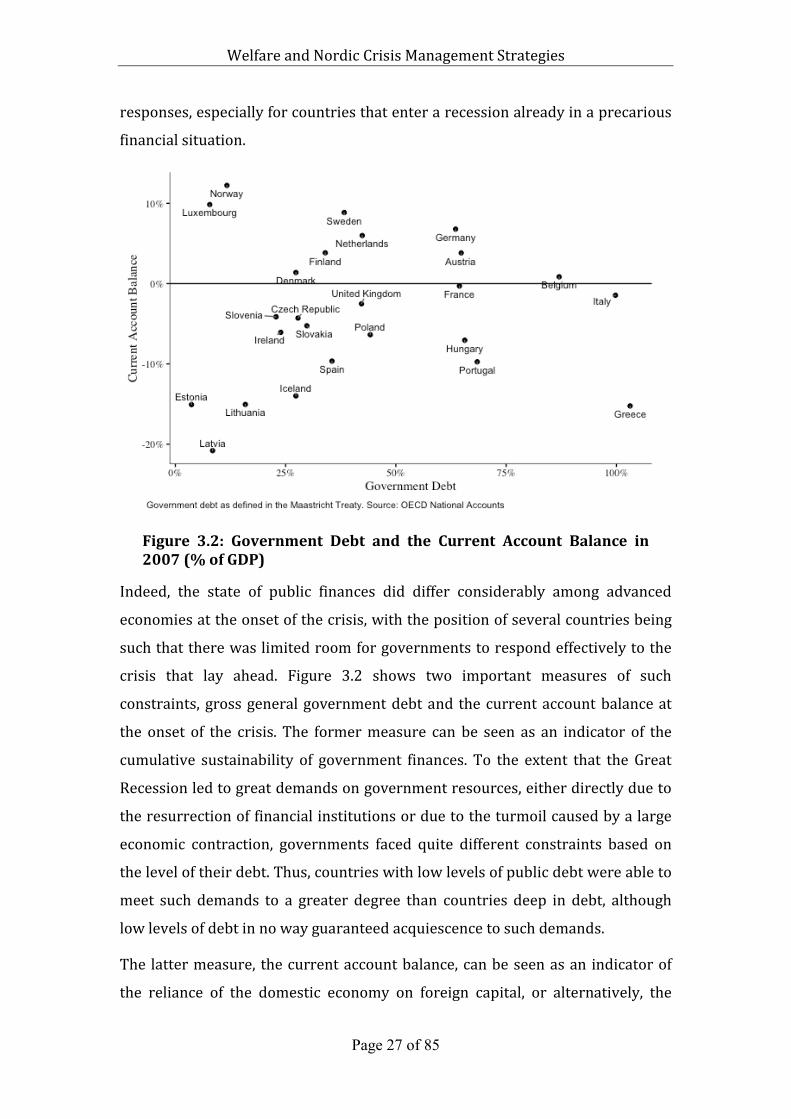
Figure 3.2: Government Debt and the Current Account Balance in2007(%ofGDP)
Indeed, the state of public finances did differ considerably among advanced
economies at the onset of the crisis, with the position of several countries being
such that there was limited room for governments to respond effectively to the
crisis that lay ahead. Figure 3.2 shows two important measures of such
constraints, gross general government debt and the current account balance at
the onset of the crisis. The former measure can be seen as an indicator of the
cumulative sustainability of government finances. To the extent that the Great
Recession led to great demands on government resources, either directly due to
the resurrection of financial institutions or due to the turmoil caused by a large
economic contraction, governments faced quite different constraints based on
the level of their debt. Thus, countries with low levels of public debt were able to
meet such demands to a greater degree than countries deep in debt, although
low levels of debt in no way guaranteed acquiescence to such demands.
The latter measure, the current account balance, can be seen as an indicator of
the reliance of the domestic economy on foreign capital, or alternatively, the
Welfare and Nordic Crisis Management Strategies
Page 28 of 85
difference between what a country invests and saves abroad. After the
establishment of the Euro and in the lead up to the crisis, such imbalances
became especially large within the European Union, with capital flowing from
core countries to countries on the periphery (Copelovitch et al. 2016). Rather
than invest the inflow of credit in productive resources, it was generally used to
fuel domestic consumption and asset bubbles, with governments doing little to
counteract the growing imbalances (Lane 2012). As the crisis unfolded and fears
of defaults on debt increased, cross-border lending came to a sudden stop,
causing a balance of payment crisis in periphery countries, which would later
develop into a full-blown sovereign debt crisis (Baldwin et al. 2015).
As the figure shows, Greece was unique in its precarious position on both
indicators, having accumulated large public debts as well as being reliant on
capital inflows before the crisis began. Italy and Belgium also had extremely high
levels of public debt, although they were not as reliant on foreign capital. Several
other countries, however, entered the crisis with a large exposure to cross-
border lending, including the Baltic States, Iceland, Spain, and Portugal.
As it turned out, the countries in the most precarious position at the onset of the
crisis also incurred the largest direct costs due to the failure of financial
institutions. The biggest direct costs were suffered by Iceland and Ireland, which
each contributed over 40% of GDP from 2008 to 2011 to recapitalize financial
institutions, with Greece already suffering the third largest costs, at just under
30% of GDP (Laeven and Valencia 2013). Greece’s cost of the crisis increased
even further as the crisis lingered on. The Netherlands and the United Kingdom
also had considerable losses, with Denmark being the only other Nordic country
(apart from Iceland) to bear considerable direct costs due to the restructuring of
financial institutions. Most advanced economies, however, suffered negligible
direct fiscal costs due to a banking crisis.
3.1.2 A World in Recession
Even though an outright banking crisis only occurred in a couple of countries,
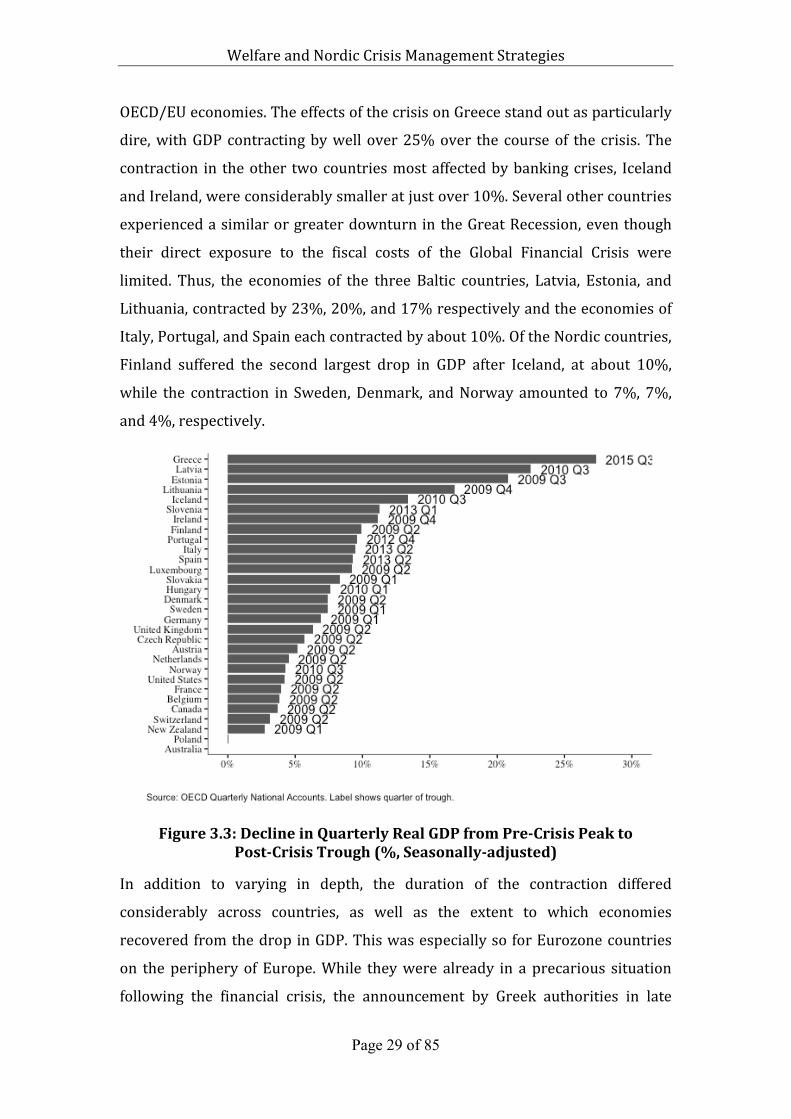
their effects were felt throughout the global economy. Figure 3.3 shows the
decline in quarterly real GDP from pre-crisis peak to post-crisis trough in 30
Welfare and Nordic Crisis Management Strategies
Page 29 of 85
OECD/EU economies. The effects of the crisis on Greece stand out as particularly
dire, with GDP contracting by well over 25% over the course of the crisis. The
contraction in the other two countries most affected by banking crises, Iceland
and Ireland, were considerably smaller at just over 10%. Several other countries
experienced a similar or greater downturn in the Great Recession, even though
their direct exposure to the fiscal costs of the Global Financial Crisis were
limited. Thus, the economies of the three Baltic countries, Latvia, Estonia, and
Lithuania, contracted by 23%, 20%, and 17% respectively and the economies of
Italy, Portugal, and Spain each contracted by about 10%. Of the Nordic countries,
Finland suffered the second largest drop in GDP after Iceland, at about 10%,
while the contraction in Sweden, Denmark, and Norway amounted to 7%, 7%,
and 4%, respectively.
Figure3.3:DeclineinQuarterlyRealGDPfromPre-CrisisPeaktoPost-CrisisTrough(%,Seasonally-adjusted)
In addition to varying in depth, the duration of the contraction differed
considerably across countries, as well as the extent to which economies
recovered from the drop in GDP. This was especially so for Eurozone countries
on the periphery of Europe. While they were already in a precarious situation
following the financial crisis, the announcement by Greek authorities in late
Welfare and Nordic Crisis Management Strategies
Page 30 of 85
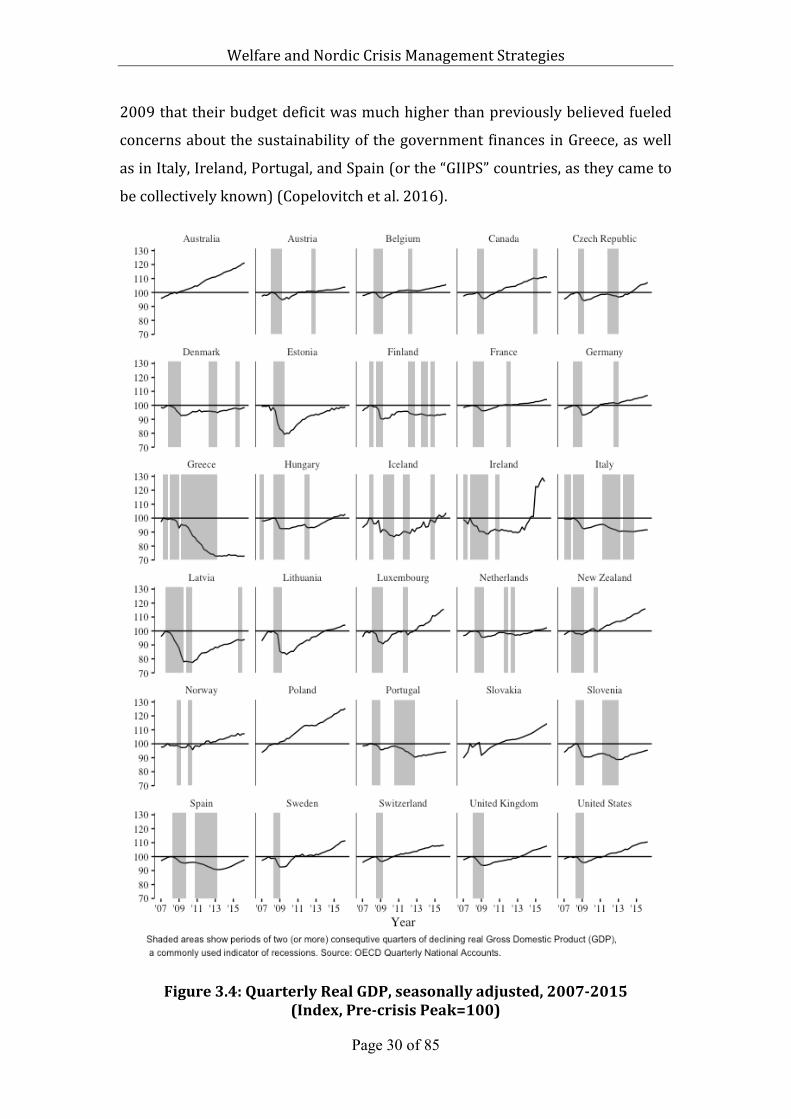
2009 that their budget deficit was much higher than previously believed fueled
concerns about the sustainability of the government finances in Greece, as well
as in Italy, Ireland, Portugal, and Spain (or the “GIIPS” countries, as they came to
be collectively known) (Copelovitch et al. 2016).
Figure3.4:QuarterlyRealGDP,seasonallyadjusted,2007-2015(Index,Pre-crisisPeak=100)
Welfare and Nordic Crisis Management Strategies
Page 31 of 85
Figure 3.4 shows how quarterly real GDP developed in our sample of 30
countries from 2007 to 2015, with periods of recession highlighted in gray.
Comparing and contrasting the timelines of each case, shows several features
which deserve emphasis.
Firstly, the toll of the crisis in Greece is without parallel in terms of depth,
duration, and lack of recovery. After a long period of continuous contraction,
GDP had settled at about a 30% lower value in 2015 than before the crisis.
Second, Iceland and Ireland had both passed their pre-crisis peak GDP in 2015,
with growth in Ireland being especially fast in the last couple of years.2 Third, the
Baltic states have enjoyed continous growth for multiple years after sharp
declines in economic output during 2008-9. Fourth, the Southern European
neighbours of Greece — Italy, Portugal, and Spain — all experienced a sizable
recession around 2012, amid fears of a default on sovereign debt. Both Italy and
Portugal remain well below their pre-crisis GDP peak. Finally, the Nordic
countries have fared quite differently over the course of the past six years. While
Norway and Sweden (and Iceland) are recovering, economic growth in Denmark
and Finland remains sluggish and they are still below their pre-crisis peak at the
time of writing. This is so, even though these countries entered the recession
with relatively low public debt and suffered limited costs due to restructuring of
financial institutions.
The overall picture of the effects of the crisis on economic conditions, thus, varies
considerably across countries with seemingly little connection to the extent of
the initial costs of the Great Recession. The Greek case is a clear outlier with
respect to the depth and duration of the crisis, and their poor recovery. However,
in several other deep crisis countries, such as Iceland, Ireland, and the Baltics,
the recovery has been strong, with little to indicate the initial severity of the
crisis. Conversely, the initial effects of the crisis in Portugal, Italy, and Spain were
2 Note that in the first quarter of 2015, the Irish economy grew by over 20%. This phenomenal growth rate is largely attributable the relocation of large multinational companies to Ireland in the period, rather than changes in the underlying economy. See European Commission (2016a) for further details.
Welfare and Nordic Crisis Management Strategies
Page 32 of 85
rather limited, but with the escalation of the Eurozone crisis, the crisis situation
lasted for a relatively long period and even still the economic outlook remains
bleak, at least in Portugal and Italy. Finally, several countries, such as Denmark,
Finland, and the Netherlands, did not suffer a large economic contraction
following the crisis, but have nonetheless not experienced a return to pre-crisis
growth in the period since the Great Recession. Clearly, factors other than the
severity of the initial downturn affected how countries recovered from the crisis.
3.2 Economic Wellbeing and Government Policy Responses
While the initial policy response by governments was focused on saving financial
institutions and staving off a global recession, the effects of the crisis on the
economic wellbeing of individuals and households came to the fore as the crisis
unfolded. How governments subsequently acted was heavily characterized by
two dimensions of “rebalancing”, internationally and domestically (Frieden
2015).
Internationally, countries running a large current account deficit in the lead up to
the crisis were forced to swiftly reduce aggregate consumption and increase
exports, to regain their current account balance. As cross-border lending came to
a sudden stop, this required several countries to seek assistance from
international institutions to buffer the speed of the required adjustment.
Iceland was the first when it entered an IMF program in November 2008, Latvia
entered into an agreement with the IMF and European Union in December 2008,
while Greece, Ireland, Portugal, and Cyprus each entered macroeconomic
adjustment programs with the “Troika” of the IMF, the European Commision,
and the European Central Bank. Greece agreed to its first bailout in May 2010, a
second bailout in February 2012, and a third bailout in July 2015; Ireland
entered into an agreement with the Troika in November 2010; Portugal in May
2011, and Cyprus in March 2013. Furthermore, Spain sought out assistance from
the Troika in June 2012 to recapitalize the banking system, but did not enter a
macroeconomic adjustment program as the other six countries. The adjustment
programs each involved conditions requiring the countries to take rapid steps to
reduce the budget deficit, effectively forcing the countries to give up their policy
Welfare and Nordic Crisis Management Strategies
Page 33 of 85
autonomy and eroding their ability to provide social protection to the general
population (Baldwin et al. 2015). The required austerity measures caused a
heated conflict between creditor and debtor countries, with creditors demanding
swift domestic adjustment from debtors and debtors requesting a longer
adjustment period (2015, 6).
Domestically, governments sought to minimize the effects of the crisis on
aggregate demand. Their ability to do so, however, was constrained by the state
of public finances at the onset of the crisis, the direct fiscal costs of the crisis, as
well as the extent to which international rebalancing was required. For current
account deficit countries with an independent currency, e.g. Iceland, an exchange
rate depreciation could shoulder part of the necessary adjustment. For other
countries, however, much of the adjustment was accomplished internally,
through painful macroeconomic austerity (Copelovitch et al. 2016).
In what follows, we outline changes and continuity in government policies aimed
directly at ameliorating the effects of the crisis on economic wellbeing. As argued
by Pontusson and Raess (2012), the policy menu available to governments was
much narrower than in earlier crises. Thus, protectionism, currency
devaluations, nationalizations, and industrial policies were mostly off the table,
and although monetary policy played a crucial role in stimulating economies
throughout the crisis, it is no longer directly under the control of elected national
official, making it more uniform across countries (e.g. see Mandelkern 2016).
Thus, fiscal policy came to play a central role in the crisis response of
governments.
We begin by outlining whether governments employed fiscal policy to maintain
aggregate demand throughout the crisis by way of a fiscal stimulus or whether
they focused on austerity measures to balance the budget and current account.
We go on to delineate the relative effects of automatic stabilizers and
discretionary policymaking, focusing separately on changes in government
taxation and expenditures. Finally, we outline the extent to which tax and benefit
systems were changed in response to the crisis. Ultimately, government policy
reactions along these dimensions had much to do with how well or poorly the
Welfare and Nordic Crisis Management Strategies
Page 34 of 85
economic wellbeing of the general population was shielded from the effects of
the crisis.
3.3 Fiscal Policy
The Great Recession lead to a deteriation of the budget deficit for almost all
advanced economies. While the shift was mild for most countries, several
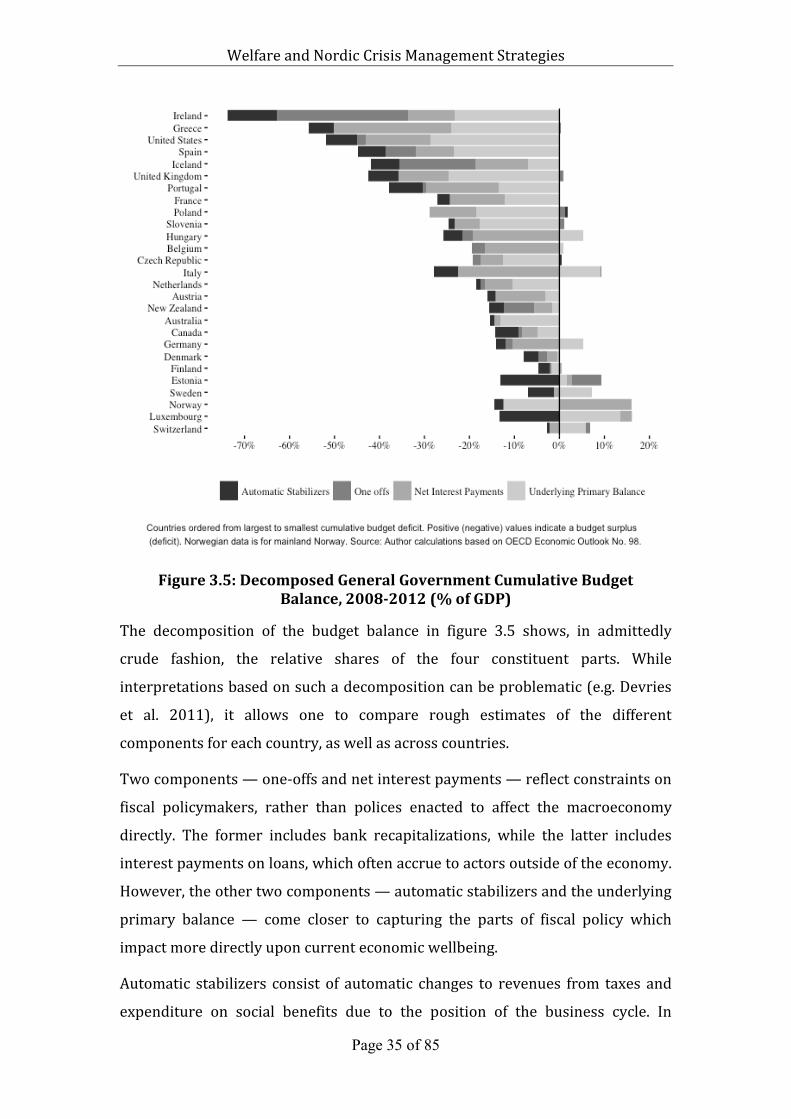
countries amassed significant amounts of new debt. Figure 3.5 shows the
cumulative budget balance for OECD countries over the first four years of the
crisis. The countries on the figure are ordered from the most negative to the
most positive cumulative budget balance and the balance itself is decomposed
into four main components, which are further discussed below.
Looking at the total cumulative budget balance reveals that the countries hit
hardest by the crisis generally accumulated the most debt in the years following
the onset of the crisis. Ireland amassed over 70% of GDP in new debt, with
Greece, the United States, Spain, the United Kingdom, Portugal, and Iceland also
accumulating significant debt. For the aforementioned countries in the EU (all
but Iceland), as well as 21 other EU countries, the deficits triggered the excessive
deficit procedure (EDP) of the EU’s Stability and Growth Pact, which stipulates
that yearly deficits should not exceed 3 percent of GDP unless they are
“exceptional and temporary” (European Commission 2016b). With the EDP
triggered, governments were expected to restore fiscal balance rapidly by
pursuing austere policies in the next two to three years (Cameron 2012, 102).
However, not all deficits are created equal in terms of their impact on the
economy and economic wellbeing. In particular, the cumulative budget balance
combines the results of discretionary policymaking following the crisis, the
workings of automatic stabilizers, net interest payments, and direct fiscal costs
due to the crisis. Thus, it does not allow one to easily gauge the overall fiscal
policy choices made by authorities, nor their incidence over the course of the
crisis.
Welfare and Nordic Crisis Management Strategies
Page 35 of 85
Figure3.5:DecomposedGeneralGovernmentCumulativeBudgetBalance,2008-2012(%ofGDP)
The decomposition of the budget balance in figure 3.5 shows, in admittedly
crude fashion, the relative shares of the four constituent parts. While
interpretations based on such a decomposition can be problematic (e.g. Devries
et al. 2011), it allows one to compare rough estimates of the different
components for each country, as well as across countries.
Two components — one-offs and net interest payments — reflect constraints on
fiscal policymakers, rather than polices enacted to affect the macroeconomy
directly. The former includes bank recapitalizations, while the latter includes
interest payments on loans, which often accrue to actors outside of the economy.
However, the other two components — automatic stabilizers and the underlying
primary balance — come closer to capturing the parts of fiscal policy which
impact more directly upon current economic wellbeing.
Automatic stabilizers consist of automatic changes to revenues from taxes and
expenditure on social benefits due to the position of the business cycle. In
Welfare and Nordic Crisis Management Strategies
Page 36 of 85
downturns, when economic activity contracts, automatic stabilizers will
automatically inject a fiscal stimulus into the economy, since less revenue will be
collected from taxes (e.g. due to lower income and less profit) and more will be
spent on social benefits (e.g. due to more unemployment). The size of automatic
stabilizers — i.e. the sensitivity of taxes and transfers to changes in GDP —
differs across countries and as such their effects will differ due to policy
differences, as well as due to differences in the size of the economic contraction.3
Finally, the underlying primary balance reflects the budget balance net of the
effects of the previous three components. It is often taken as an indicator of
discretionary policymaking by governments, i.e. the budgetary policy changes
actually made by policymakers.4 As such, a more negative underlying primary
balance from one year to another is associated with a fiscal stimulus, while a
more positive balance is associated with austerity measures.
The figure shows the cumulative size of these four components over the first four
years of the crisis, revealing several patterns of interest. One the ond hand, the
decomposition reveals the massive costs of one offs and net interest payments
for the deep crisis countries, especially Ireland, Greece, and Iceland. These reflect
the costs associated with bailing out and/or recapitalizing financial institutions,
as well as interest payments due to loans granted by the IMF and EU institutions.
Countries entering the crisis with high levels of public debt, such as Italy and
Belgium, similarly contribute a significant share of their budget towards interest
payments. Importantly, when analyzing the implications of policy responses for
economic wellbeing it is necessary to look beyond the costs of one offs and net
interest payments.
On the other hand, the decomposition reveals that almost all 27 countries
accumulated significant deficits due to the workings of automatic stabilizers
and/or discretionary fiscal policy over the period from 2008 and 2012. In this
3 Price et al. (2015) provides further information on the methodology used by the OECD in calculating the size of the automatic stabilizers.
4 See, for example, Raess and Pontusson (2015) and Armingeon (2012). For a critique of the measure, see Guajardo et al. (2014).
Welfare and Nordic Crisis Management Strategies
Page 37 of 85
regard, the liberal market economies (the US, the UK, and Ireland) stand out,
accumulating over 30% in new debt due to these two factors, with deep crisis
countries in Southern Europe (Greece, Spain, and Portugal) following suit with
over 20% accumulated. Interestingly, discretionary spending seems to have
played the most significant role in countries with weak automatic stabilizers,
such as the liberal market economies, which underlines how each of the two
components can partly substitute for the other.
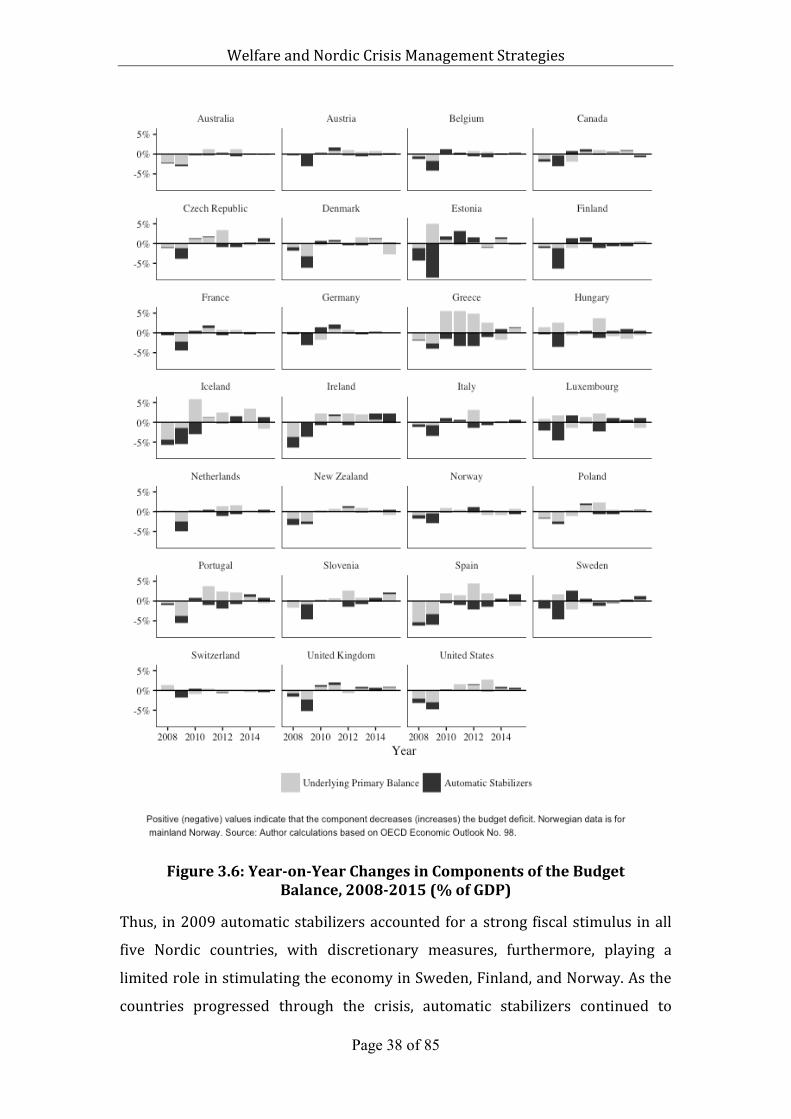
3.3.1 Automatic Stabilizers and Discretionary Fiscal Policy in the Crisis
While figure 3.5 highlights the cumulative build up of budget deficits, it does not
reveal the extent to which countries pursued a policy of fiscal stimulus or
austerity. Figure 3.6 takes up this task by showing year-on-year changes in
spending due to automatic stabilizers and discretionary fiscal policy, with
positive values indicating fiscal tightening and negative values indicating a fiscal
stimulus. Trends in these factors are showns for 27 OECD countries, although
most of the variance in the measures can be attributed to the countries hit
hardest by the crisis.
Several factors reveal themselves in the figure. For one thing, automatic
stabilizers played a crucial role in stimulating the economy at the onset of the
crisis. Since they respond automatically to downturns, they are more likely to
provide a timely response than any discretionary measures passed by
policymakers, since the latter have to go through all parts of the policymaking
process before being felt in the real economy (Baunsgaard and Symansky 2009).
Unsurpringly, automatic stabilizers provided the largest stimulus in countries
most affected by the crisis. However, they also provided a relatively large buffer
in the Nordic countries most affected by the crisis. This is so, since the size of the
stabilizers are determined by both the size of the economic contraction, as well
as the overall sensitivity of the budget balance to the business cycle, with tax and
transfer policies in the Nordic countries structured to respond strongly to drops
in GDP (Price et al. 2015).
Welfare and Nordic Crisis Management Strategies
Page 38 of 85
Figure3.6:Year-on-YearChangesinComponentsoftheBudgetBalance,2008-2015(%ofGDP)
Thus, in 2009 automatic stabilizers accounted for a strong fiscal stimulus in all
five Nordic countries, with discretionary measures, furthermore, playing a
limited role in stimulating the economy in Sweden, Finland, and Norway. As the
countries progressed through the crisis, automatic stabilizers continued to
Welfare and Nordic Crisis Management Strategies
Page 39 of 85
dominate the policy response in these three countries, while discretionary policy
played a larger role in Iceland and Denmark. As countries recovered from the
crisis, the effects of the automatic stabilizers diminished, although they
continued to have a sizable impact in the countries most affected by the
Eurozone crisis; Greece, Portugal, and Spain.
More importantly, policymakers in most countries responded initially by
enacting discretionary measures designed to support the automatic stabilizers in
stimulating the economy (Armingeon 2012; see also Cameron 2012). Such
forceful Keynesian policies were strongly supported by mainstream economists
and international institutions at the time to stave off a global recession (e.g.
Spilimbergo et al. 2008). However, from 2010 onward there was a decisive shift
toward balancing the budget. Thus, governments of the countries most affected
by the crisis all implemented strong austerity measures and, by doing so,
decreased the underlying primary deficit. The reversal in Greece is especially
prominent, with the government implementing a multi-year package, greatly
reducing the underlying primary balance deficit.
Overall, government fiscal policy responses was quite varied across countries
and through the different stages of the recession. Automatic stabilizers played a
particularly important stimulating role during the earlier stages of the Great
Recession, especially in deep crisis countries and the Nordic countries. Such
automatic policies buffered the effects of the crisis on household income. As time
passed and the global financial crisis abated, discretionary fiscal policy measures
began to play a larger role. In all deep crisis countries, governments pursued a
variety of austerity measures, which were designed to rapidly reduce the budget
deficit, exactly at a time when further stimulus spending would have provided a
larger buffer to the economic wellbeing of households still greatly affected by the
crisis. Greek authorities implemented the most severe austerity measures,
although Iceland, Ireland, Portugal, and Spain each reduced the budget deficit
significantly in the years after 2009. During that time, Greece, Iceland, Ireland,
and Portugal, were each participants in IMF programs.
Welfare and Nordic Crisis Management Strategies
Page 40 of 85
3.4 Social Protection
A great deal has been written about the effects of austerity on economic growth,
with the emerging view suggesting that episodes of fiscal consolidation reduce
aggregate output (Guajardo et al. 2014). Furthermore, these negative effects
seem to be especially dire when they are tax-based, rather than expenditure-
based (Alesina et al. 2015). That is to say, fiscal consolidation plans driven by tax
increases seem to be more damaging to economic growth than those driven by
expenditure cuts.
3.4.1 The Consequences of the Composition of Austerity Measures
When analyzing the effects of austerity on wellbeing, however, the reverse
association seems to hold true. Thus, both Ball et al. (2013) and Agnello and
Sousa (2014) find that tax-based fiscal consolidation episodes reduce income
inequality, but that expenditure-based episodes are associated with sharp
increases in inequality. This is perhaps unsurprising, since expenditure-based
austerity measures are generally focused on reducing benefit generosity and the
government wage bill, which hit lower and middle income groups the hardest,
while tax-based measures are more likely to fall on the better off. The
composition of austerity measures, thus, matters a great deal to the effects of
austerity on economic wellbeing.
Figure 3.7 decomposes the cumulative underlying primary balance for the period
2009 to 2013 (the main years of fiscal consolidation) into its revenue and
expenditure parts, thus allowing for the comparison of the relative sizes of tax-
based and expenditure-based austerity measures. Positive values on the
measures indicate fiscal tightening, i.e. that higher revenues are collected or that
expenditures are lower in 2013 compared to 2009, while negative values
indicate fiscal stimulus, i.e. that lower revenues are collected or that spending
has increased.
Again the figure demonstrates the severity of the crisis and policy response in
Greece, with the authorities implementing both large revenue increases as well
as expenditure cuts. Trailing Greece by some margin come the other four
countries most affected by the crisis, Spain, Iceland, Portugal, and Ireland.
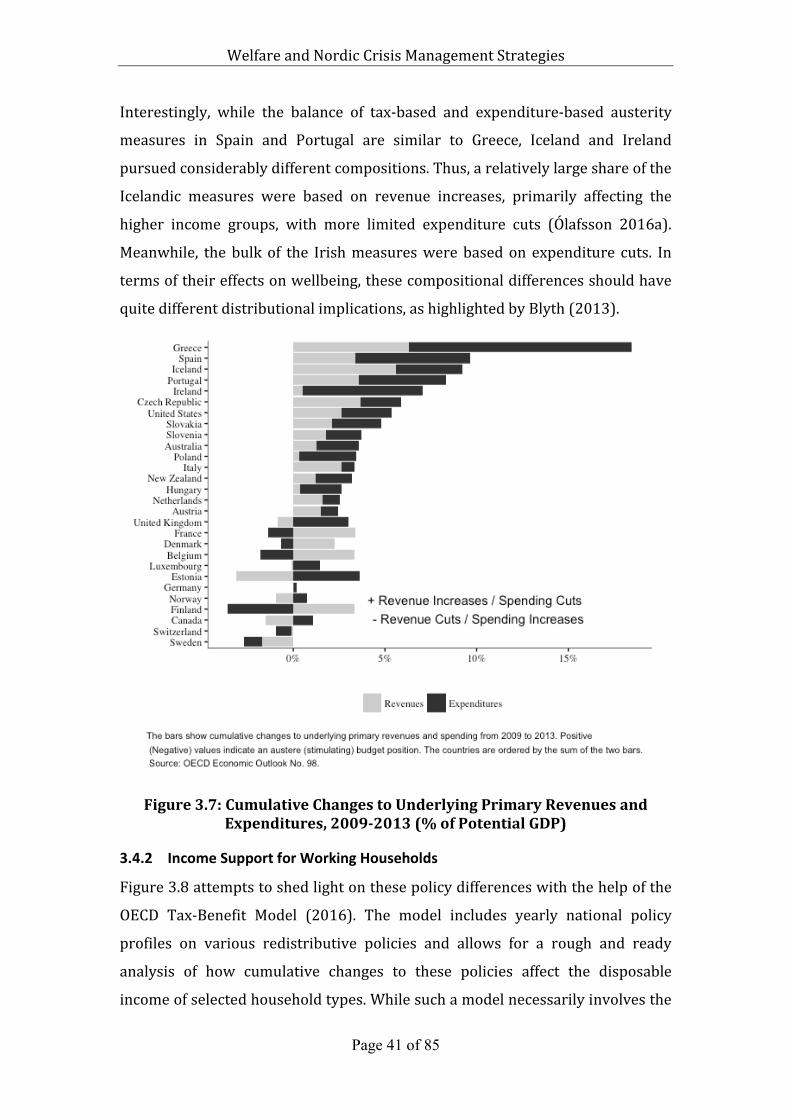
Welfare and Nordic Crisis Management Strategies
Page 41 of 85
Interestingly, while the balance of tax-based and expenditure-based austerity
measures in Spain and Portugal are similar to Greece, Iceland and Ireland
pursued considerably different compositions. Thus, a relatively large share of the
Icelandic measures were based on revenue increases, primarily affecting the
higher income groups, with more limited expenditure cuts (Ólafsson 2016a).
Meanwhile, the bulk of the Irish measures were based on expenditure cuts. In
terms of their effects on wellbeing, these compositional differences should have
quite different distributional implications, as highlighted by Blyth (2013).
Figure3.7:CumulativeChangestoUnderlyingPrimaryRevenuesandExpenditures,2009-2013(%ofPotentialGDP)
3.4.2 Income Support for Working Households
Figure 3.8 attempts to shed light on these policy differences with the help of the
OECD Tax-Benefit Model (2016). The model includes yearly national policy
profiles on various redistributive policies and allows for a rough and ready
analysis of how cumulative changes to these policies affect the disposable
income of selected household types. While such a model necessarily involves the
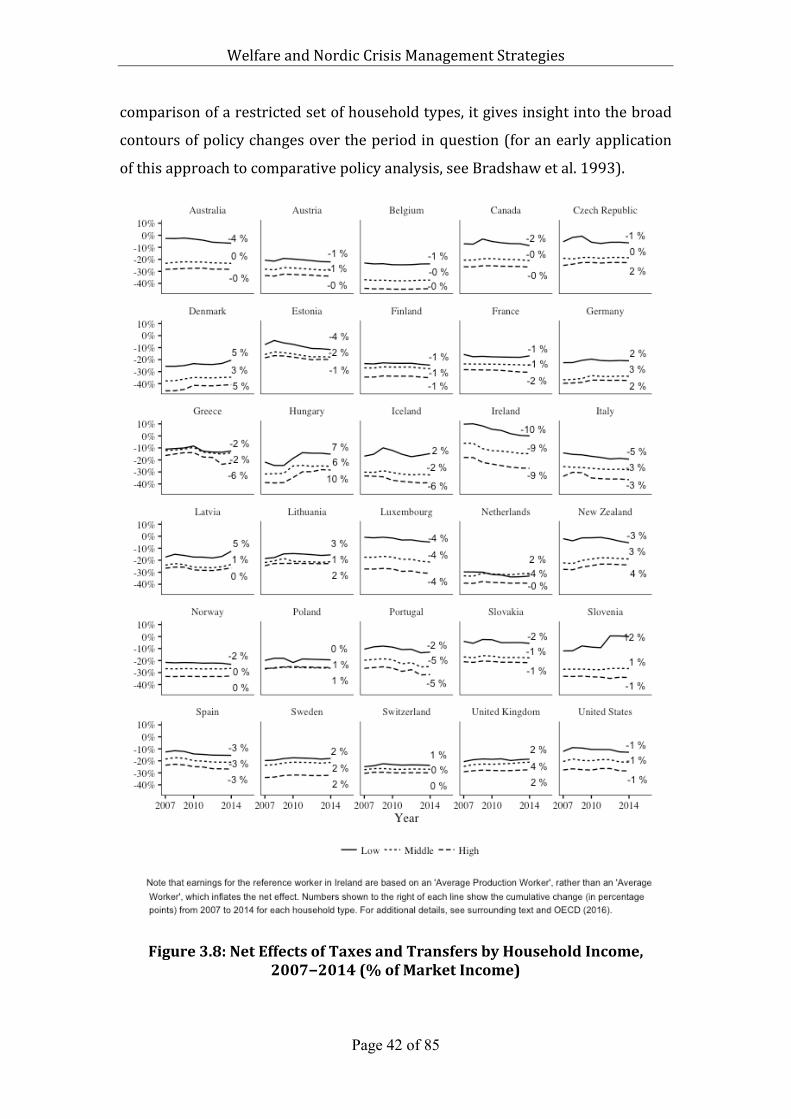
Welfare and Nordic Crisis Management Strategies
Page 42 of 85
comparison of a restricted set of household types, it gives insight into the broad
contours of policy changes over the period in question (for an early application
of this approach to comparative policy analysis, see Bradshaw et al. 1993).
Figure3.8:NetEffectsofTaxesandTransfersbyHouseholdIncome,2007−2014(%ofMarketIncome)
Welfare and Nordic Crisis Management Strategies
Page 43 of 85
Developments in the net effects of taxes and transfers on household income are
shown in the figure. Transfers consist of family benefits, housing benefits, in-
work benefits, and social assistance, while taxes consist of income taxes and
employee social security contributions. The examples in the figure are based on a
model of two earner families with two children at three levels of market income:
i) Low: 100% of Average Worker (AW) market income and nonworking spouse,
ii) Middle: couple each with 100% AW income, and iii) High: 200% of AW income
and spouse with 100% of AW income. Since the only factor varying among the
three model families is market income, it allows for a direct comparison of
changes in the distributional effects of redistributive policies. Finally, by
standardizing income with current average worker income, the comparison is
focused squarely on how policies change over the time period and affect
identical households differently.5
Overall, the figure reveals considerable stability in the overall effect of the main
redistributive policies on households not directly affected by the crisis (e.g. due
to unemployment). Thus, the global financial crisis did not usher in a period of
great retrenchment or expansion of income support for working families.
Similarly, in most cases the developments for the three household types within
each country are parallel, suggesting that tax-benefit systems generally did not
become more or less progressive over the course of the crisis.
There are, however, a couple of notable exceptions. Ireland stands out as a case
of considerable change, with the net effect of taxes and transfers for all
household types declining by 9-10 percentage points from 2007 to 2014. Thus,
for example, while the net effect for families with low income was about +10% of
their market income in 2007, it was down to 0% in 2014 (i.e. they paid as much
in taxes then as they received in benefits). This is in line with the data shown in
figure 3.7, which suggests that the austerity measures enacted by Irish
authorities were mostly expenditure based.
5 For additional details, see OECD (2016)
Welfare and Nordic Crisis Management Strategies
Page 44 of 85
Similarly, developments in Iceland stand out, although for different reasons. As
the figure highlights, developments of redistributive policies differed
considerably based on household income, with tax-benefit policies becoming
slightly more generous for low income households, but considerably smaller for
high income households. The data, thus, underline how the “strategy of
redistribution” shifted the burden of adjustment from low to high income
households in the Icelandic case (Ólafsson 2016a).
In addition to Iceland, Slovenia stands out as exceptional with regard to
increasing the redistributive effects of taxes and benefits during the crisis.
Besides Ireland, other notable regressive cases include Estonia, Greece, Italy,
Portugal, and Spain. For most countries, however, the overall effects of taxes and
transfers on household income for working families remained roughly constant
over the crisis period.
3.4.3 Income Support for the Unemployed
A similar story of stability can be told about unemployment benefits, which are
the primary tool for income replacement for those directly affected by the crisis
through the loss of employment.6 Figure 3.9 shows the initial net unemployment
replacement rate (NURR) in 2007 as a share of previous earnings for a two
earner family (one spouse unemployed) with two children, each earning 100%
of average worker (AW) market income prior to the unemployment spell. The
figure also shows the change in the rate (in percentage points) from 2007 to
2014.7
For most countries, the rate was next to constant over the time period. Lithuania,
though, stands out as a case of significant retrenchment, with a 16 point drop in
the rate, from 85% in 2007 to 69% in 2014. The rate also dropped significantly
6 It should be noted that initial replacement rates for particular household types are only one of many relevant dimensions of unemployment benefit generosity. Other important dimensions include benefit duration, as well as the extent to which benefits are earnings-related (Esser et al. 2013). Furthermore, for those not eligable for unemployment benefits, developments of minimum income protections are more important. These dimensions are not further examined here. (see Marchal et al. 2016 for minimum income protection in the crisis.)
7 Supplements are included. For additional details, see OECD (2016).
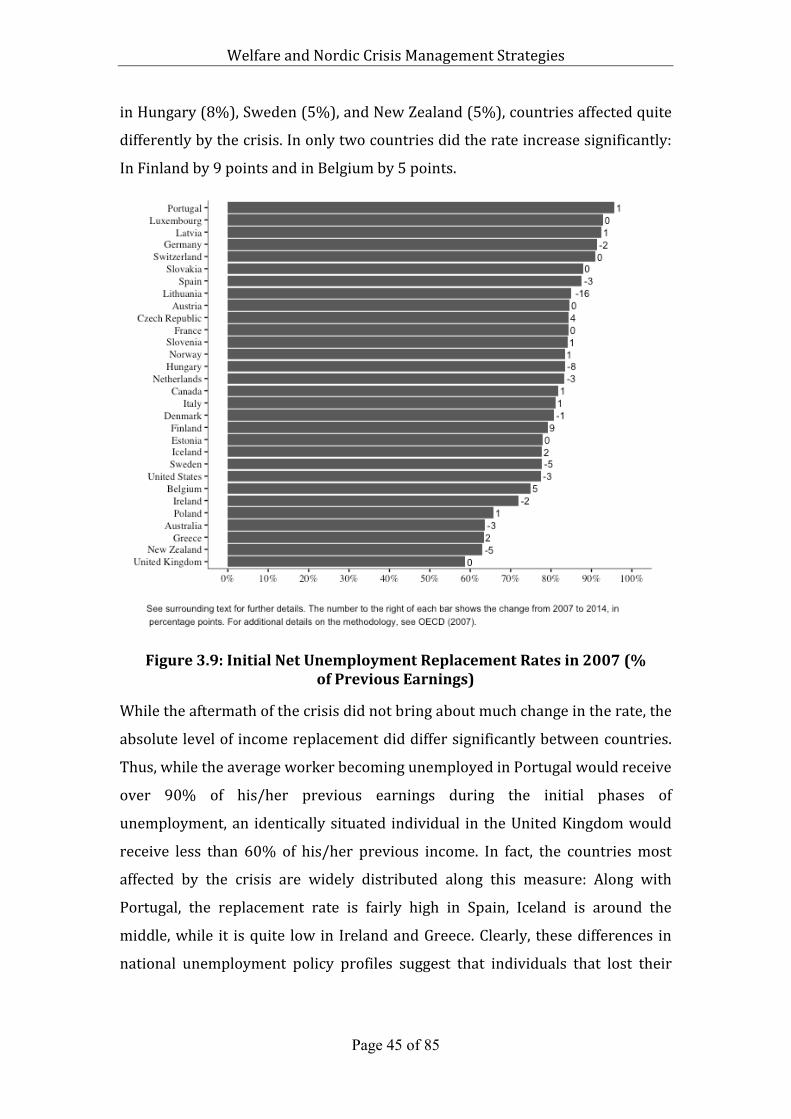
Welfare and Nordic Crisis Management Strategies
Page 45 of 85
in Hungary (8%), Sweden (5%), and New Zealand (5%), countries affected quite
differently by the crisis. In only two countries did the rate increase significantly:
In Finland by 9 points and in Belgium by 5 points.
Figure3.9:InitialNetUnemploymentReplacementRatesin2007(%ofPreviousEarnings)
While the aftermath of the crisis did not bring about much change in the rate, the
absolute level of income replacement did differ significantly between countries.
Thus, while the average worker becoming unemployed in Portugal would receive
over 90% of his/her previous earnings during the initial phases of
unemployment, an identically situated individual in the United Kingdom would
receive less than 60% of his/her previous income. In fact, the countries most
affected by the crisis are widely distributed along this measure: Along with
Portugal, the replacement rate is fairly high in Spain, Iceland is around the
middle, while it is quite low in Ireland and Greece. Clearly, these differences in
national unemployment policy profiles suggest that individuals that lost their
Welfare and Nordic Crisis Management Strategies
Page 46 of 85
employment during the Great Recession and thereafter fared quite differently,
based on their country of residence.
Overall, social policy developments from 2008 onward have, thus, been more
characterized by continuity than change. While specific elements of tax and
benefit systems may have changed, the relative importance of taxes and
transfers have remained constant throughout the crisis and post-crisis period for
different income groups in most countries. This further highlights the
importance of the policy setting at the onset of the crisis. However, there are
notable exceptions to this trend, which can be seen as more representative of
fundamental changes. In that regard, Ireland stands out as a particularly
regressive case, with the net effects of taxes and transfers being reduced for low,
middle, and high income groups alike. At the other end of the spectrum, Iceland
stands as a progressive case, with taxes and benefits becoming more generous
for low income households, while becoming less generous for high income
households. These differences in social policy developments are likely to have
divergent consequences for the economic wellbeing of households in the two
countries.
3.5 Discussion
The Global Financial Crisis culminated in the winter of 2008-09 as financial
institutions around the world teetered on the brink of collapse. The crisis
spawned the Great Recession, which involved the largest economic contraction
in advanced economies in the post-war era. While the effects of the crisis were
particularly devastating in Greece, multiple countries experienced severe
domestic recessions in the years following the peak of the crisis. This was
especially so for countries that entered the crisis in a precarious fiscal position,
as they were highly vulnerable to the sudden stop in cross-boarder lending that
developed amid fears of banking and sovereign defaults. The countries most
affected, including Latvia, Ireland, Iceland, and Portugal, were forced to seek out
the assistance of international lenders of last resort to stave off an economic
collapse. Although the effects of the Great Recession were most pronounced in
Welfare and Nordic Crisis Management Strategies
Page 47 of 85
these deep crisis countries, almost all OECD countries experienced a
recessionary period in the aftermath of the crisis.
The crisis led to a deterioration in the budget balance of most countries in the
first years after the crisis. While the restoration of financial institutions and
interest payments due to debt obligations were particularly costly for the deep
crisis countries, all governments provided some form of fiscal stimulus in the
initial stages of the Great Recession. Automatic stabilizers played a particularly
large role in buffering the initial effects of the crisis on aggregate demand, while
discretionary stimulus measures were also employed to support their workings
at the height of the crisis. However, from 2010 onward harsh austerity measures
were generally introduced, most markedly in deep crisis countries.
Even so, not all austerity measures were designed in a similar fashion.
Governments in several countries, including Greece, Spain, Ireland, and the
United Kingdom, focused on spending cuts, which were likely to have dire
consequences for individuals and households most in need of social support
after the crisis. Meanwhile Iceland stands out as a deep crisis country that went
the opposite route, prioritizing revenue increases over spending cuts in their
fiscal consolidation plans. Although not hit as hard by the crisis, a similar pattern
can be seen in the other Nordic countries.
Although these policy differences are likely to be consequential for economic
wellbeing, the overall story for tax and benefit policies in the crisis is one of
continuity rather than change. This suggests that the policy setting at the onset
of the crisis was substantially more important for the wellbeing of those affected
by the crisis than any discretionary policy changes made during the crisis years.
On balance, countries with more generous welfare states at the onset of the crisis
were, thus, better positioned to shield the wellbeing of the general population.
Welfare and Nordic Crisis Management Strategies
Page 48 of 85
4 Wellbeing Consequences of the Crisis
Following the overview of macro policies of governments in response to the
crisis we focus in this chapter on the micro level of households. The aim is to give
an overview of wellbeing consequences of the crisis for the general public in our
countries – how the crisis affected the level of living.
It is of course well known, often seen as almost self-evident, that crises reduce
the level of living of the general population. Crises are typically seen as bad for
everybody. We have seen how almost all Western nations experienced a
contraction of their gross national product following the onset of the crisis. The
extent of contractions was however very variable.
Some European countries were only very lightly touched by the crisis. For them
the crisis perhaps primarily reflected reduced opportunities for further growth –
a small temporary setback. For those that went deep into the crisis it was a
completely different affair. Hence we will in much of our presentation of
wellbeing indicators look to start with at the situation either for the whole group
of about 30 European countries, or work with groups of countries, including
deep-crisis countries and others that did not go as deep into crisis.
We mainly profile unemployment developments, relative poverty (anchored in
2005) and financial hardship experienced (“great difficulty in making ends
meet”). We also look at developments of disposable incomes and inequality.
These are all important indicators of levels of living or wellbeing of the
populations. We are particularly interested in how the burdens of the crisis were
shared amongst different income or socio-economic groups.
4.1 Unemployment Experiences
First we look at unemployment developments, shown in figure 4.1. In the years
leading up to the crisis there was a mild trend towards lower unemployment
levels (from 7.1% to 6.2% for all the 32 Western countries). From 2007 to 2010
there was then a swift increase, from 6.2% to 9.7% in 2010 for the whole group.
Most of the increase came in late 2008 and in 2009. The 11 deep-crisis countries
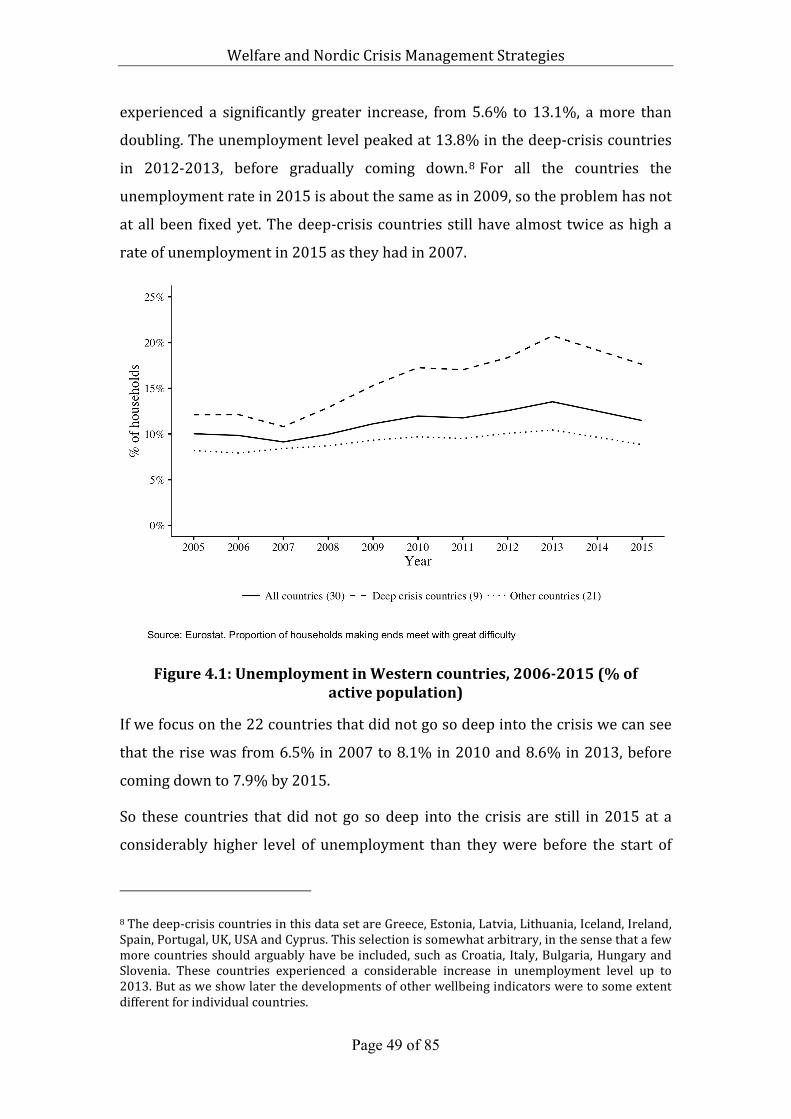
Welfare and Nordic Crisis Management Strategies
Page 49 of 85
experienced a significantly greater increase, from 5.6% to 13.1%, a more than
doubling. The unemployment level peaked at 13.8% in the deep-crisis countries
in 2012-2013, before gradually coming down.8 For all the countries the
unemployment rate in 2015 is about the same as in 2009, so the problem has not
at all been fixed yet. The deep-crisis countries still have almost twice as high a
rate of unemployment in 2015 as they had in 2007.
Figure4.1:UnemploymentinWesterncountries,2006-2015(%ofactivepopulation)
If we focus on the 22 countries that did not go so deep into the crisis we can see
that the rise was from 6.5% in 2007 to 8.1% in 2010 and 8.6% in 2013, before
coming down to 7.9% by 2015.
So these countries that did not go so deep into the crisis are still in 2015 at a
considerably higher level of unemployment than they were before the start of
8 The deep-crisis countries in this data set are Greece, Estonia, Latvia, Lithuania, Iceland, Ireland, Spain, Portugal, UK, USA and Cyprus. This selection is somewhat arbitrary, in the sense that a few more countries should arguably have be included, such as Croatia, Italy, Bulgaria, Hungary and Slovenia. These countries experienced a considerable increase in unemployment level up to 2013. But as we show later the developments of other wellbeing indicators were to some extent different for individual countries.
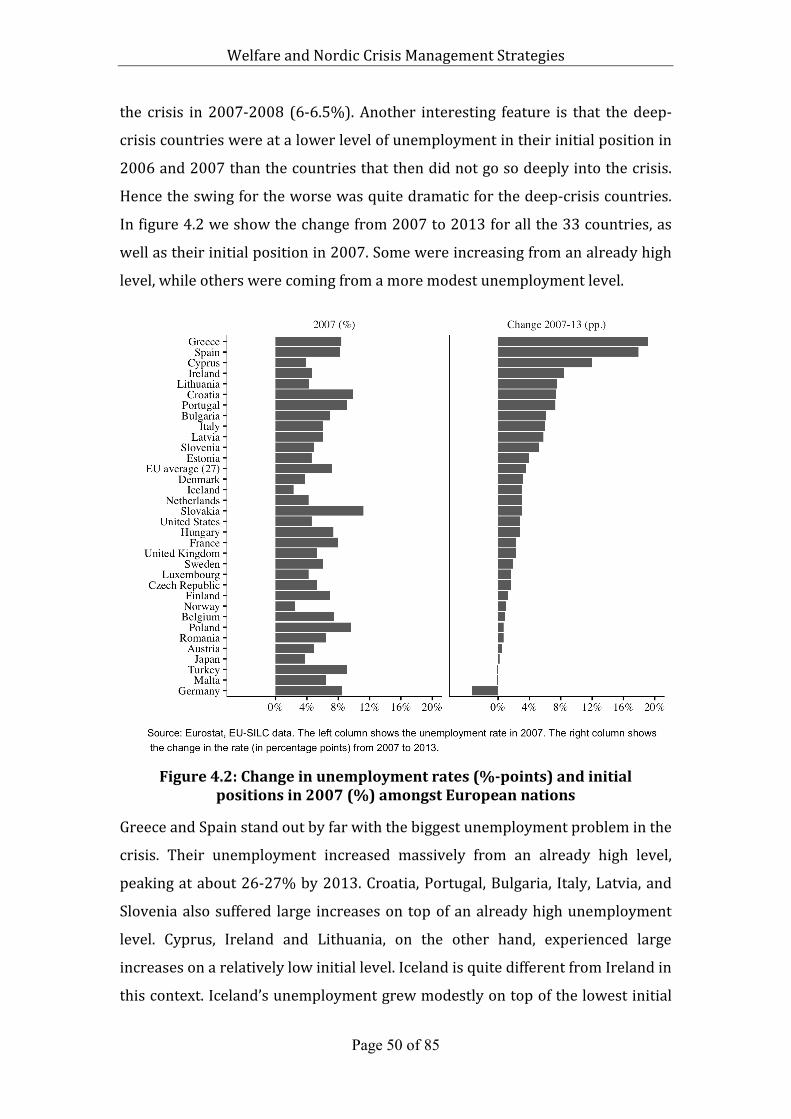
Welfare and Nordic Crisis Management Strategies
Page 50 of 85
the crisis in 2007-2008 (6-6.5%). Another interesting feature is that the deep-
crisis countries were at a lower level of unemployment in their initial position in
2006 and 2007 than the countries that then did not go so deeply into the crisis.
Hence the swing for the worse was quite dramatic for the deep-crisis countries.
In figure 4.2 we show the change from 2007 to 2013 for all the 33 countries, as
well as their initial position in 2007. Some were increasing from an already high
level, while others were coming from a more modest unemployment level.
Figure4.2:Changeinunemploymentrates(%-points)andinitial
positionsin2007(%)amongstEuropeannations
Greece and Spain stand out by far with the biggest unemployment problem in the
crisis. Their unemployment increased massively from an already high level,
peaking at about 26-27% by 2013. Croatia, Portugal, Bulgaria, Italy, Latvia, and
Slovenia also suffered large increases on top of an already high unemployment
level. Cyprus, Ireland and Lithuania, on the other hand, experienced large
increases on a relatively low initial level. Iceland is quite different from Ireland in
this context. Iceland’s unemployment grew modestly on top of the lowest initial
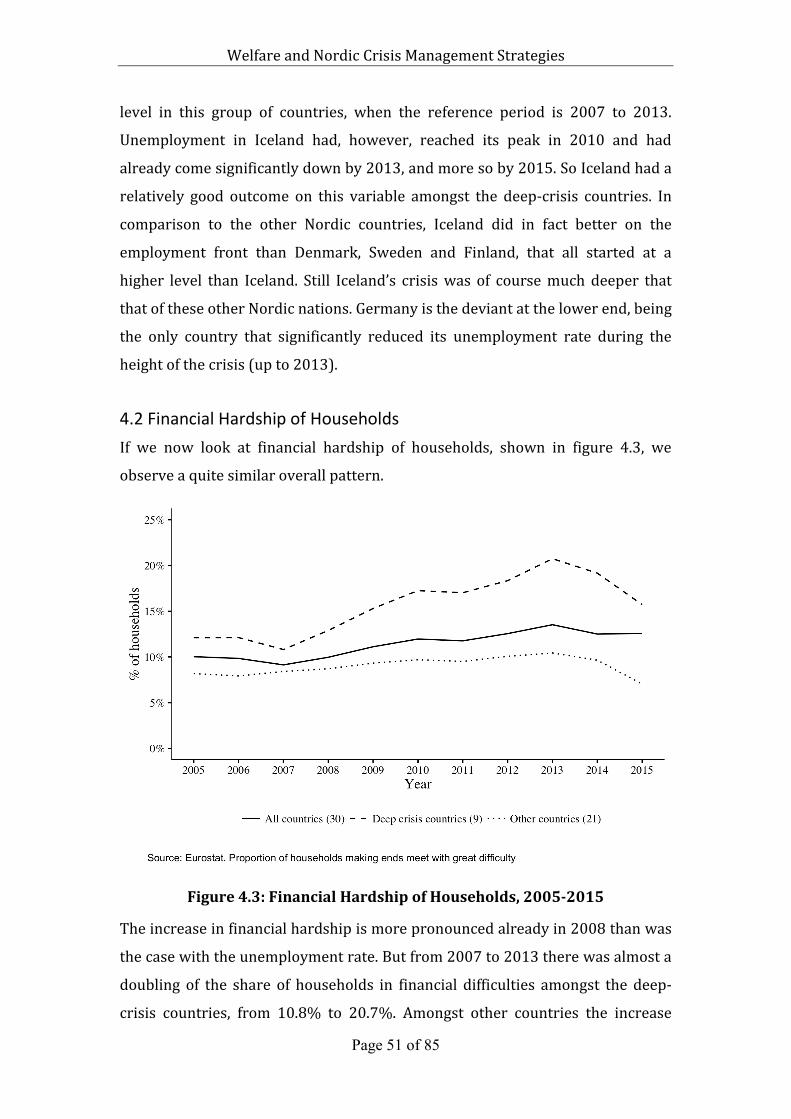
Welfare and Nordic Crisis Management Strategies
Page 51 of 85
level in this group of countries, when the reference period is 2007 to 2013.
Unemployment in Iceland had, however, reached its peak in 2010 and had
already come significantly down by 2013, and more so by 2015. So Iceland had a
relatively good outcome on this variable amongst the deep-crisis countries. In
comparison to the other Nordic countries, Iceland did in fact better on the
employment front than Denmark, Sweden and Finland, that all started at a
higher level than Iceland. Still Iceland’s crisis was of course much deeper that
that of these other Nordic nations. Germany is the deviant at the lower end, being
the only country that significantly reduced its unemployment rate during the
height of the crisis (up to 2013).
4.2 Financial Hardship of Households
If we now look at financial hardship of households, shown in figure 4.3, we
observe a quite similar overall pattern.
Figure4.3:FinancialHardshipofHouseholds,2005-2015
The increase in financial hardship is more pronounced already in 2008 than was
the case with the unemployment rate. But from 2007 to 2013 there was almost a
doubling of the share of households in financial difficulties amongst the deep-
crisis countries, from 10.8% to 20.7%. Amongst other countries the increase
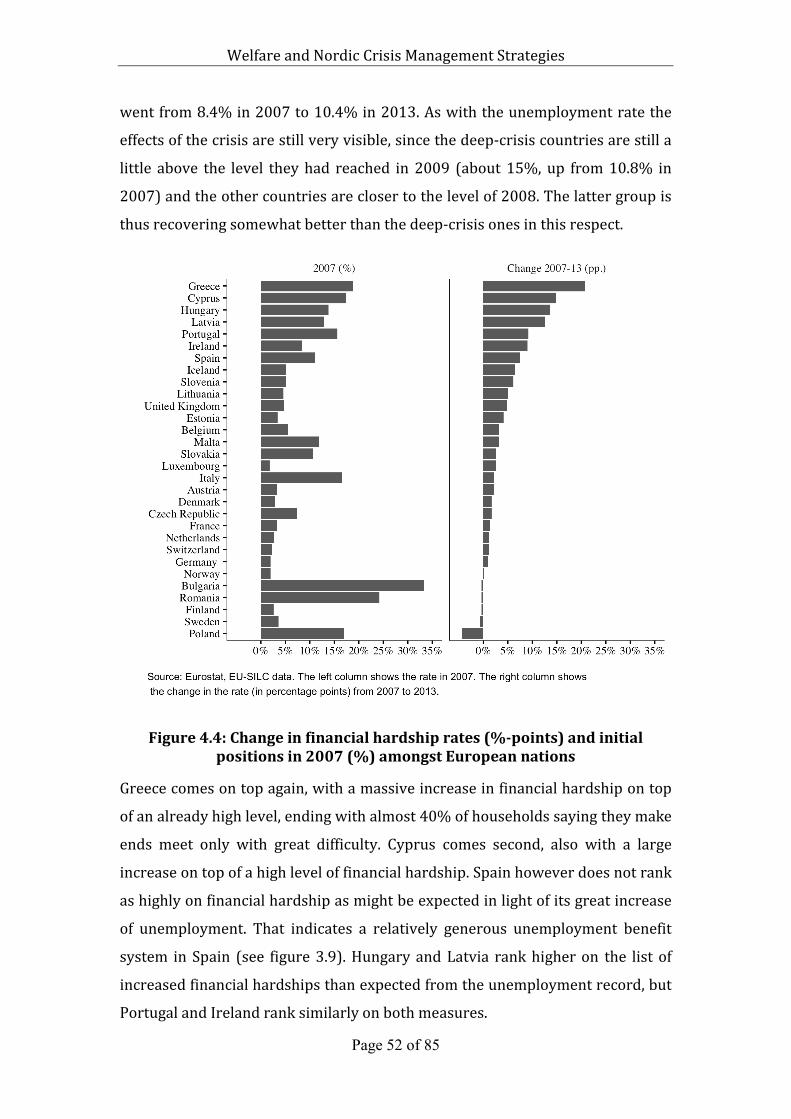
Welfare and Nordic Crisis Management Strategies
Page 52 of 85
went from 8.4% in 2007 to 10.4% in 2013. As with the unemployment rate the
effects of the crisis are still very visible, since the deep-crisis countries are still a
little above the level they had reached in 2009 (about 15%, up from 10.8% in
2007) and the other countries are closer to the level of 2008. The latter group is
thus recovering somewhat better than the deep-crisis ones in this respect.
Figure4.4:Changeinfinancialhardshiprates(%-points)andinitialpositionsin2007(%)amongstEuropeannations
Greece comes on top again, with a massive increase in financial hardship on top
of an already high level, ending with almost 40% of households saying they make
ends meet only with great difficulty. Cyprus comes second, also with a large
increase on top of a high level of financial hardship. Spain however does not rank
as highly on financial hardship as might be expected in light of its great increase
of unemployment. That indicates a relatively generous unemployment benefit
system in Spain (see figure 3.9). Hungary and Latvia rank higher on the list of
increased financial hardships than expected from the unemployment record, but
Portugal and Ireland rank similarly on both measures.
Welfare and Nordic Crisis Management Strategies
Page 53 of 85
Iceland however ranks somewhat higher on financial hardship, which most likely
has more to do with its large decline of disposable earnings, due to the large
devaluation of its currency at the beginning of the crisis. The same applies to the
UK. Finland, Sweden and Norway did not experience any real increase in
financial hardships of households and Denmark had only a modest rise. Italy,
Malta and Slovakia had modest increases of financial hardships, but they came
on top of an already high level.
Romania and Bulgaria had the highest rates of financial hardship in 2007, but
they decreased their rate slightly and Poland that also had a high rate in 2007
improved its position by some 4 %-points. Sweden and Finland similarly
improved their position on that front a little, albeit from a very low level, as
already indicated.
While there are a few deviations in the outcomes from these two measures of
wellbeing we have covered so far, the general pattern is similar. The deep-crisis
countries all experienced greatly increased unemployment problems and many
of them also experienced large increases in felt financial difficulties amongst
households in general.
4.3 Poverty Developments
Now we turn to measures of relative poverty development through the crisis. We
use two poverty measures, with 60% of median equivalised household income as
the poverty line in both cases: yearly relative poverty rates on the one hand and
then poverty rates anchored in 2005 (with the poverty line from 2005 fixed
through the period). This produces somewhat different results, with different
interpretations. The former rate, the yearly relative poverty rate, indicates the
size of the low-income group in relation to the yearly median income. A time
series of that measure indicates then how the income of the low-income group
developed in relation to the median. Did the lowest do better or worse than the
median? If they did worse, we can say that the burden was disproportionally
landed on their shoulder. The median households did better in those cases. The
anchored measure shows how the lowest and the median did fare in relation to
the standard they enjoyed in 2005 (the reference/anchor year). Figure 4.5 shows
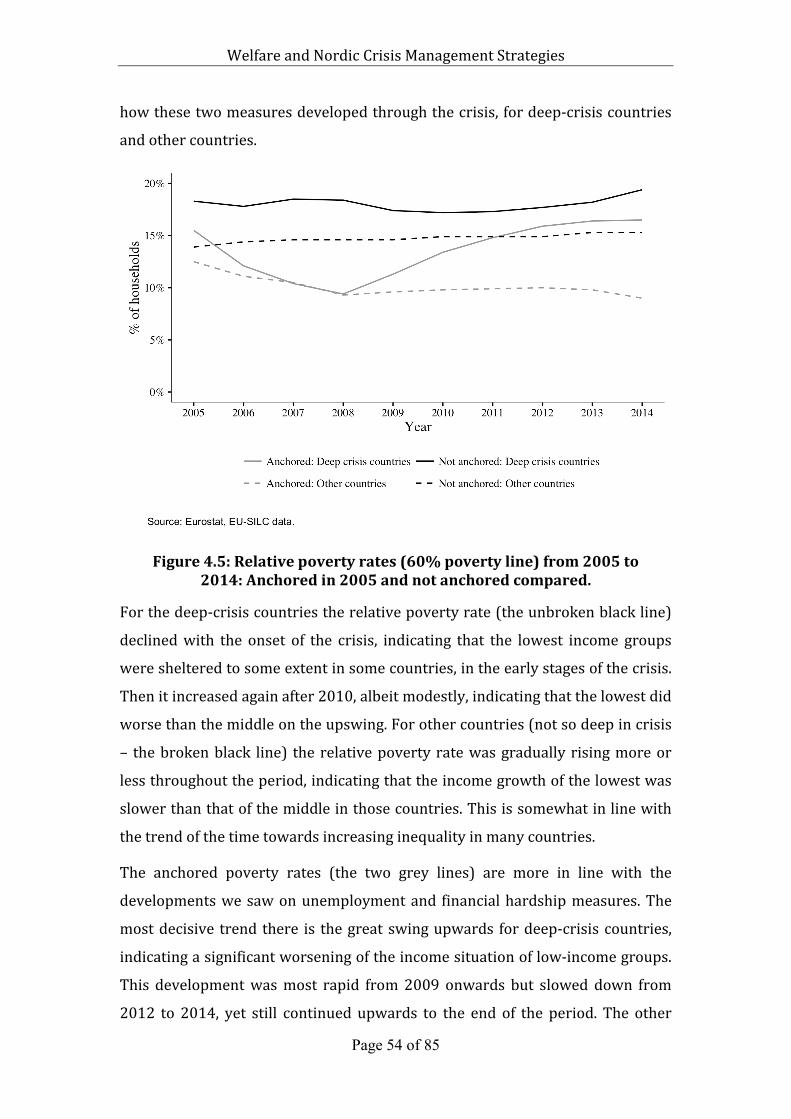
Welfare and Nordic Crisis Management Strategies
Page 54 of 85
how these two measures developed through the crisis, for deep-crisis countries
and other countries.
Figure4.5:Relativepovertyrates(60%povertyline)from2005to2014:Anchoredin2005andnotanchoredcompared.
For the deep-crisis countries the relative poverty rate (the unbroken black line)
declined with the onset of the crisis, indicating that the lowest income groups
were sheltered to some extent in some countries, in the early stages of the crisis.
Then it increased again after 2010, albeit modestly, indicating that the lowest did
worse than the middle on the upswing. For other countries (not so deep in crisis
– the broken black line) the relative poverty rate was gradually rising more or
less throughout the period, indicating that the income growth of the lowest was
slower than that of the middle in those countries. This is somewhat in line with
the trend of the time towards increasing inequality in many countries.
The anchored poverty rates (the two grey lines) are more in line with the
developments we saw on unemployment and financial hardship measures. The
most decisive trend there is the great swing upwards for deep-crisis countries,
indicating a significant worsening of the income situation of low-income groups.
This development was most rapid from 2009 onwards but slowed down from
2012 to 2014, yet still continued upwards to the end of the period. The other
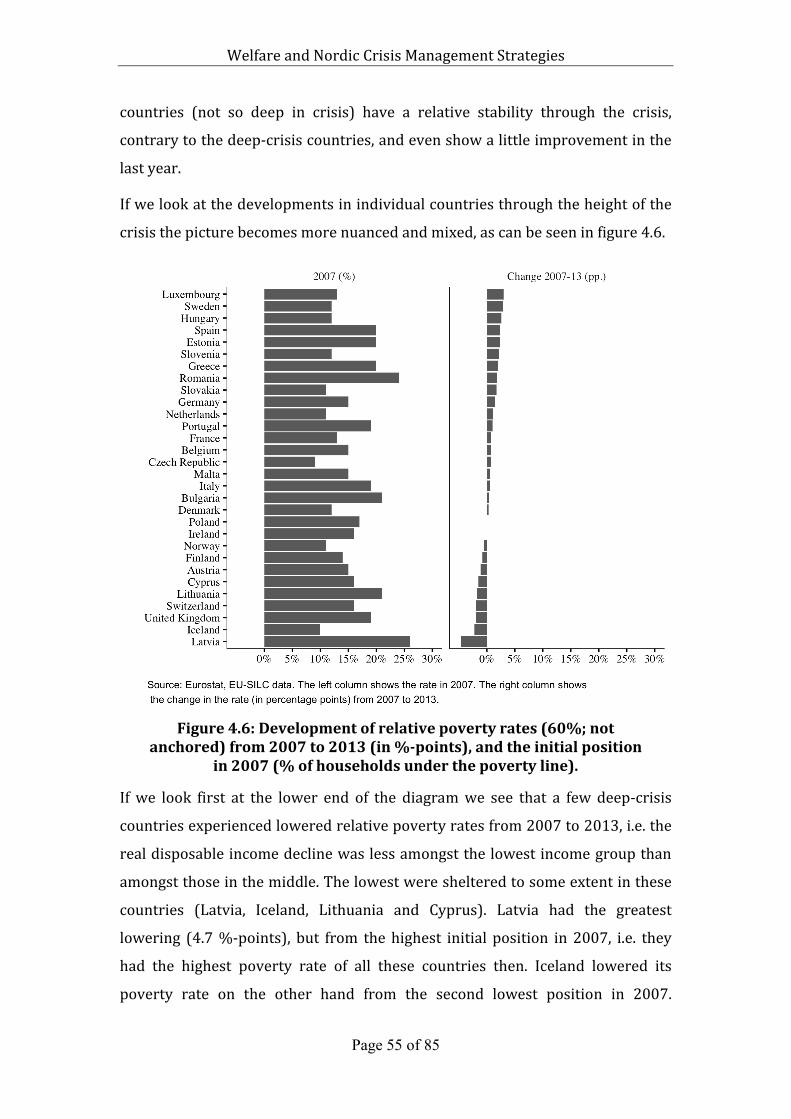
Welfare and Nordic Crisis Management Strategies
Page 55 of 85
countries (not so deep in crisis) have a relative stability through the crisis,
contrary to the deep-crisis countries, and even show a little improvement in the
last year.
If we look at the developments in individual countries through the height of the
crisis the picture becomes more nuanced and mixed, as can be seen in figure 4.6.
Figure4.6:Developmentofrelativepovertyrates(60%;not
anchored)from2007to2013(in%-points),andtheinitialpositionin2007(%ofhouseholdsunderthepovertyline).
If we look first at the lower end of the diagram we see that a few deep-crisis
countries experienced lowered relative poverty rates from 2007 to 2013, i.e. the
real disposable income decline was less amongst the lowest income group than
amongst those in the middle. The lowest were sheltered to some extent in these
countries (Latvia, Iceland, Lithuania and Cyprus). Latvia had the greatest
lowering (4.7 %-points), but from the highest initial position in 2007, i.e. they
had the highest poverty rate of all these countries then. Iceland lowered its
poverty rate on the other hand from the second lowest position in 2007.
Welfare and Nordic Crisis Management Strategies
Page 56 of 85
Lithuania and Cyprus both had rather high poverty rates to start with in 2007.
Ireland had an above average poverty rate in 2007 but did not change that either
way during this part of the crisis period.
At the upper end of the diagram we see some other deep-crisis countries that
increased their relative poverty rates during the height of the crisis (Spain,
Greece, Estonia, Portugal – all with quite high poverty rates to begin with in
2007). Some other countries increased poverty levels during this period, like
Hungary and Romania (both from a high starting point in 2007), and Slovenia
and Slovakia, who both had relatively low starting points in 2007. At the top we
lastly have the two affluent countries that were only very modestly affected by
the crisis, yet increased their relative poverty rates the most of all the countries
in the sample (low-income households fared worse than the middle income
groups in those countries).
So the outcome is mixed: some deep-crisis countries sheltered the lowest income
group but others did not – and some affluent countries that were modestly
affected by the crisis left the lower income groups behind.
Before looking closer at real disposable income developments we provide an
overview of average level of living developments from 2007 to 2013 for about 30
European countries in figure 4.7.
The overall rise in unemployment is of a similar proportion as the rise of
financial hardships for households (“making ends meet with great difficulty”),
but the rise in anchored poverty rates is of a somewhat smaller order. The
percentage-point change is in fact only about a half for the poverty rate.
If we look more directly at real disposable income development between 2007
and 2013 (the right hand side of the diagram) an interesting overall pattern
emerges. The real incomes of the lowest income group contracted the most (-
4.1%), the median came second (-1.7%), but the ninetieth percentile declined the
least (-0.9%).
This should be indicative of increased relative poverty levels in the whole group
of 30 European countries. That was indeed what figure 4.6 showed. In 19
countries relative poverty levels increased in this period, in two countries there
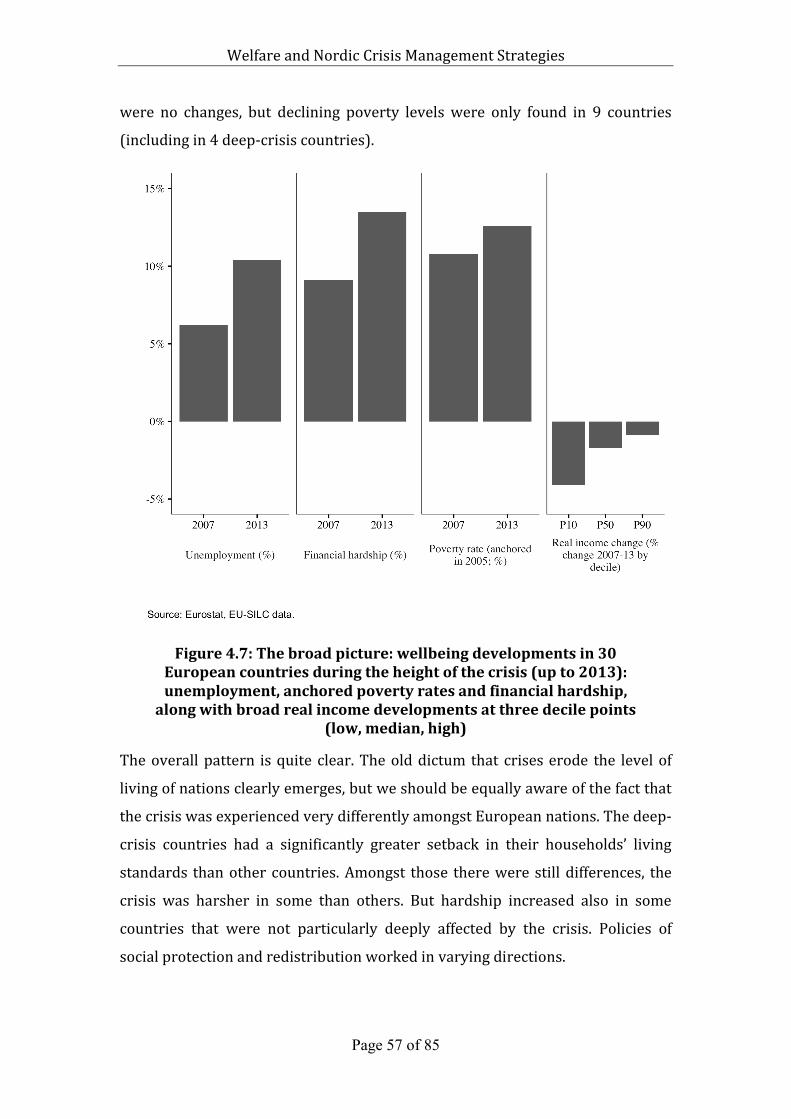
Welfare and Nordic Crisis Management Strategies
Page 57 of 85
were no changes, but declining poverty levels were only found in 9 countries
(including in 4 deep-crisis countries).
Figure4.7:Thebroadpicture:wellbeingdevelopmentsin30Europeancountriesduringtheheightofthecrisis(upto2013):unemployment,anchoredpovertyratesandfinancialhardship,
alongwithbroadrealincomedevelopmentsatthreedecilepoints(low,median,high)
The overall pattern is quite clear. The old dictum that crises erode the level of
living of nations clearly emerges, but we should be equally aware of the fact that
the crisis was experienced very differently amongst European nations. The deep-
crisis countries had a significantly greater setback in their households’ living
standards than other countries. Amongst those there were still differences, the
crisis was harsher in some than others. But hardship increased also in some
countries that were not particularly deeply affected by the crisis. Policies of
social protection and redistribution worked in varying directions.
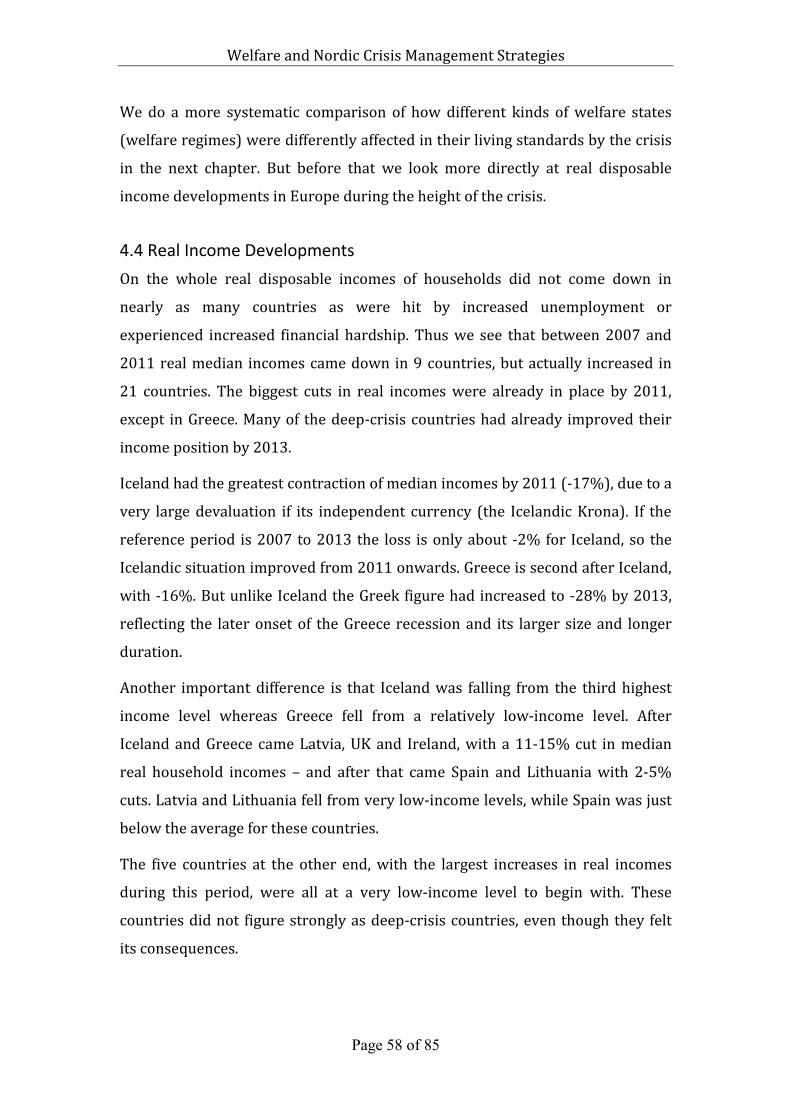
Welfare and Nordic Crisis Management Strategies
Page 58 of 85
We do a more systematic comparison of how different kinds of welfare states
(welfare regimes) were differently affected in their living standards by the crisis
in the next chapter. But before that we look more directly at real disposable
income developments in Europe during the height of the crisis.
4.4 Real Income Developments
On the whole real disposable incomes of households did not come down in
nearly as many countries as were hit by increased unemployment or
experienced increased financial hardship. Thus we see that between 2007 and
2011 real median incomes came down in 9 countries, but actually increased in
21 countries. The biggest cuts in real incomes were already in place by 2011,
except in Greece. Many of the deep-crisis countries had already improved their
income position by 2013.
Iceland had the greatest contraction of median incomes by 2011 (-17%), due to a
very large devaluation if its independent currency (the Icelandic Krona). If the
reference period is 2007 to 2013 the loss is only about -2% for Iceland, so the
Icelandic situation improved from 2011 onwards. Greece is second after Iceland,
with -16%. But unlike Iceland the Greek figure had increased to -28% by 2013,
reflecting the later onset of the Greece recession and its larger size and longer
duration.
Another important difference is that Iceland was falling from the third highest
income level whereas Greece fell from a relatively low-income level. After
Iceland and Greece came Latvia, UK and Ireland, with a 11-15% cut in median
real household incomes – and after that came Spain and Lithuania with 2-5%
cuts. Latvia and Lithuania fell from very low-income levels, while Spain was just
below the average for these countries.
The five countries at the other end, with the largest increases in real incomes
during this period, were all at a very low-income level to begin with. These
countries did not figure strongly as deep-crisis countries, even though they felt
its consequences.
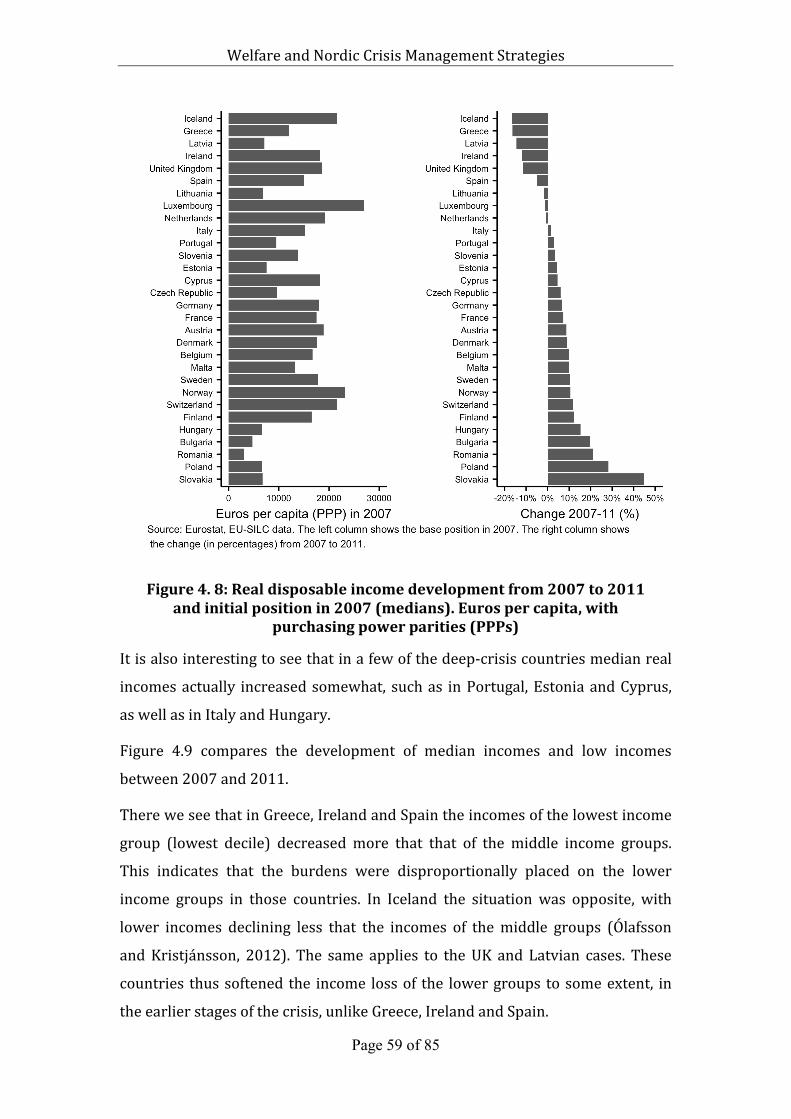
Welfare and Nordic Crisis Management Strategies
Page 59 of 85
Figure4.8:Realdisposableincomedevelopmentfrom2007to2011andinitialpositionin2007(medians).Eurospercapita,with
purchasingpowerparities(PPPs)
It is also interesting to see that in a few of the deep-crisis countries median real
incomes actually increased somewhat, such as in Portugal, Estonia and Cyprus,
as well as in Italy and Hungary.
Figure 4.9 compares the development of median incomes and low incomes
between 2007 and 2011.
There we see that in Greece, Ireland and Spain the incomes of the lowest income
group (lowest decile) decreased more that that of the middle income groups.
This indicates that the burdens were disproportionally placed on the lower
income groups in those countries. In Iceland the situation was opposite, with
lower incomes declining less that the incomes of the middle groups (Ólafsson
and Kristjánsson, 2012). The same applies to the UK and Latvian cases. These
countries thus softened the income loss of the lower groups to some extent, in
the earlier stages of the crisis, unlike Greece, Ireland and Spain.
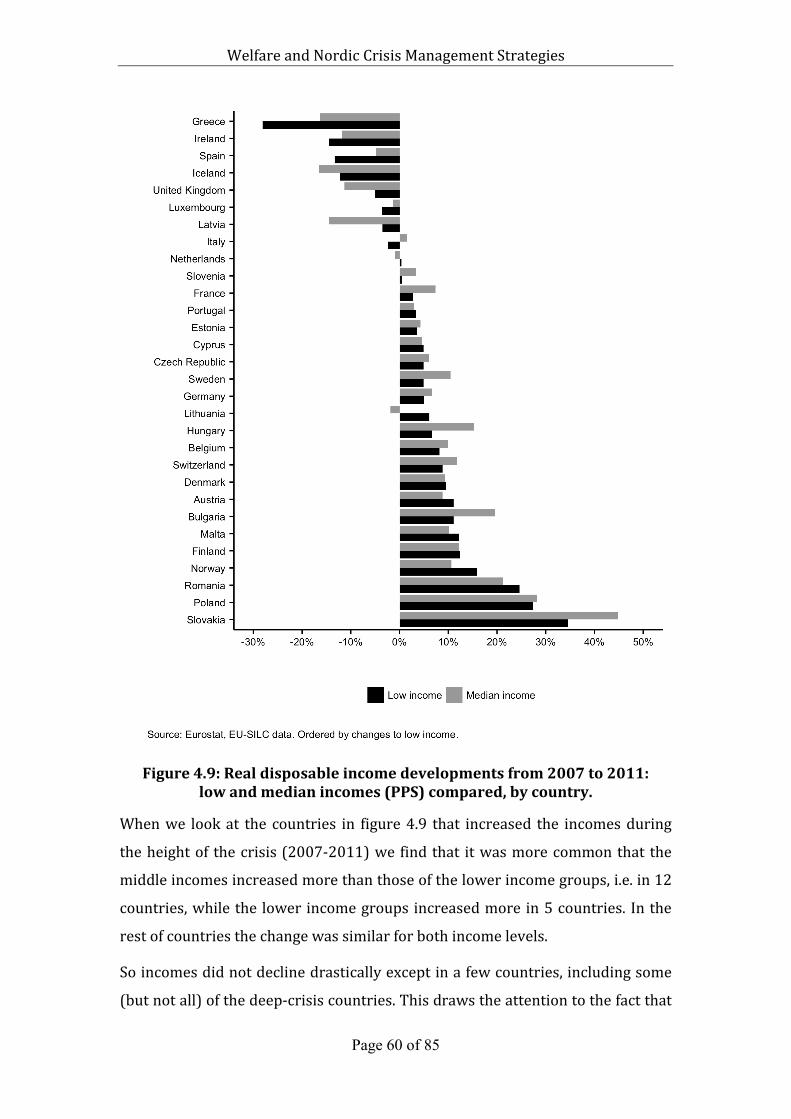
Welfare and Nordic Crisis Management Strategies
Page 60 of 85
Figure4.9:Realdisposableincomedevelopmentsfrom2007to2011:lowandmedianincomes(PPS)compared,bycountry.
When we look at the countries in figure 4.9 that increased the incomes during
the height of the crisis (2007-2011) we find that it was more common that the
middle incomes increased more than those of the lower income groups, i.e. in 12
countries, while the lower income groups increased more in 5 countries. In the
rest of countries the change was similar for both income levels.
So incomes did not decline drastically except in a few countries, including some
(but not all) of the deep-crisis countries. This draws the attention to the fact that
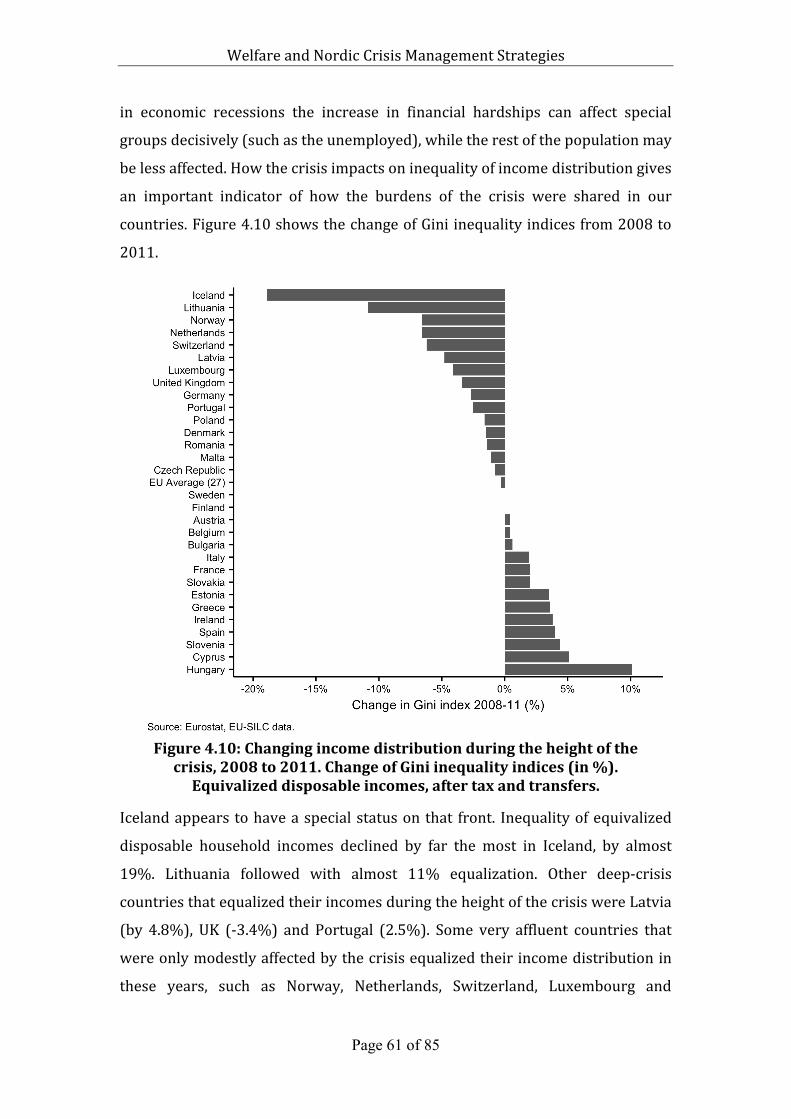
Welfare and Nordic Crisis Management Strategies
Page 61 of 85
in economic recessions the increase in financial hardships can affect special
groups decisively (such as the unemployed), while the rest of the population may
be less affected. How the crisis impacts on inequality of income distribution gives
an important indicator of how the burdens of the crisis were shared in our
countries. Figure 4.10 shows the change of Gini inequality indices from 2008 to
2011.
Figure4.10:Changingincomedistributionduringtheheightofthe
crisis,2008to2011.ChangeofGiniinequalityindices(in%).Equivalizeddisposableincomes,aftertaxandtransfers.
Iceland appears to have a special status on that front. Inequality of equivalized
disposable household incomes declined by far the most in Iceland, by almost
19%. Lithuania followed with almost 11% equalization. Other deep-crisis
countries that equalized their incomes during the height of the crisis were Latvia
(by 4.8%), UK (-3.4%) and Portugal (2.5%). Some very affluent countries that
were only modestly affected by the crisis equalized their income distribution in
these years, such as Norway, Netherlands, Switzerland, Luxembourg and
Welfare and Nordic Crisis Management Strategies
Page 62 of 85
Germany. Towards the lower end of the affluence scale Poland, Romania and
Malta also equalized their incomes.
Hungary had the greatest increase in inequality between 2008 and 2011, by
some 10%. Of the deep-crisis countries that increased income inequality during
these crisis years the most prominent were Cyprus (5.1%), (Spain (4.0%),
Ireland (3.8%), Greece (3.6%) and Estonia (3.5%). In those early stages of the
Great Recession income distribution became more equal in 16 countries while it
became more unequal in 13 countries. Two countries showed no change of the
Gini coefficients from 2008 to 2011. If the reference period were 2008 to 2014
equalization was effected in 14 countries but increased inequality in 17
countries.
The discrepancy in the outcomes that we see in figure 4.9 and 4.10 indicates that
in some of the countries that equalized incomes, it may have been due to
significant contraction of top incomes. Financial incomes contracted greatly in
many countries after the onset of the crisis and that primarily affected the top
incomes.
Those who are economically vulnerable to start with should though most often
be the groups most sensitive to crisis effects on their levels of living. We turn
now to a more detailed analysis of how the Great Recession affected the most
vulnerable through the crisis and compare how different welfare regimes may
explain some of the crisis consequences in European countries.
Some welfare regimes are more generous, provide stronger automatic stabilizers
and redistribute incomes to a greater extent, thus reducing poverty risks, in good
as well as in bad years. When correlating wellbeing developments to institutional
factors and political-economic positions we find that the depth of the crisis is the
most consequential factor for producing large wellbeing consequences in the
crisis years. We have already shown how this has affected levels of
unemployment, poverty rates, financial hardship and income levels.
Welfare regimes are the second largest explanatory factor in wellbeing
consequences. Other significant factors are debt level of government before the
Welfare and Nordic Crisis Management Strategies
Page 63 of 85
crisis started (which limits government possibilities for softening the crisis
effects on households).
Let us now turn to the analysis of economic vulnerability developments through
the crisis in different welfare regimes.
Welfare and Nordic Crisis Management Strategies
Page 64 of 85
5 Economic Vulnerability during the Crisis
One of our key interests was to determine the extent to which the Great
Recession increased the number of people finding themselves in dire straits
financially as well as whether different groups were more exposed than others to
financial hardship. One way to do this would be to rely on conventional poverty
thresholds, e.g. 60% of the median income. Such thresholds reflect a conception
of poverty as being relative to population standards and as such they work well
enough when comparing countries at a similar level of economic development or
tracking gradual changes within countries over time (Nolan & Whelan, 2011).
Recessions, however, render poverty thresholds problematic. Firstly, during
“normal” times the gradual change in question is the growth of the economy.
During recessions the economy contracts. Secondly, the contraction of the
economy is anything but gradual. This raises at least two problems. The first
problem has to do with consumption standards. Whereas it may be reasonable to
assume that consumption standards rise in line with increasing affluence during
protracted periods of gradual economic growth, there are good reasons to doubt
that such standards are lowered as quickly and to the same extent as the
economy contracts. One way to think about this is in terms of loss-aversion
(Kahneman, Knetsch, & Thaler, 1991), i.e. people feel loss more keenly than gains
and are consequently likely to resist revising their consumption standards
downwards and thus experiencing deprivation not so much relative to others as
to earlier and more affluent periods in their own lives.
The second problem is that recessions tend to affect the distribution of incomes
in ways that are mediated through the policy responses that are of interest to the
present study. For instance, in Iceland the government emphasized sheltering
what it deemed to be the most vulnerable groups while the incomes in the upper
reaches of the income distribution also declined sharply (Ólafsson, 2016b). This
lead to an overall reduction in inequality and to a decline in the proportion of
people with below 60% of the median income. If taken at face value one might
conclude erroneously that poverty had in fact declined at a time when most
Icelandic households saw their purchasing power decline drastically and their
Welfare and Nordic Crisis Management Strategies
Page 65 of 85
debt burden rise due to their mortgages being indexed to the Consumer Price
Index.
There are various other approaches. One could use an anchored poverty line but
findings are very sensitive to the selection of baseline years. Furthermore,
interpreting changes over time in a comparative study containing countries with
different initial levels of poverty and at different levels of economic development
is anything but straight-forward. One could use deprivation indicators such as
Eurostat’s Material Deprivation indicator (Fusco, Guio, & Marlier, 2013) or the
Consumption Deprivation indicator used by Nolan and Whelan (2011). While
these constitute a substantial improvement over income poverty thresholds
when it comes to comparing countries they pose the opposite problems to such
thresholds, namely that while the items that can be used to construct deprivation
indexes in the EU-SILC may be adequate to reflect differences between countries
they may not be sufficiently sensitive to national contexts to reflect
developments over time. Lastly, one might use subjective indicators such as
people’s assessment of their ability to make ends meet. These are obviously
subject to various response biases and do not necessarily give an adequate
reflection of people’s actual circumstances.
While all these indicators are to some extent flawed they all have some
advantages and all point towards one underlying construct, i.e. poverty or at
least to being in a vulnerable economic position. In order to take advantage of
the various strengths of different indicators we composed a measure of
economic vulnerability using latent class analysis of material deprivation, low
incomes and subjective sense of people‘s ability to make ends meet. This
approach to economic vulnerability rests of the work of Nolan and Whelan
(2011) who construct their measure of economic vulnerability in the same way
except they use their own composite indicator of deprivation whereas we use
Eurostat‘s material deprivation indicator. Details on the construction of this
indicator are given in a forthcoming technical paper to be published on the
project website.
In what follows we present some descriptives as examples of findings based on
our measure of economic vulnerability. We group countries into four groups, i.e.
Welfare and Nordic Crisis Management Strategies
Page 66 of 85
the Nordic countries, the Anglo-Saxon countries, Southern European countries
and the Baltic countries. While the countries within these groups share to some
extent certain social, economic and cultural traits, and in some cases certain
similarities in how the Great Recession played out, the grouping here is primarily
for heuristic purposes as we are not attempting anything like a causal analysis.
To do so is well beyond the scope of this report as it would require a great deal of
attention to the specifics of each case, requiring a lengthy exposition. More
sophisticated analysis will be presented in a book forthcoming from this project.
Finally, for ease of presentation we select three years, 2008, 2011 and 2014.
2008 reflects the situation before the onset of the recession, or at least before its
consequences materialized. 2011 can be seen as the height of the recession,
giving an indication of the initial consequences. 2014 has some countries moving
into recovery and is indicative of the effects of the recession over the medium
term.
5.1 Results
Figure 5.1 shows the prevalence of economic vulnerability within the population
overall in the twelve countries under study. The first thing to note is that there
are regime differences in terms of overall levels of vulnerability. The lowest rates
are found in the Nordic countries, ranging from 4.4% in Norway to 12.2% in
Iceland in 2014. The Nordic countries are followed by the Anglo-Saxon countries
with 16.2% in the UK and 20.6% in Ireland in that same year. As a group the
Southern European countries have the third highest rates though there are
substantial differences between them as well, with the lowest rate being in
Spain, 25.9%, and Greece standing out with the highest rate among the twelve
countries in 2014, namely 38.9%. The highest prevalence of vulnerability is
among the Baltic countries as a group, though they also differ considerably
among themselves, with Latvia having the highest rate, i.e. 35.5% and Estonia the
lowest, or 17.7%, which places Estonia in the vicinity of the Anglo-Saxon
countries.
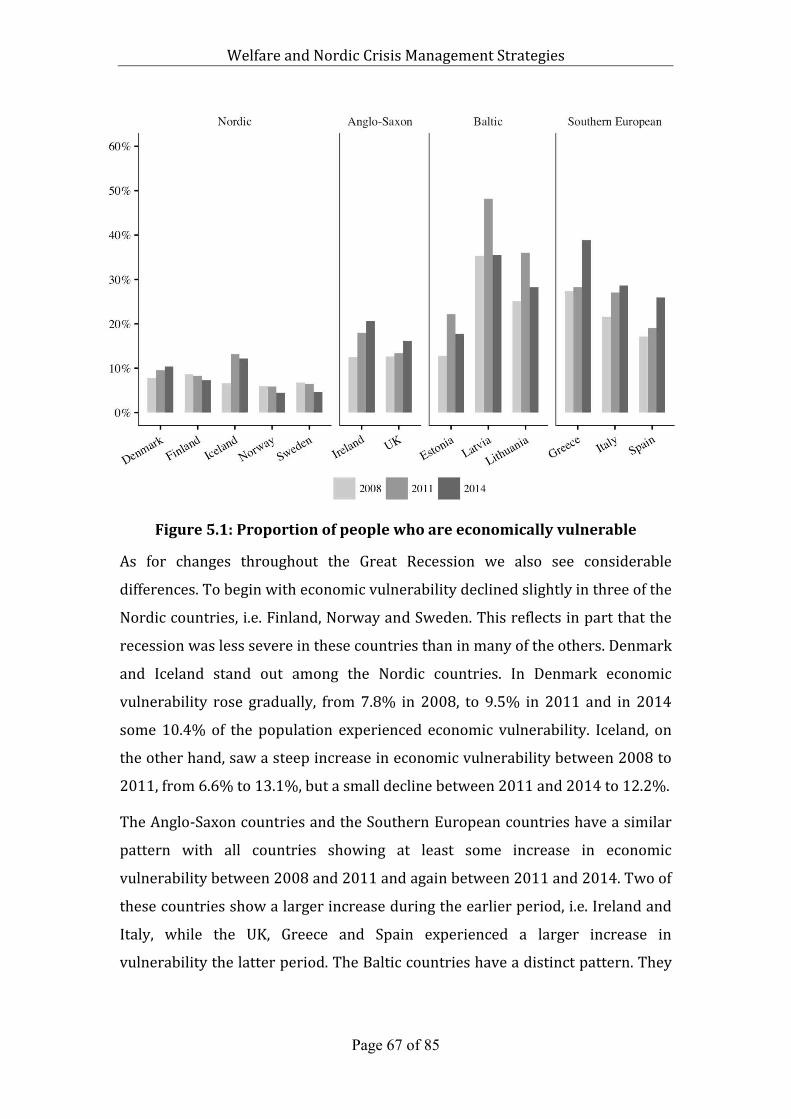
Welfare and Nordic Crisis Management Strategies
Page 67 of 85
Figure5.1:Proportionofpeoplewhoareeconomicallyvulnerable
As for changes throughout the Great Recession we also see considerable
differences. To begin with economic vulnerability declined slightly in three of the
Nordic countries, i.e. Finland, Norway and Sweden. This reflects in part that the
recession was less severe in these countries than in many of the others. Denmark
and Iceland stand out among the Nordic countries. In Denmark economic
vulnerability rose gradually, from 7.8% in 2008, to 9.5% in 2011 and in 2014
some 10.4% of the population experienced economic vulnerability. Iceland, on
the other hand, saw a steep increase in economic vulnerability between 2008 to
2011, from 6.6% to 13.1%, but a small decline between 2011 and 2014 to 12.2%.
The Anglo-Saxon countries and the Southern European countries have a similar
pattern with all countries showing at least some increase in economic
vulnerability between 2008 and 2011 and again between 2011 and 2014. Two of
these countries show a larger increase during the earlier period, i.e. Ireland and
Italy, while the UK, Greece and Spain experienced a larger increase in
vulnerability the latter period. The Baltic countries have a distinct pattern. They
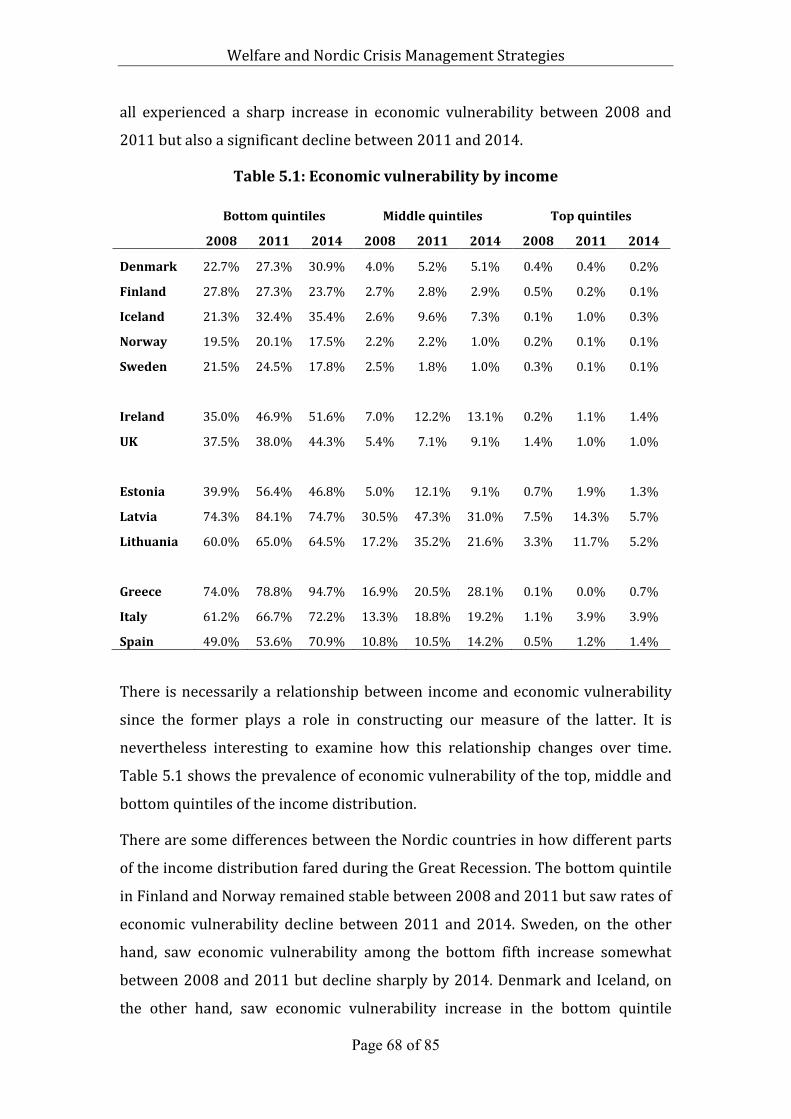
Welfare and Nordic Crisis Management Strategies
Page 68 of 85
all experienced a sharp increase in economic vulnerability between 2008 and
2011 but also a significant decline between 2011 and 2014.
Table5.1:Economicvulnerabilitybyincome
Bottomquintiles Middlequintiles Topquintiles
2008 2011 2014 2008 2011 2014 2008 2011 2014
Denmark 22.7% 27.3% 30.9% 4.0% 5.2% 5.1% 0.4% 0.4% 0.2%
Finland 27.8% 27.3% 23.7% 2.7% 2.8% 2.9% 0.5% 0.2% 0.1%
Iceland 21.3% 32.4% 35.4% 2.6% 9.6% 7.3% 0.1% 1.0% 0.3%
Norway 19.5% 20.1% 17.5% 2.2% 2.2% 1.0% 0.2% 0.1% 0.1%
Sweden 21.5% 24.5% 17.8% 2.5% 1.8% 1.0% 0.3% 0.1% 0.1%
Ireland 35.0% 46.9% 51.6% 7.0% 12.2% 13.1% 0.2% 1.1% 1.4%
UK 37.5% 38.0% 44.3% 5.4% 7.1% 9.1% 1.4% 1.0% 1.0%
Estonia 39.9% 56.4% 46.8% 5.0% 12.1% 9.1% 0.7% 1.9% 1.3%
Latvia 74.3% 84.1% 74.7% 30.5% 47.3% 31.0% 7.5% 14.3% 5.7%
Lithuania 60.0% 65.0% 64.5% 17.2% 35.2% 21.6% 3.3% 11.7% 5.2%
Greece 74.0% 78.8% 94.7% 16.9% 20.5% 28.1% 0.1% 0.0% 0.7%
Italy 61.2% 66.7% 72.2% 13.3% 18.8% 19.2% 1.1% 3.9% 3.9%
Spain 49.0% 53.6% 70.9% 10.8% 10.5% 14.2% 0.5% 1.2% 1.4%
There is necessarily a relationship between income and economic vulnerability
since the former plays a role in constructing our measure of the latter. It is
nevertheless interesting to examine how this relationship changes over time.
Table 5.1 shows the prevalence of economic vulnerability of the top, middle and
bottom quintiles of the income distribution.
There are some differences between the Nordic countries in how different parts
of the income distribution fared during the Great Recession. The bottom quintile
in Finland and Norway remained stable between 2008 and 2011 but saw rates of
economic vulnerability decline between 2011 and 2014. Sweden, on the other
hand, saw economic vulnerability among the bottom fifth increase somewhat
between 2008 and 2011 but decline sharply by 2014. Denmark and Iceland, on
the other hand, saw economic vulnerability increase in the bottom quintile
Welfare and Nordic Crisis Management Strategies
Page 69 of 85
between 2008 and 2011 and again between 2011 and 2014, the change being
more pronounced in Iceland than in Denmark.
As for the middle quintile economic vulnerability remained for the most part
stable between 2008 and 2014, especially in Denmark and Finland but declined
slightly in Norway and Sweden. Iceland is a notable exception with the
proportion of the middle income group rising sharply from 2.6% in 2008 to 9.6%
in 2011 though it had declined slightly again by 2014. The rates of economic
vulnerability among the top 20% were negligible in the Nordic countries and did
not change significantly during the period under study. There is, however, one
exception, namely Iceland that saw economic vulnerability in the top quintile
rise from 0.1% in 2008 to 1% in 2011 though by 2014 it was down again to
0.3%. In sum: In the Nordic countries economic vulnerability only became more
common among the bottom 20% in Denmark and the bottom quintile and the
middle income group in Iceland, which experienced by far the deepest crisis.
The Anglo-Saxon countries have a somewhat different pattern. In Ireland the
rate of economic vulnerability among the bottom fifth increased sharply between
2008 and 2011, from 35% to 46.9% and continued to rise and until 2014, when
it stood at 51.6%. In the UK the rate of economic vulnerability remained stable
between 2008 and 2011 but rose from 38% in 2011 to 44.3% in 2014. The
middle income groups also saw an increase in economic vulnerability in both
Ireland and the UK. In Ireland there was a sharp increase between 2008 and
2011, from 7% to 12.2% and a more modest increase between 2011 and 2014.
The UK saw a more gradual increase from 5.4% in 2008 to 9.1% in 2014. As for
the top quintile rates of economic vulnerability are quite low in both countries
though they increased in Ireland from 0.2% in 2008 to 1.4% in 2014 while
remaining stable in the UK.
The Baltic countries are somewhat distinct as two of them have relatively high
rates of economic vulnerability in the top quintile, namely Latvia and Lithuania.
The general pattern for these countries, i.e. vulnerability rising between 2008
and 2011 and declining again between 2011 and 2014, holds for all quintiles
under scrutiny in all three countries with the exception of the bottom quintile in
Lithuania that saw vulnerability rates rise by modest (noting though the initial
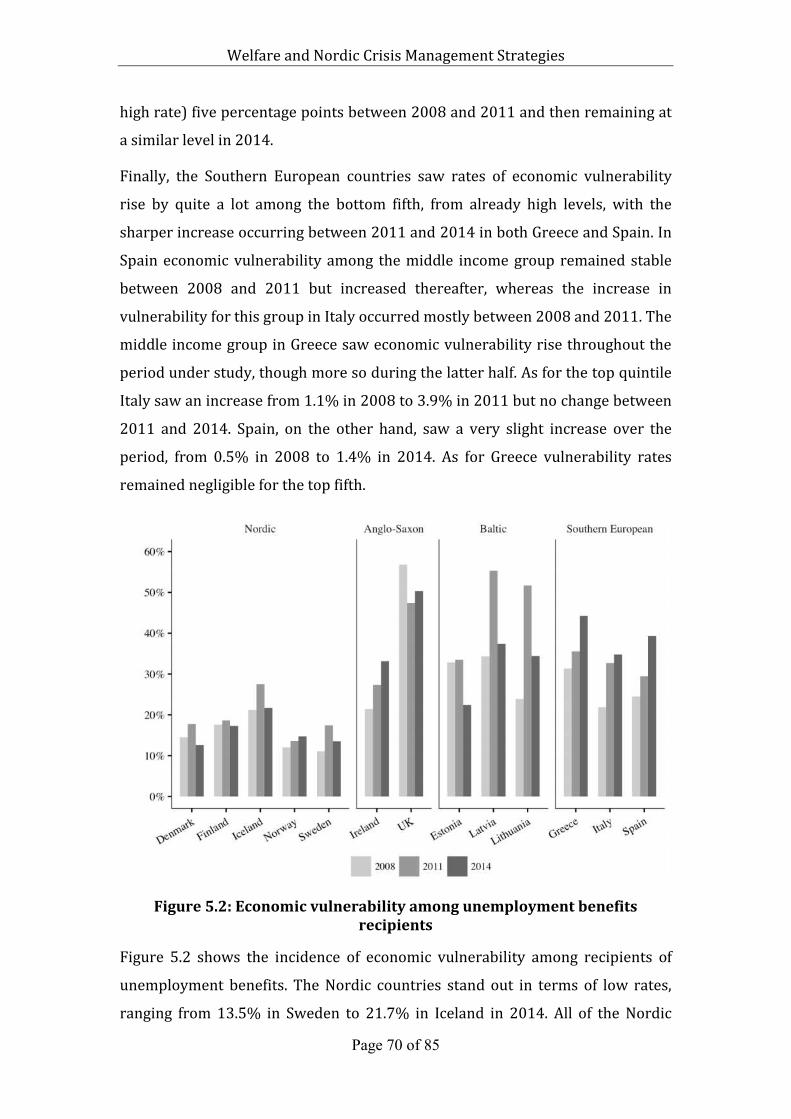
Welfare and Nordic Crisis Management Strategies
Page 70 of 85
high rate) five percentage points between 2008 and 2011 and then remaining at
a similar level in 2014.
Finally, the Southern European countries saw rates of economic vulnerability
rise by quite a lot among the bottom fifth, from already high levels, with the
sharper increase occurring between 2011 and 2014 in both Greece and Spain. In
Spain economic vulnerability among the middle income group remained stable
between 2008 and 2011 but increased thereafter, whereas the increase in
vulnerability for this group in Italy occurred mostly between 2008 and 2011. The
middle income group in Greece saw economic vulnerability rise throughout the
period under study, though more so during the latter half. As for the top quintile
Italy saw an increase from 1.1% in 2008 to 3.9% in 2011 but no change between
2011 and 2014. Spain, on the other hand, saw a very slight increase over the
period, from 0.5% in 2008 to 1.4% in 2014. As for Greece vulnerability rates
remained negligible for the top fifth.
Figure5.2:Economicvulnerabilityamongunemploymentbenefitsrecipients
Figure 5.2 shows the incidence of economic vulnerability among recipients of
unemployment benefits. The Nordic countries stand out in terms of low rates,
ranging from 13.5% in Sweden to 21.7% in Iceland in 2014. All of the Nordic
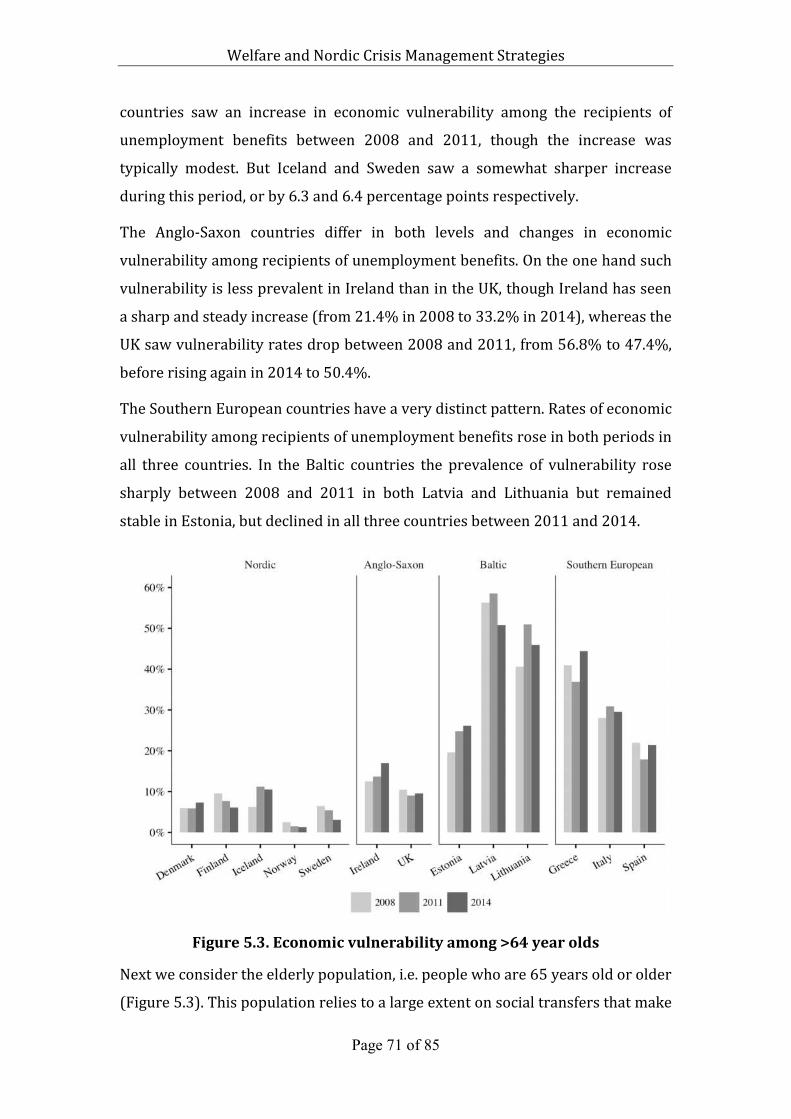
Welfare and Nordic Crisis Management Strategies
Page 71 of 85
countries saw an increase in economic vulnerability among the recipients of
unemployment benefits between 2008 and 2011, though the increase was
typically modest. But Iceland and Sweden saw a somewhat sharper increase
during this period, or by 6.3 and 6.4 percentage points respectively.
The Anglo-Saxon countries differ in both levels and changes in economic
vulnerability among recipients of unemployment benefits. On the one hand such
vulnerability is less prevalent in Ireland than in the UK, though Ireland has seen
a sharp and steady increase (from 21.4% in 2008 to 33.2% in 2014), whereas the
UK saw vulnerability rates drop between 2008 and 2011, from 56.8% to 47.4%,
before rising again in 2014 to 50.4%.
The Southern European countries have a very distinct pattern. Rates of economic
vulnerability among recipients of unemployment benefits rose in both periods in
all three countries. In the Baltic countries the prevalence of vulnerability rose
sharply between 2008 and 2011 in both Latvia and Lithuania but remained
stable in Estonia, but declined in all three countries between 2011 and 2014.
Figure5.3.Economicvulnerabilityamong>64yearolds
Next we consider the elderly population, i.e. people who are 65 years old or older
(Figure 5.3). This population relies to a large extent on social transfers that make
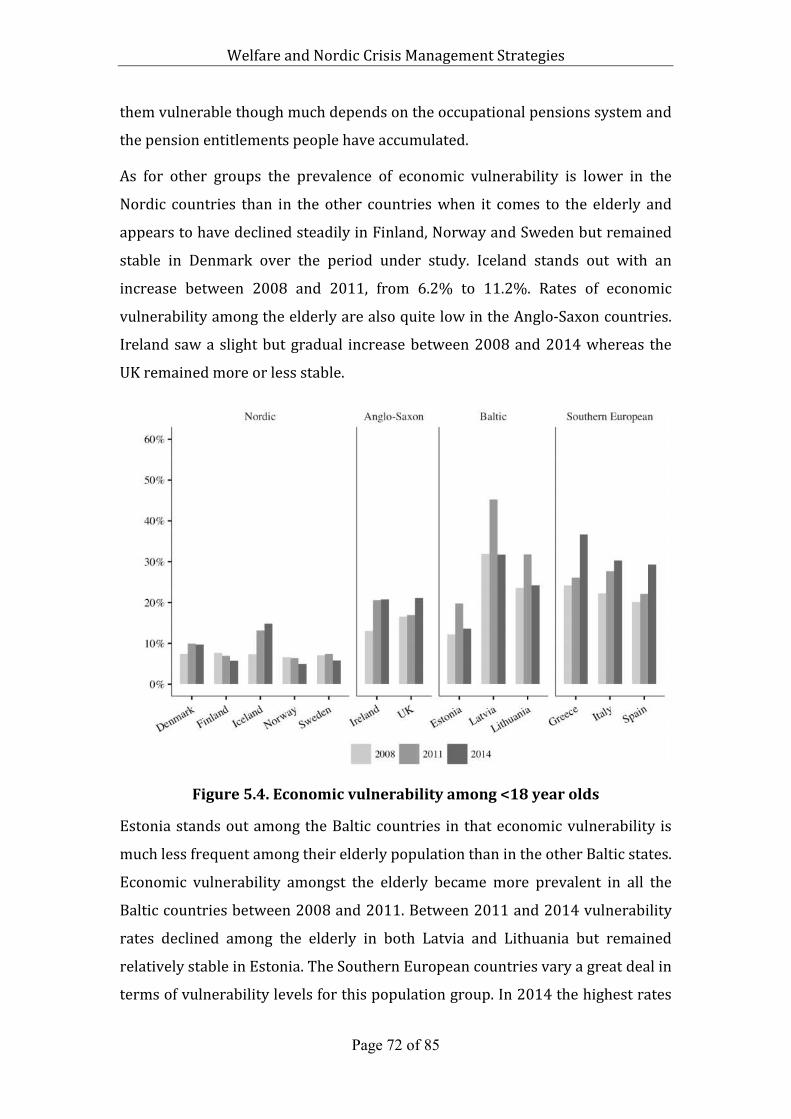
Welfare and Nordic Crisis Management Strategies
Page 72 of 85
them vulnerable though much depends on the occupational pensions system and
the pension entitlements people have accumulated.
As for other groups the prevalence of economic vulnerability is lower in the
Nordic countries than in the other countries when it comes to the elderly and
appears to have declined steadily in Finland, Norway and Sweden but remained
stable in Denmark over the period under study. Iceland stands out with an
increase between 2008 and 2011, from 6.2% to 11.2%. Rates of economic
vulnerability among the elderly are also quite low in the Anglo-Saxon countries.
Ireland saw a slight but gradual increase between 2008 and 2014 whereas the
UK remained more or less stable.
Figure5.4.Economicvulnerabilityamong<18yearolds
Estonia stands out among the Baltic countries in that economic vulnerability is
much less frequent among their elderly population than in the other Baltic states.
Economic vulnerability amongst the elderly became more prevalent in all the
Baltic countries between 2008 and 2011. Between 2011 and 2014 vulnerability
rates declined among the elderly in both Latvia and Lithuania but remained
relatively stable in Estonia. The Southern European countries vary a great deal in
terms of vulnerability levels for this population group. In 2014 the highest rates
Welfare and Nordic Crisis Management Strategies
Page 73 of 85
were in Greece, 44.4%, and the lowest in Spain, 21.4%, with Italy in between,
though closer to Spain at 29.5%. Both Greece and Spain saw vulnerability rates
among the elderly decline between 2008 and 2011 and rise again by 2014. The
obverse pattern is observed in Italy.
It is worth noting that economic vulnerability was less common among the
elderly in the Nordic and the Anglo-Saxon countries as well as in Spain, where as
it was more frequent among the elderly in Greece and the Baltic countries.
Children are another vulnerable group. Figure 5.4 shows the vulnerability rates
of people below the age of eighteen. Once again the Nordic countries stand out in
terms of low rates that remain for the most part stable between 2008 and 2014.
The exception is Iceland that saw a sharp increase between 2008 and 2011, from
7.3% to 13.1% and standing at 14.8% in 2014. Children tended in 2014 to have
higher rates of economic vulnerability than the elderly in the Nordic countries,
with the exception of Finland where they are quite similar.
In the Anglo-Saxon countries economic vulnerability among children increased
over the period. In Ireland the proportion of children deemed vulnerable went
from 13% in 2008 to 20.6% in 2011 but remained stable between 2011 and
2014. In the UK the rate was fairly stable just under 17% between 2008 and
2011, but rose to 21.2% in 2014. In both countries children were more likely to
be in economically vulnerable households than the elderly in 2014, though the
difference was much larger in the UK than in Ireland (21.2% compared to 9.5%
among the elderly).
In the Baltic countries we see a familiar pattern, i.e. a sharp increase between
2008 and 2011 followed by a sharp decline between 2011 and 2014. In all three
countries in 2014 children were substantially less likely to live in economically
vulnerable households than the elderly.
There is also a familiar pattern in the Southern European countries with an
increase over both intervals, with most of the increase occurring between 2011
and 2014 in Greece and Spain. Economic vulnerability was less prevalent among
children than among the elderly in Greece in 2014 but the obverse is observed in
Welfare and Nordic Crisis Management Strategies
Page 74 of 85
Spain. In Italy children and the elderly have similar rates of economic
vulnerability.
Welfare and Nordic Crisis Management Strategies
Page 75 of 85
6. Policy Responses in a Comparative Focus
The Global Financial Crisis culminated in the winter of 2008-2009 as financial
institutions around the world teetered on the brink of collapse. The crisis
spawned the Great Recession, which involved the largest economic contraction
in advanced economies in the post-war era. While the effects of the crisis were
particularly devastating in Greece, multiple countries experienced severe
domestic recessions in the years following the peak of the crisis. This was
especially so for countries that entered the crisis in a precarious fiscal position,
as they were highly vulnerable to the sudden stop in cross-boarder lending that
developed amid fears of banking and sovereign defaults. Some of the countries
most affected, including Latvia, Ireland, Iceland, and Portugal, were forced to
seek out the assistance of international lenders of last resort to stave off an
economic collapse. Although the effects of the Great Recession were most
pronounced in the deep crisis countries, almost all OECD countries experienced a
recessionary period in the aftermath of the crisis.9
The crisis led to a deterioration in the budget balance of most countries in the
first years after the crisis. While the restoration of financial institutions and
interest payments due to debt obligations were particularly costly for the deep
crisis countries, all governments provided some form of fiscal stimulus in the
initial stages of the Great Recession. Automatic stabilizers played a particularly
large role in buffering the initial effects of the crisis on aggregate demand, while
discretionary stimulus measures were also employed to support their workings
at the height of the crisis.
As the crisis developed, significant differences in fiscal policy choices across
countries became apparent. The response in several countries, including Greece,
9 For a more detailed discussion of the crisis, government policy responses, and wellbeing consequences, see Ólafsson, Daly, Kangas, and Palme‘s forthcoming edited volume, Welfare and Nordic Crisis Management Strategies. The book contains nine case studies of deep crisis countries, both in the Great Recession and the Nordic banking crisis of the 1990s, as well as a more comprehensive discussion of the role of the welfare state in ameliorating the effects of the crisis on the general population.
Welfare and Nordic Crisis Management Strategies
Page 76 of 85
Ireland, the UK, Spain, and Portugal, was characterized by harsh austerity
measures, which relied primarily on significant cuts to government spending.
Iceland stands out in this respect, as it was the only deep crisis country that
emphasized revenue increases more than expenditure cuts in their fiscal policy
response. Iceland did better in containing unemployment increases, relative
poverty and increased financial hardship than the countries that went harsher in
expenditure cuts, such as Greece and Ireland, despite large real income losses for
Icelandic households. An effective strategy of redistribution seems to have had a
role in cushioning the wellbeing losses of lower and middle-level households in
Iceland. Other countries, less affected by the crisis, pursued a mix of stimulating
fiscal policies that were more conducive to maintaining aggregate demand and
supporting economic wellbeing.
While fiscal policy choices differed significantly during the crisis, overall changes
to social policy were more characterized by continuity than change, when
looking at all European countries. However, that differed greatly between
countries depending on depth of the crisis and capabilities for countries to
respond. Thus, the extent to which countries were prepared to deal with a deep
recession at the onset of the crisis mattered a great deal. While some countries,
such as the Nordic countries, had forceful automatic stabilizers and generous
unemployment benefit systems in place to cushion the most severe effects of the
crisis, other countries were neither fully prepared nor in a position to implement
measures to adequately redistribute the costs of the crisis. Even so, Ireland and
Greece stand out as cases of significant social policy retrenchment, while Iceland
and Slovenia stand out as cases where redistributive measures played a larger
role as the crisis evolved. In any case, the social policy setting at the onset of the
crisis played a crucial role in shaping the effects of the crisis on economic
wellbeing.
When analyzing the wellbeing consequences of the crisis, the overall pattern is
quite clear. The old dictum that crises erode the level of living of nations clearly
emerges, but we should be equally aware of the fact that the crisis was
experienced very differently amongst European nations. The deep-crisis
countries had a significantly greater setback in their households’ living standards
Welfare and Nordic Crisis Management Strategies
Page 77 of 85
than other countries. Amongst those there were still differences, the crisis was
harsher in some than others, which was further compounded by the
implementation of harsh austerity measures. But hardship increased also in
some countries that were not particularly deeply affected by the crisis. Policies of
social protection and redistribution worked in varying directions.
Those who are economically vulnerable to start with are most often the groups
most sensitive to the effects of crises on their level of living. The welfare state
and government policy responses more generally, play a crucial role in
protecting those groups during crises episodes. Some welfare regimes are more
generous, provide stronger automatic stabilizers and redistribute incomes to a
greater extent, thus reducing poverty risks, in good as well as in bad years. When
correlating wellbeing developments to institutional factors and political-
economic positions we find that the depth of the crisis is the most consequential
factor for producing large wellbeing consequences in the crisis years. However,
welfare regimes are the second largest explanatory factor in wellbeing
consequences. Thus, how the welfare state is employed during times of economic
crises is crucial for the wellbeing consequences of the general population.
Welfare and Nordic Crisis Management Strategies
Page 78 of 85
References
Agnello, L., & Sousa, R. M. (2014). How does fiscal consolidation impact on
income inequality? Review of Income and Wealth, 60(4), 702–726.
Alesina, A., & Ardagna, S. (1998). Tales of fiscal adjustment. Economic Policy,
13(27), 488–545.
Alesina, A., & Ardagna, S. (2010). Large changes in fiscal policy: taxes versus
spending. In Tax Policy and the Economy, Volume 24 (pp. 35–68). The University
of Chicago Press.
Alesina, A., Barbiero, O., Favero, C., Giavazzi, F., & Paradisi, M. (2015). Austerity in
2009-2013. Economic Policy, 30(83), 383–437.
Alesina, A. F., & Ardagna, S. (2012). The Design of Fiscal Adjustments (Working
Paper Series No. 18423). National Bureau of Economic Research.
Alesina, A., & Perotti, R. (1997). Fiscal Adjustments in OECD Countries:
Composition and Macroeconomic Effects. International Monetary Fund Staff
Papers, 44(2, June), 210–248.
Anderson, K. M. (2001). The Politics of Retrenchment in a Social Democratic
Welfare State Reform of Swedish Pensions and Unemployment Insurance.
Comparative Political Studies, 34(9), 1063–1091.
Armingeon, K. (2012). The Politics of Fiscal Responses to the Crisis of 2008–
2009. Governance, 25(4), 543–565.
Auerbach, A. J., Gale, W. G., & Harris, B. H. (2010). Activist Fiscal Policy. The
Journal of Economic Perspectives, 24(4), 141–163.
Baldwin, P. (1990). The Politics of Social Solidarity: Class Bases of the European
Welfare State 1875-1975. Cambridge: Cambridge University Press.
Baldwin, R., Beck, T., Bénassy-Quéré, A., Blanchard, O., Corsetti, G., de Grauwe, P.,
… Weder di Mauro, B. (2015). Rebooting the Eurozone: Step 1 – agreeing a crisis
narrative (Policy Insight No. 85). Centre for Economic Policy Research.
Welfare and Nordic Crisis Management Strategies
Page 79 of 85
Ball, L., Furceri, D., Leigh, D., & Loungani, P. (2013). The Distributional Effects of
Fiscal Consolidation.
Baunsgaard, T., & Symansky, S. A. (2009). Automatic Fiscal Stabilizers (IMF Staff
Position Note No. 23). International Monetary Fund.
Bermeo, N., & Pontusson, J. (2012). Coping with Crisis: Government Reactions to
the Great Recession. New York, NY: Russell Sage Foundation.
Blanchard, O., Dell’Ariccia, G., & Mauro, P. (2010). Rethinking Macroeconomic
Policy. Journal of Money, Credit and Banking, 42(s1), 199–215.
Blyth, M. (2002). Great Transformations: Economic Ideas and Institutional Change
in the Twentieth Century. Cambridge, MA: Cambridge University Press.
Blyth, M. (2013). Austerity: The History of a Dangerous Idea. Oxford, UK: Oxford
University Press.
Bonoli, G. (2001). Political Institutions, Veto Points, and the Process of Welfare
State Adaptation. In P. Pierson (Ed.), The New Politics of the Welfare State (pp.
238–264). Oxford, UK: Oxford University Press.
Bradshaw, J., Ditch, J., Holmes, H., & Whiteford, P. (1993). Support for Children: A
Comparison of Arrangements in Fifteen Countries (Department of Social Security
Research Report No. 21). London: HMSO.
Cameron, D. (2012). European Fiscal Responses to the Great Recession. In N.
Bermeo & J. Pontusson (Eds.), Coping with Crisis: Government Reactions to the
Great Recession (pp. 91–129).
Capoccia, G., & Kelemen, R. D. (2007). The study of critical junctures: Theory,
narrative, and counterfactuals in historical institutionalism. World Politics, 59(3),
341–369.
Castles, F. G. (2010). Black Swans and Elephants on the Move: The Impact of
Emergencies on the Welfare State. Journal of European Social Policy, 20(2), 91–
101.
Welfare and Nordic Crisis Management Strategies
Page 80 of 85
Clayton, R., & Pontusson, J. (1998). Welfare-State Retrenchment Revisited:
Entitlement Cuts, Public Sector Restructuring, and Inegalitarian Trends in
Advanced Capitalist Societies. World Politics, 51(1), 67–98.
Copelovitch, M., Frieden, J., & Walter, S. (2016). The Political Economy of the
Euro Crisis. Comparative Political Studies.
Cutler, D. M., & Johnson, R. (2004). The birth and growth of the social insurance
state: Explaining old age and medical insurance across countries. Public Choice,
120(1–2), 87–121.
Dao, M., & Loungani, M. P. (2010). The Human Cost of Recessions: Assessing It,
Reducing It. International Monetary Fund.
Devries, P., Guajardo, J., Leigh, D., & Pescatori, A. (2011). A New Action-Based
Dataset of Fiscal Consolidation (IMF Working Paper No. 128). International
Monetary Fund.
Eichengreen, B. (2008). The European Economy since 1945: Coordinated
Capitalism and Beyond: Coordinated Capitalism and Beyond. Princeton, NJ:
Princeton University Press.
Esser, I., Ferrarini, T., Nelson, K., Palme, J., & Sjöberg, O. (2013). Unemployment
Benefits in EU Member States. Directorate-General for Employment, Social Affairs
and Inclusion, European Commision.
European Commission. (2016a). Irish GDP Revision. Retrieved from
http://ec.europa.eu/eurostat/documents/24987/6390465/Irish_GDP_communi
cation.pdf
European Commission. (2016b). The Corrective Arm. Retrieved from
http://ec.europa.eu/economy_finance/economic_governance/sgp/corrective_ar
m/index_en.htm
Frieden, J. (2015). The Political Economy of Adjustment and Rebalancing. Journal
of International Money and Finance, 52, 4–14.
Fusco, A., Guio, A., & Marlier, E. (2013). Building a Material Deprivation Index
and a Multinational Context: Lessons from the EU Experience. In V. Berenger, &
Welfare and Nordic Crisis Management Strategies
Page 81 of 85
F. Bresson, Poverty and Social Exclusion Around the Mediterranean Sea (pp. 43-
71). New York: Springer.
Garrett, G. (1998). Global markets and national politics: collision course or
virtuous circle? International Organization, 52(4), 787–824.
Gourevitch, P. (1986). Politics in hard times: comparative responses to
international economic crises. Cornell University Press.
Guajardo, J., Leigh, D., & Pescatori, A. (2014). Expansionary Austerity?
International Evidence. Journal of the European Economic Association, 12(4),
949–968.
Hacker, J. S. (2004). Privatizing risk without privatizing the welfare state: The
hidden politics of social policy retrenchment in the United States. American
Political Science Review, 98(2), 243–260.
Hacker, J. S., & Pierson, P. (2010). Winner-take-all politics: Public policy, political
organization, and the precipitous rise of top incomes in the United States. Politics
& Society, 38(2), 152–204.
Hall, P. A. (Ed.). (1989). The Political Power of Economic Ideas: Keynesianism
Across Nations. Princeton, NJ: Princeton University Press.
Hall, P. A. (1993). Policy paradigms, social learning, and the state: the case of
economic policymaking in Britain. Comparative Politics, 275–296.
Hall, P. A. (1999). The Political Economy of Europe in an Era of Interdependence.
In H. Kitschelt, P. Lange, G. Marks, & J. D. Stephens (Eds.), Continuity and Change
in Contemporary Capitalism. New York, NY: Cambridge University Press.
Hall, P. A. (2013). The Political Origins of Our Economic Discontents: In M. Kahler
& D. A. Lake (Eds.), Politics in the New Hard Times (pp. 129–149). Cornell
University Press.
Hall, P. A., & Soskice, D. (2001). Varieties of Capitalism: The Institutional
Foundations of Comparative Advantage. New York, NY: Oxford University Press.
Welfare and Nordic Crisis Management Strategies
Page 82 of 85
Herndon, T., Ash, M., & Pollin, R. (2014). Does High Public Debt Consistently Stifle
Economic Growth? A Critique of Reinhart and Rogoff. Cambridge Journal of
Economics, 38(2), 257–279.
Huber, E., & Stephens, J. D. (2014). Partisan Impacts on Social Policy and
Distributive Outcomes in the Eras of Welfare State Expansion and Retrenchment.
In APSA 2014 Annual Meeting Paper.
Kahneman, D., Knetsch, J., & Thaler, R. (1991). Anomalies: The Endowment
Effect, Loss Aversion, and Status Quo Bias. The Journal of Economic Perspectives,
5(1), 193-206.
Keynes, J. M. (1936). The General Theory of Employment, Interest and Money.
London: Macmillan.
Kingdon, J. W. (1984). Agendas, alternatives, and public policies. Longman.
Korpi, W. (2003). Welfare-State Regress in Western Europe: Politics, Institutions,
Globalization, and Europeanization. Annual Review of Sociology, 29(1), 589–609.
Korpi, W., & Palme, J. (2003). New politics and class politics in the context of
austerity and globalization: Welfare state regress in 18 countries, 1975-95.
American Political Science Review, 97(3), 425–446.
Krugman, P. (2012). End This Depression Now! New York, NY: WW Norton.
Laeven, L., & Valencia, F. (2013). Systemic Banking Crises Database. IMF
Economic Review, 61(2), 225–270.
Lane, P. R. (2012). The European Sovereign Debt Crisis. The Journal of Economic
Perspectives, 26(3), 49–67. https://doi.org/10.1257/jep.26.3.49
Lindblom, C. E. (1959). The science of“ muddling through.” Public Administration
Review, 79–88.
Lucas, R. E. (1976). Econometric policy evaluation: A critique. In Carnegie-
Rochester conference series on public policy (Vol. 1, pp. 19–46). Elsevier.
Mandelkern, R. (2016). Explaining the Striking Similarity in Macroeconomic
Policy Responses to the Great Recession The Institutional Power of
Macroeconomic Governance. Comparative Political Studies, 49(2), 219–252.
Welfare and Nordic Crisis Management Strategies
Page 83 of 85
Marchal, S., Marx, I., & Mechelen, N. V. (2016). Minimum income protection in the
austerity tide. IZA Journal of European Labor Studies, 5(1), 1–20.
McNamara, K. R. (1998). The Currency of Ideas: Monetary Politics in the European
Union. Cambridge, MA: Cambridge University Press.
Mettler, S. (2015). Twenty Years On: Paul Pierson’s Dismantling the Welfare
State? PS: Political Science & Politics, 48(2), 270–273.
Miron, J. A., & Weil, D. N. (1998). The Genesis and Evolution of Social Security. In
M. D. Bordo, C. Goldin, & E. White (Eds.), The Defining Moment: The Great
Depression and the American Economy in the Twentieth Century (pp. 297–322).
Chicago, IL: University of Chicago Press.
Mosley, L. (2003). Global Capital and National Governments. Cambridge
University Press.
Nolan, B., & Whelan, C. (2011). Poverty and Deprivation in Europe. Oxford: Oxford
University Press.
OECD. (2016). OECD Tax Benefit Model. Retrieved from
http://www.oecd.org/els/benefits-and-wages.htm
Offe, C. (1984). Contradictions of the Welfare State. (J. Keane, Ed.). Cambridge,
MA: MIT Press.
Ólafsson, S. (2016a). The Political Economy of Iceland’s Boom and Bust. In V.
Ingimundarson, P. Urfalino, & I. Erlingsdóttir, Iceland's Financial Crisis. The
Politics of Blame, Protest, and Reconstruction. London: Routledge.
Ólafsson, S. (2016b). The Strategy of Redistribution: Iceland’s Way Out of the
Crisis. In V. Ingimundarson, P. Urfalino, & I. Erlingsdóttir, Iceland's Financial
Crisis. The Politics of Blame, Protest, and Reconstruction. London: Routledge.
Ólafsson, S., & Kristjánsson, A. S. (2012). Umfang kreppunnar og afkoma ólíkra
tekjuhópa (Áhrif fjármálahrunsins á lífskjör þjóðarinnar No. 1). Reykjavík:
Þjóðmálastofnun Háskóla Íslands.
Pierson, P. (1994). Dismantling the Welfare State?: Reagan, Thatcher and the
Politics of Retrenchment. Cambridge, UK: Cambridge University Press.
Welfare and Nordic Crisis Management Strategies
Page 84 of 85
Pierson, P. (1996). The New Politics of the Welfare State. World Politics, 48(2),
143–179.
Pierson, P. (2015). Reflections on the Evolution of a Research Program. PS:
Political Science & Politics, 48(2), 292–294.
Polanyi, K. (1944). The Great Transformation: The Political and Economic Origins
of Our Time. New York, NY: Farrar & Rinehart.
Pontusson, J., & Raess, D. (2012). How (and Why) Is This Time Different? The
Politics of Economic Crisis in Western Europe and the United States. Annual
Review of Political Science, 15(1), 13–33.
Price, R. W., Dang, T.-T., & Botev, J. (2015). Adjusting Fiscal Balances for the
Business Cycle: New Tax and Expenditure Elasticity Estimates for Oecd Countries
(OECD Economics Department Working Papers No. 1275). Paris, France: OECD.
Raess, D., & Pontusson, J. (2015). The Politics of Fiscal Policy During Economic
Downturns, 1981–2010. European Journal of Political Research, 54(1), 1–22.
Reinhart, C. M., & Rogoff, K. S. (2009). This Time Is Different: Eight Centuries of
Financial Folly. Princeton, NJ: Princeton University Press.
Romer, C. D., & Romer, D. H. (2010). The Macroeconomic Effects of Tax Changes:
Estimates Based on a New Measure of Fiscal Shocks. The American Economic
Review, 763–801.
Ruggie, J. G. (1982). International regimes, transactions, and change: embedded
liberalism in the postwar economic order. International Organization, 36(2),
379–415.
Scharpf, F. W., & Schmidt, V. A. (2000). Welfare and work in the open economy,
Volume 2: diverse responses to common challenges. Oxford University Press.
Spilimbergo, M. A., Symansky, M. S. A., Cottarelli, M. C., & Blanchard, O. J. (2009).
Fiscal policy for the crisis. International Monetary Fund.
Starke, P., Kaasch, A., & Hooren, F. V. (2013). The Welfare State as Crisis Manager:
Explaining the Diversity of Policy Responses to Economic Crisis. Palgrave
Macmillan.
Welfare and Nordic Crisis Management Strategies
Page 85 of 85
Svallfors, S., & Taylor-Gooby, P. (Eds.). (1999). The End of the Welfare State?
Responses to State Retrenchment. New York, NY: Routledge.
Swank, D. (2001). Political Institutions and Welfare State Restructuring: The
Impact of Institutions on Social Policy Change in Developed Democracies. In P.
Pierson (Ed.), The New Politics of the Welfare State (pp. 197–237). Oxford, UK:
Oxford University Press.
Taylor, J. B. (2000). Reassessing discretionary fiscal policy. The Journal of
Economic Perspectives, 21–36.
van Kersbergen, K., Vis, B., & Hemerijck, A. (2014). The Great Recession and
Welfare State Reform: Is Retrenchment Really the Only Game Left in Town?
Social Policy & Administration, 48(7), 883–904.
Weaver, R. K. (1986). The Politics of Blame Avoidance. Journal of Public Policy,
6(4), 371–398.