Embed Size (px)
Citation preview

Welfare Payments and Crime
C. Fritz Foley Harvard University and NBER
June 2009
Author contact information: Baker Hall 235, Soldiers Field Road, Boston, MA 02163, [email protected]. I thank Jeff Cronin, Linnea Meyer, and Janelle Prevost for excellent research assistance and police departments in 12 cities for providing data. Seminar participants at the American Law and Economics Association Annual Meeting, Harvard University, the NBER Law and Economics Program Meeting, Wesleyan University, Yale Law School, and numerous others provided very helpful comments. The Division of Research at Harvard Business School provided generous funding.

Welfare Payments and Crime
Abstract Analysis of daily reported incidents of major crimes in twelve U.S. cities reveals an increase in crime over the course of monthly welfare payment cycles. This increase reflects an increase in crimes that are likely to have a direct financial motivation like burglary, larceny-theft, motor vehicle theft, and robbery, as opposed to other kinds of crime like arson, assault, homicide, and rape. Temporal patterns in crime are observed in jurisdictions in which disbursements are focused at the beginning of monthly welfare payment cycles and not in jurisdictions in which disbursements are relatively more staggered. These findings indicate that welfare beneficiaries consume welfare related income quickly and then attempt to supplement it with criminal income.

1
1. Introduction
Consider an individual who receives support from monthly welfare payments that are
distributed at the beginning of the month. These payments may be made directly to this
individual or to someone who provides for the individual or transacts with the individual.
Welfare payments are disbursed on a monthly basis, and a series of studies indicate that the
typical recipient of cash assistance increases consumption immediately following the receipt
of payments and exhausts these payments quickly. Poor individuals are also unlikely to have
access to savings or credit that might help cover temporary cash shortfalls and often have
weak earnings prospects in legitimate economic activity. Consequently, this hypothetical
individual might deplete welfare related income quickly and turn to crime to supplement this
income. This paper tests if income generating criminal activity is increasing in the amount of
time that has passed since welfare payments occurred.
The analysis exploits plausibly exogenous variation in the timing of payments across
cities and differences in the likely motivation of different kinds of crime. The three welfare
programs that provide the largest share of income maintenance benefits to the poor are
considered; these are the Food Stamp Program, the Temporary Assistance for Needy Families
(TANF) Program, and the Supplemental Security Income (SSI) Program. The sample of
reported incidents of crime covers 12 cities in which more than 10% of the population
receives payments from the most inclusive welfare program, the Food Stamp Program. If
patterns in crime are influenced by the timing of welfare payments, then increases in crime
over the course of monthly payment cycles should be most pronounced in cities in which such
payments are focused at the beginning of these cycles. If criminal income is used to
supplement welfare income, then any increase in crime should be reflected in Type I Uniform

2
Crime Report (UCR) or Group A National Incident Based Reporting System (NIBRS) crimes
with a direct financial motivation (burglary, larceny-theft, motor vehicle theft, and robbery)
and not other Type I UCR or Group A NIBRS crimes (arson, assault offenses, forcible sex
offenses, and homicide).
Two approaches yield results indicating that crime rates do in fact increase in the
amount of time that has passed since welfare payments occurred. The first approach tests if
levels of criminal activity are different in the first ten calendar days of the month; this
timeframe corresponds to the period over which food stamp payments occur in cities where
they are focused at the beginning of the month. Rates of crime and counts of reported
incidents are higher after the first ten days of the month in jurisdictions where welfare
payments are focused at the beginning of the month but not in other jurisdictions. The second
approach employs an index that reflects the number of days since welfare payments occurred
in a city. This index takes into account payments related to not only food stamps but also
TANF and SSI. Higher values of the index are associated with more crime.
Both approaches also reveal that increases in crime over the course of monthly welfare
payment cycles are only observed for crimes that are likely to have a financial motivation and
not for other Type I UCR or Group A NIBRS crimes. These findings are inconsistent with
explanations for temporal patterns in crime that are unrelated to the timing of welfare
payments, like explanations related to police officer deployment or incentives to report crimes
as having occurred at certain times.
The findings in this paper make a number of contributions. First, they indicate a role
for behavioral considerations in economic explanations of criminal activity. Becker (1968)
provides a framework for analyzing criminal behavior in which criminals rationally weigh the

3
costs and benefits of illegal activity and are more likely to turn to crime when they are likely
to earn less from legitimate activities. This framework has received ample empirical support.1
Recent work showing that cash assistance recipients typically spend their payments too
quickly implies a channel by which a particular behavioral bias, short-run impatience, affects
the decision to engage in criminal activity. Shapiro (2005) documents that food stamp
recipients experience a decline in caloric intake and an increase in the marginal utility of
consumption in between food stamp payments. Stephens (2003) finds that households that
primarily depend on social security for income increase spending on goods that reflect
instantaneous consumption in the first few days following the receipt of their check. Stephens
and Unayama (2008) show that more frequent retirement payments smooth consumption
among retired Japanese pension recipients. Dobkin and Puller (2007) find that welfare
recipients increase their consumption of illegal drugs when their checks arrive at the
beginning of the month, spurring an increase in hospitalizations and deaths. These studies
provide evidence of short-run impatience and violations of the permanent income hypothesis.2
My results indicate that this type of consumption behavior is associated with an increase in
financially motivated criminal activity later in monthly welfare payment cycles. These types
of behavioral effects call for distinctive public policy responses, as noted by Jolls (2007) and
Bertrand, Mullainathan, and Shafir (2004).
1 Numerous studies including Donohue and Levitt (2001), Raphael and Winter-Ember (2001), and earlier work summarized in Freeman (1995) have found a significant but small effect of unemployment on property crimes. Machin and Meghir (2004) and Gould, Weinberg and Mustard (2002) find that changes in earnings of low wage and unskilled workers in particular affect crime. 2 Phelps and Pollak (1968) develop a simple framework of short-run impatience, and this framework is employed by Laibson (1997), O’Donohue and Rabin (1999), O’Donohue and Rabin (2001), and Angeletos et al. (2001) to consider a variety of economic applications. A number of papers provide evidence on the validity of the permanent income hypothesis by studying the immediate consumption response to changes in income. Recent work includes Shapiro and Slemrod (2003), Hsieh (2003), Johnson, Parker, and Souleles (2006), and Stephens (2008). Lee and McCrary (2005) present evidence that criminals typically have high discount rates or hyperbolic time preferences.

4
Second, the paper illustrates an effect of the design of welfare programs on crime. A
large literature, parts of which are reviewed in Moffitt (1992) and Blank (2002), considers the
effects of welfare programs on employment, poverty, family structure, and other factors.
Some studies analyze the effects of welfare payments on criminal activity using cross
sectional data. DeFranzo (1996, 1997) and Hannon and DeFranzo (1998a, 1998b) present
evidence that welfare payments reduce major crimes. However, Burek (2005) finds that
welfare payments are associated with higher levels of less severe crimes. These studies
typically face challenges controlling for all the characteristics of jurisdictions that are likely to
affect both the use of welfare programs and criminal activity.
The findings in my paper point out that the timing and frequency of welfare payments
have effects that carry policy implications. Staggered, frequent payments would smooth
levels of crime. The leveling of criminal activity would make communities safer because
police departments would not become overwhelmed by cyclical spikes. If, as shown in
previous work, welfare beneficiaries exhibit short-run impatience and follow a quasi-
hyperbolic model of intertemporal choice, more frequent payments would reduce the extent to
which they overconsume soon after payments arrive. Beneficiaries would be less likely to
experience increased marginal utility of consumption and dire circumstances at the end of
monthly payment cycles. As a consequence, they would not have such strong incentives to
turn to crime to augment their income, and crime rates could be lower.
This paper also adds to the burgeoning literature on household finance. Campbell
(2006) explores this field. Only a small part of the work in this field specifically considers the
personal finances of low-income individuals. Duflo, Gale, Liebman, Orszag, and Saez (2006)
and Beverly, Shneider, and Tufano (2006) argue that low-income individuals in particular do

5
not save enough. Low savings levels can have detrimental consequences for the poor, who
face severe credit constraints as documented in Adams, Einav, and Levin (2009), Barr (2004)
and elsewhere. My analysis indicates that individuals who exhaust their legitimate income
rapidly and do not have access to savings or credit attempt to increase their income through
criminal activity.3
The remainder of the paper is organized as follows. The next section explains the
hypotheses in more detail, and section 3 describes the data and the main tests. Section 4
presents the results, and the last section concludes.
2. Hypotheses
Welfare payments are distributed on a monthly basis according to payment schedules
that vary across programs and states. In many jurisdictions, payments from all the major
programs to all recipients occur during a short period within each month, typically the
beginning of the month. Studies of the consumption of cash assistance recipients, including
Shapiro (2005), Stephens (2003), and Stephens and Unayama (2008) reveal that recipients of
infrequent payments do not smooth their consumption but instead exhibit short-run
impatience. These recipients also typically do not have access to savings or credit.
Shapiro (2005) shows that the consumption behavior of food stamp recipients is
consistent with their following a quasi-hyperbolic model, and not an exponential model, of
intertemporal choice. In the data he analyzes and uses to calibrate this model, levels of
caloric intake fall, and the marginal utility of consumption appears to increase over the course
of monthly welfare payment cycles. Recipients report missing meals because they have
exhausted their food stamp payments. In the quasi-hyperbolic model, recipients would be 3 Garmaise and Moskowitz (2006) show that weak credit conditions increase crime more generally.

6
better off and less likely to face dire circumstances at the end of the month if they were
somehow forced to smooth their consumption.
Short-run impatience generates circumstances that are likely to cause crime rates to
increase as time passes in monthly welfare payment cycles. In jurisdictions where all welfare
payments occur at the beginning of the month, individuals who are welfare recipients or who
transact with or receive support from a recipient are likely to have sufficient resources at the
start of the month for their consumption needs and for engaging in activities that incapacitate
them from committing crimes. However, such individuals may not have sufficient resources
later in the monthly payment cycle and may turn to crime to augment their welfare related
income. Frameworks that account for short-run impatience, like the one developed in
O’Dononhue and Rabin (1999), imply that such individuals will delay criminal activity even
if they anticipate a cash shortfall at the time of the payment and plan to make up this shortfall
with criminal income. This is because criminal activity has immediate costs; it requires effort
and potentially results in punishment.
Self-control problems would not affect patterns in consumption or crime if people
learned to control them, but there is little evidence that this is the case. DellaVigna and
Malmendier (2006) find that gym members frequently renew monthly contracts even though
they would pay less per visit if they paid on a daily basis. Choi, Laibson, Madrian, and
Metrick (2006) find positive but small effects of financial education on savings decisions.
Self-control problems seem to persist.
Although previous work finds compelling evidence of short-run impatience among
welfare recipients, it is noteworthy that even an individual who receives support from welfare
payments and does not exhibit short-run impatience may be more likely to engage in criminal
7
activity later during monthly welfare payment cycles. He may have very low income, a high
marginal utility of consumption, no savings or access to credit, and face uncertainty about the
extent to which he will face a cash shortfall. He may, for example, face unexpected shocks to
the prices of the goods he consumes. Given this uncertainty, he would be likely to delay
criminal activity until it is necessary.
These considerations imply predictions for temporal patterns in crime in different
kinds of cities. In cities where payments from welfare programs are focused at the beginning
of the month, criminal activity should increase as the time since payments occurred increases.
Increased criminal activity should reflect increases in types of crime that have a financial
motivation, not other kinds of crime. In cities where welfare programs make payments to
different recipients on different days over longer time periods or where payments to
individuals occur more frequently than once a month, there should not be any significant
monthly temporal pattern in crime.
This discussion has stressed the effect of the timing of welfare payments on the
demand for criminal income. It is worth considering briefly the potential effects of the timing
of payments on the supply of victims. If all welfare payments occurred at a particular point in
time during the month, this might increase the pool of potential victims and the attractiveness
and ease of stealing property. Crime rates could then be higher immediately following
payments. However, most welfare payments are distributed onto electronic benefit transfer
cards, and the funds on these cards are difficult to steal because recipients must present a valid
identification card to use them. Therefore, the timing of disbursement is unlikely to have a
large effect on the supply of potential victims.

8
Potential victims of crime might respond to changes in the demand for criminal
income by taking avoidance measures. For example, potential victims of burglary or robbery
could remain ensconced in their locked homes during periods when such crimes are expected
to be more common. However, most avoidance activities are costly so any response by
potential victims to changes in the demand for criminal income is likely to be incomplete.
3. Data and Tests
The basic empirical approach is to study differences in criminal activity over the
course of monthly welfare payment cycles in cities across which there is variation in the
timing of payments. This analysis requires information on welfare payments by jurisdiction
and detailed crime data.
3.1 Data on Welfare Programs
The three primary welfare programs that provide income maintenance benefits are the
Food Stamp Program, the TANF Program, and the SSI Program.4 Each of these programs
provides assistance to poor households that meet income and resource requirements. The
Food Stamp Program provides funds that can be used at most grocery stores, and the TANF
Program provides income maintenance payments to needy families. In most states, both of
these programs distribute payments electronically through electronic benefit transfer debit
cards, and payments that are not spent in a particular month are carried forward to the next
month. SSI pays benefits to adults and children who have limited means and are physically or
mentally disabled. SSI payments are made once a month by check or direct deposit, with
4 There are other smaller programs that provide income maintenance payments to the poor. For example, general assistance programs exist in some jurisdictions in the U.S., but these are not federally funded and at the national level comprise less than 5% of the payments made by the three programs that are considered in my analysis.
9
each means of distribution comprising half of the total. The Food Stamp Program has the
broadest coverage in the sense that TANF and SSI recipients typically meet the eligibility
requirements to receive food stamps. Because of its extensive coverage, I select a sample of
cities on the basis of participation in the Food Stamp Program.
Quantifiable effects of the timing of welfare payments on crime are more likely to be
observed in jurisdictions where a substantial share of the population receives such payments.
Fellowes and Berube (2005) compute Food Stamp Program participation rates in major
metropolitan areas and counties. On the basis of their study, I select those jurisdictions in
which at least 10% of the population participates in the Food Stamp Program. This screen
yields a sample of 15 cities including Baltimore, MD; Detroit, MI; El Paso, TX; Fresno, CA;
McAllen-Edinburg-Mission, TX; Memphis, TN; Miami, FL; Milwaukee, WI; New Orleans,
LA; New York, NY; Newark, NJ; Philadelphia, PA; Providence, RI; St. Louis, MO; and
Washington, DC. As explained below, data on reported incidents of crime are not available
for Memphis, New York, and McAllen-Edinburg-Mission, so the final sample includes 12
cities.
Panels A and B of Table 1 provide information on the use of the three main welfare
programs in each city in the sample. For comparability with the data on the Food Stamp
Program which are drawn from Fellowes and Berube (2005), the data on TANF and SSI
Programs cover the year 1999.5 On average across cities, the Food Stamp Program serves
about twice as many people as TANF Programs and more than three times as many people as
SSI. The value of TANF Program payments and SSI Program payments often exceed the
5 Data on the value of family assistance and SSI Program payments are taken from the Bureau of Economic Analysis Local Area Personal Income Database. Numbers of family assistance recipients are obtained from the offices of state TANF directors. Data on the number of SSI recipients for counties are from SSI Recipients by State and County, and for MSAs they are drawn from the State and Metropolitan Area Databook 1997-1998.

10
value of food stamp payments, implying higher payments per recipient. However, relative to
TANF and SSI, food stamps have become a more significant source of income over the 1999-
2005 period. Foley (2008) reports that, averaged across cities, the compound annual growth
rate in the value of food stamps over this period is 8.2% while the rates for TANF and SSI are
-0.7% and 2.3%, respectively.
Panel C of Table 1 provides information about the timing of payments for each
program in each city. Payment schedules are set at the state and federal level, not the city
level, and they have not changed substantially over the last decade. In most jurisdictions,
each of the three programs makes payments to recipients once a month.6 In some
jurisdictions, food stamp and TANF payments occur during certain time periods. For
example, in Fresno, food stamps are paid over the first ten days of the month, with the date of
distribution depending on the last digit of the recipient’s case number. TANF payments occur
twice per month in three of the cities in the sample.
Interviews with welfare program managers suggest several common considerations
were important in setting payment schedules.7 Legal requirements, historical precedent, and
budget processes played a role in decisions to make a single monthly payment early in the
month. Federal law requires that food stamp payments and SSI payments occur in monthly
allotments. Historically, payments occurred by mail in the form of a check. This method
entailed delivery costs that were not insignificant, creating an incentive to make TANF
payments only once a month as well. Managers of many programs seem to have somewhat
6 Cole and Lee (2005) identify the dates on which food stamp disbursements occur. I confirmed these dates and obtained data on the timing of TANF payments from the divisions of state and local governments that oversee this program. The Social Security Administration provided information on the timing of SSI payments. 7 Information on how payment schedule were set was gathered by interviewing approximately 15 program managers. For many programs in many jurisdictions, decisions regarding payment schedules are long standing, and there is no documentation on how decisions were made. Therefore it is difficult to pin point rationales, but the interviews suggest several common considerations were important.

11
arbitrarily decided to provide recipients with payments for each calendar month at the
beginning of the month. Some managers explain that such a payment schedule was simply
carried over when methods of payment changed. The timing of payments to recipients was
also often set to follow monthly budget and funding practices. Welfare program budgets are
often set on a monthly basis. Some managers asserted that the most straight forward way of
matching expenses to funding levels is to make payments intended to cover the next month
once a month at the beginning of the month.
Managers of programs that make payments twice a month or stagger payments across
recipients say that such schedules were selected because of a desire to help recipients manage
their money, requests from retailers, and considerations related to information technology
systems and program support services. Bimonthly payments were in part designed to help
recipients manage their resources. In some cases, retailers, especially grocers, asked that
payments be staggered across a set of delivery dates in order to reduce monthly fluctuations in
demand. These motivations for smoothing payouts indicate that some program managers are
aware of the consumption behavior of welfare recipients documented in the literature.
Managers also stagger payments in some cases in order to facilitate the administration of
certain aspects of their programs. They can better respond to recipient queries if payments are
staggered because payments trigger queries, and these are easier to handle if they do not all
occur around the same time. Some information technology systems can also process claims
more efficiently if these claims are not all handled at once.
Thus, welfare payment schedules do not seem to have been set in a way that might
misconstrue the impact of consumption patterns and liquidity constraints on crime. None of

12
the program managers interviewed cited scheduling motivations that would correlate with
crime other than concerns about how recipient manage their money.
3.2 Data on Criminal Activity
Conducting tests on the effects of the timing of welfare payments on crime across
jurisdictions also requires detailed data on reported incidents of crime. Unfortunately,
comprehensive incident data for the cities with large welfare populations are not available in
NIBRS; NIBRS only covers jurisdictions that have agreed to provide data, and very few large
cities have done so. Therefore, obtaining these data required directly contacting police
departments. In order to ensure the comparability of data across jurisdictions, I attempted to
obtain data covering the 2004-2006 period on each incident that is classified as a Part I UCR
offense or a Group A NIBRS offense. These categories of crime include arson, assault
offenses, burglary, forcible sex offenses, homicide, larceny-theft, motor vehicle theft, and
robbery. I requested information about the type, date, time, and the location of each incident.
12 of the 15 jurisdictions identified above provided useable data.8 Table 2 provides a
description of the crime data obtained from each of the cities included in the sample. All of
the cities except Detroit used the UCR reporting system. Although I attempted to obtain
complete data covering the 2004-2006 period from each jurisdiction, detailed data from some
cities are only available for portions of this timeframe, as indicated in Table 2.9
8 The three cities that did not provide data are Memphis, New York, and the McAllen-Edinburg-Mission MSA. Police officers in Memphis and New York denied my requests for data and rejected my appeals of their denials. McAllen-Edinburg-Mission is not a single city but is a collection of three cities so I excluded it. 9 In several jurisdictions, changes to computer systems prevented departments from providing me with data for the full sample period. Certain kinds of crime are also not included in the data for some cities. For example, arson is not covered in the sample for six cities. In some jurisdictions, this type of crime is collected and aggregated by the fire department and not the police department.

13
3.3 The Tests
The empirical tests consider two measures of crime—crime rates and counts of
reported incidents of crime. Crime rates are computed by taking the number of reported
incidents of crime on a particular day in a particular city and dividing that number by the
sample period average number of daily reported incidents in the city.10 OLS specifications
are used to analyze crime rates, and negative binomial specifications are used to analyze
counts of reported incidents.
Variation in the timing of payments allows me to conduct two kinds of tests. The first
is transparent but somewhat crude. It distinguishes between cities in which food stamp
payments are distributed in the first 10 days of the month, and those in which payments are
more staggered. Food stamp payments occur early in the month in Detroit, Fresno, Newark,
Philadelphia, Providence, and Washington, and I refer to this sample as the Early Payment
Sample. Food stamp payments are more staggered in the month in Baltimore, El Paso,
Miami, Milwaukee, New Orleans, and St. Louis, and I refer to this sample as the Staggered
Payment Sample. Tests explaining levels of crime include a dummy that is equal to one in the
first 10 days of the month and otherwise equal to zero as well as an interaction between this
dummy and a dummy that is equal to one for the Staggered Payment Sample and zero for the
Early Payment Sample. The coefficient on the time specific dummy reveals if criminal
activity is lower in the early part of the month in cities where welfare payments are focused at
the start of the month, and the coefficient on this variable interacted with the Staggered
Payment Dummy reveals if temporal patterns in crime are different in cities where payments
are more staggered.
10 Jacob, Lefgren, and Morretti (2007) use a similar approach to measure weekly crime rates.

14
Information on the magnitude and timing of TANF payments and SSI payments raises
a concern about distinguishing among cities on the basis of the timing of food stamp
payments alone. As indicated in Panel C of Table 1, SSI payments occur on the 1st of the
month in all jurisdictions. TANF Programs make payments twice a month in Detroit,
Philadelphia, and Providence, which are all in the Early Payment Sample, and these payments
are made on the 1st of the month in Milwaukee, which is classified as part of the staggered
payment sample. In robustness checks, I remove observations from Detroit, Philadelphia,
Providence, and Milwaukee from the data, leaving a set of cities for which the classification
based on the timing of food stamp payments is less subject to concern.
The second type of test employs an index that reflects the number of days that have
passed since recipients received their last welfare payment in a particular city. It is computed
using the information on the number of welfare recipients and the dates of payments. All
three of the major welfare programs are taken into account. For programs that make
payments over a period of days within a month, I assume that an equal number of recipients
receive payments on each of the days within the period. For each program on each calendar
day, I compute the average number of days that have passed since recipients received their
last payment. For example, if food stamp payments occur on the first and second day of the
month, on the fourth day of the month this average is two and a half days. I then take a
weighted average of these program-specific measures where weights are set equal to the
number of total recipients in each program.11 The weighted average is divided by 30 to create
an index that takes on values between zero and one. In the extreme case that all welfare
recipients received a payment from each program on the 1st of the month, the index would be
11 Similar indices and results are obtained if the values of program payments are used as weights.

15
zero on that day, and if no additional payments occurred over the course of the month, the
index would be equal to one on the last day of months with 31 days.
To provide further intuition for this index, Figure 1 displays values of the index by the
day of the month for Providence and St. Louis. In Providence, food stamp and SSI payments
occur only once a month on the 1st of the month, and TANF payments occur twice a month on
the 1st and 16th. Therefore, the index for Providence is zero on the 1st of the month. It
increases over the course of the month and drops down on the 16th to reflect the fact that
TANF recipients receive a payment at that time. In St. Louis, SSI payments occur on the 1st
of the month, but food stamp payments are distributed over the first 22 days of the month, and
TANF payments are distributed over the first 4 days of the month, with different recipients
receiving payment on different days. As a consequence, there is less variation in the index for
St. Louis than there is for Providence, and it is fairly level over the first 22 days of the month
before increasing. One benefit of using this index in specifications that identify patterns in
criminal activity is that it allows for the use of fixed effects for each calendar day of the
month.
By identifying effects of the timing of welfare program payments off of differences in
payment schedules across cities, the tests rule out explanations for temporal patterns in crime
that are unrelated to welfare payments but that are related to factors that are likely to be
operative in all the cities in the sample. For example, rents are typically due at the start of the
month, and these payments could induce criminal activity at the end of the month. Paychecks
from legitimate employment are also often issued once or twice a month. Differences in
temporal patterns of crime across cities where the timing of welfare payments differs are not

16
consistent with alternative explanations for an increase in crime throughout the month based
on these kinds of considerations.
The tests are performed for different types of crime. The main hypothesis makes
predictions about the timing of crimes in which perpetrators are likely to have a direct
financial motivation. I refer to burglary, larceny-theft, motor vehicle theft, and robbery as
financially motivated crimes. I refer to other Type I or Group A crimes as other crimes, and
they include arson, assault offenses, forcible sex offenses, and homicide.12
Some factors would give rise to the same temporal patterns for both types of crime.
Police officers may have an incentive to document incidents as occurring at a particular time,
perhaps the beginning or end of the month. If the deployment of law enforcement resources
varies through the month, criminals of all types might time their activity so as to minimize the
chances of arrest. Criminals might also benefit from conspiring to commit more of all types
of crimes at a particular point in time because limited enforcement resources could be more
easily evaded. Under each of these scenarios, financially motivated crimes and other types of
crime would exhibit similar temporal patterns. However, if patterns in crime reflect the
timing of welfare payments, then only financially motivated crimes should become more
prevalent over the course of welfare payment cycles in jurisdictions where payments are
focused at the beginning of these cycles.
In keeping with the analysis of patterns in crime presented in papers like Jacob,
Lefgren, and Morretti (2007) and Jacob and Lefgren (2003), the analysis below controls for 12 This distinction is not perfect. For some incidents, a criminal commits more than one offense, and these incidents are typically classified according to the most serious offense in the data according to a hierarchy established by the Federal Bureau of Investigation. For example, if a criminal robs and then kills his victim, this incident is typically classified as a homicide. Therefore, some incidents that are classified as other crimes may have financial motivations. It is noteworthy that the crime data do not cover the possession and sale of illegal drugs. Evidence presented in Dobkin and Puller (2007) suggests that this kind of activity occurs most frequently soon after the distribution of government transfer payments, when drug users have the resources to increase their consumption.

17
the effects of weather and holidays on crime. Daily data on the average temperature in
degrees Fahrenheit, inches of precipitation, and inches of snowfall are obtained from the
National Climatic Data Center.13 Days that are U.S. federal holidays are identified as
holidays. Table 3 provides descriptive statistics for the variables used in the analysis.
The nature of the data and tests raise two issues regarding the calculation of standard
errors in regression analysis. First, there could be serial correlation across observations for a
city over the course of each month. In order to address this possibility, the tables present
standard errors that are computed using a block bootstrap technique in which city-month
blocks are used for resampling. Second, it is also conceivable that observed patterns in crime
within a city are similar over the course of the month for different months. To consider the
potential impact of this issue, unreported analysis collapses that data to the city level and
compares average crime rates in the first 10 days of the month and the remainder of the month
across cities in the Early Payment Sample and the Staggered Payment Sample. The results of
this analysis and the statistical significance of those results are not substantially different from
the results presented in Tables 4-6.14
4. Results
Figure 2 presents crime rates, averaged over three day intervals, for the Early Payment
Sample and the Staggered Payment Sample. Daily crime rates are computed for each city and
type of crime by dividing the count of reported incidents by the sample period average
number of reported incidents in the city. Panel A displays rates for all crimes. The solid line
with diamond markers indicates how rates change over the course of the month in cities in the
13 For each city, weather measurements are taken from the airport station nearest to the city and missing data are augmented with data from other nearby stations. 14 Results are available from the author upon request.

18
Early Payment Sample. In the cities in this sample, the overall crime rate is above average in
the middle of the month, and it falls at the beginning of the month. It reaches its lowest point,
0.97, at the start of the month and then increases to about 1.01 over the next two weeks,
implying an increase of about 4%. Panel B and C respectively show crime rates for
financially motivated crimes and other crimes. In cities in the Early Payment Sample, there is
a pronounced monthly cycle in the rate of financially motivated crimes but no discernable
trend in other crimes. Financially motivated crime rates increase from around 0.96 at the
beginning of the month to more than 1.02, indicating an increase of about 6%.
The dotted lines with square markers indicate how crime rates change over the course
of the month for cities in the Staggered Payment Sample. In this sample, there is no apparent
trend in overall crime, financially motivated crime, or other crime over the course of the
month. These patterns in Figure 2 are consistent with the theory that welfare beneficiaries
exhaust their welfare related income soon after receiving it and then attempt to augment their
income with income from criminal activity later in the month.
Table 4 presents the results of specifications that analyze patterns in total reported
incidents of Type I or Group A crimes. The dependent variable studied in the OLS
specifications in columns 1-4 is the crime rate, which is defined as the number of reported
incidents in a city on a particular date divided by average daily reported incidents in the city.
Each specification in Table 4 includes two kinds of fixed effects. City*Month*Year fixed
effects control for differences across cities even if these vary month to month. For example,
these fixed effects control for local election cycles that have been shown by Levitt (1997) to
affect the size of police forces. City*Day of Week fixed effects control for differences in
criminal activity across days of the week in individual cities. Standard errors appear in

19
parentheses, and they are computed using a block bootstrap technique in which city-month
blocks are used for sampling.
The coefficients on Dummy for 1st-10th are negative and significant in columns 1 and
2. The -0.0318 coefficient in column 2 implies that the crime rate is 3.2% below average
during the first ten days of the month in cities where welfare payments are focused in the
beginning of the month. The coefficients on the Staggered Payment Dummy interacted with
the Dummy for 1st-10th are positive and significant and of slightly smaller magnitude than the
coefficients on the Dummy for 1st-10th. A Wald test reveals that the sum of the coefficients
on Dummy for 1st-10th and on the interaction terms for each specification is not statistically
distinguishable from zero. These results also indicate that there are no discernable monthly
patterns in reported incidents of crime in cities in the Staggered Payment Sample. Factors
that are operative in both the Early Payment Sample and the Staggered Payment Sample do
not explain increases in crime in the Early Payment Sample.
The specification in column 2 includes controls for weather and a dummy that is equal
to one on holidays and zero otherwise. Consistent with previous work, crime appears to
increase as temperatures rise and decrease with precipitation and snowfall. Crime rates are
also lower on holidays.
The specifications presented in columns 3 and 4 are similar to those in columns 1 and
2, but they use the Time Since Payment Index to identify the effects of the timing of welfare
payments, and they also include a fixed effect for each calendar day of the month. These
specifications identify the effect of the timing of payments off of differences in how the index
changes over the course of the month across cities. The results indicate that crime rates
increase with the amount of time that has passed since welfare payments occurred. The

20
0.1201 coefficient on the Time Since Payment Index in column 4 implies that, in the extreme
case in which all welfare payments occurred on the 1st of the month, crime rates would be
12.0% higher on the 31st of the month relative to the 1st of the month. A one standard
deviation increase in the Time Since Payment Index is associated with a 2.2% increase in the
overall crime rate.15 Columns 5-8 of Table 4 contain results of negative binomial
specifications that analyze counts of reported incidents as opposed to crime rates. The results
in the specifications are very similar to those in columns 1-4.
The timing of welfare payments is hypothesized to affect crimes in which perpetrators
have a direct financial motivation and not necessarily other kinds of crime. The specifications
in Table 5 analyze crimes that are likely to have financial motives. The specifications in this
table are the same as those presented in Table 4 except the dependent variables analyzed are
the rate of financially motivated crime in columns 1-4 and the count of reported incidents of
financially motivated crime in columns 5-8. As in Table 4, the coefficients on the Dummy for
1st-10th are negative and significant, and the coefficients on this dummy interacted with the
Staggered Payment Dummy are positive and significant. These results indicate that there are
increases in financially motivated crimes in cities where welfare payments are focused at the
beginning of the month. In cities where welfare payments are more staggered, increases are
less pronounced and do not differ statistically from the null of there being no temporal trend.
The coefficients on the Time Since Payment Index are also positive and significant.
The effects of the timing of welfare payments on financially motivated crimes appear
to be more pronounced than its effects on total crime. The -0.0378 coefficient on the Dummy
for 1st-10th in column 2 implies that, in the Early Payment Sample, the financially motivated
15 If increases in criminal activity were focused among welfare beneficiaries, and these beneficiaries committed only a fraction of crimes, then increases in crime among this population would be larger than the aggregate results indicate.

21
crime rate is 3.8% (as opposed to 3.2% for all crimes) lower in the first 10 days of the month
than it is over the rest of the month. The 0.1408 coefficient on the Time Since Payment Index
in column 4 indicates that in the extreme case that all welfare payments occurred on the 1st of
the month, the financially motivated crime rate would be 14.1% (as opposed to 12.0% for all
crimes) higher on the 31st of the month relative to the 1st.
If patterns in crime were attributable to reporting biases or effects of police
deployment that are similar across different types of crime, then the data would indicate an
increase in crimes other than financially motivated crimes over the course of welfare payment
cycles as well. The hypothesis that patterns in crime reflect income needs that arise during
welfare payment cycles does not make this prediction. Table 6 presents results of
specifications that test for temporal trends in other crimes. The results do not indicate any
statistically significant relations between the timing of welfare payments and other crimes.
The coefficients on the Dummy for 1st-10th are positive, and they are insignificant and of
much smaller magnitude than the coefficients on this variable in the specifications that
explain financially motivated crimes presented in Table 5. The coefficients on Dummy for
1st-10th are statistically significantly lower in specifications explaining financially motivated
crimes than in specifications explaining other crimes. This implies that, in the Early Payment
Sample, crime rates for financially motivated crimes are significantly lower in the first ten
days of the month than crime rates for other crimes. The coefficients on the Time Since
Payment Index are all also insignificant, and they are very small in magnitude in columns 7
and 8. These results suggest that explanations for patterns in crime over monthly welfare
payment cycles that do not differentiate between financially motivated and other crimes are
incomplete.

22
Table 7 displays analysis of financially motivated crimes by type of crime. The
specifications are the same as those presented in columns 7 and 8 of Table 5, but the
dependent variable is the count of reported burglaries in columns 1 and 2, larceny-thefts in
columns 3 and 4, motor vehicle thefts in columns 5 and 6, and robberies in columns 7 and 8.
The Time Since Payment Index attracts a positive coefficient in each specification. These
coefficients are insignificant in the burglary specifications. This could reflect the fact that
burglars often study potential targets before deciding to enter them and typically attempt to
commit their crimes when properties are unoccupied.16 Therefore, this type of crime may be
less motivated by short-run liquidity needs than other kinds of financially motivated crimes.
The coefficients on the Time Since Payment Index in the specifications explaining
patterns in larceny-theft are similar in magnitude to those estimated in the specifications
explaining patterns in burglary, but they are more precisely estimated. These coefficients, and
those on the index in the specifications that analyze the incidence of motor vehicle theft and
robbery, are all statistically significant. The implied effect of the timing of welfare payments
is particularly pronounced for robbery. The 0.2512 coefficient on the Time Since Payment
Index in column 8 implies that robbery rates are 25.1% higher on the 31st of the month
relative to the 1st of the month in the extreme case of a jurisdiction where all welfare
payments occurred on the 1st of the month. Individuals who have exhausted their welfare
related income need liquid assets, and robbery is more likely to yield cash than burglary,
larceny-theft, and motor vehicle theft, each of which typically involve stealing other types of
property.
The specifications presented in Tables 4-7 test for a linear relation between crime rates
and the Time Since Payment Index. However, the patterns in Figure 2 suggest that the 16 Weisel (2002) and Clarke (2002) provide descriptive information about burglary.

23
increase in criminal activity in the Early Payment Sample primarily occurs early in the month
and that criminal activity recedes at the end of the month. Less parametric tests that include
indicators set equal to one for 0.1 increments of the Time Since Payment Index shed
additional light on the exact timing of the estimated effects. Table 8 presents the results of
tests that are similar to those presented in columns 7 and 8 of Tables 5 and 6, replacing the
index with indicators. The indicator for values of the Time Since Payment Index between 0
and 0.1 is omitted from the specifications, so the other indicators measure the incidence of
crime relative to periods that have these low index values.
The specifications in the first two columns explain the count of financially motivated
crimes. In column 2, the coefficient on the indicator for values of the Time Since Payment
Index that are larger than 0.1 and less than or equal to 0.2 is equal to 0.0716, and it is
statistically significant, suggesting an increase in the crime rate soon after payments occur.
The coefficients on the indicators increase as the Time Since Payment Index increases,
reaching a value of 0.1254 for index values between 0.7 and 0.8. F-tests reveal that this
coefficient is statistically different from each of the coefficients on the indicators for values of
the Time Since Payment Index less than or equal to 0.6. Therefore, financially motivated
crime is increasing for a fairly large range of index values, suggesting that the raw patterns in
Figure 2 are a bit misleading.
The results in columns 1 and 2 also indicate that financially motivated crime recedes
for very high values of the Time Since Payment Index. In column 2, the coefficient on the
indicator for values of the index that are greater than 0.9 and less than or equal to 1 is 0.0733,
and a F-test reveals that this coefficient is smaller than the 0.1254 coefficient for index values
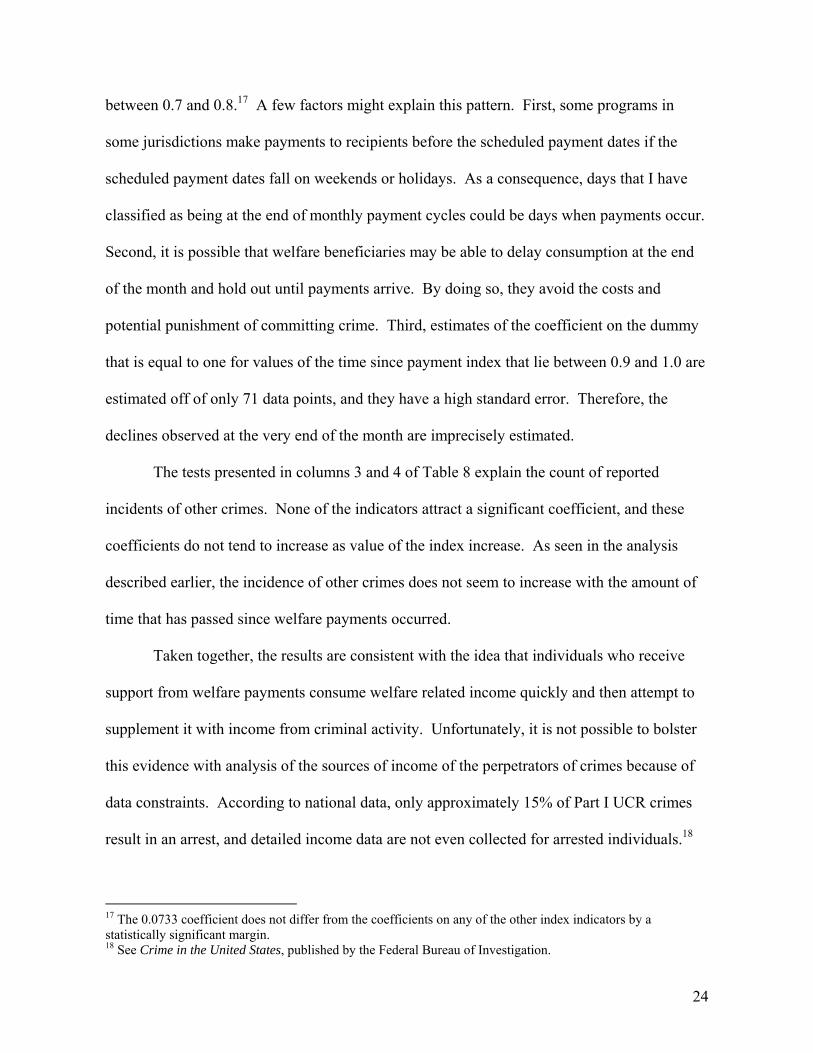
24
between 0.7 and 0.8.17 A few factors might explain this pattern. First, some programs in
some jurisdictions make payments to recipients before the scheduled payment dates if the
scheduled payment dates fall on weekends or holidays. As a consequence, days that I have
classified as being at the end of monthly payment cycles could be days when payments occur.
Second, it is possible that welfare beneficiaries may be able to delay consumption at the end
of the month and hold out until payments arrive. By doing so, they avoid the costs and
potential punishment of committing crime. Third, estimates of the coefficient on the dummy
that is equal to one for values of the time since payment index that lie between 0.9 and 1.0 are
estimated off of only 71 data points, and they have a high standard error. Therefore, the
declines observed at the very end of the month are imprecisely estimated.
The tests presented in columns 3 and 4 of Table 8 explain the count of reported
incidents of other crimes. None of the indicators attract a significant coefficient, and these
coefficients do not tend to increase as value of the index increase. As seen in the analysis
described earlier, the incidence of other crimes does not seem to increase with the amount of
time that has passed since welfare payments occurred.
Taken together, the results are consistent with the idea that individuals who receive
support from welfare payments consume welfare related income quickly and then attempt to
supplement it with income from criminal activity. Unfortunately, it is not possible to bolster
this evidence with analysis of the sources of income of the perpetrators of crimes because of
data constraints. According to national data, only approximately 15% of Part I UCR crimes
result in an arrest, and detailed income data are not even collected for arrested individuals.18
17 The 0.0733 coefficient does not differ from the coefficients on any of the other index indicators by a statistically significant margin. 18 See Crime in the United States, published by the Federal Bureau of Investigation.

25
Even though detailed income data for perpetrators are not available, it is possible to
compare the demographics of arrested individuals with those who receive support from
welfare payments, and some considerations suggest it is plausible that they are behind
temporal patterns in financially motivated crime. First, the number of individuals directly
receiving welfare payments in a month is much higher than the number of crimes committed
in a month. In the cities in my sample, there are approximately 50 food stamp recipients for
each financially motivated crime in the average month.19 Put differently, if all financially
motivated crimes were committed by recipients of some form of welfare payment, 2% or less
of welfare recipients, depending on the overlap of recipients across welfare programs, would
commit such crimes in a typical month. This level of criminal activity does not seem
implausibly large. Furthermore, unreported results indicate that the timing of welfare
payments appears to have more pronounced effects in jurisdictions where a larger share of the
population receives food stamp payments.20 Specifications like those presented in Tables 4-6
that include not only the Time Since Payment Index, but also this index interacted with the
share of the population receiving food stamps shown in Table 1 yield insignificant
coefficients on the index itself and positive and significant coefficients on the interaction
terms when the dependent variable measures the incidence of all crime or financially
motivated crime. These results imply that the time that has passed since welfare payments
occurred matters more in cities with larger welfare populations.21
19 This figure is computed by dividing the number of food stamp recipients in a typical month as measured in Table I, summed across the sample cities, by the monthly average aggregate number of financially motivated crimes in all the sample cities. 20 These results are available from the author upon request. 21 It is important to be cautious in interpreting this result because the sample does not include cities in which a small share of the population receives welfare payments. If a larger share of the crimes in such jurisdictions were committed by welfare beneficiaries, temporal patterns in crime could still reflect welfare payment schedules.

26
The results also seem plausible given that the income profile of criminals is similar to
the income profile of welfare recipients. Harlow (1998 and 2000) presents the results of
surveys of jail inmates and finds that individuals who are in jail for committing financially
motivated crimes report very low pre-arrest levels of monthly income and that more than 75%
of them qualify for and receive public counsel.
However, there are notable gender and age differences between criminals and direct
welfare recipients. During the sample period at the national level, 59% of food stamp
recipients, 57% of SSI recipients, and 60% of TANF recipients were female, but only 30% of
individuals arrested for financially motivated crimes were female. Furthermore, a large
fraction of the males who received TANF benefits were young children. However, Hays
(2003), Venkatesh (2006) and other studies point out that a large fraction of females who
receive welfare payments live with and pool their resources with men, often without reporting
these relationships to welfare providers. These studies also point out that welfare recipients
are economically embedded in their local communities. Therefore payments to women are
also likely to generate cycles in resources for other low income individuals who benefit from
welfare indirectly.
Additional tests indicate that the results are robust to several concerns.22 As
mentioned in Section II, the distinction between the Early Payment Sample and the Staggered
Payment Sample is imperfect. This distinction is based on the timing of food stamp
payments. In order to confirm that results of tests that use the Dummy for the 1st-10th are
robust to using a more strictly defined sample, I drop Detroit, Philadelphia, Providence, and
Milwaukee, from the sample. These are cities in which either food stamp payments are
focused at the beginning of the month but TANF payments are more staggered or food stamp 22 The results of these robustness tests appear in Foley (2008).

27
payments are staggered but TANF payments are focused at the beginning of the month. The
results are not materially different from those presented in the tables.
Two other robustness checks are worth noting. First, measurement error or reporting
biases could give rise to an excessive number of reported incidents on the first or last day of
the month. For example, if there is a delay between when a crime occurs and when it is
discovered or reported, there may be an incentive to report the crime on the first or last day of
the month so it is included in crime statistics for that month. The results are little changed by
dropping observations from the first and last day of each month. The results are also robust to
dropping New Orleans from the sample. The New Orleans data only cover 2006, and
conflating factors related to the aftermath of hurricane Katrina could affect patterns of crime.
5. Conclusion
Analysis of patterns in crime in 12 large U.S. cities where more than 10% of the
population receives food stamps shows that criminal activity is increasing in the amount of
time that has passed since welfare payments occurred. The increase reflects an increase in
crimes in which the perpetrator is likely to have a financial motivation and not other types of
Part I UCR or Group A NIBRS offenses. Temporal patterns in crime are not observed in
jurisdictions where welfare payments are relatively more staggered. These results indicate
that individuals who receive support from welfare payments consume welfare related income
quickly and then attempt to supplement it with income from criminal activity.
The findings point out a role for behavioral considerations in economic explanations
of crime. Existing research shows that welfare recipients exhibit short-run impatience and do

28
not smooth their consumption of welfare income. This type of consumption behavior is
associated with increased criminal activity later in monthly welfare payment cycles.
The results also carry implications for the design of welfare programs. Increasing the
frequency of welfare payments would smooth patterns in crime. The leveling of criminal
activity would make communities safer because police departments would not become
overwhelmed by cyclical spikes. Under certain assumptions, frequent payments could also
lower crime rates. If welfare beneficiaries follow a quasi-hyperbolic model of intertemporal
choice, frequent payments would make them better off by forcing them to smooth their
consumption. Such payments would reduce the extent to which they face dire circumstances
because they consumed welfare related income too quickly. As a result, circumstances that
would be likely to induce criminal activity would be less common. Nearly all jurisdictions
now distribute food stamp and TANF payments on electronic benefit transfer debit cards, so
the costs of more frequent payments would be likely to be low. Shaprio (2005), Wilde and
Ranney (2000), and Ohls, Fraker, Martini, and Ponza (1992) also point out benefits of more
frequent payments. Such changes would require legislative action because the law currently
requires that food stamp and SSI payments be made in monthly allotments.
Finally, the findings have implications for the deployment of police officers and the
labor laws applicable to law enforcement. In jurisdictions where welfare payments are
focused at the beginning of the month, increased levels of criminal activity at the end of the
month call for increased police protection during this time. However, 1986 amendments to
the Fair Labor Standards Act require that law enforcement officers be compensated with
overtime pay for working more than 40 hours a week. As a consequence, it is costly for

29
departments to shift resources to times when they are particularly needed. More flexible labor
laws could help police departments alter deployment schedules to prevent and combat crime.

30
References
Adams, William, Liran Einav, and Jonathan Levin, 2009, Liquidity Constraints and Imperfect Information in Subprime Lending, American Economic Review 99:1, pp. 49-84.
Angeletos, George-Marios, David Laibson, Andrea Repetto, Jeremy Tobacman, and Stephen
Weinberg, 2001, The Hyperbolic Consumption Model: Calibration, Simulation, and Empirical Evaluation, Journal of Economic Perspectives 15:3, pp. 47-68.
Barr, Michael, 2004, Banking the Poor, Yale Journal of Regulation 21, pp. 121-237. Blank, Rebecca M., 2002, Evaluating Welfare Reform in the United States, Journal of
Economic Literature 40:4, pp. 1105-1166. Becker, Gary S., 1968, Crime and Punishment: An Economic Approach, Journal of Political
Economy 76:2, pp. 169-217. Bertrand, Marianne, Sendhil Mullainathan, and Eldar Shafir, 2004, A Behavior Economics
View of Poverty, American Economic Review 94:2, pp. 419-423. Beverly, Sondra, Daniel Shneider, and Peter Tufano, 2006, Splitting Tax Refunds and
Building Savings: An Empirical Test, Tax Policy and the Economy 20, pp. 111-161. Burek, Melissa, 2005, Now Serving Part Two Crimes: Testing the Relationship between
Welfare Spending and Property Crimes, Criminal Justice Policy Review 16:3, pp. 360-384.
Campbell, John, 2006, Household Finance, Journal of Finance 61, pp. 1553-1604. Choi, James J., David Laibson, and Brigette C. Madrian, 2006, Are Empowerment and
Education Enough? Underdiversification in 401(k) Plans, Brookings Papers on Economic Activity 2, pp. 151-198.
Clarke, Ronald V., 2002, Burglary of Retail Establishments, U.S. Department of Justice,
Office of Community Oriented Policing Services. Cole, Nancy and Ellie Lee, 2005, An Analysis of EBT Benefit Redemption Patterns: Methods
for Obtaining, Preparing, and Analyzing the Data, Abt Associates, Inc. DeFranzo, James, 1996, Welfare and Burglary, Crime and Delinquency 42, pp 223-229. DeFranzo, James, 1997, Welfare and Homicide, Journal of Research in Crime and
Delinquency 34, pp. 395-406. DellaVigna, Stefano, and Ulrike Malmendier, 2006, Paying Not to Go to the Gym, American
Economic Review 96:3, pp. 694-719.

31
Dobkin, Carlos and Stephen Puller, 2007, The Effects of Government Transfers on Monthly
Cycles in Drug Abuse, Hospitalization, and Mortality, Journal of Public Economics 91:11-12, pp. 2137-2157.
Donohue, John, and Steven Levitt, 2001, The Impact of Legalized Abortion on Crime,
Quarterly Journal of Economics 116:2, pp. 379-420. Duflo, Esther, William Gale, Jeffrey Liebman, Peter Orszag, and Emmanuel Saez, 2006,
Quarterly Journal of Economics 121:4, pp. 1311-1346. Fellowes, Matt, and Alan Berube, 2005, Leaving Money (and Food) on the Table: Food
Stamp Participation in Major Metropolitan Areas and Counties, The Brookings Institution Survey Series.
Foley, C. Fritz, 2008, Welfare Payments and Crime, NBER Working Paper No. 14074. Freeman, Richard, 1995, The Labor Market, in Crime, James Q. Wilson and Joan Petersilia,
eds., San Francisco: ICS Press, pp. 171-192. Garmaise, Mark, and Tobias Moskowitz, 2006, Bank Mergers and Crime: The Real and
Social Effects of Credit Market Competition, Journal of Finance 61:2, pp. 495-539. Gould, Eric D., Bruce A. Weinberg, and David B. Mustard, 2002, Crime Rates and Local
Labor Market Opportunities in the United States: 1979-1997, Review of Economics and Statistics 84:1, pp. 45-61.
Hannon, Lance, and James DeFranzo, 1998a, Welfare and Property Crime, Justice Quarterly
15, pp. 273-287. Hannon, Lance, and James DeFranzo, 1998b, The Truly Disadvantaged, Public Assistance,
and Crime, Social Problems 45, pp. 432-445. Harlow, Caroline Wolf, 2000, Defense Counsel in Criminal Cases, U.S. Department of
Justice, Office of Justice Programs. Harlow, Caroline Wolf, 1998, Profile of Jail Inmates 1996, U.S. Department of Justice, Office
of Justice Programs. Hays, Sharon, 2003, Flat Broke with Children: Women in the Age of Welfare Reform, New
York: Oxford University Press. Hseih, Chang-Tai, 2003, Do Consumers Respond to Anticipated Income Changes? Evidence
from the Alaska Permanent Fund, American Economic Review 93:1, pp. 397-405.

32
Jacob, Brian, and Lars Lefgren, 2003, Are Idle Hands the Devil’s Workshop? Incapacitation, Concentration, and Juvenile Crime, American Economic Review 93:5, pp. 1560-1577.
Jacob, Brian, Lars Lefgren, and Enrico Morretti, 2007, The Dynamics of Criminal Behavior:
Evidence from Weather Shocks, Journal of Human Resources 42:3, pp. 489-527. Johnson, David S., Jonathan A. Parker, and Nicholas Souleles, 2006, Household Expenditure
and the Income Tax Rebates of 2001, American Economic Review 96:5, pp. 1589-1610. Jolls, Christine, 2007, Behavioral Law and Economics, Yale Law School working paper. Laibson, David, 1997, Golden Eggs and Hyperbolic Discounting, Quarterly Journal of
Economics 112:2, pp. 443-477. Lee, David S., and Justin McCrary, 2005, Crime, Punishment and Myopia, NBER Working
Paper No. 11491. Levitt, Steven D., 1997, Using Electoral Cycles in Police Hiring to Estimate the Effect of
Police on Crime, American Economic Review 87:3, pp. 270-290. Machin, Stephen, and Costas Meghir, 2004, Crime and Economic Incentives, The Journal of
Human Resources 39:4, pp. 958-979. Moffitt, Robert, 1992, Incentive Effects of the U.S. Welfare System, Journal of Economic
Literature 30:1, pp. 1-61. O’Donohue, Ted, and Matthew Rabin, 1999, Doing it Now or Later, American Economic
Review 89:1, pp. 103-124. O’Donohue, Ted, and Matthew Rabin, 2001, Choice and Procrastination, Quarterly Journal
of Economics 116:1, pp. 121-160. Ohls, James C., Thomas M. Fraker, Alberto P. Martini, and Michael Ponza, 1992, The Effect
of Cash-Out on Food Stamp Use by Food Stamp Participants in San Diego, Mathmatica Policy Research, Inc.
Phelps, E. S., and R. A. Pollak, 1968, On Second-Best National Saving and Game-
Equilibrium Growth, Review of Economic Studies 35:2, pp. 185-199. Raphael, Steven, and Rudolf Winter-Ember, 2001, Identifying the Effect of Unemployment
on Crime, Journal of Law and Economics, 44:1, pp. 259-283. Shapiro, Jesse, 2005, Is there a Daily Discount Rate? Evidence from the Food Stamp
Nutrition Cycle, Journal of Public Economics 89:2-3, pp. 303-325.

33
Shapiro, Matthew, and Joel Slemrod, 2003, Consumer Response to Tax Rebates, American Economic Review 93:1, pp. 381-396.
Stephens Jr., Melvin, 2003, “3rd of tha Month”: Do Social Security Recipients Smooth
Consumption between Checks?, American Economic Review 93:1, pp. 406-422. Stephens Jr., Melvin, 2008, The Consumption Response to Predictable Changes in
Discretionary Income: Evidence from the Repayment of Vehicle Loans, Review of Economics and Statistics 90:2, pp. 241-252.
Stephens Jr., Melvin, and Takashi Unayama, 2008, Can Governments Help Smooth
Consumption? Evidence from Japanese Public Pension Benefits, working paper. Venkatesh, Sudhir Alladi, 2006, Off the Books: The Underground Economy of the Urban
Poor, Cambridge, Massachusetts: Harvard University Press. Weisel, Deborah Lynn, 2002, Burglary of Single-Family Homes, U.S. Department of Justice,
Office of Community Oriented Policing Services. Wilde, Park E., and Christine K. Ranney, 2000, The Monthly Food Stamp Cycle: Shopping
Frequency and Food Intake Decisions in an Endogenous Switching Regression Framework, American Journal of Agricultural Economics 82:1, pp. 200-213.

Figure 1: This figure displays the values of the Time Since Payment Index for Providence and St. Louis for each day of the month. The Time Since Payment Index is an index between zero and one that reflects the average number of days that have passed since welfare recipients received their last payment. It accounts for payments related to food stamps, TANF, and SSI. If a program makes payments over a range of dates, it is assumed that an equal number of recipients receives payment on each day in the range. The total number of recipients in each program is used to weight the payment schedules of each program.
0
0.1
0.2
0.3
0.4
0.5
0.6
0.7
0.8
0.9
Tim
e S
ince
Pay
men
t In
dex
0
0.1
0.2
0.3
0.4
0.5
0.6
0.7
0.8
0.9
1 3 5 7 9 11 13 15 17 19 21 23 25 27 29 31
Tim
e S
ince
Pay
men
t In
dex
Day of Month
Providence St. Louis

Panel A: Crime Rate--All Crimes
Panel B: Crime Rate--Financially Motivated Crimes
Figure 2. This figure displays crime rates over the course of the month. Panel A displays rates for all crimes that are classified as Type I crimes in the UCR reporting system and Group A crimes in the NIBRS reporting system. Panel B displays rates for crimes in which the perpetrator is likely to have a direct financial motivation, specifically burglary, larceny-theft, motor vehicle theft, and robbery. Panel C displays rates for other crimes, specifically arson, assault offenses, forcible sex offenses, and homicide. The data points are calculated by taking average crime rates across three day periods for cities in which food stamp payments are focused at the beginning of the month (the Early Payment Sample) and cities in which these payments are more staggered (the Staggered Payment Sample). Crime rates for each city on each day are computed by taking incident counts and dividing by the sample period average number of daily reported incidents in the city.
0.95
0.96
0.97
0.98
0.99
1
1.01
1.02
1.03
1.04
16-18 19-21 22-24 25-27 28-31 1-3 4-6 7-9 10-12 13-15
Crim
e R
ate
1.02
1.03
1.04
Panel C: Crime Rate--Other Crimes
0.95
0.96
0.97
0.98
0.99
1
1.01
1.02
1.03
1.04
16-18 19-21 22-24 25-27 28-31 1-3 4-6 7-9 10-12 13-15
Crim
e R
ate
0.95
0.96
0.97
0.98
0.99
1
1.01
1.02
1.03
1.04
16-18 19-21 22-24 25-27 28-31 1-3 4-6 7-9 10-12 13-15
Crim
e R
ate
0.95
0.96
0.97
0.98
0.99
1
1.01
1.02
1.03
1.04
16-18 19-21 22-24 25-27 28-31 1-3 4-6 7-9 10-12 13-15
Crim
e R
ate
Day of Month
Early Payment Sample Staggered Payment Sample

Panel A: Population and Share of Population Receiving Welfare Payments
City Population Food Stamps TANF SSIEarly Payment SampleDetroit, MI 2,061,162 12.2% 6.3% 3.7%Fresno, CA 799,407 10.2% 7.3% 4.5%Newark, NJ 793,633 11.5% 5.1% 3.2%Philadelphia, PA 1,517,550 17.9% 9.3% 5.4%Providence, RI 621,602 10.0% 6.6% 3.4%Washington, DC 572,059 14.3% 8.5% 3.5%
Staggered Payment SampleBaltimore, MD 651,154 15.3% 7.5% 5.1%El Paso, TX 679,622 16.7% 2.6% 3.1%Miami, FL 2,253,362 11.3% 2.7% 4.8%Milwaukee, WI 940,164 10.6% 3.2% 3.4%New Orleans, LA 1,381,652 12.0% 1.7% 2.0%St. Louis, MO 348,189 22.4% 5.6% 5.3%
Panel B: Value of Welfare Payments
City Food Stamps TANF SSIEarly Payment SampleDetroit, MI 214,368 407,981 394,728Fresno, CA 81,530 183,609 206,600Newark, NJ 92,768 94,436 124,160Philadelphia, PA 264,965 288,589 436,889Providence, RI 43,410 108,703 99,618Washington, DC 81,061 100,401 91,231
Staggered Payment SampleBaltimore, MD 103,252 139,554 162,470El Paso, TX 100,659 30,488 75,551Miami, FL 208,965 143,462 502,810Milwaukee, WI 71,092 165,946 204,177New Orleans, LA 161,504 27,150 89,401St. Louis, MO 70,183 67,542 89,401
Table 1
Welfare Program Details by City
This table provides details about welfare programs in the twelve cities in the sample. Panel A lists city populations and the percent of the population receiving food stamps, TANF payments, and SSI payments. Panel B provides data on the value of payments in thousands of dollars for each of these programs, and Panel C lists the dates in the month on which these payments are distributed. Population data and data on the number of recipients and the value of payments are all for the year 1999, except that the number of SSI recipients in Miami, FL and El Paso, TX are for the year 1995. Data from Detroit, MI cover Wayne County; Fresno, CA Fresno County; Newark, NJ Essex County; Philadelphia, PA Philadelphia County; Providence, RI Providence County; Washington, DC District of Columbia County; Baltimore, MD Baltimore City; El Paso, TX El Paso MSA; Miami, FL Miami MSA; Milwaukee, WI Milwaukee County; New Orleans, LA Orleans Parish; and St. Louis, MO St. Louis County.

Panel C: Delivery Dates of Welfare Payments
City Food Stamps TANF SSIEarly Payment Sample
Detroit, MI 1st - 9thTwice a month,
staggered 1stFresno, CA 1st - 10th 1st 1stNewark, NJ 1st - 5th 1st 1st
Philadelphia, PA 1st-10thTwice a month,
staggered 1stProvidence, RI 1st 1st and 16th 1stWashington, DC 1st - 10th 1st 1st
Staggered Payment SampleBaltimore, MD 6th-15th 1st-15th 1stEl Paso, TX 1st-15th 1st-15th 1stMiami, FL 1st - 15th 1st - 15th 1stMilwaukee, WI 2nd-15th 1st 1stNew Orleans, LA 5th - 14th 1st-5th 1stSt. Louis, MO 1st - 22nd 1st - 4th 1st

City Type of Crimes Covered Sample Period
Detroit, MI All Group A NIBRS Crimes 2005-2006Fresno, CA All Part I UCR Crimes 2004-2006Newark, NJ All Part I UCR Crimes except Rape and Arson 2005-2006Philadelphia, PA All Part I UCR Crimes except Arson 2004-2006Providence, RI All Part I UCR Crimes except Arson 2004-2006Washington, DC All Part I UCR Crimes 08/01/2004-09/30/2005, 2006Baltimore, MD All Part I UCR Crimes except Arson and Homicide 2006Milwaukee, WI All Part I UCR Crimes 2005-2006St. Louis, MO All Part I UCR Crimes 2004-2006Miami, FL All Part I UCR Crimes 2004, 08/01/2005-12/31/2006New Orleans, LA All Part I UCR Crimes except Arson, Homicide, and Rape 2006El Paso, TX Robbery, Burglary, Theft, Motor Vehicle Theft 07/01/05-12/31/06
Table 2
Crime Data Coverage
This table displays information about the crime data obtained from each city in the sample.
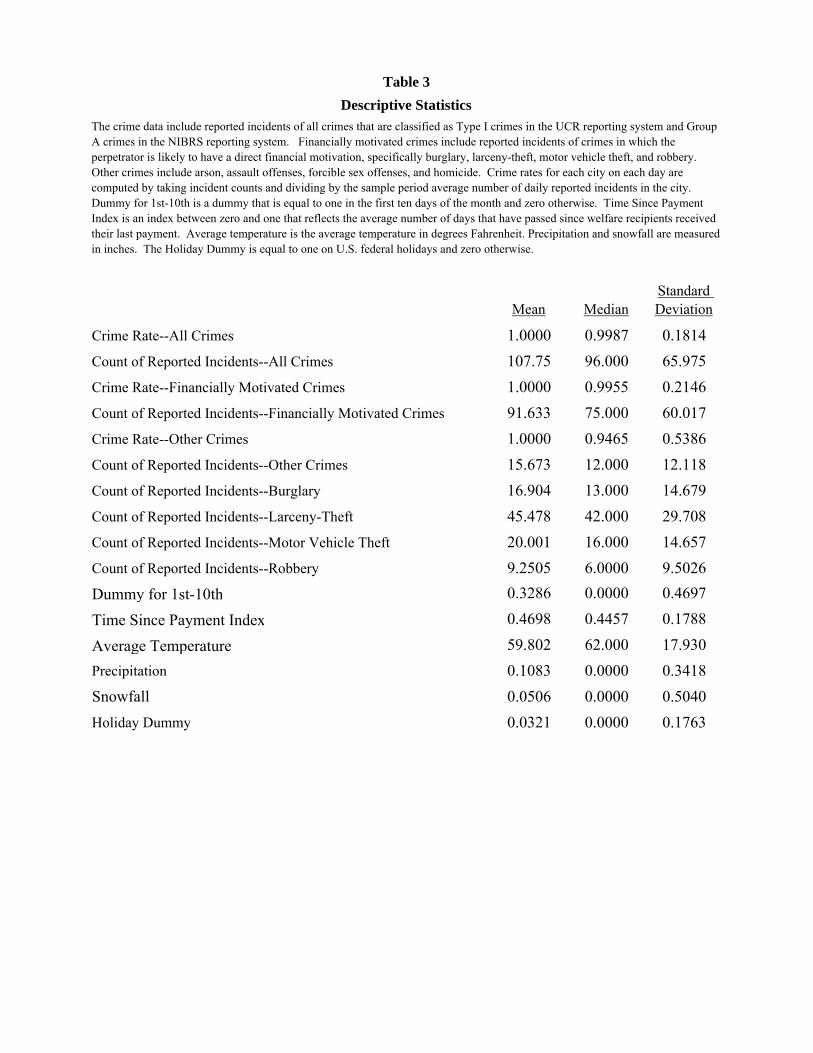
Mean MedianStandard Deviation
Crime Rate--All Crimes 1.0000 0.9987 0.1814Count of Reported Incidents--All Crimes 107.75 96.000 65.975Crime Rate--Financially Motivated Crimes 1.0000 0.9955 0.2146Count of Reported Incidents--Financially Motivated Crimes 91.633 75.000 60.017Crime Rate--Other Crimes 1.0000 0.9465 0.5386Count of Reported Incidents--Other Crimes 15.673 12.000 12.118Count of Reported Incidents--Burglary 16.904 13.000 14.679Count of Reported Incidents--Larceny-Theft 45.478 42.000 29.708Count of Reported Incidents--Motor Vehicle Theft 20.001 16.000 14.657Count of Reported Incidents--Robbery 9.2505 6.0000 9.5026Dummy for 1st-10th 0.3286 0.0000 0.4697
Time Since Payment Index 0.4698 0.4457 0.1788
Average Temperature 59.802 62.000 17.9300.1083 0.0000 0.3418
Snowfall 0.0506 0.0000 0.5040Holiday Dummy 0.0321 0.0000 0.1763
Precipitation
Table 3
Descriptive Statistics
The crime data include reported incidents of all crimes that are classified as Type I crimes in the UCR reporting system and Group A crimes in the NIBRS reporting system. Financially motivated crimes include reported incidents of crimes in which the perpetrator is likely to have a direct financial motivation, specifically burglary, larceny-theft, motor vehicle theft, and robbery. Other crimes include arson, assault offenses, forcible sex offenses, and homicide. Crime rates for each city on each day are computed by taking incident counts and dividing by the sample period average number of daily reported incidents in the city. Dummy for 1st-10th is a dummy that is equal to one in the first ten days of the month and zero otherwise. Time Since Payment Index is an index between zero and one that reflects the average number of days that have passed since welfare recipients received their last payment. Average temperature is the average temperature in degrees Fahrenheit. Precipitation and snowfall are measured in inches. The Holiday Dummy is equal to one on U.S. federal holidays and zero otherwise.

Dependent Variable:(1) (2) (3) (4) (5) (6) (7) (8)
Constant 0.9977 0.8658 0.9006 0.7732 5.2373 5.4441 5.1876 5.4294(0.0153) (0.0231) (0.0300) (0.0420) (0.2168) (0.2427) (0.2400) (0.2850)
Dummy for 1st-10th -0.0292 -0.0318 -0.0226 -0.0254(0.0061) (0.0055) (0.0054) (0.0048)
0.0255 0.0266 0.0143 0.0153(0.0097) (0.0090) (0.0081) (0.0074)
Time Since Payment Index 0.1165 0.1201 0.0863 0.0858(0.0260) (0.0325) (0.0221) (0.0242)
Average Temperature 0.0026 0.0026 0.0030 0.0029(0.0003) (0.0003) (0.0003) (0.0003)-0.0175 -0.0169 -0.0189 -0.0180
(0.0043) (0.0037) (0.0040) (0.0051)Snowfall -0.0303 -0.0310 -0.0381 -0.0387
(0.0031) (0.0027) (0.0049) (0.0045)Holiday Dummy -0.0977 -0.1014 -0.1148 -0.1165
(0.0107) (0.0115) (0.0100) (0.0085)City * Month * Year Fixed Effects? Y Y Y Y Y Y Y YCity * Day of the Week Fixed Effects? Y Y Y Y Y Y Y YDay of Month Fixed Effects? N N Y Y N N Y YNo. of Obs. 9,496 9,496 9,496 9,496 9,496 9,496 9,496 9,496R-Squared 0.1434 0.1794 0.1590 0.1951Log Likelihood -35,413 -35,091 -35,336 -35,018
Crime Rate Count of Reported Incidents
Staggered Payment Dummy * Dummy for 1st-10th
Precipitation
Table 4
The Effects of the Timing of Welfare Payments on CrimeThe dependent variable in columns 1-4 is the crime rate, and for columns 5-8 it is a count of the total reported incidents of crime. The crime data include reported incidents of all crimes that are classified as Type I crimes in the UCR reporting system and Group A crimes in the NIBRS reporting system. Crime rates for each city on each day are computed by taking incident counts and dividing by the sample period average number of daily reported incidents in the city. The specifications presented in columns 1-4 are OLS specifications, and those in columns 5-8 are negative binomial specifications. Each specification includes fixed effects for each city/month/year combination and each city/day of the week pair, and the specifications in columns 3, 4, 7, and 8 also include fixed effects for each day of the month. Dummy for 1st-10th is a dummy that is equal to one in the first ten days of the month and zero otherwise. Staggered Payment Dummy is equal to one for cities where food stamp payments are not exclusively made during the first ten days of the month. Time Since Payment Index is an index between zero and one that reflects the average number of days since welfare recipients received their last payment. Average temperature is measured in degrees Fahrenheit. Precipitation and snowfall are measured in inches. The Holiday Dummy is equal to one on U.S. federal holidays and zero otherwise. Standard errors appear in parentheses, and they are computed using a block bootstrap techinque in which city-month blocks are used for sampling.

Dependent Variable:(1) (2) (3) (4) (5) (6) (7) (8)
Constant 1.0044 0.9207 0.8808 0.8055 4.8847 5.1146 4.8154 5.0771(0.0218) (0.0272) (0.0307) (0.0418) (0.2732) (0.3061) (0.2232) (0.1913)
Dummy for 1st-10th -0.0353 -0.0378 -0.0289 -0.0316(0.0062) (0.0068) (0.0050) (0.0054)
0.0313 0.0325 0.0214 0.0224(0.0100) (0.0089) (0.0075) (0.0092)
Time Since Payment Index 0.1379 0.1408 0.1107 0.1103(0.0311) (0.0291) (0.0256) (0.0232)
Average Temperature 0.0019 0.0019 0.0022 0.0022(0.0004) (0.0004) (0.0003) (0.0003)-0.0082 -0.0075 -0.0106 -0.0096
(0.0058) (0.0058) (0.0044) (0.0053)Snowfall -0.0321 -0.0329 -0.0400 -0.0406
(0.0027) (0.0031) (0.0043) (0.0042)Holiday Dummy -0.1374 -0.1411 -0.1550 -0.1564
(0.0121) (0.0111) (0.0120) (0.0120)City * Month * Year Fixed Effects? Y Y Y Y Y Y Y YCity * Day of the Week Fixed Effects? Y Y Y Y Y Y Y YDay of Month Fixed Effects? N N Y Y N N Y YNo. of Obs. 9,496 9,496 9,496 9,496 9,496 9,496 9,496 9,496R-Squared 0.1823 0.2147 0.1958 0.2284Log Likelihood -34,581 -34,280 -34,509 -34,211
Precipitation
Count of Reported Incidents
Staggered Payment Dummy * Dummy for 1st-10th
Table 5
The Effects of the Timing of Welfare Payments on Crime--Financially Motivated CrimesThe dependent variable in columns 1-4 is the crime rate, and for columns 5-8 it is a count of the total reported incidents of crime. The crime data include reported incidents of crimes in which the perpetrator is likely to have a direct financial motivation, specifically burglary, larceny-theft, motor vehicle theft, and robbery. Crime rates for each city on each day are computed by taking incident counts and dividing by the sample period average number of daily reported incidents in the city. The specifications presented in columns 1-4 are OLS specifications, and those in columns 5-8 are negative binomial specifications. Each specification includes fixed effects for each city/month/year combination and each city/day of the week pair, and the specifications in columns 3, 4, 7, and 8 also include fixed effects for each day of the month. Dummy for 1st-10th is a dummy that is equal to one in the first ten days of the month and zero otherwise. Staggered Payment Dummy is equal to one for cities where food stamp payments are not exclusively made during the first ten days of the month. Time Since Payment Index is an index between zero and one that reflects the average number of days since welfare recipients received their last payment. Average temperature is the average temperature in degrees Fahrenheit. Precipitation and snowfall are measured in inches. The Holiday Dummy is equal to one on U.S. federal holidays and zero otherwise. Standard errors appear in parentheses, and they are computed using a block bootstrap techinque in which city-month blocks are used for sampling.
Crime Rate

Dependent Variable:(1) (2) (3) (4) (5) (6) (7) (8)
Constant 0.9250 0.4702 0.9389 0.4252 4.5437 4.5530 4.6775 4.6483(0.0368) (0.0419) (0.0795) (0.0859) (1.8949) (0.4376) (0.3531) (0.4809)
Dummy for 1st-10th 0.0065 0.0027 0.0070 0.0058(0.0197) (0.0190) (0.0099) (0.0088)
0.0030 0.0047 -0.0112 -0.0111(0.0261) (0.0216) (0.0173) (0.0147)
Time Since Payment Index 0.0787 0.0905 -0.0015 0.0062(0.0743) (0.0751) (0.0489) (0.0518)
Average Temperature 0.0080 0.0079 0.0071 0.0070(0.0005) (0.0009) (0.0006) (0.0006)-0.0833 -0.0824 -0.0748 -0.0739
(0.0138) (0.0131) (0.0108) (0.0090)Snowfall -0.0199 -0.0200 -0.0229 -0.0233
(0.0092) (0.0102) (0.0079) (0.0084)Holiday Dummy 0.1575 0.1493 0.1297 0.1238
(0.0270) (0.0326) (0.0222) (0.0200)City * Month * Year Fixed Effects? Y Y Y Y Y Y Y YCity * Day of the Week Fixed Effects? Y Y Y Y Y Y Y YDay of Month Fixed Effects? N N Y Y N N Y YNo. of Obs. 8,947 8,947 8,947 8,947 8,947 8,947 8,947 8,947R-Squared 0.0680 0.0932 0.0728 0.0963Log Likelihood -23,051 -22,872 -23,022 -22,853
Table 6
The Effects of the Timing of Welfare Payments on Crime--Other CrimesThe dependent variable in columns 1-4 is the crime rate, and for columns 5-8 it is a count of the total reported incidents of crime. The crime data include reported incidents of arson, assault offenses, forcible sex offenses, and homicide. Crime rates for each city on each day are computed by taking incident counts and dividing by the sample period average number of daily reported incidents in the city. The specifications presented in columns 1-4 are OLS specifications, and those in columns 5-8 are negative binomial specifications. Each specification includes fixed effects for each city/month/year combination and each city/day of the week pair, and the specifications in columns 3, 4, 7, and 8 also include fixed effects for each day of the month. Dummy for 1st-10th is a dummy that is equal to one in the first ten days of the month and zero otherwise. Staggered Payment Dummy is equal to one for cities where food stamp payments are not exclusively made during the first ten days of the month. Time Since Payment Index is an index between zero and one that reflects the average number of days that have passed since welfare recipients received their last payment. Average temperature is the average temperature in degrees Fahrenheit. Precipitation and snowfall are measured in inches. The Holiday Dummy is equal to one on U.S. federal holidays and zero otherwise. Standard errors appear in parentheses, and they are computed using a block bootstrap techinque in which city-month blocks are used for sampling.
Precipitation
Crime Rate Count of Reported Incidents
Staggered Payment Dummy * Dummy for 1st-10th

Dependent Variable:
Type of Crime:(1) (2) (3) (4) (5) (6) (7) (8)
Constant 3.6781 3.6426 4.3150 4.4937 4.0290 4.0644 3.4936 3.4055(0.2776) (0.3528) (0.1843) (0.2698) (0.3986) (0.4292) (0.2088) (0.3033)
Time Since Payment Index 0.0865 0.0910 0.0926 0.0913 0.1354 0.1363 0.2484 0.2512(0.0456) (0.0517) (0.0323) (0.0361) (0.0461) (0.0453) (0.0615) (0.0673)
Average Temperature 0.0033 0.0023 0.0007 0.0029(0.0005) (0.0004) (0.0005) (0.0007)
0.0184 -0.0293 0.0110 -0.0122(0.0120) (0.0061) (0.0093) (0.0125)
Snowfall -0.0439 -0.0470 -0.0244 -0.0360(0.0106) (0.0067) (0.0053) (0.0062)
Holiday Dummy -0.1415 -0.2080 -0.0725 -0.1304(0.0252) (0.0163) (0.0223) (0.0252)
City * Month * Year Fixed Effects? Y Y Y Y Y Y Y YCity * Day of the Week Fixed Effects? Y Y Y Y Y Y Y YDay of Month Fixed Effects? Y Y Y Y Y Y Y Y
No. of Obs. 9,496 9,496 9,496 9,496 9,496 9,496 9,496 9,496Log Likelihood -24,933 -24,849 -30,621 -30,367 -26,469 -26,448 -20,856 -20,816
Table 7
The Effects of the Timing of Welfare Payments by Type of Financially Motivated CrimeThe dependent variable is the count of reported incidents of burglary in columns 1 and 2, larceny-theft in columns 3 and 4, motor vehicle theft in columns 5 and 6, and robbery in columns 7 and 8. The specifications are negative binomial specifications, and each specification includes fixed effects for each city/month/year combination, each city/day of the week pair, and each day of the month. Time Since Payment Index is an index between zero and one that reflects the average number of days since welfare recipients received their last payment. Average temperature is the average temperature in degrees Fahrenheit. Precipitation and snowfall are measured in inches. The Holiday Dummy is equal to one on U.S. federal holidays and zero otherwise. Standard errors appear in parentheses, and they are computed using a block bootstrap techinque in which city-month blocks are used for sampling.
Precipitation
Count of Reported IndcidentsRobberyMotor Vehichle TheftLarceny-TheftBurglary

Type of Crime:Dependent Variable:
(1) (2) (3) (4)Constant 4.7912 5.0510 4.6498 4.6113
(0.2225) (0.2300) (0.3509) (0.5103)Time Since Payment Index >.1 & <=.2 0.0710 0.0716 0.0402 0.0407
(0.0214) (0.0267) (0.0520) (0.0560)Time Since Payment Index >.2 & <=.3 0.0867 0.0863 0.0395 0.0455
(0.0250) (0.0273) (0.0441) (0.0501)Time Since Payment Index >.3 & <=.4 0.0951 0.0958 0.0282 0.0335
(0.0236) (0.0266) (0.0413) (0.0509)Time Since Payment Index >.4 & <=.5 0.0968 0.0983 0.0350 0.0425
(0.0258) (0.0261) (0.0430) (0.0537)Time Since Payment Index >.5 & <=.6 0.1078 0.1090 0.0276 0.0364
(0.0273) (0.0261) (0.0422) (0.0490)Time Since Payment Index >.6 & <=.7 0.1259 0.1239 0.0340 0.0377
(0.0285) (0.0254) (0.0442) (0.0510)Time Since Payment Index >.7 & <=.8 0.1276 0.1254 0.0466 0.0476
(0.0342) (0.0276) (0.0479) (0.0515)Time Since Payment Index >.8 & <=.9 0.1181 0.1167 0.0182 0.0250
(0.0344) (0.0294) (0.0604) (0.0514)Time Since Payment Index >.9 & <=1 0.0723 0.0733 -0.0257 -0.0038
(0.0504) (0.0394) (0.0792) (0.0771)Average Temperature 0.0022 0.0070
(0.0003) (0.0005)Precipitation -0.0096 -0.0740
(0.0048) (0.0112)Snowfall -0.0405 -0.0232
(0.0052) (0.0100)Holiday Dummy -0.1561 0.1240
(0.0103) (0.0238)City * Month * Year Fixed Effects? Y Y Y YCity * Day of the Week Fixed Effects? Y Y Y YDay of Month Fixed Effects? Y Y Y YNo. of Obs. 9,496 9,496 8,947 8,947Log Likelihood -34,499 -34,203 -23,019 -22,850
Count of Reported Incidents
Table 8
The Effects of the Timing of Welfare Payments on Crime--Nonparametric SpecificationsThe dependent variable in columns 1 and 2 is the incident count for crimes in which the perpetrator is likely to have a financial motivation. For columns 3 and 4, it is the count for other crimes. The specifications are negative binomial specifications. Each specification includes fixed effects for each city/month/year combination, each city/day of the week pair, and each day of the month. Time Since Payment Index is an index between zero and one that reflects the average number of days that have passed since welfare recipients received their last payment. The specifications include indicators that are equal to one for each 0.1 increment of this index and otherwise equal zero, omitting the indicator for values of the index less than or equal to 0.1. Average temperature is the average temperature in degrees Fahrenheit. Precipitation and snowfall are measured in inches. The Holiday dummy is equal to one on U.S. federal holidays and zero otherwise. Standard errors appear in parentheses, and they are computed using a block bootstrap techinque in which city-month blocks are used for sampling.
Financially Motivated Crimes Other Crimes