Embed Size (px)
Citation preview

Welfare State Institutions, Unemployment and Poverty- A comparative study of EU
countries 1994-2000
M. Azhar Hussain ([email protected])
& Olli Kangas ([email protected] )
Danish National Institute of Social Research
Herluf Trolles Gade 11
DK-1052 Copenhagen

Structure of the presentation / paper
• the aim of the paper
• data
• institutional set ups of national unemployment insurance schemes
• the incidence of poverty in Europe
• institutions and consequences

The aim of the paper• is to study how various institutional set ups of national
social security / unemployment insurance programs mitigate the effects of unemployment (or employment)
• more specifically the paper addresses these questions:– what is the incidence of poverty among the employed and
unemployed in different countries– how is the risk of poverty changed when the individual is
employed (year t) and than becomes unemployed (year t+1): poverty problems
– what are the poverty risks for long-term unemployed (unemployed in t and t+1): social exclusion problems
– what happens when the individual gets employment (unemployed t, employed t+1): disincentive problems

Data on unemployment insurance• Characteristics of the unemployment insurance system: 1)
level of income loss compensations (net benefits in relation to net wages) = generosity of the unemployment insurance systems. 2) the degree of universality (what is the proportion of labour force covered by the scheme). And 3) the duration of the benefit period and qualification conditions.– these data come mainly from Social Citizenship Indicators Project
(SCIP) housed at the University of Stockholm.– replacement levels for different income groups are derived
from OECD data bases– Gre, Por & Spa data are from OECD
• The second data-base is the European Community Household Panel (ECHP) that contains panel data for most European Union countries for 1994-2001.

The European Community Household Panel (ECHP)
• survey based, standardised questionnaire• annual interviewing of a representative panel of households
and individuals in each country– covering a wide range of topics: income, health, education,
housing, demographics and employment characteristic, etc.
• The total duration of the ECHP was 8 years, running from 1994 to 2001.
• In the first wave, i.e. in 1994, a sample of some 60,500 nationally represented households - i.e. approximately 130,000 adults aged 16 years and over - were interviewed in the then 12 Member States.
• Austria (1995) and Finland (1996) have joined the project since then.
• Data for Sweden are available only for 1997
Generosity I
r = .77**
GENEROSITY FOR APW
908070605040
GE
NE
RO
SIT
Y F
OR
0,6
7*A
PW
100
90
80
70
60
50
UK
SWE
SPA
POR
NL
ITA
IRE
GRE
GER
FRA
FIN
DEN
BEL
AUT
r = .74*
GENEROSITY FOR APW
908070605040
GE
NE
RO
SIT
Y F
OR
1,5
*AP
W
90
80
70
60
50
40
30
UK
SWE
SPA
POR
NL
ITA
IREGRE
GERFRA
FINDEN
BEL
AUT

Generosity II• those who are
good for the good are good also for the poor
r = .60*
GENEROSITY FOR 1,5*APW
90807060504030
GE
NE
RO
SIT
Y F
OR
0,6
7*A
PW
100
90
80
70
60
50
UK
SWE
SPA
POR
NL
ITA
IRE
GRE
GER
FRA
FIN
DEN
BEL
AUT

Overall Generosity (MEAN FOR 0.65, 1 AND 1.5
APW) AND Universalityr = .27
UNIVERSALITY
110100908070605040
OV
ER
AL
L G
EN
ER
OS
ITY
90
80
70
60
50
40
UK
SWE
SPA
POR
NL
ITA
IRE
GRE
GERFRA
FINDEN
BELAUT

Correlations between indicators of unemployment insurance
0,67APW APW 1,5APW UNIV WAIT DAYS
APW .77*
1,5APW .60* .74**
UNIV .14 .51 .05
WAIT DAYS
.57 .36 .28 -.12
DURATION
-.21 -.35 -.21 .12 .00
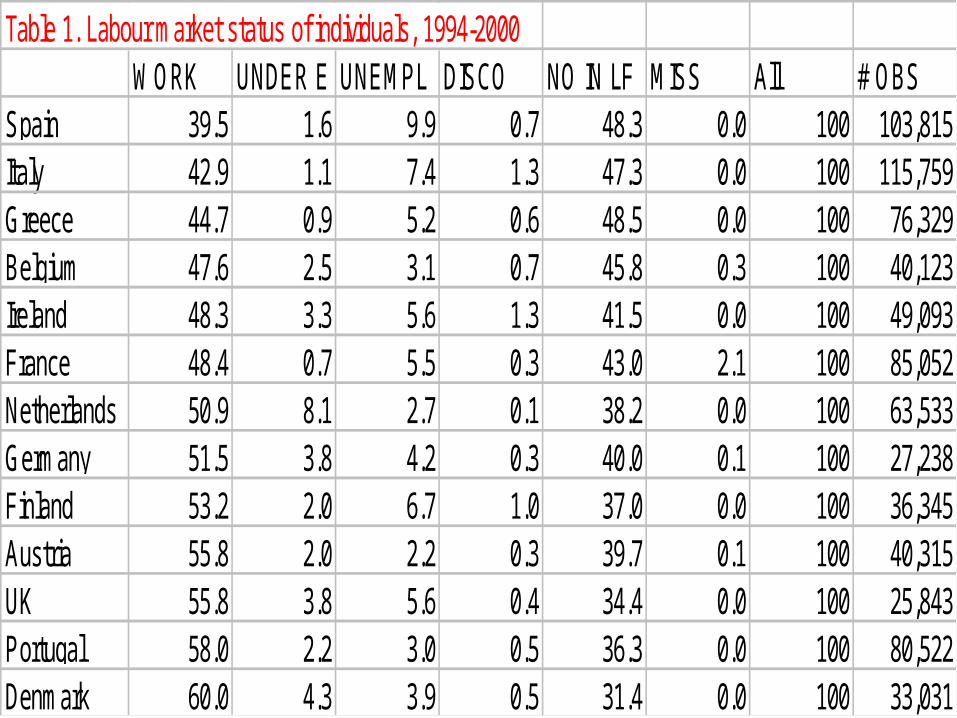
Table 1. Labour market status of individuals, 1994-2000WORK UNDER E UNEMPL DISCO NO IN LF MISS All # OBS
Spain 39.5 1.6 9.9 0.7 48.3 0.0 100 103,815Italy 42.9 1.1 7.4 1.3 47.3 0.0 100 115,759Greece 44.7 0.9 5.2 0.6 48.5 0.0 100 76,329Belgium 47.6 2.5 3.1 0.7 45.8 0.3 100 40,123Ireland 48.3 3.3 5.6 1.3 41.5 0.0 100 49,093France 48.4 0.7 5.5 0.3 43.0 2.1 100 85,052Netherlands 50.9 8.1 2.7 0.1 38.2 0.0 100 63,533Germany 51.5 3.8 4.2 0.3 40.0 0.1 100 27,238Finland 53.2 2.0 6.7 1.0 37.0 0.0 100 36,345Austria 55.8 2.0 2.2 0.3 39.7 0.1 100 40,315UK 55.8 3.8 5.6 0.4 34.4 0.0 100 25,843Portugal 58.0 2.2 3.0 0.5 36.3 0.0 100 80,522Denmark 60.0 4.3 3.9 0.5 31.4 0.0 100 33,031

Changes in LM-status from t to t+1E-E E-UE UE-E UE-UE O-O O-E O-UE E-O E-O
Spain 33,8 2,0 3,4 4,6 45,0 2,7 3,0 2,4 3,0 100Italy 39,6 1,1 1,6 3,7 44,9 1,8 2,5 2,4 2,4 100Greece 40,7 1,3 1,7 2,2 44,8 2,6 1,4 3,6 1,7 100Ireland 43,5 0,9 2,1 2,5 40,1 4,5 1,7 2,7 2,1 100France 44,9 1,3 1,7 2,5 41,0 2,7 1,6 2,7 1,6 100Belgium 45,2 0,7 1,1 1,2 45,5 2,0 1,1 1,9 1,4 100Netherlands 46,6 0,4 1,1 0,8 41,8 3,6 1,3 2,9 1,5 100Germany 47,7 1,2 1,6 1,8 40,2 2,6 1,1 2,3 1,5 100Finland 48,1 1,7 2,5 2,8 34,5 3,2 2,1 3,1 2,0 100UK 51,4 1,7 2,0 2,2 33,2 2,8 1,2 4,0 1,5 100Austria 52,8 0,7 0,9 0,8 38,4 2,3 0,7 2,7 0,6 100Portugal 54,0 1,0 1,4 1,0 34,3 3,5 1,0 2,9 0,9 100Denmark 56,0 1,1 1,9 1,3 30,5 3,3 0,9 3,7 1,3 100

Figure 2. Poverty risk of normally working, 1994-2000. 60% poverty line
0
5
10
15
20
AU BE DK FI FR GE GR IR IT NL PT SP UK
1994 1995 1996 1997 1998 1999 2000 Avg.

Figure 1. Poverty risk of unemployed, 1994-2000. 60% poverty line
05
101520253035404550
AU BE DK FI FR GE GR IR IT NL PT SP UK
1994 1995 1996 1997 1998 1999 2000 Avg.

Labour market transitions and poverty rates in year t
E->E E->UE UE->E UE->UEDenmark 3,4 6,7 10,3 10,1Finland 4,3 9,3 11,2 24,5Netherlands 4,6 9,3 23,0 27,2Austria 7,4 11,8 18,6 22,6Ireland 4,9 12,3 29,5 45,2Portugal 14,6 14,8 21,7 27,5Germany 6,1 16,7 26,8 40,6UK 6,9 17,4 31,9 42,2France 6,5 17,9 25,7 35,7Belgium 5,0 19,9 21,6 34,9Greece 14,5 24,9 26,9 32,8Spain 10,3 25,8 29,1 37,5Italy 10,8 37,5 30,9 49,0ALL 7,6 17,3 23,6 33,1

Unemployment insurance indicator
Poverty among the unemployed
Poverty among those who became unemployed
Poverty among those who unemployed in 2 consecutive years
Difference[ in poverty rates between employed and:
Those who became unemployed
Those who unemployed in 2 consecutive years
Generosity for 65*APW
-.64* -.28 -.61* .32 .62*
Generosity for APW
-.56* -.58* -.52 .57* .44
Generosity for 1.5*APW
-.34 -.21 -.30 .31 .34
Overall generosity
-.56* -.39 -.52 .45 .51
Waiting days .51 .45 .39 -.44 -.33
Duration -.46 -.46 -.54 .34 .40
Coverage -.23 -.70** -.27 .41 -.02
Correlations between insurance characteristics and poverty rates

Generosity of unemployment insurance and poverty (%, mean for the whole period) among the unemployed.
(r = -.64*)
GENEROSITY FOR 0.67*APW
9080706050
POVE
RTY
50
40
30
20
10
UK
SPA
PORNL
ITA
IRE
GRE
GER FRA
FIN
DEN
BEL
AUT
(r = -.56*)
GENEROSITY FOR APW
8070605040
POVE
RTY
50
40
30
20
10
UK
SPA
PORNL
ITA
IRE
GRE
GERFRA
FIN
DEN
BEL
AUT

Generosity of unemployment insurance and poverty (%) among those who were employed but became unemployed and difference in poverty rates among the employed and those who became unemployed.
EMPLOYED THAT BECAME UNEMPLOYED
(r = .57*)
GENEROSITY FOR APW
908070605040
DIFF
EREN
CE IN
PO
VERT
Y RA
TES
10
0
-10
-20
-30
UK
SPA
POR
NL
ITA
IRE
GRE GERFRA
FINDEN
BEL
AUT
EMPLOYED WHO BECAME UNEMPLOYED
(r = -.58*)
GENEROSITY FOR APW
908070605040
POVE
RTY
RAT
E
50
40
30
20
10
0
UK
SPA
POR
NL
ITA
IRE
GRE
GERFRA
FINDEN
BEL
AUT

Generosity for .67*APW and poverty rate among long-term unemployed and changes in poverty rates (%-units) for the employed and long-term unemployed.
LONG-TERM UNEMPLOYED
(r = .62*)
GENEROSITY FOR 0.67*APW
1009080706050
DIFF
EREN
CES
IN U
NEPL
OYME
NT LE
VELS
0
-10
-20
-30
-40
-50
UK
SPA
POR
NL
ITAIRE
GRE
GER
FRA
FIN
DEN
BEL
AUT
LONG-TERM UNEMPLOYED
(r = -.61*)
GENEROSITY FOR 0.67*APW
1009080706050
POVE
RTY
RATE
60
50
40
30
20
10
0
UK
SPA
PORNL
ITAIRE
GRE
GER
FRA
FIN
DEN
BEL
AUT

Incentives

Generosity of unemployment scheme and transitions in labour market statuses t to t+1
OVERALL GENEROSITY
908070605040
TRA
NS
ITIO
N F
RO
M W
OR
K T
O U
NE
MP
L
2,5
2,0
1,5
1,0
,5
0,0
UK
SPA
POR
NL
ITA
IRE
GREGERFRA
FIN
DEN
BELAUT
OVERALL GENEROSITY
908070605040
TRA
NS
ITIO
N F
RO
M U
NE
MPL
TO
EM
PL
4,0
3,5
3,0
2,5
2,0
1,5
1,0
,5
UK
SPA
POR
NL
ITA
IRE
GREGERFRA
FIN
DEN
BEL
AUT

Generosity of unemployment scheme and transitions in labour market statuses t to t+1
• no relationship at macro level
• there might be relationship at micro level
OVERALL GENEROSITY
908070605040
UN
EM
PL
OY
ED
IN
2 Y
EA
RS
IN
RA
W
5
4
3
2
1
0
UK
SPA
PORNL
ITA
IRE
GRE
GER
FRA
FIN
DENBEL
AUT