Embed Size (px)
Citation preview

Well-being premium to marriage
Time trends and macro processes involved
Ma lgorzata Mikucka
April 29, 2013

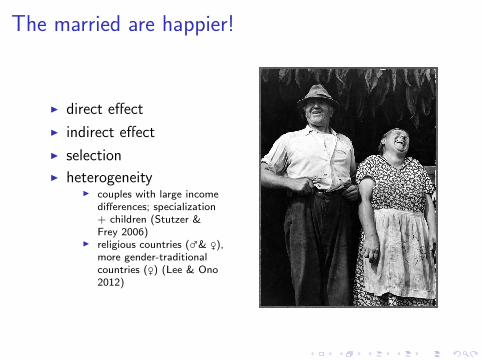
The married are happier!
I direct effect
I indirect effect
I selection
I heterogeneityI couples with large income
differences; specialization+ children (Stutzer &Frey 2006)
I religious countries (♂& ♀),more gender-traditionalcountries (♀) (Lee & Ono2012)

but...
USA studies:
I evidence of some decrease of the happiness gap betweenthe married and the never married (Lee et al 1991)
I growth of marital discord (Rogers, Amato 2000)
Broader social processes:
I individualism = more fragile family bonds
I geographical mobility, women’s employment
I demographic changes: lowering marriage and fertilityrates, increasing frequency of divorce and cohabitation

Did the happiness premium to marriage
really decrease?
Which macro factors affect the happiness
premium to marriage?

Specialization
Becker 1992Treatise on the Family
I stable arrangement
I different types of productivity
I builds marriage premium

Hypotheses
The happiness premium to marriage decreased over time
The happiness premium to marriage is higher, when theeconomic specialization of spouses is stronger
The decline of economic specialization between spouses isrelated to decreasing happiness premium to marriage

Data and method
I WVS+EVS
I 3-level MLM:individuals → country-year → country84 countries, ≈200 000 respondents, years 1981-2009
I analysis of time trends:49 countries (min 3 waves)

Decreasing SWB premium to marriage?

Decreasing SWB premium to marriage? - MLM
Happiness Life satisfactionIndividual-level variables:married 0.160 0.323
(0.000)∗∗∗ (0.000)∗∗∗
cohabiting 0.106 0.219(0.000)∗∗∗ (0.000)∗∗∗
widowed −0.020 0.039(0.015)∗ (0.143)
divorced −0.037 −0.051(0.000)∗∗∗ (0.100)
other indiv. vars yes yes
Trend of well-being:year 0.005 −0.008
(0.005)∗ (0.185)married x year −0.003 −0.007
(0.000)∗∗∗ (0.002)∗
(per 10 years) −.029 ≈ 18% −.066 ≈ 20%

Decreasing SWB premium to marriage? - MLM
I Estimation for age groups→ rather consistent downward trend
I Estimation for groups of countries→ downward trend in developing and developed countriesBUT transition countries are a special case: positivetrends for life satisfaction and flat trends for happiness
Does specialization equal happy marriage?
= ?

Does specialization equal happy marriage? - MLMHappiness Life satisfaction
Country-year specific variables:specialization (c) 0.010 0.524
(0.895) (0.056)+
GDP, ln (c) 0.039 0.379(0.080)+ (0.000)∗∗∗
fertility rate (c) 0.021 0.028(0.302) (0.714)
political rights of women (c) 0.013 −0.033(0.662) (0.752)
social rights of women (c) 0.047 0.328(0.041)∗ (0.000)∗∗∗
Cross-level interactions:
married x specialization (c) 0.049 0.029(0.005)∗ (0.609)
married x GDP (c) 0.017 0.079(0.000)∗∗∗ (0.000)∗∗∗
married x fertility rate (c) −0.026 −0.081(0.000)∗∗∗ (0.000)∗∗∗
married x political rights of women (c) 0.018 0.032(0.011)∗ (0.174)
married x social rights of women (c) −0.007 −0.065(0.215) (0.000)∗∗∗
Does specialization equal happy marriage? - MLM
I Estimation for age groups→ well-being premium to marriage depends on level ofspecialization in age group 15-24 y.o.(& for happiness for group 55-64 y.o.; negative effect forlife satisfaction in group 65-74 y.o.)
I Estimation for groups of countries→ happiness premium to marriage depends onspecialization level only in developing countries→ life satisfaction premium to marriage negativelycorrelates with specialization level in transition countries

Does specialization equal happy marriage? - MLMHappiness Life satisfaction
Country-year specific variables:specialization (c) 0.010 0.524
(0.895) (0.056)+
GDP, ln (c) 0.039 0.379(0.080)+ (0.000)∗∗∗
fertility rate (c) 0.021 0.028(0.302) (0.714)
political rights of women (c) 0.013 −0.033(0.662) (0.752)
social rights of women (c) 0.047 0.328(0.041)∗ (0.000)∗∗∗
Cross-level interactions:
married x specialization (c) 0.049 0.029(0.005)∗ (0.609)
married x GDP (c) 0.017 0.079(0.000)∗∗∗ (0.000)∗∗∗
married x fertility rate (c) −0.026 −0.081(0.000)∗∗∗ (0.000)∗∗∗
married x political rights of women (c) 0.018 0.032(0.011)∗ (0.174)
married x social rights of women (c) −0.007 −0.065(0.215) (0.000)∗∗∗
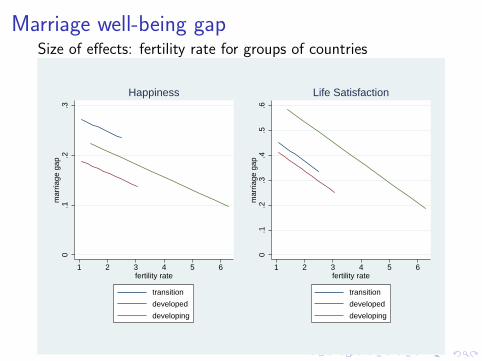
Marriage well-being gapSize of effects: fertility rate for groups of countries
0.1
.2.3
mar
riage
gap
1 2 3 4 5 6fertility rate
transition
developed
developing
Happiness
0.1
.2.3
.4.5
.6m
arria
ge g
ap
1 2 3 4 5 6fertility rate
transition
developed
developing
Life Satisfaction

Marriage well-being gapSize of effects: GDP for groups of countries
0.0
5.1
.15
.2.2
5.3
mar
riage
gap
4 6 8 10 12GDP (ln)
transition
developed
developing
Happiness
0.1
.2.3
.4.5
.6m
arria
ge g
ap
4 6 8 10 12GDP (ln)
transition
developed
developing
Life Satisfaction
Do the trends go in the same direction?

Do the trends go in the same direction?
Happiness
Albania
ArgentinaAustralia
Austria
BelgiumBrazil Bulgaria
Belarus
CanadaChile China
Croatia
Czech RepublicDenmark EstoniaFinlandFrance
Georgia
Germany
Hungary
Iceland
IndiaIreland
Italy JapanSouth Korea
Latvia
Lithuania
Mexico
MoldovaNetherlands
Nigeria
NorwayPeru
Poland
Portugal
Romania
Russian FederationSlovakia
SloveniaSouth Africa
SpainSwedenSwitzerland
Turkey
Ukraine
Macedonia
Great BritainUnited States
−.1
−.0
50
.05
.1T
rend
of h
appi
ess
prem
ium
to m
arria
ge
−.06 −.04 −.02 0 .02Trend of specialization

Do the trends go in the same direction?
Happiness
ArgentinaAustralia
Austria
Belgium
BrazilBulgaria
Canada
Chile China
Czech RepublicDenmark EstoniaFinland
France
Georgia
Germany
Hungary
Iceland
Ireland
ItalyJapan
South Korea
Latvia
Lithuania
Mexico
Moldova
Netherlands
Nigeria
NorwayPeru
Poland
Portugal
Romania
Russian Federation
Slovakia
Slovenia
South Africa
Spain
SwedenSwitzerland
Turkey
Ukraine
Macedonia
Great Britain
United States
−.0
4−
.02
0.0
2.0
4T
rend
of h
appi
ess
prem
ium
to m
arria
ge
−.02 −.01 0 .01 .02Trend of specialization

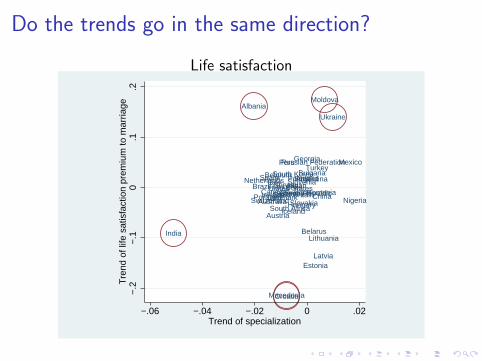
Do the trends go in the same direction?
Life satisfaction
Albania
Argentina
Australia
Austria
Belgium
Brazil
Bulgaria
Belarus
CanadaChile
China
Croatia
Czech RepublicDenmark
Estonia
FinlandFrance
Georgia
Germany
HungaryIceland
India
Ireland
Italy Japan
South Korea
Latvia
Lithuania
Mexico
Moldova
Netherlands
Nigeria
Norway
Peru
Poland
PortugalRomania
Russian Federation
Slovakia
Slovenia
South Africa
Spain
SwedenSwitzerland
Turkey
Ukraine
Macedonia
Great BritainUnited States
−.2
−.1
0.1
.2T
rend
of l
ife s
atis
fact
ion
prem
ium
to m
arria
ge
−.06 −.04 −.02 0 .02Trend of specialization

Do the trends go in the same direction?
Life satisfaction
Argentina
Australia
Austria
Belgium
Brazil
Bulgaria
Belarus
CanadaChile
ChinaCzech Republic
Denmark
Estonia
Finland
France
Georgia
Germany
Hungary
Iceland
Ireland
ItalyJapan
South Korea
Latvia
Lithuania
Mexico
Netherlands
Nigeria
Norway
Peru
Poland
PortugalRomania
Russian Federation
Slovakia
Slovenia
South Africa
Spain
Sweden
Switzerland
Turkey
Great Britain
United States
−.1
5−
.1−
.05
0.0
5T
rend
of l
ife s
atis
fact
ion
prem
ium
to m
arria
ge
−.02 −.01 0 .01 .02Trend of specialization
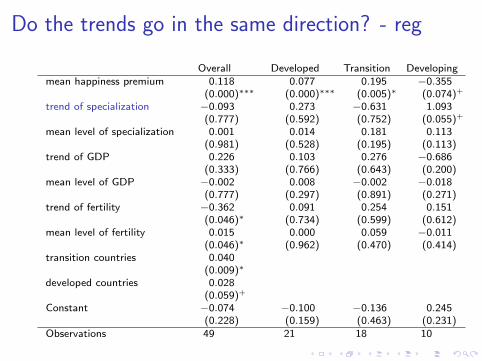
Do the trends go in the same direction? - reg
Overall Developed Transition Developingmean happiness premium 0.118 0.077 0.195 −0.355
(0.000)∗∗∗ (0.000)∗∗∗ (0.005)∗ (0.074)+
trend of specialization −0.093 0.273 −0.631 1.093(0.777) (0.592) (0.752) (0.055)+
mean level of specialization 0.001 0.014 0.181 0.113(0.981) (0.528) (0.195) (0.113)
trend of GDP 0.226 0.103 0.276 −0.686(0.333) (0.766) (0.643) (0.200)
mean level of GDP −0.002 0.008 −0.002 −0.018(0.777) (0.297) (0.891) (0.271)
trend of fertility −0.362 0.091 0.254 0.151(0.046)∗ (0.734) (0.599) (0.612)
mean level of fertility 0.015 0.000 0.059 −0.011(0.046)∗ (0.962) (0.470) (0.414)
transition countries 0.040(0.009)∗
developed countries 0.028(0.059)+
Constant −0.074 −0.100 −0.136 0.245(0.228) (0.159) (0.463) (0.231)
Observations 49 21 18 10

Do the trends go in the same direction? - reg
Overall Developed Transition Developingmean LS premium 0.053 0.050 0.062 0.253
(0.087)+ (0.001)∗ (0.524) (0.416)trend of specialization 1.966 1.779 5.600 −0.859
(0.074)+ (0.095)+ (0.627) (0.721)mean level of specialization 0.060 0.078 −0.504 0.167
(0.456) (0.090)+ (0.425) (0.241)trend of GDP 0.269 1.534 2.777 2.291
(0.730) (0.038)∗ (0.302) (0.472)mean level of GDP −0.036 −0.024 −0.041 0.003
(0.052)+ (0.097)+ (0.526) (0.962)trend of fertility −0.577 1.359 −1.318 −1.524
(0.342) (0.018)∗ (0.598) (0.499)mean level of fertility −0.019 −0.019 0.080 0.055
(0.430) (0.293) (0.871) (0.549)transition countries 0.008
(0.864)developed countries 0.104
(0.036)∗
Constant 0.254 0.212 0.142 −0.508(0.212) (0.127) (0.895) (0.566)
Observations 49 21 18 10

Key results
I the well-being premium to marriage is decreasing at rate of about2% per year
I specialization vs. well-being premium to marriage → not veryconsistent
I in no population the effect of specialization cancels out thenegative time trend of well-being premium to marriage
I specific case of transition countries
I higher GDP, lower fertility = higher well-being premium to marriage