Embed Size (px)
Citation preview
Well Efficiency- Step Drawdown
Tests
Well EfficiencyWell Efficiency-- Step Drawdown TestsStep Drawdown Tests
The total drawdown at a pumping well is given by:The total drawdown at a pumping well is given by:
sstt = s + = s + ssww = = Q Q W(uW(u) + CQ) + CQ2 2 = BQ + CQ= BQ + CQ22
44ππTT
stst= Q(B+CQ)= Q(B+CQ)
St/Q= B+CQSt/Q= B+CQ
The specific capacity is given by: The specific capacity is given by: QQ = = 1 1 ..
sstt B + CQB + CQ
The ratio of the aquifer loss and total drawdown (The ratio of the aquifer loss and total drawdown (s/ss/stt) is known as the ) is known as the well efficiency.well efficiency.
ss = = B B ..
sstt B + CQB + CQ
MoggMogg (1968) defines well efficiency at a fixed time (t = 24 hrs). Th(1968) defines well efficiency at a fixed time (t = 24 hrs). Thus, us, writing writing W(uW(u) as the Cooper) as the Cooper--Jacob approximation gives:Jacob approximation gives:
it is clear that well efficiency reduces with pumping rate (Q) ait is clear that well efficiency reduces with pumping rate (Q) and nd increases with well radius (increases with well radius (rrww), where B is inversely related to well ), where B is inversely related to well radius.radius.
S= B Q +C Q n
S= B Q +C Q 2
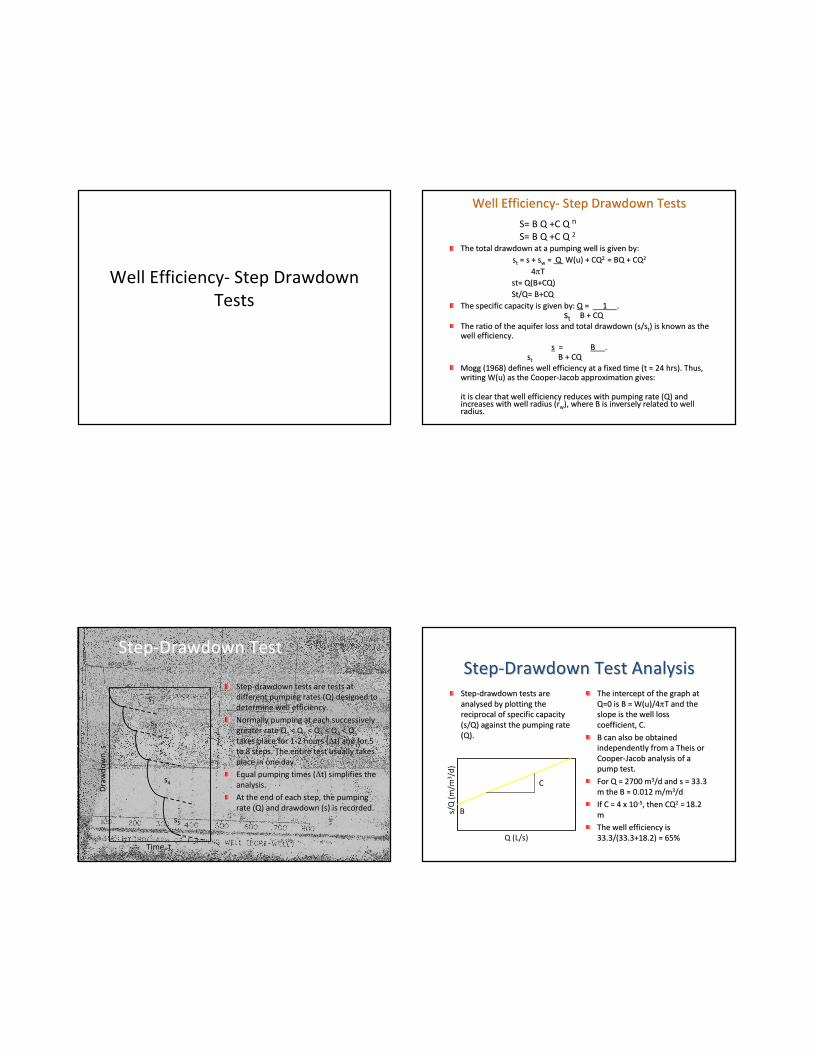
StepStep--Drawdown TestDrawdown Test
StepStep--drawdown tests are tests at drawdown tests are tests at
different pumping rates (Q) designed to different pumping rates (Q) designed to
determine well efficiency.determine well efficiency.
Normally pumping at each successively Normally pumping at each successively
greater rate Qgreater rate Q1 1 < Q< Q22 < Q< Q33 < Q< Q44 < Q< Q55
takes place for 1takes place for 1--2 hours (2 hours (∆∆tt) and for 5 ) and for 5
to 8 steps. The entire test usually takes to 8 steps. The entire test usually takes
place in one day. place in one day.
Equal pumping times (Equal pumping times (∆∆tt) simplifies the ) simplifies the
analysis.analysis.
At the end of each step, the pumping At the end of each step, the pumping
rate (Q) and drawdown (s) is recorded.rate (Q) and drawdown (s) is recorded.
Time, t
Dra
wd
ow
n,
s
s1
s2
s3
s4
s5
StepStep--Drawdown Test AnalysisDrawdown Test Analysis
StepStep--drawdown tests are drawdown tests are
analysedanalysed by plotting the by plotting the
reciprocal of specific capacity reciprocal of specific capacity
(s/Q) against the pumping rate (s/Q) against the pumping rate
(Q).(Q).
Q (L/s)
s/Q
(m
/m3/d
)
The intercept of the graph at The intercept of the graph at
Q=0 is B = W(u)/4Q=0 is B = W(u)/4ππT and the T and the
slope is the well loss slope is the well loss
coefficient, C.coefficient, C.
B can also be obtained B can also be obtained
independently from a Theis or independently from a Theis or
CooperCooper--Jacob analysis of a Jacob analysis of a
pump test. pump test.
For Q = 2700 mFor Q = 2700 m33/d and s = 33.3 /d and s = 33.3
m the B = 0.012 m/mm the B = 0.012 m/m33/d/d
If C = 4 x 10If C = 4 x 10--55, then CQ, then CQ22 == 18.2 18.2
m m
The well efficiency is The well efficiency is
33.3/(33.3+18.2) = 65%33.3/(33.3+18.2) = 65%
B
C

Step Pumping
rate (Q)
m3/min
drawdown
(sw(m)
Specific
drawdown
(sw/q(min/
m2)
1 1.59 3.69 2.32
2 1.98 5.14 2.60
3 2.44 7.08 2.90
4 2.96 9.63 3.25
5 3.27 11.29 3.45
Example Step Pumpi
ng
rate
(Q)
m3/mi
n
drawd
own(s
w(m)
Specifi
c
drawd
own
(sw/q(
min/m
2)
Delta
Q
Delta
Sw
Delta S/Delta
Q
C(min2/
m5)
C(Sec2/
m5)
1 1.59 3.69 2.32
2 1.98 5.14 2.60 0.39 1.45 3.72
3 2.44 7.08 2.90 0.46 1.94 4.22 0.58758
2115.28
6
4 2.96 9.63 3.25 0.52 2.55 4.90
0.70046
4
2521.67
1
5 3.27 11.29 3.45 0.31 1.66 5.35
0.54336
5
1956.11
2
Average well
loss 2197.69
C= ((Delta S2/Delta Q2)-(Delta S1/Delta Q1))/(deltaQ1+delta Q2)
sec2/m5