Embed Size (px)
DESCRIPTION
Well-logging Lab No. 3 - Formation Water Resistivity (Rw From Sp Log)
Citation preview
ing zones, the amount of SP reduction is related to theamount of shale in the formation.
Hydrocarbon Content
In hydrocarbon-bearing zones, the SP deflection isreduced. This effect is called hydrocarbon suppression(Hilchie, 1978). Hydrocarbon suppression of the SP isa qualitative phenomenon, and cannot be used todetermine the hydrocarbon saturation of the forma-tion.
The SP response of shales is relatively constant andfollows a straight line called a shale baseline. The SPvalue of the shale baseline is assumed to be zero, andSP curve deflections are measured from this baseline.Permeable zones are indicated where there is SPdeflection from the shale baseline. For example, if theSP curve moves either to the left (negative deflection;Rmf > Rw) or to the right (positive deflection; Rmf < Rw)of the shale baseline, permeable zones are present.
Permeable bed boundaries are placed at the pointsof inflection from the shale baseline.
Note that when recording through impermeablezones or through permeable zones where Rmf is equalto Rw, the SP curve does not deflect from the shalebaseline. The magnitude of SP deflection is due to thedifference in salinity between mud filtrate and forma-tion water and not to the amount of permeability. Thissalinity difference produces a difference in the resis-tivities of the mud filtrate (Rmf) and formation water(Rw).
Over long intervals (several hundreds to thousandsof feet), the SP baseline can drift, either in the positiveor negative direction. While this is of little conse-quence when making calculations local to a specificformation, it may introduce errors if the SP magnitudeis being calculated over that long interval, especiallyby means of a computer. Accordingly, the baselinedrift can be removed (many programs have such edit-ing routines) so that the SP baseline retains a constantvalue (usually set to zero) over the length of the loggedinterval.
FORMATION WATER RESISTIVITY (RW)DETERMINATION
Figure 2.2 is an induction electric log with an SPcurve from a Pennsylvanian upper Morrow sandstonein Beaver County, Oklahoma. In this example, the SPcurve is used to find a value for Rw by the followingprocedure:
1. After determining the formation temperature,correct the resistivities of the mud filtrate (Rmf) anddrilling mud (Rm) (obtained from the log heading) toformation temperature (see Chapter 1).
2. To minimize the effect of bed thickness, the SPis corrected to static SP (SSP). SSP represents themaximum SP a formation can have if unaffected bybed thickness. Figure 2.3 is a chart used to correct SPto SSP. The data necessary to use this chart are:
• bed thickness,• resistivity from the shallow-reading resistivity
tool (Ri)• the resistivity of the drilling mud (Rm) at forma-
tion temperature3. Once the value of SSP is determined, it is used on
the chart illustrated in Figure 2.4 to obtain a value forthe Rmf /Rwe ratio. Equivalent resistivity (Rwe) is ob-tained by dividing Rmf by the Rmf /Rwe value from thechart (Figure 2.4).
4. The value of Rwe is then corrected to Rw, usingthe chart illustrated in Figure 2.5, for average devia-tion from sodium chloride solutions, and for the influ-ence of formation temperature.
A careful examination of Figures 2.2 to 2.5 shouldhelp you gain an understanding of the procedure todetermine Rw from the SP. But, rather than usingcharts in the procedure, you might prefer using themathematical formulas listed in Table 2.1.
It is important to remember that normally the SPcurve has less deflection in hydrocarbon-bearingzones (i.e., hydrocarbon suppression). Using a hydro-carbon-bearing zone to calculate Rw results in too higha value for Rw calculated from SSP. Using a too-highvalue of Rw in Archie’s equation to determine watersaturation produces a value of Sw that is also too high,creating the chance for missed production in the inter-pretive process. Therefore, to determine Rw from SP itis best, whenever possible, to use the SP curve pro-duced by a zone that is known to contain only water.
22 ASQUITH AND KRYGOWSKI
CH02_v2.qxd 8/5/04 10:45 AM Page 22
Drilling & Well-logging Course Dr. Adel Al-Matary Well-logging Lab No. 3
1
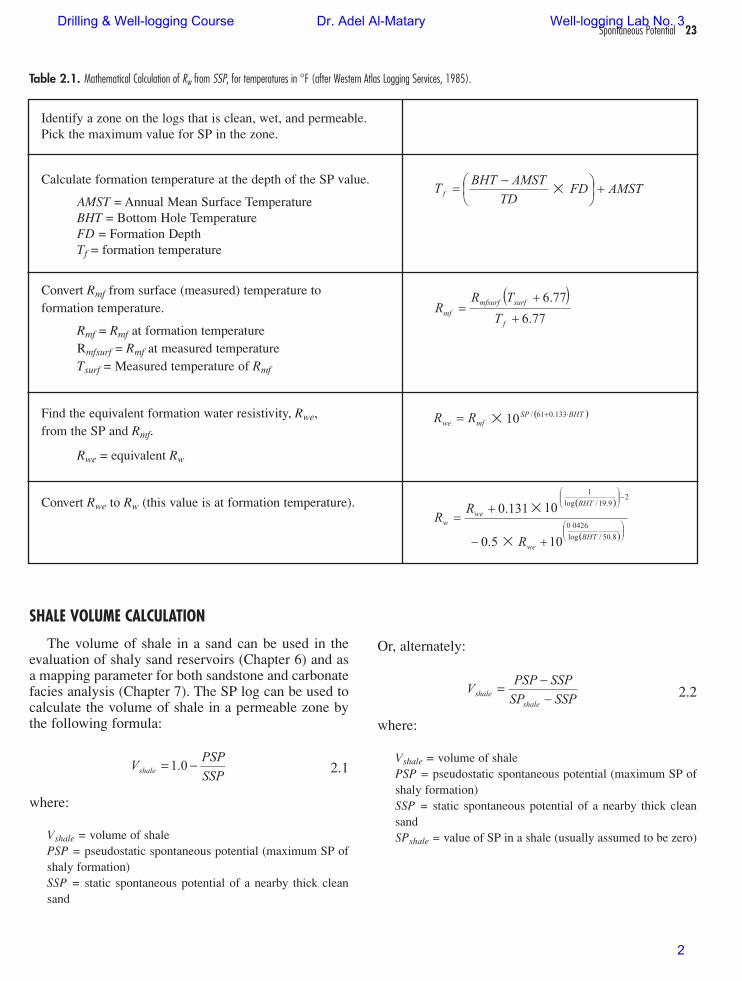
Table 2.1. Mathematical Calculation of Rw from SSP, for temperatures in °F (after Western Atlas Logging Services, 1985).
Identify a zone on the logs that is clean, wet, and permeable. Pick the maximum value for SP in the zone.
Calculate formation temperature at the depth of the SP value.
AMST = Annual Mean Surface TemperatureBHT = Bottom Hole TemperatureFD = Formation DepthTf = formation temperature
Convert Rmf from surface (measured) temperature to formation temperature.
Rmf = Rmf at formation temperatureRmfsurf = Rmf at measured temperatureTsurf = Measured temperature of Rmf
Find the equivalent formation water resistivity, Rwe,from the SP and Rmf.
Rwe = equivalent Rw
Convert Rwe to Rw (this value is at formation temperature).
Spontaneous Potential 23
SHALE VOLUME CALCULATION
The volume of shale in a sand can be used in theevaluation of shaly sand reservoirs (Chapter 6) and asa mapping parameter for both sandstone and carbonatefacies analysis (Chapter 7). The SP log can be used tocalculate the volume of shale in a permeable zone bythe following formula:
2.1
where:
Vshale = volume of shalePSP = pseudostatic spontaneous potential (maximum SP ofshaly formation)SSP = static spontaneous potential of a nearby thick cleansand
Or, alternately:
2.2
where:
Vshale = volume of shalePSP = pseudostatic spontaneous potential (maximum SP ofshaly formation)SSP = static spontaneous potential of a nearby thick cleansandSPshale = value of SP in a shale (usually assumed to be zero)
CH02_v2.qxd 8/5/04 10:45 AM Page 23
Drilling & Well-logging Course Dr. Adel Al-Matary Well-logging Lab No. 3
2

REVIEW
1. The spontaneous potential log (SP) can be usedto
• detect permeable beds• detect boundaries of permeable beds• determine formation water resistivity (Rw)• determine volume of shale (Vshale) in a perme-
able bed2. The variations in the SP are the result of an elec-
tric potential that is present between the well bore andthe formation as a result of differences in salinitiesbetween mud filtrate and formation water. This salini-ty difference produces a resistivity difference betweenRmf and Rw.
3. The SP response in shales is relatively constant,and a vertical line drawn along the SP response in ashale is referred to as the shale baseline. In permeablebeds, the SP has the following responses relative to theshale baseline:
• negative deflection (to the left of the shale base-line) where Rmf > Rw
• positive deflection (to the right of the shale base-line) where Rmf < Rw
• no deflection where Rmf = Rw
4. The SP response can be suppressed by thin beds,shaliness, and the presence of hydrocarbons.
24 ASQUITH AND KRYGOWSKI
Throughout this text, italics are used to indicate variable names with numericvalues. The notation SP is the abbreviation for spontaneous potential, and the variableSP indicates the numerical value (in mV) taken from the SP log.
CH02_v2.qxd 8/5/04 10:45 AM Page 24
Drilling & Well-logging Course Dr. Adel Al-Matary Well-logging Lab No. 3
3

Figure 2.1. Examples of SP deflectionfrom the shale baseline.
2.1A. SP deflection with differentresistivities of mud filtrate (Rmf) and formationwater (Rw). Where resistivity of the mudfiltrate (Rmf) is equal to the resistivity of theformation water (Rw), there is no deflection,positive or negative, from the shale baseline.
Where Rmf is greater than Rw, the SP deflectsto the left of the shale baseline (negativedeflection). Where Rmf greatly exceeds Rw, thedeflection is proportionately greater. This isoften called a normal SP.
Where Rmf is less than Rw, the SP deflects tothe right of the shale baseline (positivedeflection). This condition, often called areversed SP, is produced by a formationcontaining fresh water.
Remember, the SP log can used only withconductive (i.e., saltwater base or freshwaterbase) drilling muds. This log does not workwith oil-base muds or in air-filled holes.
2.1B. SP deflection with resistivity of themud filtrate (Rmf) much greater than formationwater (Rw). SSP (static spontaneous potential)at the top of the diagram, is the maximumdeflection possible in a thick, shale-free, andwater-bearing (wet) sandstone for a givenratio of Rmf /Rw. All other deflections are lessand are relative in magnitude.
SP shows the SP response due to the presenceof thin beds and/or the presence of gas.
PSP (pseudostatic spontaneous potential) isthe SP response if shale is present.
The formula for the theoretical calculated valueof SSP is given:
2.2
where:
2.3
Spontaneous Potential 25
CH02_v2.qxd 8/5/04 10:45 AM Page 25
Drilling & Well-logging Course Dr. Adel Al-Matary Well-logging Lab No. 3
4
26 ASQUITH AND KRYGOWSKI
CH02_v2.qxd 8/5/04 10:45 AM Page 26
Drilling & Well-logging Course Dr. Adel Al-Matary Well-logging Lab No. 3
5
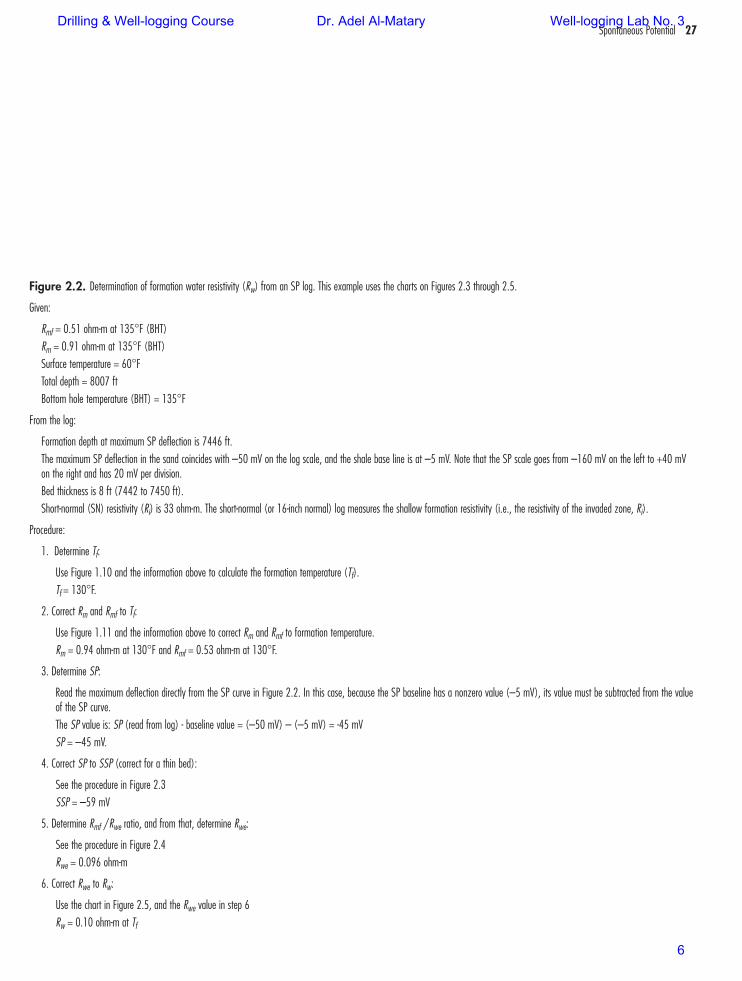
Figure 2.2. Determination of formation water resistivity (Rw) from an SP log. This example uses the charts on Figures 2.3 through 2.5.
Given:
Rmf = 0.51 ohm-m at 135°F (BHT)Rm = 0.91 ohm-m at 135°F (BHT)Surface temperature = 60°FTotal depth = 8007 ftBottom hole temperature (BHT) = 135°F
From the log:
Formation depth at maximum SP deflection is 7446 ft.The maximum SP deflection in the sand coincides with –50 mV on the log scale, and the shale base line is at –5 mV. Note that the SP scale goes from –160 mV on the left to +40 mVon the right and has 20 mV per division.Bed thickness is 8 ft (7442 to 7450 ft).Short-normal (SN) resistivity (Ri) is 33 ohm-m. The short-normal (or 16-inch normal) log measures the shallow formation resistivity (i.e., the resistivity of the invaded zone, Ri).
Procedure:
1. Determine Tf:
Use Figure 1.10 and the information above to calculate the formation temperature (Tf).Tf = 130°F.
2. Correct Rm and Rmf to Tf:
Use Figure 1.11 and the information above to correct Rm and Rmf to formation temperature. Rm = 0.94 ohm-m at 130°F and Rmf = 0.53 ohm-m at 130°F.
3. Determine SP:
Read the maximum deflection directly from the SP curve in Figure 2.2. In this case, because the SP baseline has a nonzero value (–5 mV), its value must be subtracted from the valueof the SP curve.The SP value is: SP (read from log) - baseline value = (–50 mV) – (–5 mV) = -45 mVSP = –45 mV.
4. Correct SP to SSP (correct for a thin bed):
See the procedure in Figure 2.3SSP = –59 mV
5. Determine Rmf /Rwe ratio, and from that, determine Rwe:
See the procedure in Figure 2.4Rwe = 0.096 ohm-m
6. Correct Rwe to Rw:
Use the chart in Figure 2.5, and the Rwe value in step 6 Rw = 0.10 ohm-m at Tf
Spontaneous Potential 27
CH02_v2.qxd 8/5/04 10:45 AM Page 27
Drilling & Well-logging Course Dr. Adel Al-Matary Well-logging Lab No. 3
6

Figure 2.3. SP bed-thickness correction to determine SSP from SP. (Western Atlas, 1995, Figure 3-1)
Procedure, using the values from the log in Figure 2.2:
1. Calculate the ratio Ri/Rm using the values determined in Figure 2.2, where Ri is equal to the short-normal (SN) resistivity and Rm is the value determined at formation temperature.
Ri = SN = 34 ohm-m
Rm = 0.94 ohm-m
Ri/Rm = 36
2. Locate a bed thickness on the vertical scale. Bed thickness = 8 ft.
3. Follow the bed-thickness value horizontally across until it intersects the Ri/Rm curve.
(Because Ri/Rm = 36, the point lies between the Ri/Rm = 20 and the Ri/Rm = 50 curves.)
3. Drop vertically from this intersection and read the SP correction factor on the scale across the bottom.
SP correction factor is approximately 1.3.
4. Multiply SP by the SP correction factor to find SSP.
SSP = SP � correction factor
SSP = –45 mV � 1.3 (SP value taken at 7446 ft, see Figure 2.2)
SSP = –59 mV
28 ASQUITH AND KRYGOWSKI
The nomogram in the upper right part of this figure also gives SSP. Draw a straight linefrom 45 on the SP scale on the left side of the nomogram through 1.3 on the diagonal SPcorrection factor scale. Continue this straight line to where it crosses the SSP scale at 59mV. Remember that the SP value is negative, so the SSP value is also negative.
Courtesy Baker Atlas, © 1996-1999 Baker Hughes, Inc.
CH02_v2.qxd 8/5/04 10:45 AM Page 28
Drilling & Well-logging Course Dr. Adel Al-Matary Well-logging Lab No. 3
7
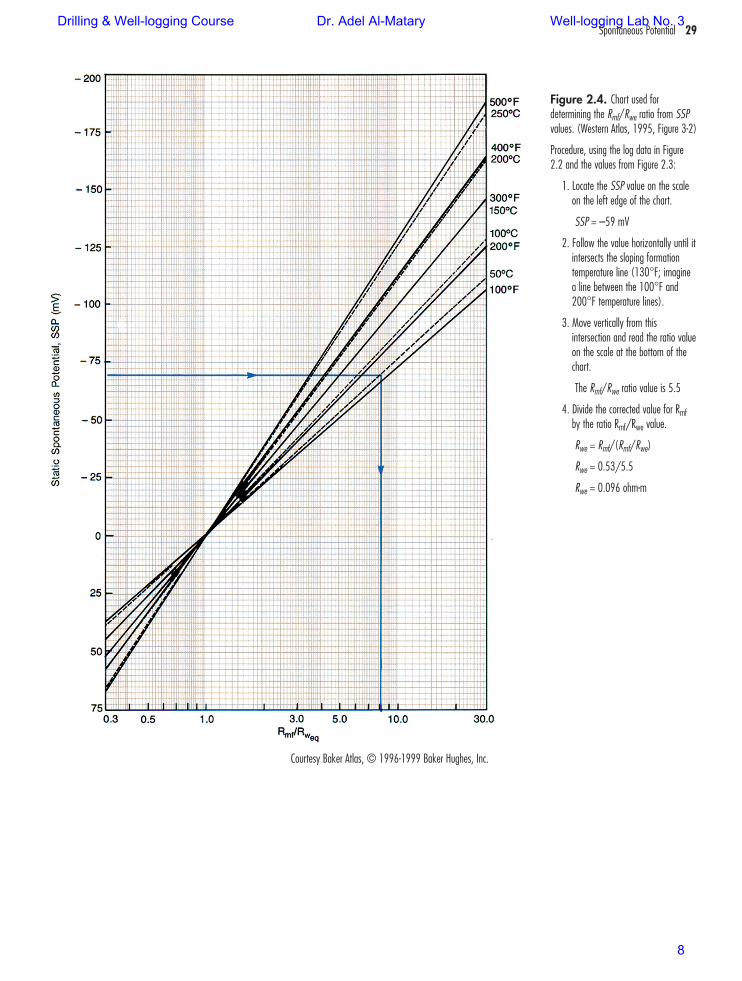
Figure 2.4. Chart used fordetermining the Rmf/Rwe ratio from SSPvalues. (Western Atlas, 1995, Figure 3-2)
Procedure, using the log data in Figure2.2 and the values from Figure 2.3:
1. Locate the SSP value on the scaleon the left edge of the chart.
SSP = –59 mV
2. Follow the value horizontally until itintersects the sloping formationtemperature line (130°F; imaginea line between the 100°F and200°F temperature lines).
3. Move vertically from thisintersection and read the ratio valueon the scale at the bottom of thechart.
The Rmf/Rwe ratio value is 5.5
4. Divide the corrected value for Rmfby the ratio Rmf/Rwe value.
Rwe = Rmf/(Rmf/Rwe)
Rwe = 0.53/5.5
Rwe = 0.096 ohm-m
Spontaneous Potential 29
Courtesy Baker Atlas, © 1996-1999 Baker Hughes, Inc.
CH02_v2.qxd 8/5/04 10:45 AM Page 29
Drilling & Well-logging Course Dr. Adel Al-Matary Well-logging Lab No. 3
8

30 ASQUITH AND KRYGOWSKI
Figure 2.5. Chart for determining the value of Rw from Rwe. (Western Atlas, 1995, Figure 3-3)
Procedure, using the values from Figure 2.4:
1. Locate the value of Rwe on the vertical scale. Rwe = 0.096 ohm-m
2. Follow it horizontally until it intersects the temperature curve desired. 130°F lies between the 100°F and 150°F temperature curves.
3. Drop vertically from the intersection and read a value for Rw on the scale at the bottom.
Rw = 0.10 ohm-m
Courtesy Baker Atlas, © 1996-1999 Baker Hughes, Inc.
CH02_v2.qxd 8/5/04 10:45 AM Page 30
Drilling & Well-logging Course Dr. Adel Al-Matary Well-logging Lab No. 3
9


![[p.T] Modeling and Inversion Methods for the Interpretation of Resistivity Logging Tool Response](https://img.pdfslide.net/doc/110x75/577d34871a28ab3a6b8e3c14/pt-modeling-and-inversion-methods-for-the-interpretation-of-resistivity.jpg)


![22.10.2010 SVN Accounts [NPFL094:/] … vojtech.diatka = rw ejemr = rw machacekmatous = rw sedlak = rw masekj = rw](https://img.pdfslide.net/doc/110x75/56649e115503460f94afcb54/22102010httpufalmffcuniczcoursenpfl0941-svn-accounts-npfl094.jpg)