Embed Size (px)
Citation preview
Well-to-Wheels Analysis Well-to-Wheels Analysis
of Future Automotive Fuels and of Future Automotive Fuels and Powertrains in the EU contextPowertrains in the EU context
IMMISSIONI & EMISSIONIIMMISSIONI & EMISSIONI
MILANO – 16th December 2008MILANO – 16th December 2008
What is the Well-to-Wheels study ?
It is a Life-Cycle Analysis restricted to quantitative aspects:
• Green-House Gases (GHG)
• Energy efficiency
• Direct costs to “EU inc.”
The study aims at clarifying the following issue:
• How to compare different ways to reduce GHG gases from passenger cars, in the 2010-2020 time frame?
• Efficiency ? Availability ? Costs ?
• The study estimates the energy balance GHG balance, costs, and availability of ALL technically feasible and alternative fuels from all sources with a significant potential to replace oil-based fuels. Derived figures include cost of GHG avoidance and cost of fossil road-fuel substitution for each alternative fuel process
The WTW analysis is:• A CONSENSUAL REFERENCE STUDY
• TRANSPARENT - ALL assumptions and input data specified and accessible
• STAKEHOLDER INVOLVEMENT- oil/car/biofuels….industries are collaborating
- Several Peer Review Meetings
- Many improvements achieved using stakeholder suggestions

Resource
Crude oil
Coal
Natural Gas
Biomass
Wind
Nuclear
Well-to-Wheels Pathways
Powertrains
Spark Ignition:Gasoline, LPG, CNG, Ethanol, H2
Compression Ignition: Diesel, DME, Bio-diesel
Fuel Cell
Hybrids: SI, CI, FC
Hybrid Fuel Cell + Reformer
Fuels
Conventional Gasoline/Diesel/Naphtha
Synthetic Diesel
CNG (inc. biogas)
LPG
MTBE/ETBE
Hydrogen(compressed / liquid)
Methanol
DME
Ethanol
Bio-diesel (inc. FAEE)
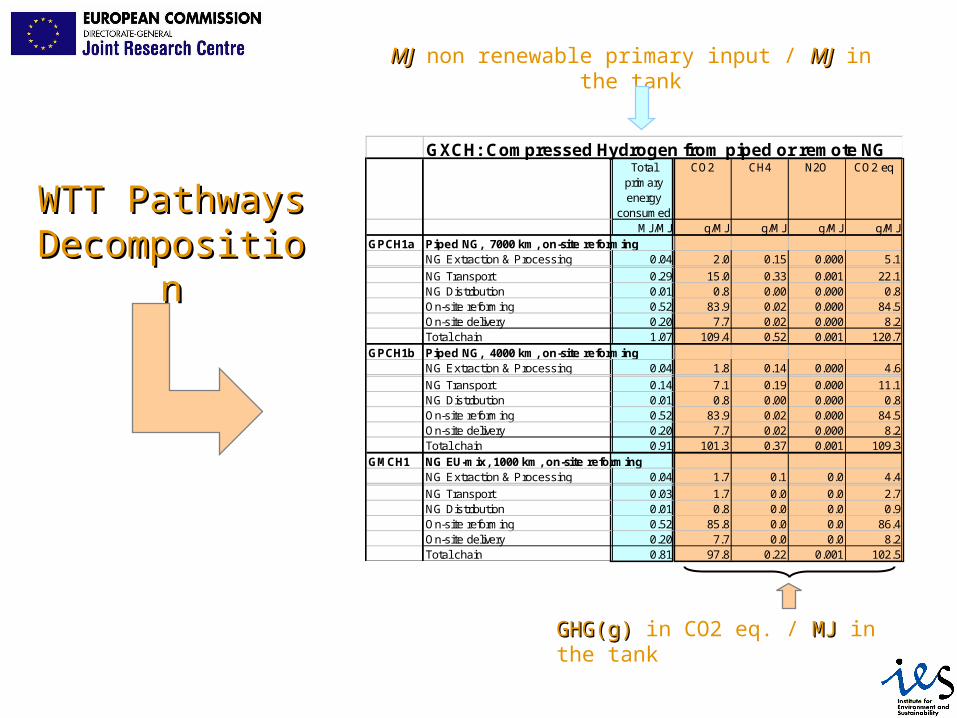
GXCH: Compressed Hydrogen from piped or remote NGTotal
primary energy
consumed
CO2 CH4 N2O CO2 eq
MJ/MJ g/MJ g/MJ g/MJ g/MJGPCH1a Piped NG, 7000 km, on-site reforming
NG Extraction & Processing 0.04 2.0 0.15 0.000 5.1
NG Transport 0.29 15.0 0.33 0.001 22.1NG Distribution 0.01 0.8 0.00 0.000 0.8On-site reforming 0.52 83.9 0.02 0.000 84.5On-site delivery 0.20 7.7 0.02 0.000 8.2Total chain 1.07 109.4 0.52 0.001 120.7
GPCH1b Piped NG, 4000 km, on-site reformingNG Extraction & Processing 0.04 1.8 0.14 0.000 4.6
NG Transport 0.14 7.1 0.19 0.000 11.1NG Distribution 0.01 0.8 0.00 0.000 0.8On-site reforming 0.52 83.9 0.02 0.000 84.5On-site delivery 0.20 7.7 0.02 0.000 8.2Total chain 0.91 101.3 0.37 0.001 109.3
GMCH1 NG EU-mix, 1000 km, on-site reformingNG Extraction & Processing 0.04 1.7 0.1 0.0 4.4
NG Transport 0.03 1.7 0.0 0.0 2.7NG Distribution 0.01 0.8 0.0 0.0 0.9On-site reforming 0.52 85.8 0.0 0.0 86.4On-site delivery 0.20 7.7 0.0 0.0 8.2Total chain 0.81 97.8 0.22 0.001 102.5
MJMJ non renewable primary input / MJMJ in the tank
GHG(g)GHG(g) in CO2 eq. / MJMJ in the tank
WTT Pathways WTT Pathways DecompositionDecomposition

Tank-to-Wheels MatrixPowertrains PISI DISI DICI Hybrid
PISIHybridDISI
HybridDICI
FC HybridFC
Ref. +hyb. FC
FuelsGasoline 2002
2010+2002
2010+2010+ 2010+ 2010+
Diesel fuel 20022010+
2010+ 2010+
LPG 2002 2010+
CNG Bi-Fuel 20022010+
CNG (dedicated) 20022010+
2010+
Diesel/Bio-diesel blend95/5
20022010+
2010+
Gasoline/Ethanol blend95/5
20022010+
20022010+
2010+
Bio-diesel 20022010+
20022010+
MTBE/ETBE 20022010+
20022010+
20022010+
20022010+
DME 20022010+
2010+
FT Diesel fuel 20022010+
2010+
Methanol 2010+
Naphtha 2010+
Compressed hydrogen 2010+ 2010+ 2010+ 2010+
Liquid hydrogen 2010+ 2010+ 2010+ 2010+

Vehicle Assumptions
Advisor Freeware ModelAdvisor Freeware Model
0.15 0.150.2
0.25 0.25
0.25
0.3
Vehicles simulations with ADVISOR FreewareThe entire vehicle + powertrain must be described
Data collection from manufacturers and others, helped by a data logger (sample below)
VEHICLE DEFINITION
Variable name Type Unit ADVISOR name FIATMultipla
First coefficient of rolling resistance Scalar -- veh_1st_rrc 0.01Second coefficient of rolling resistance Scalar s/m veh_2nd_rrc 0.00Coefficient of aerodynamic drag Scalar -- veh_CD 0.36Vehicle frontal area Scalar m2 veh_FA 2.60Height of the vehicle center of gravity Scalar m veh_cg_height 0.50Fraction of total vehicle mass Scalar -- veh_front_wt_fraction 0.60Distance between front and rear axle Scalar m veh_wheelbase 2.67Mass of the vehicle without components Scalar kg veh_glider_mass 900Test mass including fluids, passengers and cargo Scalar kg veh_mass unknownCargo mass Scalar kg veh_cargo_mass 200
FUEL CONVERTER - CONVENTIONAL
Variable name Type Unit ADVISOR name FIATMultipla
Engine size (cylinder displacement) Scalar L fc_disp 1.9Vector of engine speed used to index other variables Vector rad/s fc_map_spd 73-605Vector of engine torque used to index other variables Vector N*m fc_map_trq 0.0-144Fuel use indexed by engine speed and torque Matrix g/s fc_fuel_map 14-100Engine out CO indexed by engine speed and torque Matrix g/s fc_co_map 0-100Engine out HC indexed by engine speed and torque Matrix g/s fc_hc_map 0-100Engine out NOx indexed by engine speed and torque Matrix g/s fc_nox_map 0-100Engine out PM indexed by engine speed and torque Matrix g/s fc_pm_map 0-100Fuel density Scalar g/L fc_fuel_den 749Lower heating value of the fuel Scalar J/g fc_fuel_lhv 42600Rotational inertia of the engine Scalar kg*m2 fc_inertia 0.1Maximum torque output indexed by engine speed Vector N*m fc_max_trq 113-144Fraction of waste heat that goes to exhaust Scalar -- fc_ex_pwr_frac 0.4Engine coolant thermostat set temperature Scalar C fc_tstat 96Average heat capacity of engine Scalar J/kg/K fc_cp 500Average heat capacity of hood and engine Scalar J/kg/K fc_h_cp 500Surface area of hood and engine compartment Scalar m2 fc_hood_area 1.5
Main OUTPUTS:On the European Cycle (ECE-EUDC), the results concern:
••MJMJ/km/kmnecessary to perform the NEDC cycle
••GHG(g/km)GHG(g/km)in CO2eq.emitted along the cycle
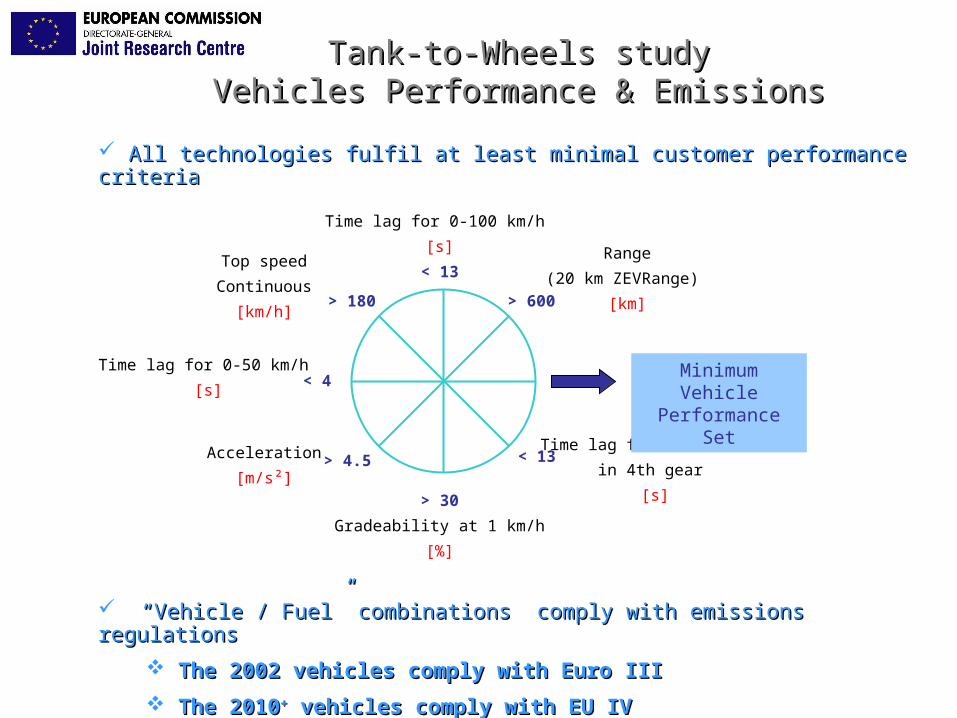
Tank-to-Wheels studyTank-to-Wheels studyVehicles Performance & EmissionsVehicles Performance & Emissions
Time lag for 0-100 km/h
[s]
< 13
> 30
Gradeability at 1 km/h
[%]
> 180 > 600
Range
(20 km ZEVRange)
[km]
Top speed
Continuous
[km/h]
Time lag for 0-50 km/h
[s]
Time lag for 80-120 km/h
in 4th gear
[s]
Acceleration
[m/s²]
< 4
< 13> 4.5
Minimum Vehicle Performance Set
All technologies fulfil at least minimal customer performance criteriaAll technologies fulfil at least minimal customer performance criteria
“ “Vehicle / Fuel” combinations comply with emissions regulationsVehicle / Fuel” combinations comply with emissions regulations
The 2002 vehicles comply with Euro IIIThe 2002 vehicles comply with Euro III
The 2010The 2010++ vehicles comply with EU IV vehicles comply with EU IV
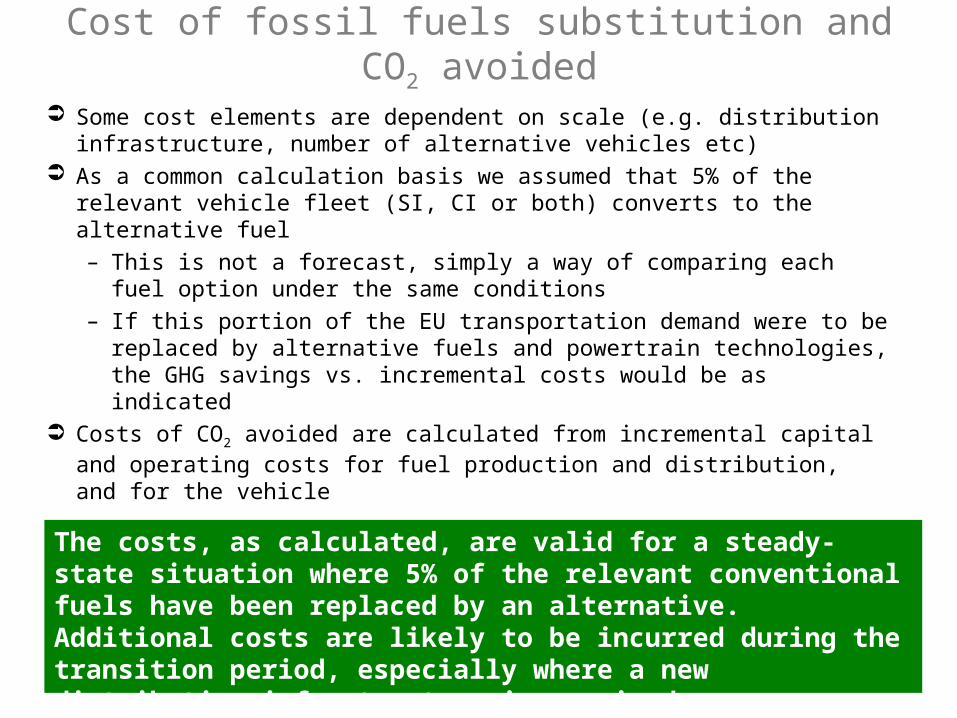
Cost of fossil fuels substitution and CO2 avoided
Some cost elements are dependent on scale (e.g. distribution infrastructure, number of alternative vehicles etc)
As a common calculation basis we assumed that 5% of the relevant vehicle fleet (SI, CI or both) converts to the alternative fuel– This is not a forecast, simply a way of comparing each fuel
option under the same conditions – If this portion of the EU transportation demand were to be
replaced by alternative fuels and powertrain technologies, the GHG savings vs. incremental costs would be as indicated
Costs of CO2 avoided are calculated from incremental capital and operating costs for fuel production and distribution, and for the vehicle
The costs, as calculated, are valid for a steady-state situation where 5% of the relevant conventional fuels have been replaced by an alternative. Additional costs are likely to be incurred during the transition period, especially where a new distribution infrastructure is required.
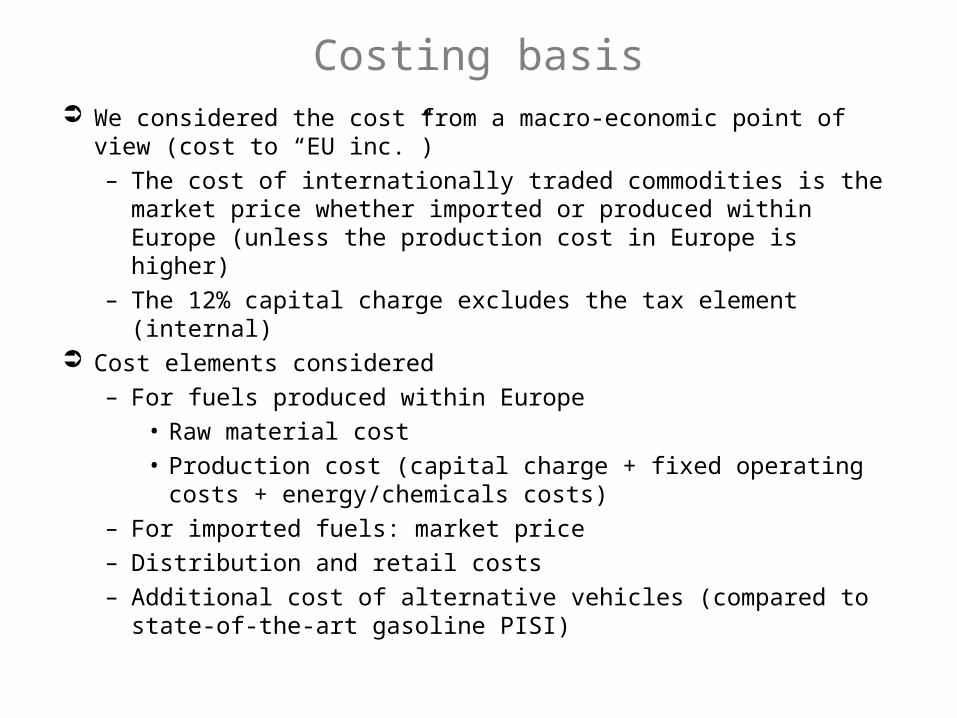
Costing basis We considered the cost from a macro-economic point of view (cost
to “EU inc.”)– The cost of internationally traded commodities is the market
price whether imported or produced within Europe (unless the production cost in Europe is higher)
– The 12% capital charge excludes the tax element (internal) Cost elements considered
– For fuels produced within Europe• Raw material cost• Production cost (capital charge + fixed operating costs +
energy/chemicals costs)– For imported fuels: market price– Distribution and retail costs– Additional cost of alternative vehicles (compared to state-of-the-
art gasoline PISI)
Costing basis: oil price
Oil price is important because– It sets the cost of fossil fuels– It influences the cost of virtually all other materials
and services We have considered two oil price scenarios
– 25 €/bbl (30 $/bbl)– 50 €/bbl (60 $/bbl)
All other cost elements are adjusted according to an “Oil Cost Factor” (OCF) representing the fraction of the cost element that will follow the oil price
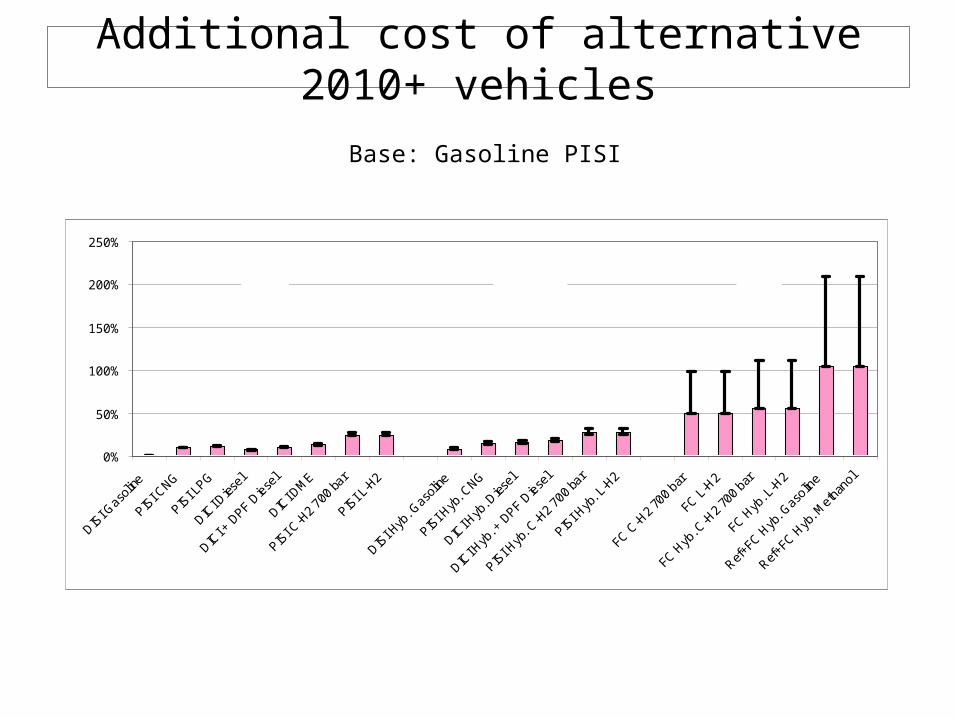
Additional cost of alternative 2010+ vehicles
Base: Gasoline PISI
0%
50%
100%
150%
200%
250%
DISI G
asoli
ne
PISI C
NG
PISI L
PG
DICI D
iesel
DICI +
DPF D
iesel
DICI D
ME
PISI C
-H2
700
bar
PISI L
-H2
DISI H
yb. G
asoli
ne
PISI H
yb. C
NG
DICI H
yb. D
iesel
DICI H
yb. +
DPF D
iesel
PISI H
yb. C
-H2
700
bar
PISI H
yb. L
-H2
FC C
-H2
700
bar
FC L
-H2
FC H
yb. C
-H2
700
bar
FC H
yb. L
-H2
Ref+F
C Hyb
. Gas
oline
Ref+F
C Hyb
. Met
hano
l
ICEs FCsHybrids
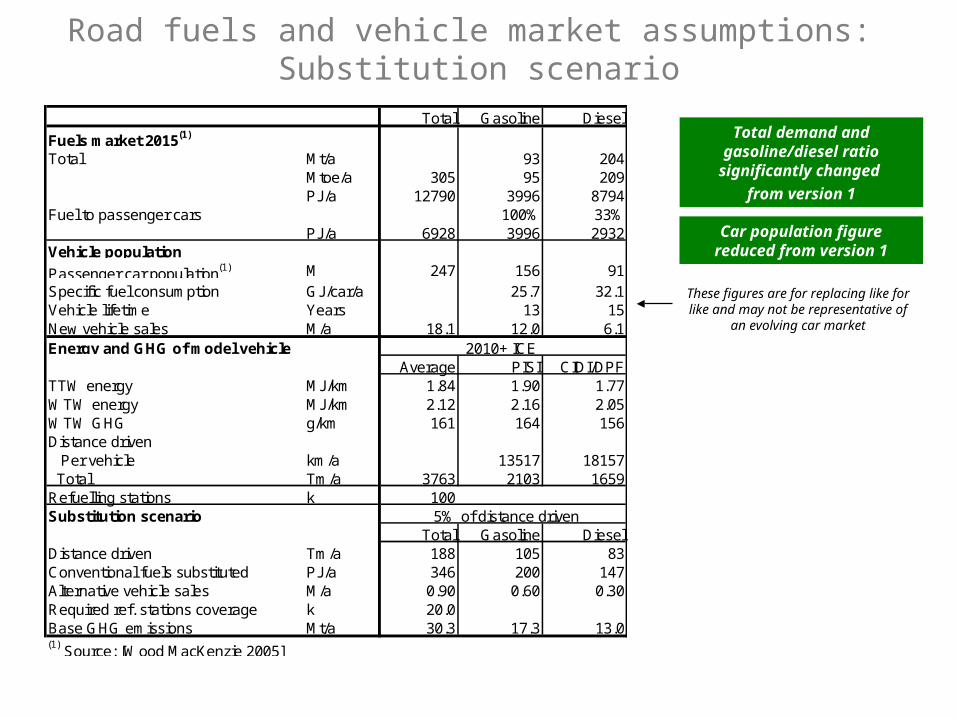
Road fuels and vehicle market assumptions: Substitution scenario
Total Gasoline Diesel
Fuels market 2015(1)
Total Mt/a 93 204Mtoe/a 305 95 209PJ/a 12790 3996 8794
Fuel to passenger cars 100% 33%PJ/a 6928 3996 2932
Vehicle population
Passenger car population(1) M 247 156 91Specific fuel consumption GJ/car/a 25.7 32.1Vehicle lifetime Years 13 15New vehicle sales M/a 18.1 12.0 6.1Energy and GHG of model vehicle 2010+ ICE
Average PISI CIDI/DPFTTW energy MJ/km 1.84 1.90 1.77WTW energy MJ/km 2.12 2.16 2.05WTW GHG g/km 161 164 156Distance driven Per vehicle km/a 13517 18157 Total Tm/a 3763 2103 1659Refuelling stations k 100Substitution scenario 5% of distance driven
Total Gasoline DieselDistance driven Tm/a 188 105 83Conventional fuels substituted PJ/a 346 200 147Alternative vehicle sales M/a 0.90 0.60 0.30Required ref. stations coverage k 20.0Base GHG emissions Mt/a 30.3 17.3 13.0(1) Source: [Wood MacKenzie 2005]
These figures are for replacing like for like and may not be representative of
an evolving car market
Total demand and gasoline/diesel ratio
significantly changed
from version 1
Car population figure reduced from version 1
-200
-100
0
100
200
300
400
0 100 200 300 400 500 600
Total WTW energy (MJ / 100 km)
WT
W G
HG
em
iss
ion
s (
g C
O2e
q /
km
Gasoline
Diesel fuel
LPG
CNG
CBG
EtOH ex SB
EtOH ex wheat
EtOH ex cellulose
EtOH ex sugar cane
MTBE/ETBE
Bio-diesel
Syn-diesel ex NG
Syn-diesel ex coal
Syn-diesel ex wood
DME ex NG
DME ex coal
DME ex wood
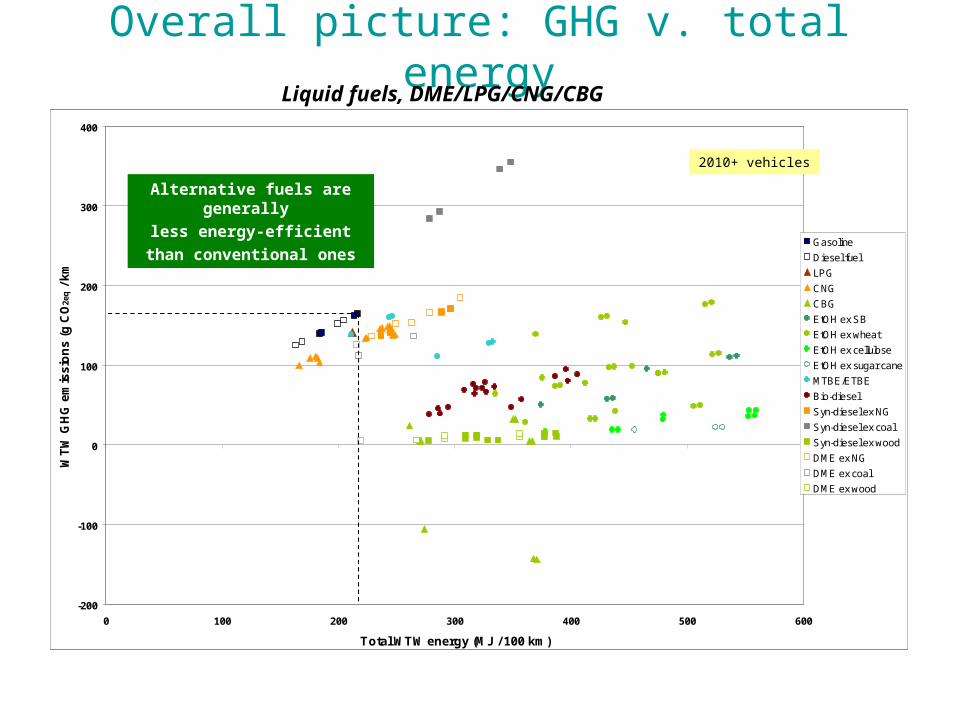
Overall picture: GHG v. total energyLiquid fuels, DME/LPG/CNG/CBG
Alternative fuels are generally
less energy-efficient
than conventional ones
2010+ vehicles
0
100
200
300
400
500
600
700
800
900
0 200 400 600 800 1000 1200
Total WTW energy (MJ / 100 km)
WT
W G
HG
em
iss
ion
s (
g C
O 2eq /
km
Gasoline
Diesel fuel
C-H2 ex NG, ICE
C-H2 ex NG, FC
C-H2 ex coal, ICE
C-H2 ex coal, FC
C-H2 ex wood, ICE
C-H2 ex wood, FC
C-H2 ex NG+ely, ICE
C-H2 ex NG+ely, FC
C-H2 ex coal+ely, ICE
C-H2 ex coal+ely, FC
C-H2 ex wood+ely, ICE
C-H2ex wood+ely, FC
C-H2 ex nuclear elec, ICE
C-H2 ex nuclear elec, FC
C-H2 ex wind elec, ICE
C-H2 ex wind elec, FC
C-H2 ex EU-mix elec, ICE
C-H2 ex EU-mix elec, FC
L-H2 ex NG, ICE
L-H2 ex NG, FC
L-H2 ex wood, ICE
L-H2 ex wood, FC
L-H2 ex EU-mix elec, ICE
L-H2 ex EU-mix elec, FC
L-H2 ex NG+ely, ICE
L-H2 ex NG+ely, FC
L-H2 ex coal+ely, ICE
L-H2 ex coal+ely, FC
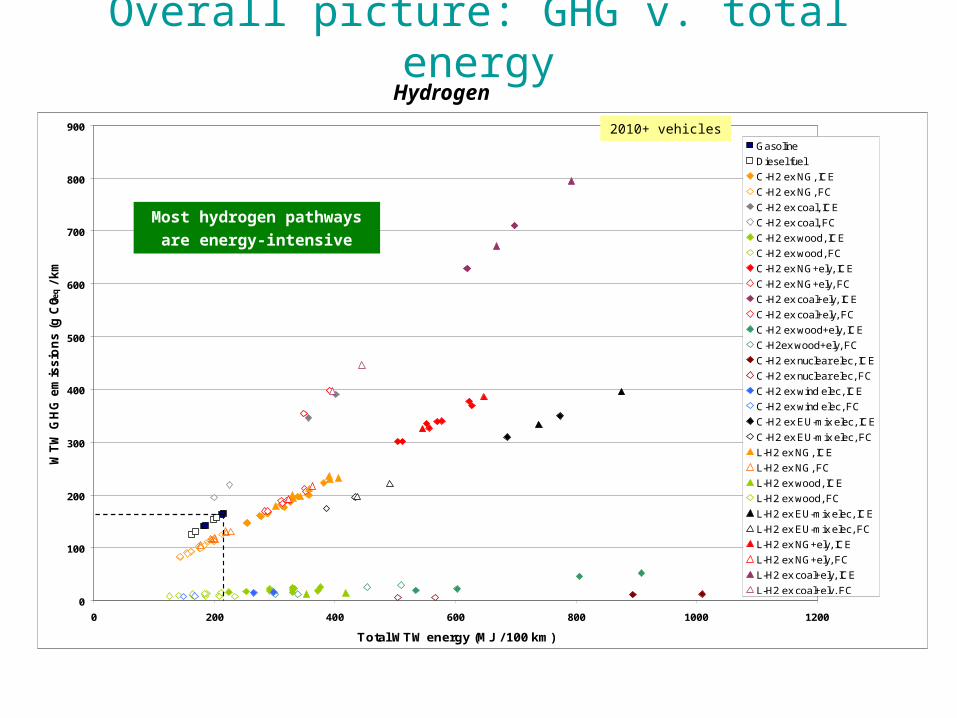
Overall picture: GHG v. total energyHydrogen
Most hydrogen pathways
are energy-intensive
2010+ vehicles
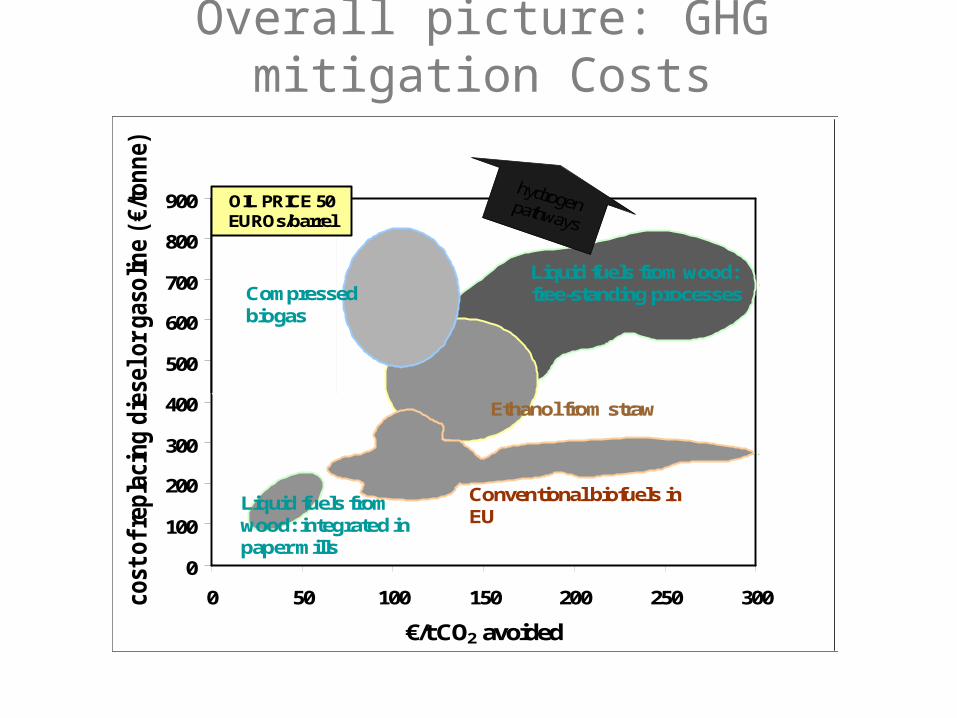
Overall picture: GHG mitigation Costs
0
100
200
300
400
500
600
700
800
900
0 50 100 150 200 250 300
€/t CO2 avoided
€ s
pen
t / to
nne
foss
il fu
el s
ubst
itute
d
DME wood
EtOH sugar beet
EtOH wheat
Bio-diesel (RME)
CNG (4000 km) PISI (BF)
CNG (LNG) PISI (BF)
CBG PISI (BF)
LPG (BF)
Syn-diesel wood BL
DME wood BL
EtOH wood
EtOH straw
Syn-diesel wood
Liquid fuels from wood: integrated in paper mills
Conventional biofuels in EU
Liquid fuels from wood:free-standing processes
Ethanol from straw
OIL PRICE 50 EUROs/barrel
Compressed biogas
cost
of re
pla
cing d
iese
l or
gas
olin
e (€
/tonne)
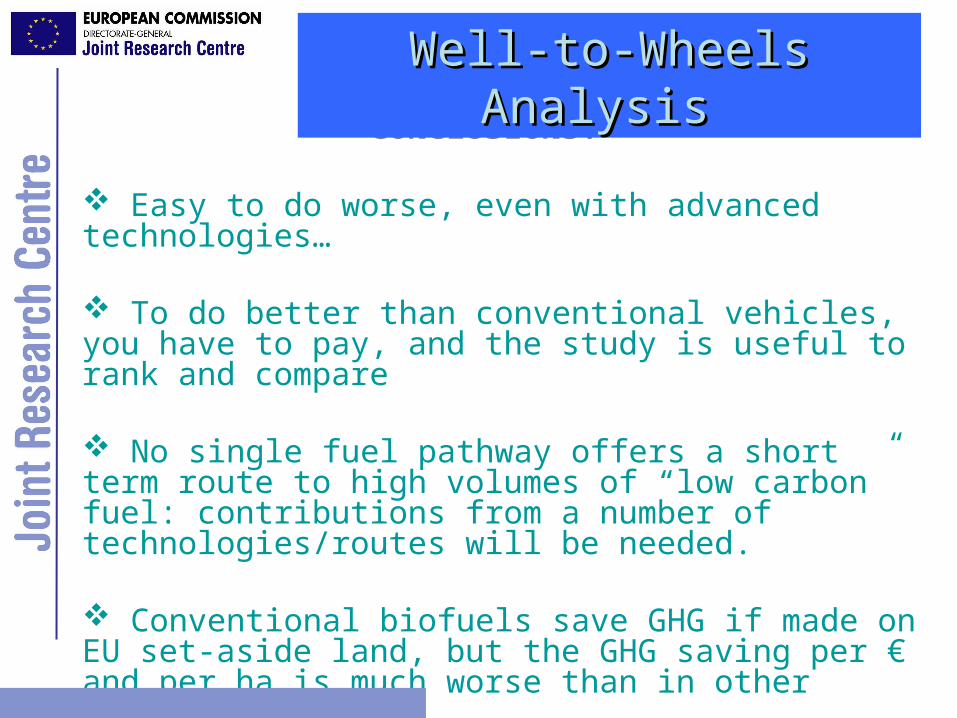
CONCLUSIONS:
Easy to do worse, even with advanced technologies…
To do better than conventional vehicles, you have to pay, and the study is useful to rank and compare
No single fuel pathway offers a short term route to high volumes of “low carbon” fuel: contributions from a number of technologies/routes will be needed.
Conventional biofuels save GHG if made on EU set-aside land, but the GHG saving per € and per ha is much worse than in other sectors
Well-to-Wheels Analysis Well-to-Wheels Analysis
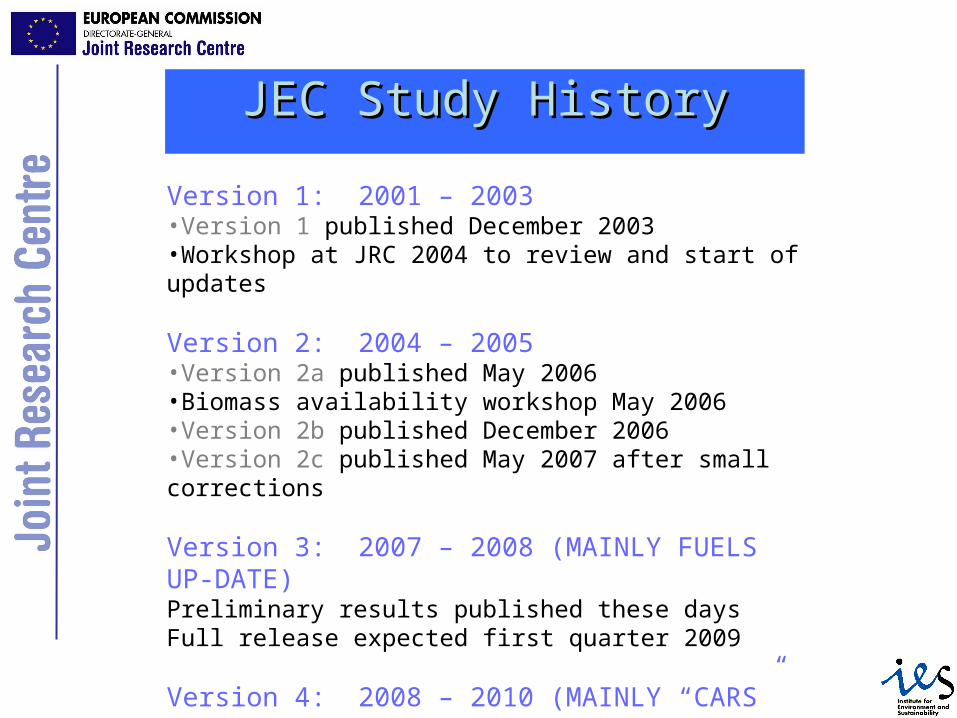
JEC Study HistoryJEC Study History
Version 1: 2001 – 2003•Version 1 published December 2003•Workshop at JRC 2004 to review and start of updates
Version 2: 2004 – 2005 •Version 2a published May 2006•Biomass availability workshop May 2006•Version 2b published December 2006•Version 2c published May 2007 after small corrections
Version 3: 2007 – 2008 (MAINLY FUELS UP-DATE)Preliminary results published these daysFull release expected first quarter 2009
Version 4: 2008 – 2010 (MAINLY “CARS” UP-DATE)Expected first quarter 2010
Download: http://ies.jrc.cec.eu.int/wtw.html
> 40.00040.000 visitors and > 15.00015.000 downloads (latest version)
Better input data TBS to: [email protected] input data TBS to: [email protected]
Well-to-Wheels Analysis Well-to-Wheels Analysis of Future Automotive Fuels and of Future Automotive Fuels and
PowertrainsPowertrains

THETHE
ENDENDMany ThanksMany Thanks
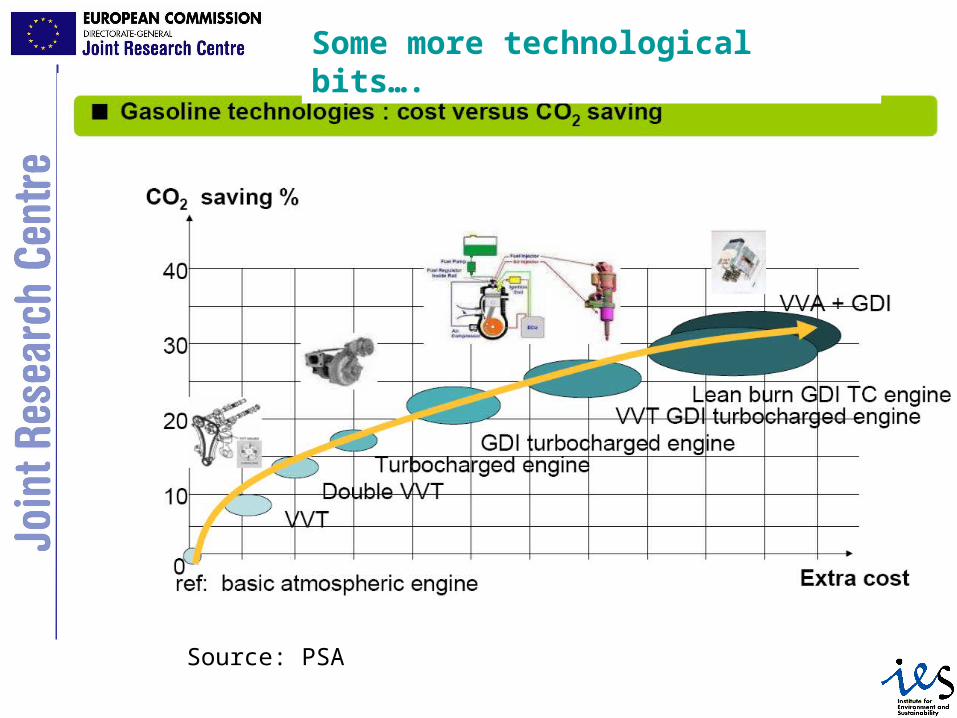
Some more technological bits….
Source: PSA