Embed Size (px)
Citation preview
Graduate Theses, Dissertations, and Problem Reports
2013
Wellbore Stability in Ultra-Deep Formations of the Gulf of Mexico Wellbore Stability in Ultra-Deep Formations of the Gulf of Mexico
Gbenga Kayode West Virginia University
Follow this and additional works at: https://researchrepository.wvu.edu/etd
Recommended Citation Recommended Citation Kayode, Gbenga, "Wellbore Stability in Ultra-Deep Formations of the Gulf of Mexico" (2013). Graduate Theses, Dissertations, and Problem Reports. 3390. https://researchrepository.wvu.edu/etd/3390
This Thesis is protected by copyright and/or related rights. It has been brought to you by the The Research Repository @ WVU with permission from the rights-holder(s). You are free to use this Thesis in any way that is permitted by the copyright and related rights legislation that applies to your use. For other uses you must obtain permission from the rights-holder(s) directly, unless additional rights are indicated by a Creative Commons license in the record and/ or on the work itself. This Thesis has been accepted for inclusion in WVU Graduate Theses, Dissertations, and Problem Reports collection by an authorized administrator of The Research Repository @ WVU. For more information, please contact [email protected].

Wellbore Stability in Ultra-Deep Formations of the Gulf of Mexico
Gbenga Kayode
Thesis submitted to the
Benjamin M. Statler College of Engineering and Mineral Resources at
West Virginia University
in partial fulfillment of the requirements for the degree of
Master of Science
In
Petroleum and Natural Gas Engineering
H. Ilkin Bilgesu, Ph.D., Chair
Samuel Ameri, M.S
Daniel Della-Giustina, Ph.D
Department of Petroleum and Natural Gas Engineering
Morgantown, West Virginia
2013
Abstract
Wellbore Stability in Ultra-Deep Formations of The Gulf of Mexico
Gbenga Kayode
This thesis work looks into Horizontal wellbore integrity or stability in the Mars Ursa Basin of the Gulf of Mexico using different geo-mechanical properties of this highly producing formation in analyzing stress build up both around the producing wells as well as the producing formations. Different cases were analyzed using the CMG simulator where consideration was given to cases of single as well as multiple producing horizontal wells. The model built considered both the basic reservoir model as well as geo-mechanical models. The individual cases considered included different geo-mechanical properties of the producing formation these properties however include frictional angle, cohesion factor, Young Modulus as well as Poison ratio. Models analyzed involved the effect of these different geo-mechanical properties on the maximum stress in the producing formations as well as salty formations. However for the stress analysis, Mohr Coulomb model was used.
Factors that majorly affected maximum stress mostly were found to be frictional angle and the cohesion factors, formation with higher porosity and permeability having higher production developed higher maximum stress compared to low producing zones also high frictional angle at producing formation resulted averagely into lower maximum stress build up while low frictional angle resulted into higher maximum stress build up. Also formation with high cohesion factor shows higher maximum stress build up while those with low cohesion factor shows lower maximum stress build up.
A general trend however observed in all the cases indicated that whatever geo-mechanical factor or combination of these factors satisfy high production rate will generate higher stress build up both around the wellbore and the producing formation .

iii
Acknowledgements
My sincere thanks goes to Dr. H. Ilkin Bilgesu for his help and guidance
throughout my period of study at West Virginia University. He was really a great deal of
help for me, his guidance and counsels really aid the successful completion of this
thesis. I also indeed thank Dr. Samuel Ameri as well as Dr. Daniel Giustina for their
continued support. My thanks also goes to Dr. Jennifer Stueckle as well as Dr.
Constinia Charbonnette without your help, I would not have been able to complete my
study at West Virginia University. Finally, I would also thank my wife, Adeola Kayode
for the assistance, encouragement and support she gave me during my study as well as
my parents Victor and Victoria Kayode.
iv
Table of Contents
Abstract ........................................................................................................................................................ ii
Acknowledgements ................................................................................................................................... iii
Table of Contents ......................................................................................................................................... iv
List of Figures ............................................................................................................................................. v
List of Tables ................................................................................................................................................ ix
Nomenclature .............................................................................................................................................. x
1.0 Introduction ................................................................................................................................... 1
2.0 Literature Review ......................................................................................................................... 3
2.1 Mars-Ursa Basin ......................................................................................................................... 3
2.1.2 Mars Ursa Rock Properties ..................................................................................................... 7
2.2 Effect of Salt in GOM Oil Formations: .......................................................................................... 9
2.2 Effect of Depleted Sand Formations on Wells in GOM ...................................................... 11
2.3 Reservoir Properties of Salty Formation ............................................................................... 12
2.4 Challenges in the Deepwater (Mars Ursa basin)................................................................. 13
2.5 Geographical Impact of Producing Hydrocarbon Formations (Land Subsidence) ......... 13
2.6 Geomechanics .......................................................................................................................... 15
2.7.1 Subsurface Stress .................................................................................................................. 16
2.7.2 Mohr Coulomb Yield Criterion .............................................................................................. 18
3.0 Methodology .................................................................................................................................. 20
3.1 Data ................................................................................................................................................. 20
3.2 Reservoir and Geomechanical Model ........................................................................................ 21
3.2.1 The Reservoir Model.............................................................................................................. 21
4.0 Results and Discussion ............................................................................................................... 24
5.0 Conclusions ................................................................................................................................... 44
Reference .................................................................................................................................................. 46
Additional Literatures Reviewed Include .............................................................................................. 47
Appendix ..................................................................................................................................................... 48

v
List of Figures
Figure 1: The Mars Ursa Basin------------------------------------------------------------------------------------3
Figure 2: Well- log data for the Above Magenta Reservoir Interval--------------------------------------5
Figure 3: Well- log data for the Lower Yellow Reservoir Interval-----------------------------------------5
Figure 4: Porosity and Permeabilty Relationship at the Mars-Ursa Basin------------------------------6
Figure 5: Mars Ursa Formation Pressure (0verpressured zone)-----------------------------------------7
Figure 6: Schematic of deformation surrounding a depleting reservoir-------------------------------14
Figure 7: Vertical , maximum and minimum horizontal stresses-----------------------------------------17
Figure 8: Stages of in formation(rock) Deformation--------------------------------------------------------18
Figure 9: Formation states based on applied stresses----------------------------------------------------18
Figure 10: The Mohr Circle with failure envelope-----------------------------------------------------------19
Figure 11: The stress build-up for case frictional angle 150 Cohesion 0 psia------------------------28
Figure 12: The stress build-up for case case frictional angle 30 0 Cohesion 0 psia----------------29
Figure 13: The Cumulative Oil Production for Well #1 and #2 (frictional angle 15)--------------29
Figure 14: The Cumulative Gas Production for Wells #1 and #2 (frictional angle 15)-----------30
Figure 15: The Cumulative Oil Production for Wells #3 and #4 (frictional angle 15)--------------31
Figure 16: The Cumulative Gas Production for Wells #3 and #4 (frictional angle 15)-----------31
Figure 17: The Cumulative Oil Production for Wells #1 and #2 (frictional angle30)--------------32
Figure 18: The Cumulative Gas Production for Wells #1 and #2 (frictional angle30)------------33
Figure 19: The Cumulative Oil Production for Wells #3 and #4 (frictional angle 30)--------------33
Figure 20: The Cumulative Gas Production for Wells #3 and #4 (frictional angle30 )------------34
Figure 21: The Stress Values for different frictional angles ( Well #1)-------------------------------35
Figure 22: The Stress Values for different frictional angles ( Well #2)--------------------------------35
Figure 23: The Stress Values for different frictional angles ( Well #3)--------------------------------36
Figure 24: The Stress Values for different frictional angles ( Well #4)---------------------------------37
Figure 25: Stress profile for case frictional angle 15 Cohesion 0 for Well #1(After 10 Years) --38

vi
Figure 26: Stress profile for case frictional angle15 Cohesion 0 for Well #1 (After 20 Years) ---38
Figure 27: Stress profile for case frictional angle 15 Cohesion 0 for Well #1 (After 30 Years) --39
Figure 28: Stress profile for case frictional angle 15 Cohesion 0 for Well #3 (After 10 Years) --40
Figure 29: Stress profile for case frictional angle 15 Cohesion 0 for Well #3 (After 20 Years) --41
Figure 30: Stress profile for case frictional angle 15 Cohesion 0 for Well #3 (After 30 Years) --41
Figure 31: Cumulative Oil Production for Cohesion 0 psia of Well #1----------------------------------48
Figure 32: Cumulative Gas Production for Cohesion 0 psia of Well #1--------------------------------48
Figure 33: Cumulative Oil Production for Cohesion 2900 psia of Well #1 ----------------------------49
Figure 34: Cumulative Gas Production for Cohesion 2900psia of Well #1 ---------------------------49
Figure 35: Cumulative Oil Production for Cohesion 4350 psia of Well #1 ----------------------------50
Figure 36: Cumulative Gas Production for Cohesion 4350 psia of Well #1 --------------------------50
Figure 37: Cumulative Oil Production for Cohesion 5800 psia of Well #1 ----------------------------51
Figure 38: Cumulative Gas Production for Cohesion 5800psia of Well #1 ---------------------------51
Figure39: Cumulative Oil Production for Cohesion 0 psia of Well #2 ----------------------------------52
Figure 40: Cumulative Gas Production for Cohesion 0 psia of Well #2--------------------------------52
Figure 41: Cumulative Oil Production for Cohesion 2900 psia of Well #2-----------------------------53
Figure 42: Cumulative Gas Production for Cohesion 2900 psia of Well #2---------------------------53
Figure 43: Cumulative Oil Production for Cohesion 4350 psia of Well #2-----------------------------54
Figure 44: Cumulative Gas Production for Cohesion 4350 psia of Well #2---------------------------54
Figure 45: Cumulative Oil Production for Cohesion 5800 psia of Well #2-----------------------------55
Figure 46: Cumulative Gas Production for Cohesion 5800 psia of Well #2---------------------------55
Figure 47: Cumulative Oil Production for Cohesion 0 psia of Well #3----------------------------------56
Figure 48: Cumulative Gas Production for Cohesion 0 psia of Well #3--------------------------------56
Figure 49: Cumulative Oil Production for Cohesion 2900 psia of Well #3-----------------------------57
Figure 50: Cumulative Gas Production for Cohesion 2900 psia of Well #3---------------------------57
Figure 51: Cumulative Oil Production for Cohesion 4350 psia of Well #3-----------------------------58

vii
Figure 52: Cumulative Gas Production for Cohesion 4350 psia of Well #3---------------------------58
Figure 53: Cumulative Oil Production for Cohesion 5800 psia of Well #3----------------------------59
Figure 54: Cumulative Gas Production for Cohesion 5800 psia of Well #3--------------------------59
Figure 55: Cumulative Oil Production for Cohesion 0 psia of Well #4----------------------------------60
Figure 56: Cumulative Gas Production for Cohesion 0 psia of Well #4--------------------------------60
Figure 57: Cumulative Oil Production for Cohesion 2900 psia of Well #4)----------------------------61
Figure 58: Cumulative Gas Production for Cohesion 2900 psia of Well #4---------------------------61
Figure 59: Cumulative Oil Production for Cohesion 4350 psia of Well #4-----------------------------62
Figure 60: Cumulative Gas Production for Cohesion 4350 psia of Well #4) -------------------------62
Figure 61: Cumulative Oil Production for Cohesion 5800 psia of Well #4----------------------------63
Figure 62: Cumulative Gas Production for Cohesion 5800 psia of Well #4---------------------------63
Figure: 63 Stress profiles after 10 years for Well #1 -------------------------------------------------------64
Figure 64 Stress profiles after 20 years for Well #1 --------------------------------------------------------65
Figure 65 Stress profiles after 30 years for Well #1 --------------------------------------------------------66
Figure 66 Stress profiles after 10 years for Well #2 --------------------------------------------------------67
Figure 67: Stress profiles after 20 years for Well #2 -------------------------------------------------------68
Figure 68 Stress profiles after 30 years for Well #2 -------------------------------------------------------69
Figure 69 Stress profiles after 10 years for Well #3 -------------------------------------------------------70
Figure 70: Stress profiles after 20 years for Well #3 -------------------------------------------------------71
Figure 71: Stress profiles after 30 years for Well #3 ------------------------------------------------------72
Figure 72: Stress profiles after 10 years for Well #4 ------------------------------------------------------73
Figure 73: Stress profiles after 20 years for Well #4 ------------------------------------------------------74
Figure 74: Stress profiles after 30 years for Well #4 ------------------------------------------------------75
Figure 75: Stress profiles after 30 years for Well #1 with frictional angle 15------------------------76
Figure 76: Stress profiles after 30 years for Well #1 with frictional angle 25------------------------77
Figure 77: Stress profiles after 30 years for Well #1 with frictional angle 30------------------------78
Figure 78: Stress profiles after 30 years for Well #1 with frictional angle 35------------------------79

viii
Figure 79: Stress profiles after 30 years for Well #2 with frictional angle 15-------------------------80
Figure 80: Stress profiles after 30 years for Well #2 with frictional angle 25-------------------------81
Figure 81: Stress profiles after 30 years for Well #2 with frictional angle 30-------------------------82
Figure 82: Stress profiles after 30 years for Well #2 with frictional angle 35-------------------------83
Figure 83: Stress profiles after 30 years for Well #3 with frictional angle 15-------------------------84
Figure 84: Stress profiles after 30 years for Well #3 with frictional angle 25-------------------------85
Figure 85: Stress profiles after 30 years for Well #3 with frictional angle 30-------------------------86
Figure 86: Stress profiles after 30 years for Well #3 with frictional angle 35-------------------------87
Figure 87: Stress profiles after 30 years for Well #4 with frictional angle 15-------------------------88
Figure 88: Stress profiles after 30 years for Well #4 with frictional angle 25-------------------------89
Figure 89: Stress profiles after 30 years for Well #4 with frictional angle 30------------------------90
Figure 90: Stress profiles after 30 years for Well #4 with frictional angle 35-------------------------91

ix
List of Tables
Table 1: Geomechanical Parameters used in this study -------------------------------------23
Table 2: Impact of cohesion and frictional angle on maximum stress for Well #1------24
Table 3: Impact of cohesion and frictional angle on maximum stress for Well #2------25
Table 4: Impact of cohesion and frictional angle on maximum stress for Well #3------25
Table 5: Impact of cohesion and frictional angle on maximum stress for Well #4------26

x
Nomenclature
P.R = Poison Ratio
ε = Strain
E = Young’s Modulus
ΔL = Change in Length
Ao = Area, acre
Q= Activation Energy for Creep
R= Universal gas constant
T= Temperature
σ1 or σv= Minimum Normal (Vertical) Stress
σ2 or σH = Maximum Horizontal Stress
σ3 or σh = Minimum Horizontal Stress
D= Depth, ft
H= Height or Thickness of formation, ft
Ro = Radius of the reservoir, ft
Ʈf = Frictional Stress
μ = Coefficient of Internal Friction
θ= Frictional Angle
NC = Carbon content of hydrocarbon

1
1.0 Introduction
The Gulf of Mexico has recently become a major oil producing region in the USA
and until this date, many discoveries have been made containing an estimated 10 billion
barrels of potential resources where about 30 billion barrels are still waiting to be
discovered. Fields in the Gulf of Mexico are also highly productive as some major
leading oil companies like BP, Shell and Chevron have made some discoveries with
production capacity of about 50,150 STB/D from just a single well in the Ursa basin.
This discoveries and production from the GOM have really helped boost and increased
the amount of oil and gas the United States produces yearly.
Oil and gas production in the Mars Ursa field began early in the year 1996 and
came to its peak around 2000 at around 150,000 STB/D of oil and 217 MMSCF/D of
gas. This field is expected to still produce for another 50 years. As of 2010, about 24
slot Tension Leg Platform (TLP) have been use in the development of this field while a
new TLP are still been planned to increase the number of wells in this field.
The Mars Ursa field consists basically of Miocene to Pliocene turbodite sands
deposited within a mini basin, bordered by a canopy or a salt dome which is a good
sealing for hydrocarbons and prevent the hydrocarbons from escaping to the seafloor.
This field contains about 14 major reservoirs and 10 minor zones. As a result of
absence of water influx and highly over-pressured and highly under-saturated
reservoirs, the field qualifies as a secondary recovery field. It has good permeability
both in horizontal and vertical directions. All these attributes qualifies this field as a
major oil producing field in the Gulf of Mexico (GOM).

2
With all the above mentioned qualities and profit from the ultra-deep oil formation
in the Mars Ursa basin as well as some other ultra-deep oil formations in the GOM,
there is a challenge in accessing these deep formations as overburden stress increases
pressure to around 20,000 psi in some cases. Drilling and producing from these
formations poses lots of challenges to the wellbore and life of the well. Therefore there
is the need for effective study of the stability of the wells installed in these ultra-high
pressured formations.

3
2.0 Literature Review
2.1 Mars-Ursa Basin
Mars Ursa Basin is predominantly a salt-formation mini-basin and located about
210 kilometers (130 miles south-southeast of New Orleans, Louisiana on the
Northeastern Gulf of Mexico continental slope in about 800-1400 meters (2600 – 4600
ft) of water (Sawyer, 2006). Figure 1 below shows the Mars Ursa location in the Gulf of
Mexico.
Figure 1: The Mars Ursa Basin
(Moore et. al. 2011)

4
The Mars Ursa region, geologically a late Pleistocene region originated from deposition
from the Mississippian river drainage system. At the East of the Mars Ridge, the
seafloor has been observed to slope downward to a zone prevalent of mass transport
deposits. These deposits however are characterized by channel-levee systems which
filled and bypass the region with thick deposits. From the oldest to youngest and east to
west of these deposits are the Ursa, Southwest Pass, Old Timbalier and Young
Timballier systems ( Sawyer, 2006). This channel levee system has been the major
factor that aided the transportation of material from the continental margin to the
Missisipian fan.
2.1.1 Mars Ursa Reservoir Properties
Two basic intervals were considered in the study. First the Above-magenta
formations as well as the Lower-yellow formation as these intervals were found to be
rich in hydrocarbons.
The “Above magenta” formation was interpreted to be an amalgamated channel (
Meckel et. al. 2002).The reservoir occurs as a sheet channel couplet in the continuous
parallel facies and also characterized by a relatively high porosity while the lower yellow
formation is characterized by channels cutting through it. The channels connect two
major reservoirs and possess relatively high porosity value. Figures 2 and 3 below show
gamma ray, resistivity as well as porosity values in these different formations that is
under consideration.

5
Figure 2: Well- log data for the Above Magenta Reservoir Interval ( Batzel et. al. 2006)
Figure 3: Well- log data for the Lower Yellow Reservoir Interval ( Batzel et. al. 2006)
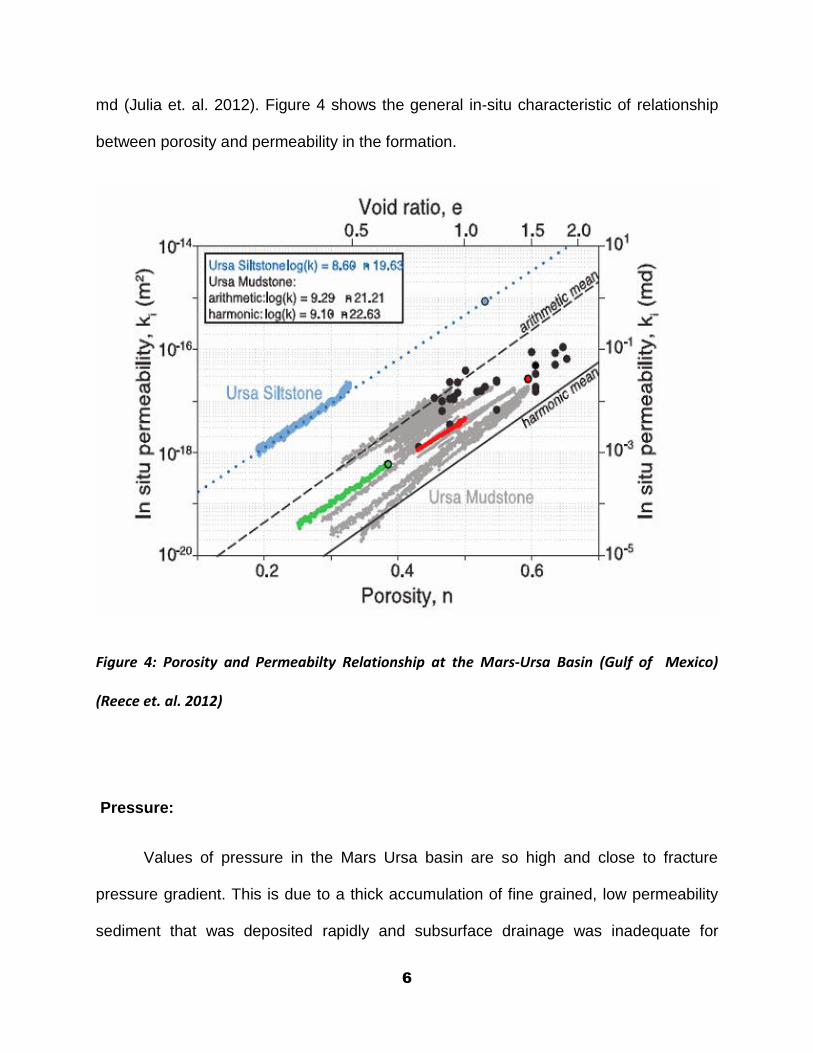
Vertical permeability values in the Mars Ursa basin is found to be around 7.7 x
10-17 m2 (0.0780 md) and 8.5 x 10 -19 m2 (0.0086 md) while horizontal permeability
values were found to correspond with porosity and ranges from around 10-3 md to 102
6
md (Julia et. al. 2012). Figure 4 shows the general in-situ characteristic of relationship
between porosity and permeability in the formation.
Figure 4: Porosity and Permeabilty Relationship at the Mars-Ursa Basin (Gulf of Mexico)
(Reece et. al. 2012)
Pressure:
Values of pressure in the Mars Ursa basin are so high and close to fracture
pressure gradient. This is due to a thick accumulation of fine grained, low permeability
sediment that was deposited rapidly and subsurface drainage was inadequate for

7
excess pore pressure to dissipate. This led to the overpressured zones at the shallow
part of the Mars Ursa Basin. Figure 5 below shows overpressured zones at the Mars
Ursa Basin.
Figure 5: Mars Ursa Formation Pressure (0verpressured zone) (Batzel et. al. 2006)
2.1.2 Mars Ursa Rock Properties
Rock properties are very essential to analyze geomechanical effects in the
formation as well as around wellbore after years of producing. Basically, geomechanical
properties of any rock formation are obtained through well logs and these properties
include Young’s Modulus, Cohesion, Poisson’s ratio and Frictional Angle. All these
factors are used in this study to estimate the maximum stress build up in the formation
as well as around each well in the course of production.
8
Poisson’s Ratio
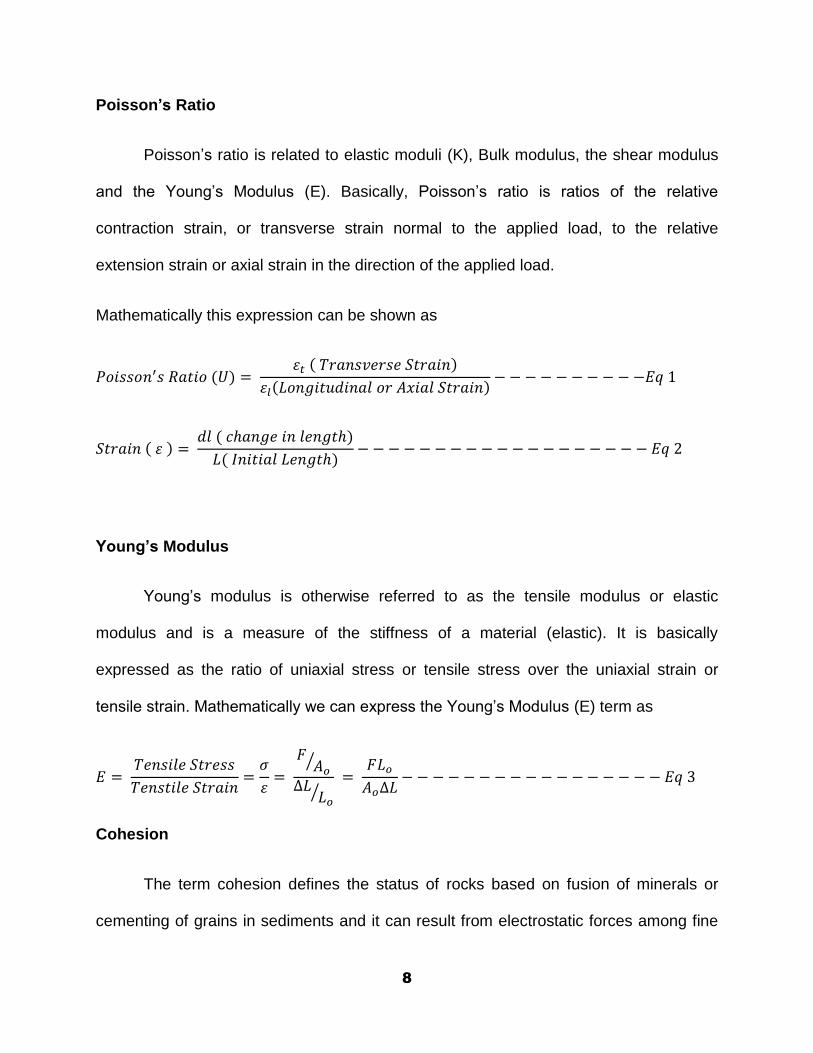
Poisson’s ratio is related to elastic moduli (K), Bulk modulus, the shear modulus
and the Young’s Modulus (E). Basically, Poisson’s ratio is ratios of the relative
contraction strain, or transverse strain normal to the applied load, to the relative
extension strain or axial strain in the direction of the applied load.
Mathematically this expression can be shown as
Young’s Modulus
Young’s modulus is otherwise referred to as the tensile modulus or elastic
modulus and is a measure of the stiffness of a material (elastic). It is basically
expressed as the ratio of uniaxial stress or tensile stress over the uniaxial strain or
tensile strain. Mathematically we can express the Young’s Modulus (E) term as
⁄
⁄
Cohesion
The term cohesion defines the status of rocks based on fusion of minerals or
cementing of grains in sediments and it can result from electrostatic forces among fine

9
particles especially clay and water. However, in geomechanics, cohesion occurs when
cemented surfaces are sheared. Using the Mohr Coulomb Circle, cohesion is
determined as the intercept on the Shear stress (Ʈ) axis at zero normal stress.
For this study, we have used ranges of cohesion between 2x10⁷ Pascal (2800 psi) and
4 x 10⁷ Pascal (5800 psi) in estimating the maximum stress developed in the formation.
Frictional Angle
Frictional angle is a measure of the shear strength of materials including rocks,
and sand and simply defined from the Mohr- Coulomb failure. It is the angle of
inclination with respect to the horizontal axis of the Mohr Coulomb shear resistance line.
For this study, frictional angles in the range of 150 to 350 were used to calculate the
maximum stresses that will develop in the formation.
2.2 Effect of Salt in GOM Oil Formations:
Hydrocarbon deposits in the Gulf of Mexico are basically under salt diapirs. They
occur in multitiered sheets which are interconnected by vertical and inclined salt
feeders. A major concern or a major hazard in a salty formation like the Mars Ursa
Basin is that they can creep when subjected to stress. This effect of psuedoplastic flow
caused by overburden pressures, and combined with temperature in the subsurface
with low permeability may close up or collapse a new wellbore.
Salt creep involves two or three stages. When the confining pressures are less
than 5 Mpa (725 psi) where strain begins at a very high rate and then decreases to a
10
constant rate. The second stage is as a result of salt deforming at a constant rate and
during the third stage, the strain rate increases until failure occurs. (Perez et. al. 2008),
Factors that are responsible for salt creep behavior include salt thickness, mineralogy,
water content and impurities. Salt creep has been responsible for casing collapse in a
number of Gulf of Mexico wells.
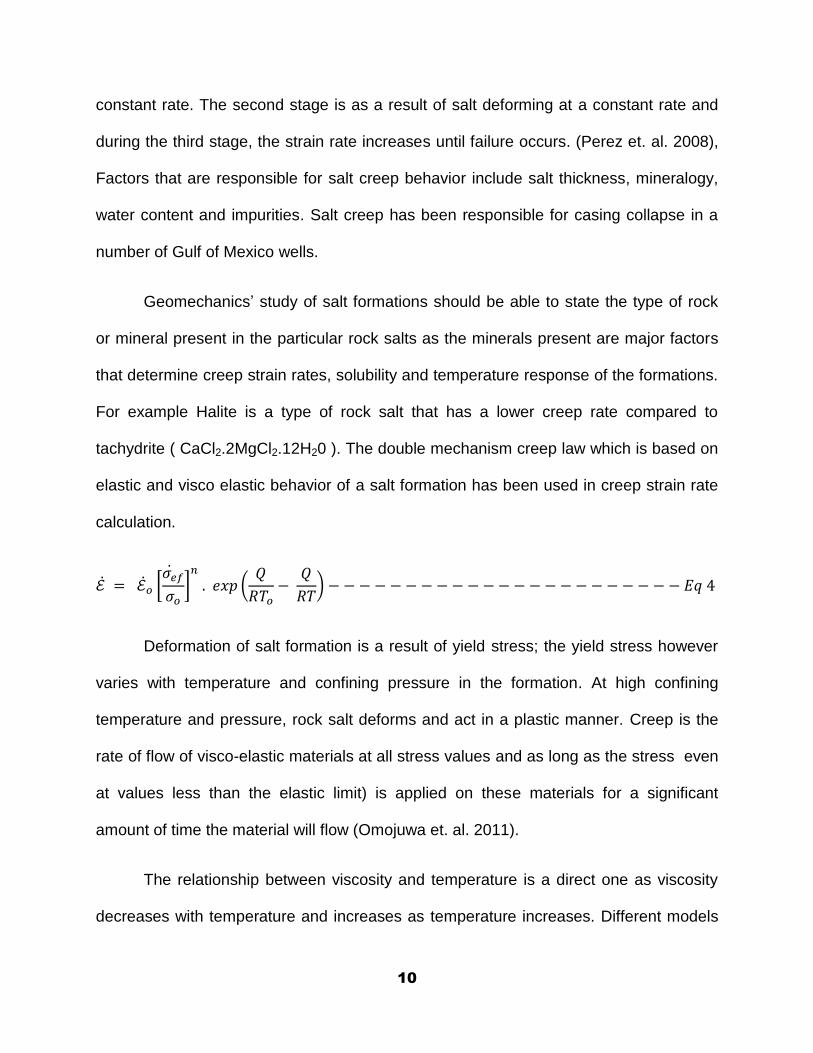
Geomechanics’ study of salt formations should be able to state the type of rock
or mineral present in the particular rock salts as the minerals present are major factors
that determine creep strain rates, solubility and temperature response of the formations.
For example Halite is a type of rock salt that has a lower creep rate compared to
tachydrite ( CaCl2.2MgCl2.12H20 ). The double mechanism creep law which is based on
elastic and visco elastic behavior of a salt formation has been used in creep strain rate
calculation.
[
]
(
)
Deformation of salt formation is a result of yield stress; the yield stress however
varies with temperature and confining pressure in the formation. At high confining
temperature and pressure, rock salt deforms and act in a plastic manner. Creep is the
rate of flow of visco-elastic materials at all stress values and as long as the stress even
at values less than the elastic limit) is applied on these materials for a significant
amount of time the material will flow (Omojuwa et. al. 2011).
The relationship between viscosity and temperature is a direct one as viscosity
decreases with temperature and increases as temperature increases. Different models

11
have been used in estimating stresses, strains and strain rates in salt formations; these
include Von Moses Criterion, octahedral-stress theory and Maxwell linear creep
equations.
√
√
⁄ √
The mean stress measures the tension or compression a particular body is subjected
while octahedral shear stress measures the deformation stress a body is undergoing
and the elastic strain is that in which a distorted body returns to its original shape of
form when the deformation is removed. Combination of all these stresses are needed in
estimating the total stress as well as strain that will develop in formations with salt
during production period.
2.2 Effect of Depleted Sand Formations on Wells in GOM
Although salt formations contribute to the major challenge of wellbore instability
in deep hydrocarbon formations in the Gulf of Mexico, another factor that causes
wellbore instability mainly during drilling operations is when drilling through regions
whose pore pressures have been reduced by offset production to a value lower than
that existing at discovery. The reduction in pore pressure is mainly as a result of
reduction in horizontal stress. This effect however is well recognized from hydraulic
fracture treatments in fields that have been in production for certain amount of time

12
(Willson et.al.2003). Reduction in fracture gradient has always been a problem in drilling
these formations and has caused losses of several barrels of mostly oil-based drilling
fluids. (Willson et.al. 2003). This problem is usually addressed by augmenting the
fracture gradient using loss reducing additives as well as chemical consolidation of the
depleted sand zones.
2.3 Reservoir Properties of Salty Formation
A major characteristics of rock salt is it’s low porosity in the range of less than
0.5% to 1% while permeability values are about 10-20m2 (about 10 nanodarcy). This
property has been a major factor helping rock salt in acting as a long term storage
facility for oil and gas (hydrocarbons). Low permeability and porosity properties are
however also causes of tendency for plastic and creep behavior even at low stress
levels.
Low permeability values in salt formations are a major cause of overpressure as
this (low permeability) effect prevents pore fluids in the underlying formation from
escaping and as a result they become trapped and abnormally pressured (over-
pressured). Salty formations also absorb surrounding stresses from above layers and
transferring these in three directions to achieve equilibrium. This however always leads
to increase in horizontal stresses in values greater than or equal to overburden stress.
Thus, for wellbores around or close to salty formations like the Mars Ursa Basin, there is
the need to use highly rated and collapse resistant casings.
According to (Yildiz and Soganci 2010), layers of sediments in salt formations are
graded from hard (at the bottom) to soft (at the top). The layers are separated from each

13
other with interfaces thereby creating weaker connections between the top layers and
stronger connections at the bottom layers.
2.4 Challenges in the Deepwater (Mars Ursa basin)
A major characteristic of the deepwater Gulf of Mexico hydrocarbon formation is
the presence of overpressured reservoirs. Sedimentation rate exceeds the ability of
sediments to drain in rapidly formed basins. This as a result causes overpressure in
pore fluid as it supports overlying materials and sediment is under-consolidated.
(Flemings et. al. 2002). Over-pressured and unconsolidated factors in these formations
often result to highly compacting reservoirs generating significant natural reservoir drive
as well as fluid expansion and water influx.
Drilling these very deep hydrocarbon formations is a major challenge as some of
these hydrocarbon layers have been found at depths close to around 28000 ft to 34,158
ft. Drilling to these depths encounter very high pressure and temperature (HP/HT)
conditions (Lach 2010). Another major challenge in the Mars Ursa Basin also was
drilling closely spaced holes while preventing fracturing or weakening of the formation
as well as being able to keep the drilled holes open long enough before the installation
of casings.
2.5 Geographical Impact of Producing Hydrocarbon Formations (Land
Subsidence)
Production of hydrocarbons in the coastal regions of the United States have been
known to induce faults into surrounding formations where hydrocarbons are produced
and this has always led to land subsidence . A case study on the Louisiana coast was

14
done recently and results proved that induced- seismic activity occurred in these
formations as a result of sub-surface fluid injection as well as hydrocarbon withdrawal.
The study demonstrated that the number of seismic events in proximity of producing oil
or gas field increases significantly after production or injection began (Chan and Zoback
2007)
The study indicated that mechanical instability which is induced as result of fluid
injection is related to the increase in pore pressure. This however allows for slip on pre-
existing faults which is caused by lowering the effective normal stress. As shown in
Figure 6 below, slips on these faults leads to faults in formation.
Figure 6: Schematic of deformation surrounding a depleting reservoir (Segall 1989)
Geertsma (1972) developed a solution relating to land subsidence as a result of
producing hydrocarbons from underground formations shown below
⁄
15
⁄
Where D, H and R are the depth, thickness and radius of the reservoir, respectively.
uz is the magnitude of surface subsidence while ΔPp is a function of pressure change.
The equation presents the relationship for the amount of subsidence observed in any
producing formation as related to changes in pressure, depth, thickness and radius of
drainage of the producing formation. This however shows the effect of these other
parameters on the would-be subsidence.
Depletion or removal of hydrocarbons from producing formations also leads to
changes in stresses around the reservoir and as a result, slip on faults outside the
reservoir may result. The stress change however leads to fault reactivation in the
proximity of the reservoir and eventually to reverse faulting either above or below the
reservoir column while normal faulting occurs near the edge of the reservoir. (Chan and
Zoback 2007).
2.6 Geomechanics
Geomechanics is the geologic study of rocks and soil behaviour when subjected
to different stress conditions. Basically this involves soil mechanics as well as rock
mechanics. While soil mechanics deal with the behavior of soil from a small scale to a
landslide scale, rock mechanics deal with geosciences relating to rock mass
characterization as well as rock mass mechanics.
The state of equilibrium in any rock formation is always disturbed by drilling,
production and injection of fluids at certain high pressures. These activities always

16
result in changes in the mechanical state of these rocks and can impact drilling
operations, completions infrastructure as well as quality and quantity of hydrocarbon
production from these formations.
2.7.1 Subsurface Stress
Stresses acting on any particular formation vary in origin, magnitude and
direction. Natural, in-situ vertical stresses occur primarily from the weight of overburden.
Horizontal stresses have gravitational components that are enhanced by tectonics
thermal effects and geological structure. Factors that can also influence stresses in any
formation include the lithology, pore pressure and temperature. Stress, force acting on
an area is made up of normal and shear components. Normal stress is that acting
perpendicularly to a plane or rock surface shown in figure 7 below, shear stress is that
acting along the surface of the plane. Magnitude as well as orientation of stress in the
earth change with the structural dip of the formation, faults, salt diapirs, mountains and
other complex structures can also be responsible for this phenomenon. As continued
deposition leads to greater depth of burial, overburden stress increases. This always
lead to a situation where the horizontal stress changes causing the formation to spread
out laterally but these changes ( deformation) are always confined by adjacent
formations.

17
Figure 7: Vertical , maximum and minimum horizontal stresses (Cook et. al. 2007)
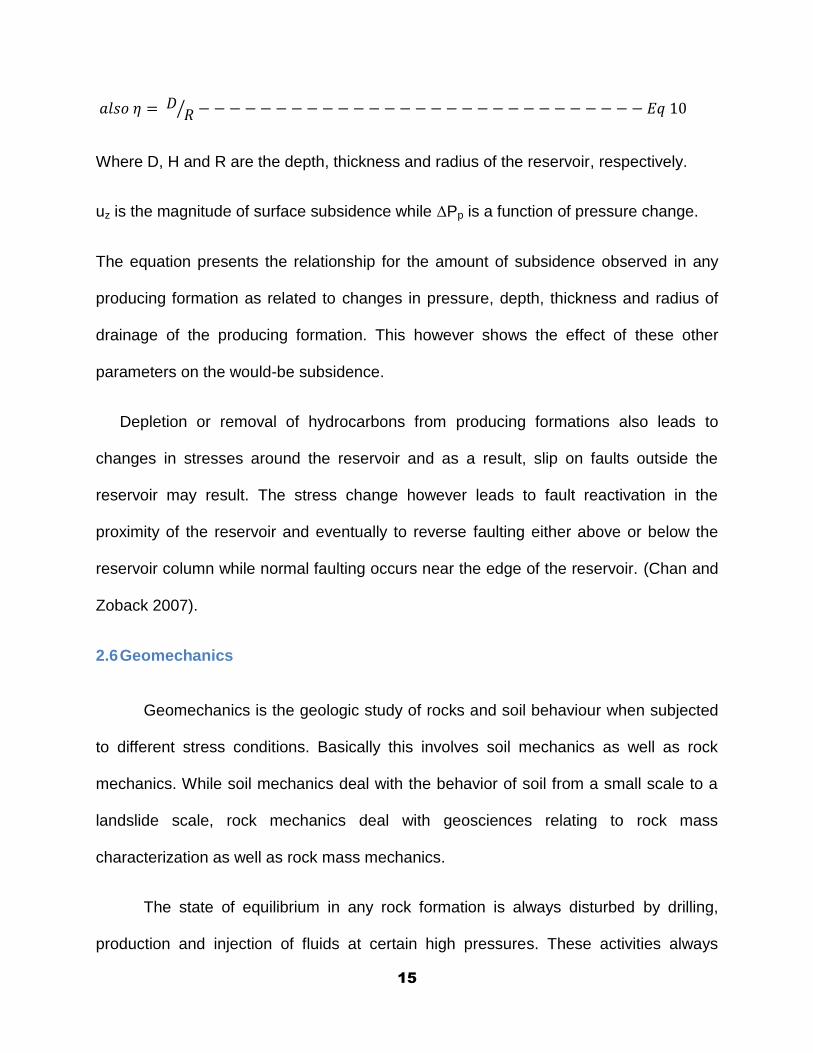
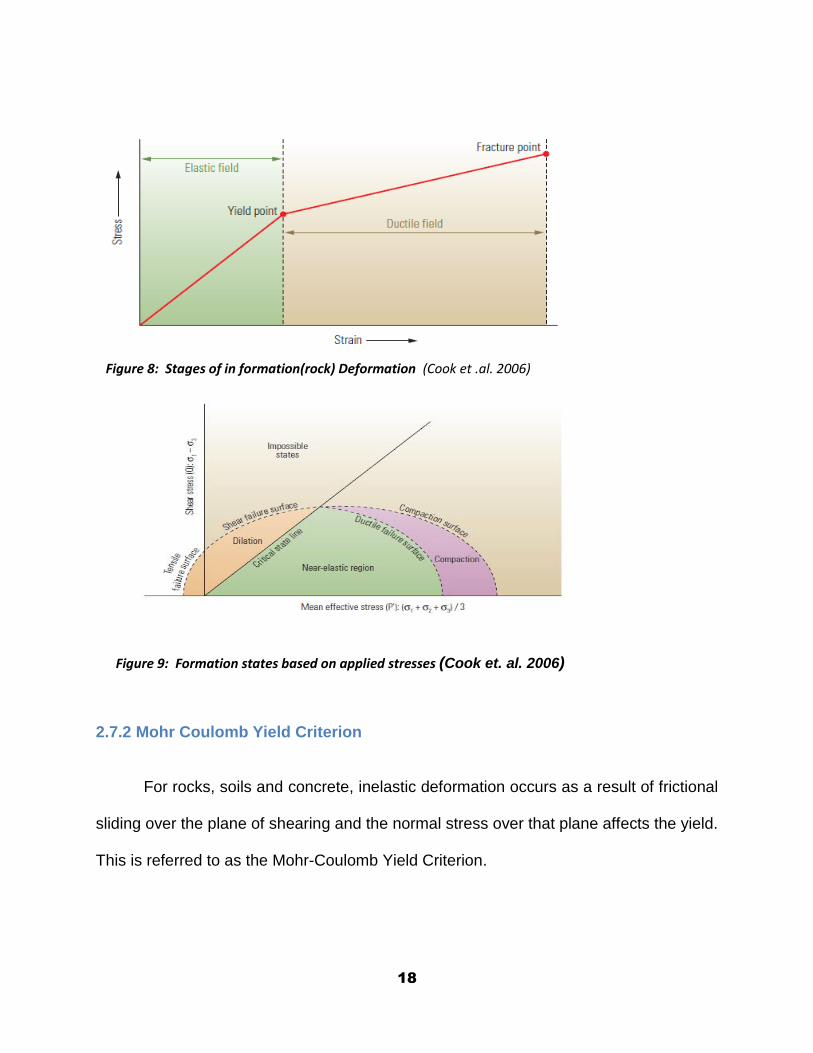
A rock body responds to stress from various modes of strain or deformation
which results in different changes from volume to shape as well as properties of the
rock. The different stages of change (deformation) range from reversible (elastic
deformation) to permanent (plastic deformation) before eventually ending up in the
failure stage of the rocks. Deformation resulting from compression can lead to
compaction, extension, translation or rotation and eventually ends up in the shearing,
fracturing or faulting stage as seen in Figures 8 and 9 below. Rock’s response to these
stresses also depends on some other factors including rock type, cementation, porosity,
and depth of burial.
18
Figure 9: Formation states based on applied stresses (Cook et. al. 2006)
2.7.2 Mohr Coulomb Yield Criterion
For rocks, soils and concrete, inelastic deformation occurs as a result of frictional
sliding over the plane of shearing and the normal stress over that plane affects the yield.
This is referred to as the Mohr-Coulomb Yield Criterion.
Figure 8: Stages of in formation(rock) Deformation (Cook et .al. 2006)

19
Failure occurs if the Mohr’s circle corresponding to the stress state based on
values of maximum vertical stress, minimum and maximum horizontal stresses touch
the Mohr’s envelope shown in Figure 10 as a failure line (envelope).
Where
ɸ, angle of internal friction and c is cohesive strength of the material
μ* = Coefficient of friction
Stress values relating to points at which the failure line represented by equation of a
straight line ( ) touches the circle indicates stresses at which the particular
material will fail or collapse.
(Failure Line)
Figure 10: The Mohr Circle with failure envelope (Hooke and Hansen 2005)
20
3.0 Methodology
The objective of this research was to conduct geomechanical analysis in wells drilled
in the ultra-deep zones of the Gulf of Mexico. Wellbore stability based on maximum
stress build up around the wellbore as well as in the formation is the major concern
addressed in this study. The Gulf of Mexico has been known to contain large
hydrocarbon reserves but majority of these are below zones buried under salt
formations due to salt’s ability to exhibit characteristics of low permeability and acting as
a very good seal for hydrocarbons in such ultra-deep zones. Although field production
data was not readily available, reservoir data used for the model were obtained from
different published articles and sources.
Major steps applied in obtaining the required results include acquiring data, building
the reservoir model as well as the geomechanical model and running the simulation
cases for each well in the reservoir. The simulation was run using the CMG program for
thirty years in order to understand the long term effect of the salty sealing formation
around the wellbores as well as production decline for each case being considered.
3.1 Data
Using inaccurate data may be a major hindrance in obtaining accurate result
from the simulation runs; therefore there is the need to conduct extensive and broad
research in obtaining accurate data that fully and readily represent the model as well as
the formation under investigation. Majority of the wells in the Mars Ursa basin were
drilled by Shell PLC and data for these wells are not readily available so other sources
were used in obtaining these data. Sources mostly used were those from papers

21
published by AAPG (American Association of Petroleum Geologist) and SPE (Society of
Petroleum Engineers) about the Mars Ursa Basin.
Logs (Batzel et. al. 2006) were used in obtaining porosity, permeability as well as
hydrocarbon thickness used at different sections of the reservoir model. For the
geomechanical model, rock properties were obtained from geomechanical logs.
3.2 Reservoir and Geomechanical Model
Both reservoir and geomechanical models were built and used for the simulation
runs. The reservoir was built first and then the geomechanical model was coupled to the
reservoir model for geomechanical analysis. Of major importance to the reservoir model
are rock and fluid data, well data, thickness data as well as porosity and permeability
data.
3.2.1 The Reservoir Model
Based on data from the Mars Ursa Basin the reservoir model was developed
with fourteen layers in which the major hydrocarbon producing layers were located in
layers two, three, eleven and thirteen. Wells named as “Well #1”, “Well #2”, “Well #3”
and “Well #4” were placed into layers “2”, “3” ,”11” and “13” respectively. The top most
layers are basically the shallow hydrocarbon formations while the bottommost are
basically the very deep formations well below the salt layers.
The cell block dimensions for the model were basically squares of 167 ft on each
side with a length of approximately 5000 ft by 5000 ft for the entire reservoir. Horizontal

22
length for each well in the reservoir formation extended up to 4500 ft where each cell
block was perforated.
For this study, a deep formation was chosen to represent formations where the
pressure is extremely high and also close to the salt formation to account for the effect
of the overlying salt formation on the stress build up around the wellbore. Thickness of
formation at the sections of the reservoir at shallow part of the reservoir is around 70 ft
while at the very deep section is around 60 ft (Batzel et. al.2006).
Permeability and porosity values are considerably high in the Mars Ursa Basin
which is common in the Gulf of Mexico. This formation does not require fracking before
production and as a result, fracking was not considered in this study. Porosity values in
the formation range from around 10% to 35% while permeability values range from
around 10 md to 50 md in the oil producing formations. In the salt formation,
permeability value is extremely low around 10 nD (Omojuwa and Osisanya 2011). The
study also considered the use of horizontal wells as this is the prevailing situation in the
Mars Ursa Basin (Anderson & Boulanger 2001).
A horizontal well length of around 4500 ft was used in this study for stress build
up around the wells close to the salt formation. More focus is placed on geomechanical
analysis and wellbore length and some other properties were kept constant. All the cell
blocks (30) along the I-axis covering the horizontal leg length of the wellbore were
perforated to have the maximum hydrocarbon production from the wells. Wellbore
radius of 0.25 ft and bottom hole pressure of 100 psi were used in all runs.

23
Considering the reservoir composition, a range from very heavy hydrocarbon of
5% n-C10, 5% n-C7, 20% n-C4 and 70% “CH4” (Methane) was used in the model as this
reservoir combines both liquid or heavy oil and gas. Water saturation value of 35% was
used for the reservoir model. The Pressure in the Mars Ursa Basin is extremely high in
the overpressure zones and this has always been a major concern during the drilling
program. The pressure values in hydrocarbon formations close to shale or salt
formation could rise as high as 12000 psi to around 15000 psi (Meckel et.al. 2002). In
this study, 12000 psi was used to represent the over-pressured regions or formations in
the evaluation of stress build up in the reservoir.
The frictional angle values used range between 15o to 35o while cohesion factor
range between 2500 psia to around 5800 psia. The poison’s ratio used for salt, shale
and sand formations were 0.25, 0.3 and 0.2 respectively. Young Modulus values were
also varied accordingly to the formations where 6.00E+09 Pa is used for sandy
formations, 8.00E+09 Pa (11.5 x 10⁴psi ) is used for shales and 3.10E+09 Pa
(5.13x10⁴psi) is used for salt .
The data used in the runs are summarized in Table 1
Formation
Young’s
Modulus(Pa)
Poisson
Ratio
Cohesion
(Psia)
Friction Angle
(degrees)
Sand 6.00E+09 Pa 0.2 2500-5800 15o-35o
Shale 8.00E+09 Pa 0.3 2500-5800 15o-35o
Salt 3.10E+09 Pa 0.25 2500-5800 15o-35o
Table 1: Geomechanical Parameters used in this study
24
4.0 Results and Discussion
Based on the results obtained from simulation runs, it is observed that geo-
mechanical properties of oil bearing formations have a significant impact on stresses
around the wellbore as well as in the surrounding formations. It was also observed that
areas or regions close to the salty formations showed considerable high stress
development around them compared to other formations. A significant factor that could
also increase maximum stress build up around the well is the amount of fluid produced.
As observed, those “stress” levels increases as production increases. Four wells
located at different depths were considered in this study and runs were conducted with
four different values of cohesion and frictional angles.
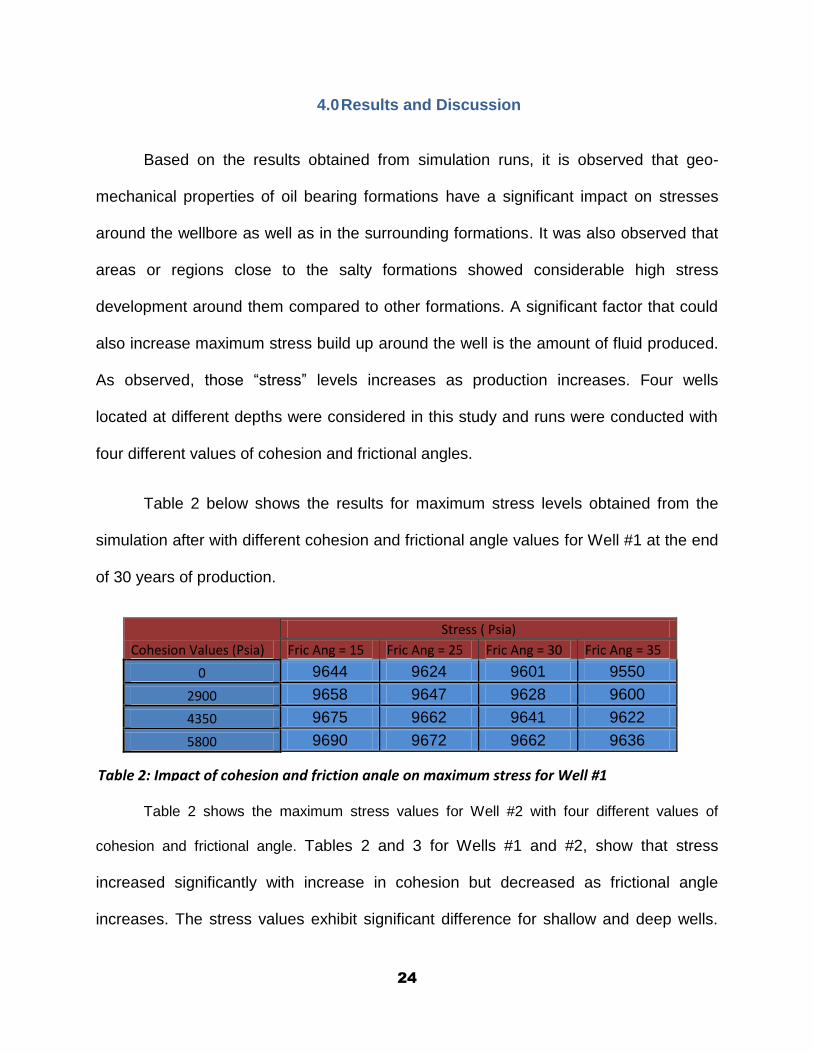
Table 2 below shows the results for maximum stress levels obtained from the
simulation after with different cohesion and frictional angle values for Well #1 at the end
of 30 years of production.
Cohesion Values (Psia)
Stress ( Psia)
Fric Ang = 15 Fric Ang = 25 Fric Ang = 30 Fric Ang = 35
0 9644 9624 9601 9550
2900 9658 9647 9628 9600
4350 9675 9662 9641 9622
5800 9690 9672 9662 9636
Table 2 shows the maximum stress values for Well #2 with four different values of
cohesion and frictional angle. Tables 2 and 3 for Wells #1 and #2, show that stress
increased significantly with increase in cohesion but decreased as frictional angle
increases. The stress values exhibit significant difference for shallow and deep wells.
Table 2: Impact of cohesion and friction angle on maximum stress for Well #1

25
This observation is believed to be related to the rapid deposition resulting in thick layers
of fine grained and low permeability sediments.
Cohesion Values (Psia)
Stress (Psia)
Fric Ang = 15 Fric Ang = 25 Fric Ang = 30 Fric Ang = 35
0 9440 9432 9424 9422
2900 9520 9503 9448 9438
4350 9570 9560 9452 9445
5800 9576 9569 9459 9450
Table 4 shows the maximum stress values for Well # 3 similar to Well # 1 and #2.
The stress values observed for Well #3 were less than the ones observed for Wells #1
and #2. Well #3 is closest well to the salt formation and the effect of salt is observed as
the minimum stress build up possibly due to the absorption of some disturbances by the
salt formation.
Cohesion Values (Psia)
Stress (Psia)
Fric Ang = 15 Fric Ang = 25 Fric Ang = 30 Fric Ang = 35
0 7508 7491 7488 7485
2900 7515 7510 7499 7490
4350 7948 7935 7901 7892
5800 7951 7939 7920 7900
Table “5” tabulates results for maximum stress values for Well #4. The Well #4 is
located at the deepest part of the formation also exhibited the same increasing stress
Table 3: Impact of cohesion and frictional angle on maximum stress for Well #2
Table 4: Impact of cohesion and frictional angle on maximum stress for Well #3

26
similar to Wells #1, #2 and #3. When results from Well #4 are compared to Well #3, the
maximum stress values were observed to be higher for Well #4.
Cohesion Values (Psia)
Stress (Psia)
Fric Ang = 15 Fric Ang = 25 Fric Ang = 30 Fric Ang = 35
0 8450 8434 8421 8407
2900 9256 9245 9232 9222
4350 9272 9263 9245 9234
5800 9286 9274 9252 9246
Table 5: Impact of cohesion and frictional angle on maximum stress for Well #4
Generally, it was observed from the simulation results that frictional angle and
cohesion doesn’t really affect the amount of fluid or gas produced from the producing
formation but rather that production has an effect on the maximum stress that develops
in these formations. The well located directly under the salt formation shows lower
stress values compared to those at the very shallow part of the reservoir. A possible
reason for this can be associated to the geology of the Mars Ursa Basin where
overpressures have been reported due to quick deposition of sediments. The shallow
part of the Mars Ursa Basin has been known as a site of mass transport deposits as
shear stress of this part of the formation far exceeds the shear strength. This event
occurs in formations as a result of sediments rapidly depositing, this causes
overpressure in these formations thereby decreasing the strength of the sediment.
Geotechnical studies including in-situ pore pressures measurements established the
presence of pressures significantly above hydrostatic within the shallow strata of the
Mars Ursa Basin (Ostermeier et. al. 2000).
27
Another major factor to consider here is the effect of overburden stress where it
can be observed that stress on Well #4, the deepest well in this reservoir showed a
significantly high level of stress build up compared to that of Well #3. Therefore, depth
of burial is also a major factor that can affect stress around the wellbore. The highest
maximum stress value around 9690 psi was however observed around Well #1 situated
at the shallow part of the reservoir while the minimum value was recorded around Well
#3 just below the salty, Lower Magenta formation layer.
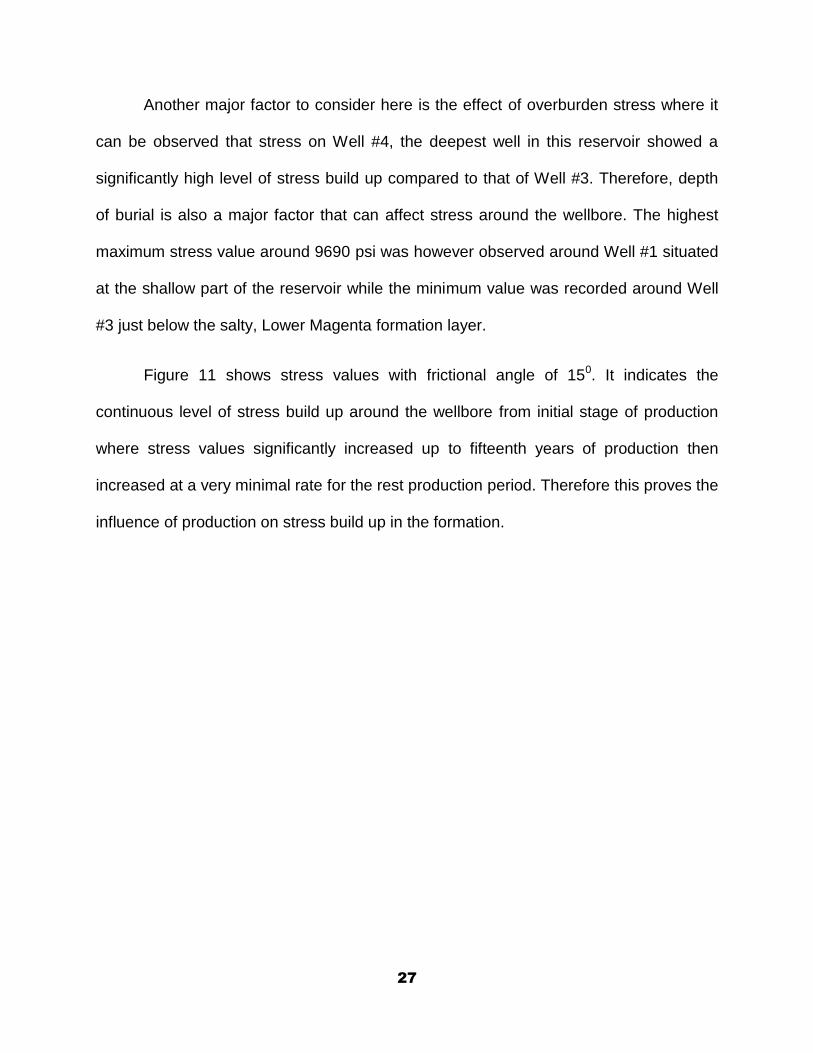
Figure 11 shows stress values with frictional angle of 150. It indicates the
continuous level of stress build up around the wellbore from initial stage of production
where stress values significantly increased up to fifteenth years of production then
increased at a very minimal rate for the rest production period. Therefore this proves the
influence of production on stress build up in the formation.
28
The frictional angle 300 used in the study also indicates similar trend as shown in
Figure 12. The stress build up increased significantly within the first fifteen years of
production but leveled off after fifteen years and remained constant for the rest of
production. This trend of stress increase is parallel to the cumulative production as
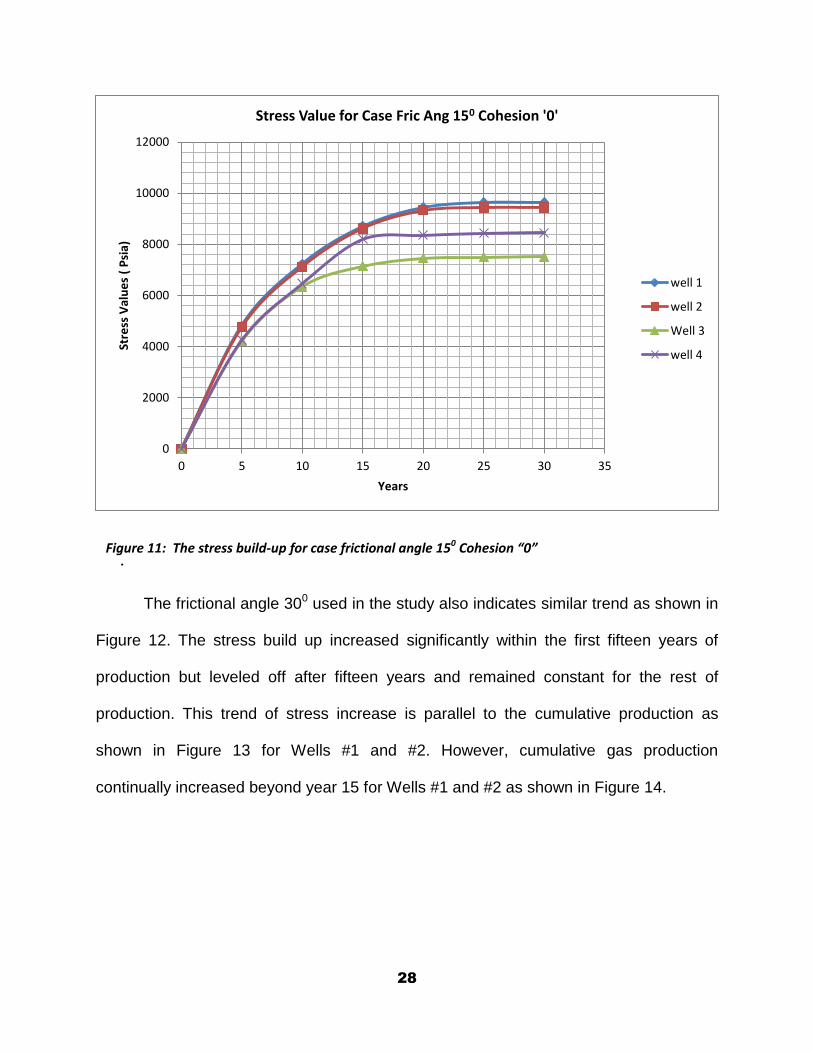
shown in Figure 13 for Wells #1 and #2. However, cumulative gas production
continually increased beyond year 15 for Wells #1 and #2 as shown in Figure 14.
0
2000
4000
6000
8000
10000
12000
0 5 10 15 20 25 30 35
Stre
ss V
alu
es
( P
sia)
Years
Stress Value for Case Fric Ang 150 Cohesion '0'
well 1
well 2
Well 3
well 4
Figure 11: The stress build-up for case frictional angle 150 Cohesion “0”
psia
the

29
0
2000
4000
6000
8000
10000
12000
0 5 10 15 20 25 30 35
Stre
ss V
alu
e (
Psi
a)
Years
Stress Value for Case Fric Angle 300 Cohesion 0
well 1
Well 2
Well 3
Well 4
0.00E+00
2.00E+06
4.00E+06
6.00E+06
8.00E+06
1.00E+07
1.20E+07
1.40E+07
1.60E+07
0 2000 4000 6000 8000 10000 12000
Cu
mu
lati
ve O
il SC
(b
bl)
(Days)
Cumulative Oil Production for Wells 1 &2
well1
well 2
Figure 12: The stress build-up for case frictional angle 30 0 Cohesion 0 psia
Figure 13: The Cumulative Oil Production for Well #1 and #2 (frictional angle 15)
30
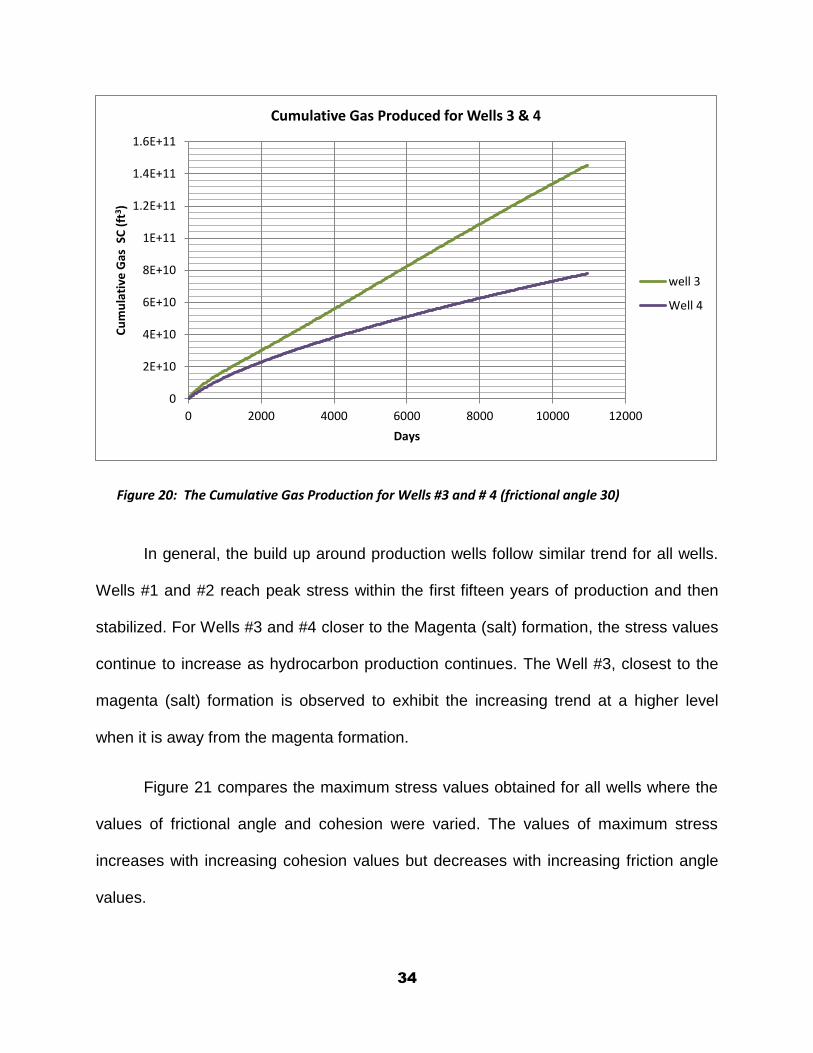
Figures 15 and 16 shows the cumulative oil and gas production, respectively for
Wells #3 and #4 where production continually increased contrary to Wells #1 and #2.
However stress build up trend was similar to the Wells #1 and #2
0.00E+00
2.00E+10
4.00E+10
6.00E+10
8.00E+10
1.00E+11
1.20E+11
1.40E+11
1.60E+11
0 2000 4000 6000 8000 10000 12000
Cu
mu
lati
ve G
as S
C (
ft3
)
(Days)
Cumulative Gas Production for Wells 1 &2
well 1
well 2
Figure 14: The Cumulative Gas Production for Wells #1 and #2 (frictional angle 15)

31
0.00E+00
2.00E+10
4.00E+10
6.00E+10
8.00E+10
1.00E+11
1.20E+11
1.40E+11
1.60E+11
0 2000 4000 6000 8000 10000 12000
Cu
mu
lati
ve G
as S
C (
ft3 )
(Days)
Cumulative Gas Production for Wells 3 &4
well 3
Well 4
0.00E+00
1.00E+07
2.00E+07
3.00E+07
4.00E+07
5.00E+07
6.00E+07
0 2000 4000 6000 8000 10000 12000
Cu
mu
lati
ve O
il SC
(b
bl)
(Days)
Cumulative Oil Production for Wells 3 & 4
well 3
Well 4
Figure 16: The Cumulative Gas Production for Wells #3 and #4 (frictional angle 15)
Figure 15: The Cumulative Oil Production for Wells #3 and #4 (frictional angle 15)
32
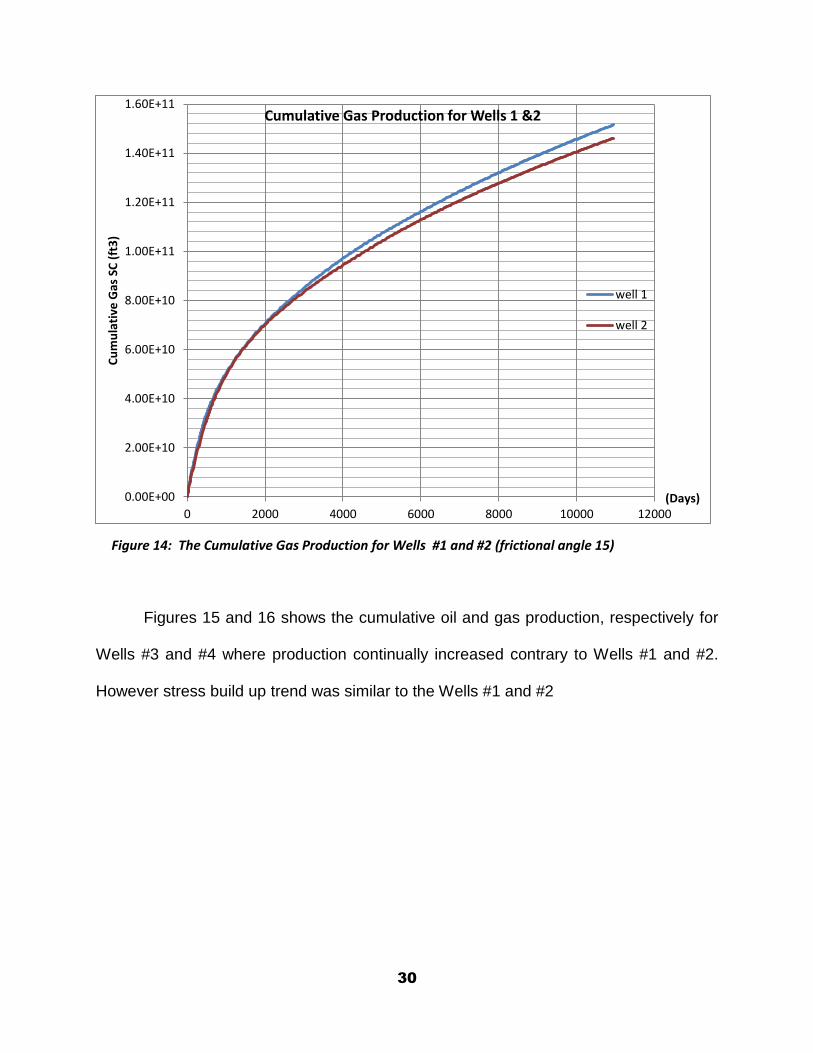
When a frictional angle of 300 was used, similar trends were observed for Wells
#1 and #2 in Figures 17 and 18. Figures 19 and 20 show the cumulative oil and gas
production for Wells #3 and #4.
0.00E+00
2.00E+06
4.00E+06
6.00E+06
8.00E+06
1.00E+07
1.20E+07
1.40E+07
1.60E+07
0 2000 4000 6000 8000 10000 12000
Cu
mu
lati
ve O
il SC
(b
bl)
Days
Cumulative Oil Produced for Wells 1 & 2
Well 1
Well 2
Figure 17: The Cumulative Oil Production for Wells #1 and #2 (frictional angle 30)

33
0
2E+10
4E+10
6E+10
8E+10
1E+11
1.2E+11
1.4E+11
1.6E+11
0 2000 4000 6000 8000 10000 12000
Cu
mu
lati
ve G
as S
C (
ft3 )
Days
Cumulative Gas Produced for Wells 1 & 2
well 1
well 2
0.00E+00
1.00E+07
2.00E+07
3.00E+07
4.00E+07
5.00E+07
6.00E+07
0 2000 4000 6000 8000 10000 12000
Cu
mu
lati
ve O
il SC
(b
bl)
Days
Cumulative Oil Produced for Wells 3 & 4
Well 3
Well 4
Figure 18: The Cumulative Gas Production for Wells #1 and #2 (frictional angle 30)
Figure 19: The Cumulative Oil Production for Wells #3 and #4 (frictional angle 30)
34
In general, the build up around production wells follow similar trend for all wells.
Wells #1 and #2 reach peak stress within the first fifteen years of production and then
stabilized. For Wells #3 and #4 closer to the Magenta (salt) formation, the stress values
continue to increase as hydrocarbon production continues. The Well #3, closest to the
magenta (salt) formation is observed to exhibit the increasing trend at a higher level
when it is away from the magenta formation.
Figure 21 compares the maximum stress values obtained for all wells where the
values of frictional angle and cohesion were varied. The values of maximum stress
increases with increasing cohesion values but decreases with increasing friction angle
values.
0
2E+10
4E+10
6E+10
8E+10
1E+11
1.2E+11
1.4E+11
1.6E+11
0 2000 4000 6000 8000 10000 12000
Cu
mu
lati
ve G
as S
C (
ft3 )
Days
Cumulative Gas Produced for Wells 3 & 4
well 3
Well 4
Figure 20: The Cumulative Gas Production for Wells #3 and # 4 (frictional angle 30)

35
The comparisons of maximum stress values are shown in Figure 22 for Well #2.
The increasing trends for maximum stress were same as the Well #1 but there was a
significant increase in stress values when the frictional angle was reduced from 30 to
25. It appears that the values of frictional angle play a critical role in determining the
maximum stress values for Well #2.
9450
9500
9550
9600
9650
9700
9750
0 2900 4350 5800
Max
imu
m S
tre
ss V
alu
es
(psi
a)
Cohesion Value
Angle 15
Angle 25
Angle 30
Angle 35
9300
9350
9400
9450
9500
9550
9600
0 2900 4350 5800
Max
imu
m S
tre
ss V
alu
( p
sia)
Cohesion Value
Angle 15
Angle 25
Angle 30
Angle 35
Figure 21: The Stress Values for different frictional angles ( Well #1)
Figure 22: The Stress Values for different frictional angles ( Well #2)

36
Figure 23 compares the results for maximum stress values for Well #3. The
behavior of maximum stress values showed similar trends similar to Wells #1 and #2
but there was a big jump in the values when Cohesion values were changed from 2900
psia to 4350 psia
The results for maximum stress values for Well #4 is shown in Figure 24 the
trend was similar to Well #3 but the significant increase was observed when the
cohesion value of 2900 or higher is used.
7200
7300
7400
7500
7600
7700
7800
7900
8000
0 2900 4350 5800
Max
imu
m S
tre
ss V
alu
e (
psi
a)
Cohesion Value
Angle 15
Angle 25
Angle 30
Angle 35
Figure 23: The Stress Values for different Cohesion Values ( well #3)

37
Figures 25 shows the stress distribution in the second of x-y plane for Well #1 at
the end of ten years with a cohesion value of 0 psia and frictional angle value of 150.
Figures 26 and 27 also show the same distribution at the end of 20 and 30 years
respectively. In Figure 25, stress levels increased up to 7737 psia covering up to about
1166.7 ft away from the wellbore. Figure 26 also shows the same trend where stress
increased up to 9690 psia covering a length of about 666.4 ft away from the wellbore,
also other sections of the formation have exhibited up to 8714 psia increase in stress.
7800
8000
8200
8400
8600
8800
9000
9200
9400
0 2900 4350 5800
Max
imu
m S
tre
ss V
alu
e (
psi
a)
Cohesion Value (psia)
Angle 15
Angle 25
Angle 30
Angle 35
Figure 24: The Stress Values for different Cohesion Valuess ( Well #4)

38
Figure 25: Stress profile for case frictional angle 15 Cohesion 0 psia for Well #1 (After 10 Years)
Figure 26: Stress profile for case frictional angle 15 Cohesion 0 psia for Well #1(After 20 Years)

39
Figure 27 shows that with frictional angle value of 15 and cohesion value of 0
psia, the 9690 psia maximum stress profile have covered up to 1660.7 ft away from the
wellbore. Other sections of the formation have witnessed up to 8714 psia increase in
stress.
Figure 27: Stress profile for case frictional angle 15 Cohesion 0 psia for Well #1 (After 30 Years)
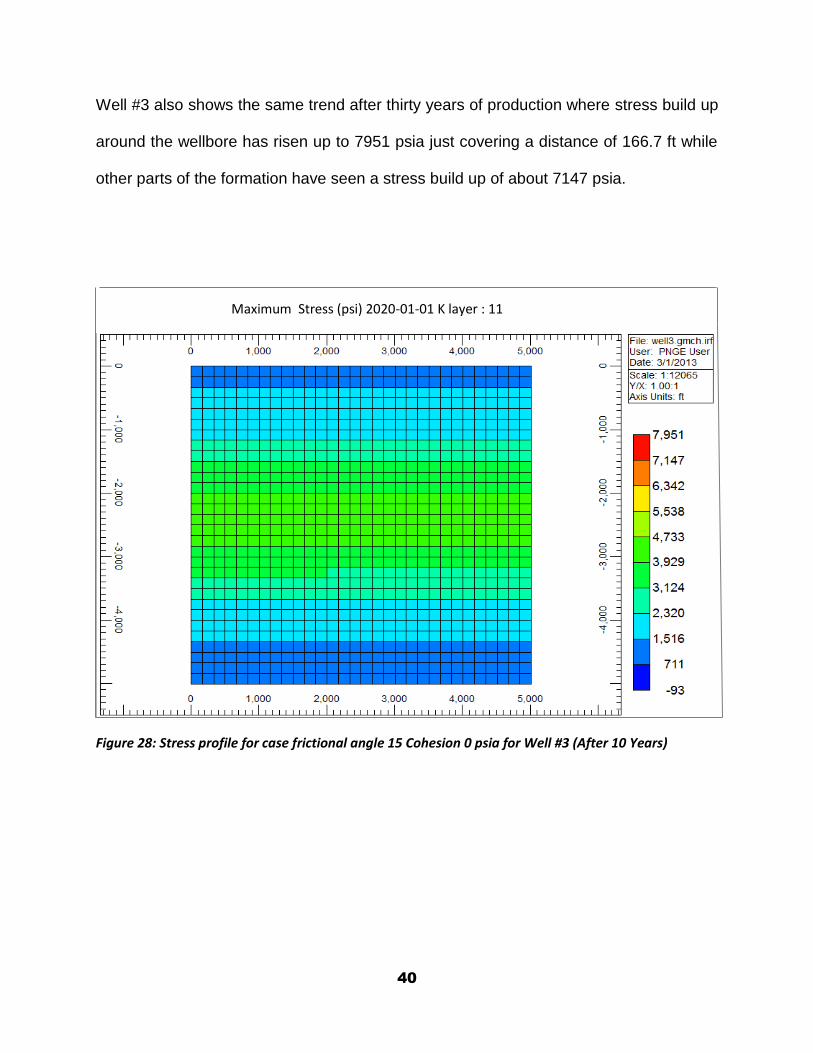
The results for stress distribution for Well #3 with cohesion value of 0 psia and
frictional angle 300 in layer 11 and on the x-y plane after 10 years of production is
shown in Figure 28. The stress has risen up to 4733 psia covering a distance of about
about 1283.7 ft away from the wellbore.
Figure 29 shows that stress level rose to about 6342 psia covering a distance of
about 1166.9 ft away from the wellbore after twenty years of production. Figure 30 for
40
Well #3 also shows the same trend after thirty years of production where stress build up
around the wellbore has risen up to 7951 psia just covering a distance of 166.7 ft while
other parts of the formation have seen a stress build up of about 7147 psia.
Maximum Stress (psi) 2020-01-01 K layer : 11
Figure 28: Stress profile for case frictional angle 15 Cohesion 0 psia for Well #3 (After 10 Years)

41
Maximum Stress (psi) 2030-01-01 K layer : 11
Figure 29: Stress profile for case frictional angle 15 Cohesion 0 psia for Well #3 (After 20 Years)
Maximum Stress (psi) 2040-01-01 K layer : 11
Figure 30: Stress profile for case frictional angle 15 Cohesion 0 psia for Well #3 (After 30 Years)
42
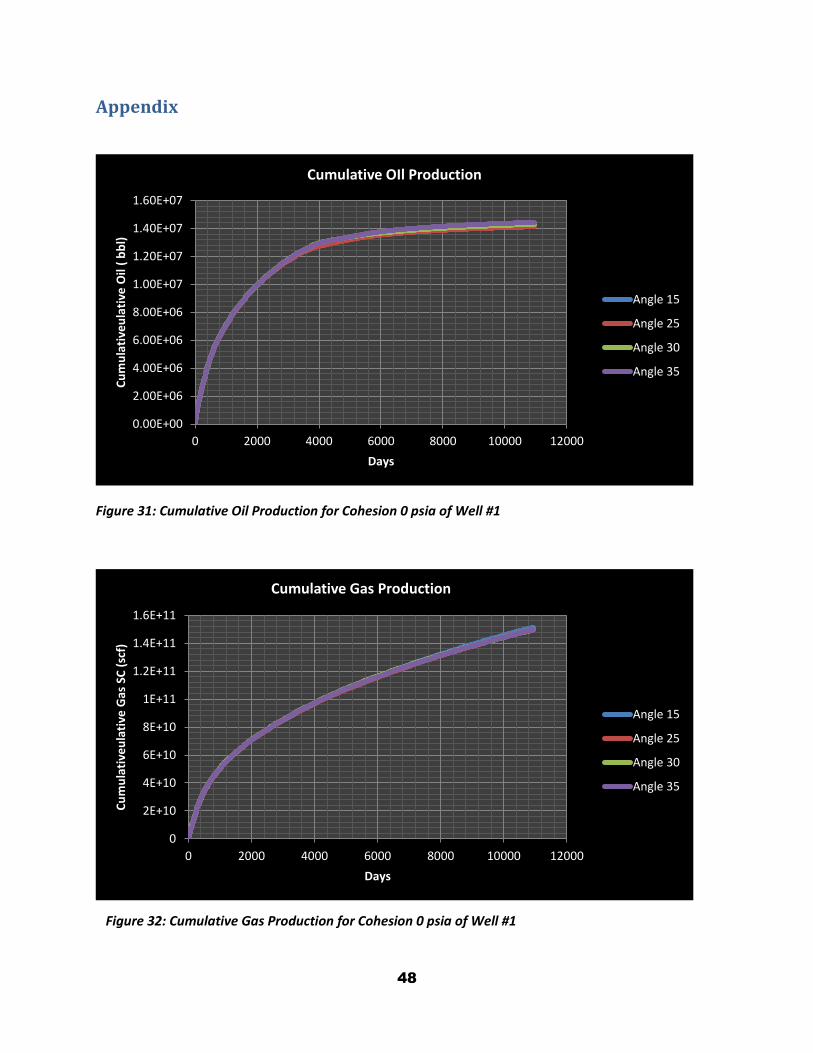
Similar trend of increase in production for the first fifteen years and a decline in
production for the second fifteen years is observed for all the wells used in this study
under different frictional angle and cohesion values. Wells #3 and #4 showed a slightly
different behavior as it was observed that these two wells still maintained increase in
production beyond the first fifteen years. The results are shown in Figures 31 through
62 in the appendix.
Figures 63 through 74 in Appendix show the results of stress profiles at the end
of 10, 20 and 30 years of production when frictional angles ranged from15o to 35o for all
wells used in this study. Based on results, lower frictional angles of 150 and 250 are
seen to have impacted a larger area in the formation compared to frictional angles of
300 and 350. The results were similar for all the wells both above and below the
magenta salt formation. Well #4 was observed with a slightly different stress profile
compared to that of Well #3. When a frictional angle of 15o was used, the stress
distributions covered a wider area compared to other frictional angle values used in the
study.
Similarly, the stress distributions at the end of 10, 20 and 30 years of production
are shown for all wells in Figures 75 through 90 with cohesion values of 0, 2900, 4350
and 5800 psia. The impact of cohesion was significant as maximum stress profiles
increased both in width and length with increase in cohesion values. In some cases
width and length covered showed similar profiles for cohesion values of 4350 and 5800
psia. We attribute this behavior to the high cohesion factor above a certain threshold

43
that do not cause an increase in the maximum stress value in the formation based on
geomechanical and reservoir characteristics.
44
5.0 Conclusions
The basic aim of this research was to determine the impact of oil and gas production
on integrity and stress distribution for horizontal wellbores producing in highly over-
pressured formations like that in the Mars Ursa Basin, Gulf of Mexico. Based on the
results obtained from the simulations the following conclusions were made:
The overall magnitude of stress build up in these formations is related to the
frictional angle and cohesion factor. The results show that the higher frictional
angle results in lower stress buildup around the producing wellbore while higher
cohesion factors resulted in higher stress buildup.
As a result of hydrocarbon production, stress builds up in the formations around
the wellbore. The stress build up is quite significant during the first fifteen years
of production but the stress build up stabilizes for all wells studied when the
cumulative hydrocarbon production reaches a plateau.
Formations close to salt diapirs experienced longevity in production and also
lower stress build up as the effect was more felt in layers a bit more distant to
these salt layers. However, salt effect therefore might not be felt in the early life
of the well, but in areas close to their deposits and in layers a little further from
their deposits.
The impact of the over-pressurized formations on stress at shallow depths of
Mars Ursa Basin is more significant. This is evident for Wells #1 and #2 as higher
stress is built up in these layers as compared to other wells studied.

45
The well designs for the Mars ursa Basin should consider the stress build up
during the first 15 years. Once properly designed to withstand this early stage of
production, the wellbores’ integrity will not be compromised.

46
Reference
Anderson, R.N., and A. Boulanger, 2005, Prospectivity of the Ultra-Deepwater Gulf of Mexico, Columbia University, Palisades, NY.
Batzle, M., D. Han , R. Gibson, H.W. James. B, 2006, Seismic Evaluation of Hydrocarbon Saturation in Deep-Water Reservoirs. Quaterly Report, Grant/ Cooperative Agreement DE-FC26-02NT15342.
Chan, A.W., and M.D Zoback, 2007 The role of hydrocarbon production on land subsidence and fault reactivation in the Louisiana Coastal zone,. Journal of Coastal Research, Vol. 23 No. 3.
Cook, J., R.A Frederiksen, K. Hasbo, S.Green, A. Judzis, J.W. Martin, R. Suarez-Rivera, J. Herwanger, P. Hooyman, D. Lee, S. Noeth, C. Sayers, N. Koutsabeloulis, R. Marsdan, M.G.Stage and C.P. Tan, 2007,Rocks Matter; Ground Truth in Geomechanics, Oilfield Review, Autumn 2007, p36-55.
Flemings, P.B.B., Stump, B.B. Finkbeiner, T, and M. Zoback, 2002 Flow focusing in overpressured sandstones; theory, observations, and applications, American Journal of Science,v.302. pp 827-855.
Geertsma, J., 1973, Land Subsidence Above Compacting Oil and Gas Reservoirs., Journal of Petroleum Technology, June 1973, pp.733-744.
Hooke, R., and J. B. Hansen, 2005, Stress analysis Strain Analysis and shearing of Soils book title, The Engineering Foundations, McGraw-Hill, New York, NY.
Lach J., 2010, Improved Oil Recovery for Deepwater Gulf of Mexico, Final Report 07121-0701 to Research Partnership for Securing Energy in America. Oilfield Review, Autumn 2008, P.32-45.
Perez, M.A., R. Clyde, P. D’Ambrosio, R. Israel, T. Leavitt and L. Nutt, 2008, Meeting the subsalt challenge, Oilfield Review, Autumn 2008, P. 32-45.
Meckel, L.D., III, G.A. Ugueto, H.D. Lynch, E.W. Cumming, B.M. Hewett, E.J. Bocage, C.D. Winker and B.J. O’Neil, 2002, Genetic Stratigraphy, Stratigraphic Architecture and Reservoir Stacking Patterns of the Upper Miocene-Lower Pliocene Greater Mars-Ursa Intraslope Basin Mississippi Canyon, Gulf of Mexico, abstract presented at 22nd Annual Gulf Coast Section SEPM Foundation Bob F. Perkins Research Conference, Houston, TX.
Moore, J.C., R. Urgeles , M. Conin, P.B. Fleming and G.J. Iturrino, 2011, Threshold of Borehole failure: Breaking in before breaking out, Mississippi fan, Gulf of Mexico. Geosphere, June 2011, v.7, no.3, p.684-693.
Omojuwa, E.O., S. O. Osisanya and R. Ahmed, 2011, Properties of Salt Formations Essential for Modeling Instabilities while Drilling, paper SPE 150801, Nigeria Annual Conference and Exhibition, Abuja, Nigeria.
Ostermeier, R. M., J. H Pelletier, C. D Winker, J.W. Nicholson, F.H Rambow, and C. K. Cowan, 2000, Dealing with Shallow-Water flow in the Deepwater Gulf of Mexico, paper OTC 11972, Offshore Technology Conference, Houston, TX.

47
Reece, J.S., P.B Fleming, B. Dugan, H. Long and J.T. Germaine, 2012, Permeability – Porosity relationships of shallow mudstones in the Ursa Basin, northern deepwater Gulf of Mexico, Journal of Geophysical Research, Vol.117, B12102.
Sawyer, D.E ., 2006, Seismic Geomorphology , Lithology and Evolution of the Late Pleistocene Mars-Ursa Turbidite Region , Mississippi Canyon Area , Northern Gulf of Mexico, M.S Thesis, The Pennsylvania State University.
Segall, A. P., 1989 Earthquakes triggered by fluid extraction. Geology Journal, 17, 942-946.
Willson, S.M., S. Edwards, P.D. Heppard, X. Li, G. Coltrin, D.K. Chester, H.L.O. Harrison and B.W Cocales 2003, paper SPE 84266, SPE Annual Technical Conference and Exhibition, Denver, CO.
Yildiz, M., and S.A. Soganci 2010., Evaluation of geotechnical properties of the salt layers on the Lake Tuz. Scientific Research and Essays, Vol 5 (18), pp. 2656-2663.
Additional Literatures Reviewed Include
American society of Petroleum Geologist journal, June 2011, Threshold of borehole failure; breaking in before breaking out, Mississippi fan, Gulf of Mexico.
Computer Modelling Group. Builders Users Guide (GEM). Calgary: CMG. 2011.
Luis de Sousa ., 2011,Deepwater GOM : Reserves versus Production –Part 1: Thunder Hourse & Mars –Ursa http://www.theoildrum.com/node/8366.
Younes A.I., J.L Gibson and R.C. Shipp, 2005, Geohazard Assessment of the Deepwater Princess Field in the Northeastern Gulf of Mexico: Example of Evaluating Complex Faulting in a Subsea Development, paper OTC 17577, Offshore Technology Conference, Houston, TX.
48
Appendix
Figure 31: Cumulative Oil Production for Cohesion 0 psia of Well #1
0.00E+00
2.00E+06
4.00E+06
6.00E+06
8.00E+06
1.00E+07
1.20E+07
1.40E+07
1.60E+07
0 2000 4000 6000 8000 10000 12000
Cu
mu
lati
veu
lati
ve O
il (
bb
l)
Days
Cumulative OIl Production
Angle 15
Angle 25
Angle 30
Angle 35
0
2E+10
4E+10
6E+10
8E+10
1E+11
1.2E+11
1.4E+11
1.6E+11
0 2000 4000 6000 8000 10000 12000
Cu
mu
lati
veu
lati
ve G
as S
C (
scf)
Days
Cumulative Gas Production
Angle 15
Angle 25
Angle 30
Angle 35
Figure 32: Cumulative Gas Production for Cohesion 0 psia of Well #1

49
Figure 33: Cumulative Oil Production for Cohesion 2900 psia of Well #1
Figure 34: Cumulative Gas Production for Cohesion 2900 psia of Well #1
0.00E+00
2.00E+06
4.00E+06
6.00E+06
8.00E+06
1.00E+07
1.20E+07
1.40E+07
1.60E+07
0 2000 4000 6000 8000 10000 12000
Cu
mu
lati
ve O
il (b
bl)
Days
Angle 15
Angle 25
Angle 30
Angle 35
0
2E+10
4E+10
6E+10
8E+10
1E+11
1.2E+11
1.4E+11
1.6E+11
0 2000 4000 6000 8000 10000 12000
Gas
Pro
du
ctio
n s
c (s
cf)
Days
Angle 15
Angle 25
Angle 30
Angle 35

50
Figure 35: Cumulative Oil Production for Cohesion 4350 psia of Well #1
Figure 36: Cumulative Gas Production for Cohesion 4350 psia of Well #1
0
2000000
4000000
6000000
8000000
10000000
12000000
14000000
16000000
0 2000 4000 6000 8000 10000 12000
Cu
mu
lati
ve O
il P
rod
uct
ion
(b
bl)
Days
Angle 15
Angle 25
Angle 30
Angle 35
0
2E+10
4E+10
6E+10
8E+10
1E+11
1.2E+11
1.4E+11
1.6E+11
0 2000 4000 6000 8000 10000 12000
Cu
mu
lati
ve G
as P
rod
uct
ion
sc(
scf
)
Days
Angle 15
Angle 25
Angle 30
Angle 35
51
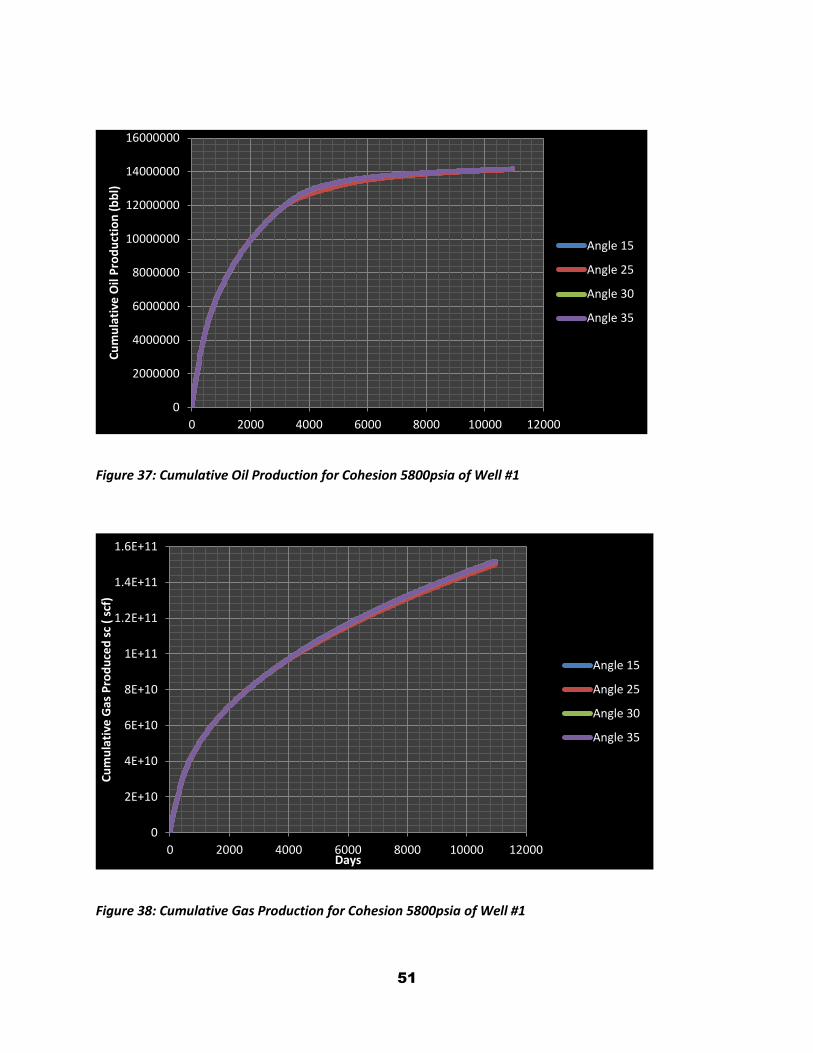
Figure 37: Cumulative Oil Production for Cohesion 5800psia of Well #1
Figure 38: Cumulative Gas Production for Cohesion 5800psia of Well #1
0
2000000
4000000
6000000
8000000
10000000
12000000
14000000
16000000
0 2000 4000 6000 8000 10000 12000
Cu
mu
lati
ve O
il P
rod
uct
ion
(b
bl)
Angle 15
Angle 25
Angle 30
Angle 35
0
2E+10
4E+10
6E+10
8E+10
1E+11
1.2E+11
1.4E+11
1.6E+11
0 2000 4000 6000 8000 10000 12000
Cu
mu
lati
ve G
as P
rod
uce
d s
c (
scf)
Days
Angle 15
Angle 25
Angle 30
Angle 35

52
Figure 39: Cumulative Oil Production for Cohesion 0 psia of Well #2
Figure 40: Cumulative Gas Production for Cohesion 0 psia of Well#2
0.00E+00
2.00E+06
4.00E+06
6.00E+06
8.00E+06
1.00E+07
1.20E+07
1.40E+07
1.60E+07
0 2000 4000 6000 8000 10000 12000
Cu
mu
lati
ve O
il P
rod
uct
ion
(b
bl)
Days
Angle 15
Angle 25
Angle 30
Angle 35
0
2E+10
4E+10
6E+10
8E+10
1E+11
1.2E+11
1.4E+11
1.6E+11
0 2000 4000 6000 8000 10000 12000
Cu
mu
lati
ve G
as P
rod
uct
ion
(scf
)
Angle 15
Angle 25
Angle 30
Angle 35
53
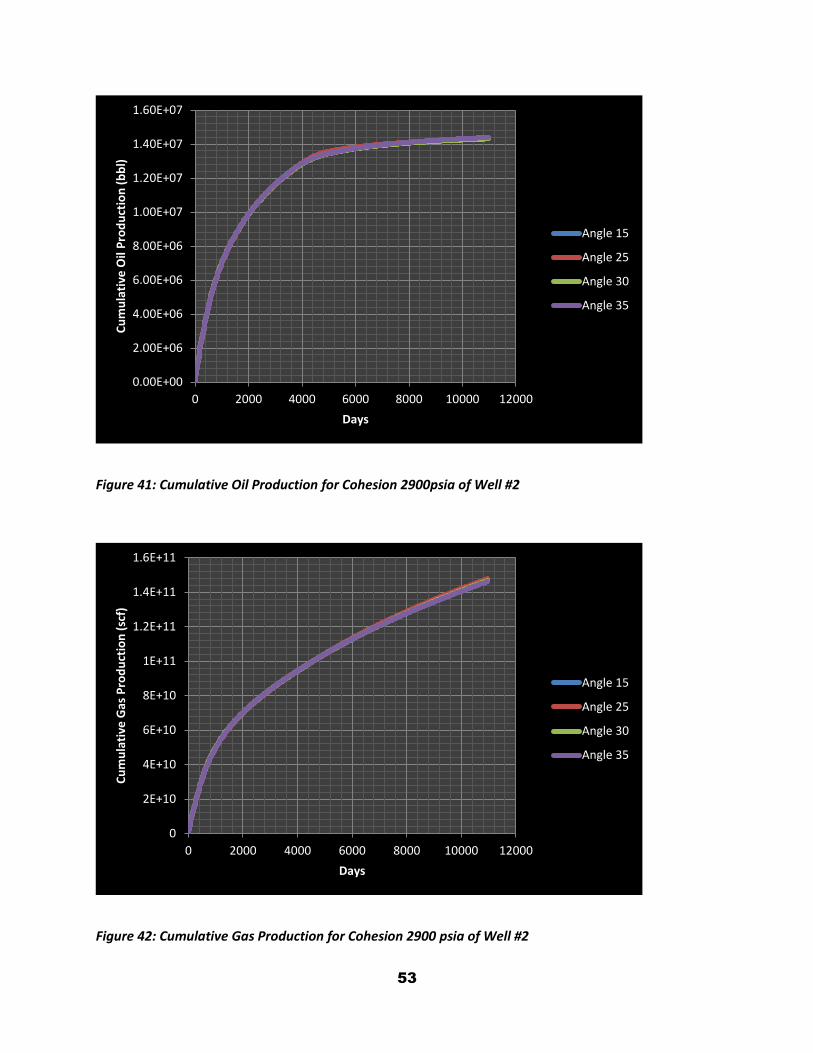
Figure 41: Cumulative Oil Production for Cohesion 2900psia of Well #2
Figure 42: Cumulative Gas Production for Cohesion 2900 psia of Well #2
0.00E+00
2.00E+06
4.00E+06
6.00E+06
8.00E+06
1.00E+07
1.20E+07
1.40E+07
1.60E+07
0 2000 4000 6000 8000 10000 12000
Cu
mu
lati
ve O
il P
rod
uct
ion
(b
bl)
Days
Angle 15
Angle 25
Angle 30
Angle 35
0
2E+10
4E+10
6E+10
8E+10
1E+11
1.2E+11
1.4E+11
1.6E+11
0 2000 4000 6000 8000 10000 12000
Cu
mu
lati
ve G
as P
rod
uct
ion
(sc
f)
Days
Angle 15
Angle 25
Angle 30
Angle 35
54
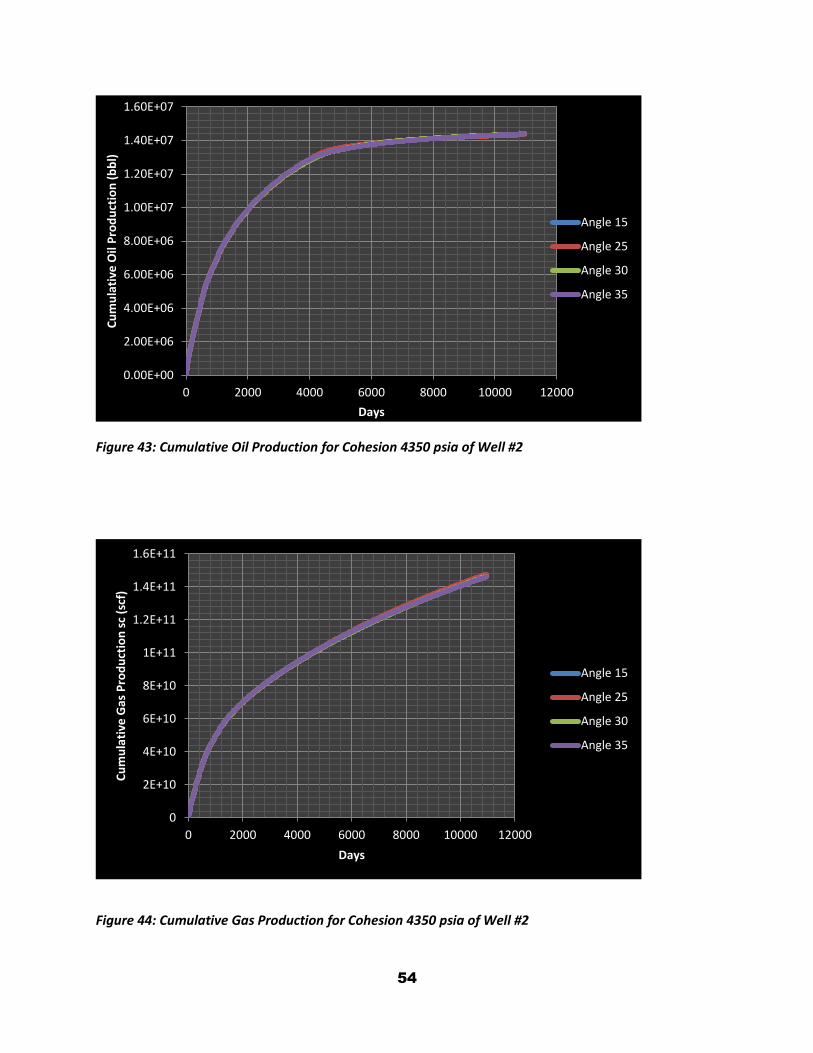
Figure 43: Cumulative Oil Production for Cohesion 4350 psia of Well #2
Figure 44: Cumulative Gas Production for Cohesion 4350 psia of Well #2
0.00E+00
2.00E+06
4.00E+06
6.00E+06
8.00E+06
1.00E+07
1.20E+07
1.40E+07
1.60E+07
0 2000 4000 6000 8000 10000 12000
Cu
mu
lati
ve O
il P
rod
uct
ion
(b
bl)
Days
Angle 15
Angle 25
Angle 30
Angle 35
0
2E+10
4E+10
6E+10
8E+10
1E+11
1.2E+11
1.4E+11
1.6E+11
0 2000 4000 6000 8000 10000 12000
Cu
mu
lati
ve G
as P
rod
uct
ion
sc
(scf
)
Days
Angle 15
Angle 25
Angle 30
Angle 35

55
Figure 45: Cumulative Oil Production for Cohesion 5800 psia of Well #2
Figure 46: Cumulative Gas Production for Cohesion 5800 psia of Well #2
0.00E+00
2.00E+06
4.00E+06
6.00E+06
8.00E+06
1.00E+07
1.20E+07
1.40E+07
1.60E+07
0 2000 4000 6000 8000 10000 12000
Cu
mu
lati
ve O
il P
rod
uct
ion
(b
bl)
Days
Angle 15
Angle 25
Angle 30
Angle 35
0.00E+00
2.00E+10
4.00E+10
6.00E+10
8.00E+10
1.00E+11
1.20E+11
1.40E+11
1.60E+11
0 2000 4000 6000 8000 10000 12000
Cu
mu
lati
ve G
as P
rod
uct
ion
sc (
scf)
Days
Angle 15
Angle 25
Angle 30
Angle 35
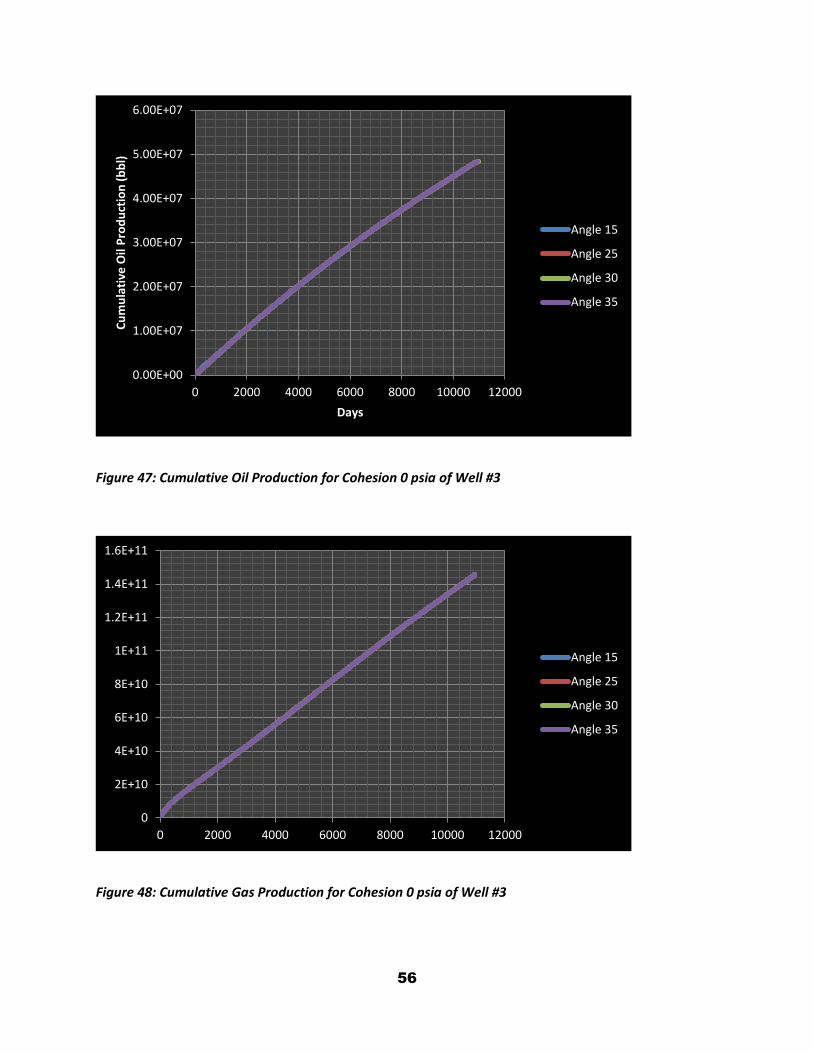
56
Figure 47: Cumulative Oil Production for Cohesion 0 psia of Well #3
Figure 48: Cumulative Gas Production for Cohesion 0 psia of Well #3
0.00E+00
1.00E+07
2.00E+07
3.00E+07
4.00E+07
5.00E+07
6.00E+07
0 2000 4000 6000 8000 10000 12000
Cu
mu
lati
ve O
il P
rod
uct
ion
(b
bl)
Days
Angle 15
Angle 25
Angle 30
Angle 35
0
2E+10
4E+10
6E+10
8E+10
1E+11
1.2E+11
1.4E+11
1.6E+11
0 2000 4000 6000 8000 10000 12000
Angle 15
Angle 25
Angle 30
Angle 35

57
Figure 49: Cumulative Oil Production for Cohesion 2900 psia of Well #3
Figure 50: Cumulative Gas Production for Cohesion 2900 psia of Well #3
0.00E+00
1.00E+07
2.00E+07
3.00E+07
4.00E+07
5.00E+07
6.00E+07
0 2000 4000 6000 8000 10000 12000
Angle 15
Angle 25
Angle 30
Angle 35
0
2E+10
4E+10
6E+10
8E+10
1E+11
1.2E+11
1.4E+11
1.6E+11
0 2000 4000 6000 8000 10000 12000
Angle 15
Angle 25
Angle 30
Angle 35

58
Figure 51: Cumulative Oil Production for Cohesion 4350 psia of Well #3
Figure 52: Cumulative Gas Production for Cohesion 4350 psia of Well #3
0.00E+00
1.00E+07
2.00E+07
3.00E+07
4.00E+07
5.00E+07
6.00E+07
0 2000 4000 6000 8000 10000 12000
Angle 15
Angle 25
Angle 30
Angle 35
0
2E+10
4E+10
6E+10
8E+10
1E+11
1.2E+11
1.4E+11
1.6E+11
0 2000 4000 6000 8000 10000 12000
Angle 25
Angle 30
Angle 35

59
Figure 53: Cumulative Oil Production for Cohesion 5800 psia of Well #3
Figure 54: Cumulative Gas Production for Cohesion 5800 psia of Well #3
0.00E+00
1.00E+07
2.00E+07
3.00E+07
4.00E+07
5.00E+07
6.00E+07
0 2000 4000 6000 8000 10000 12000
Angle 15
Angle 25
Angle 30
Angle 35
0
2E+10
4E+10
6E+10
8E+10
1E+11
1.2E+11
1.4E+11
1.6E+11
0 2000 4000 6000 8000 10000 12000
Angle 15
Angle 25
Angle 30
Angle 35

60
Figure 55: Cumulative Oil Production for Cohesion 0 psia of Well #4
Figure 56: Cumulative Gas Production for Cohesion 0 psia of Well #4
0.00E+00
2.00E+06
4.00E+06
6.00E+06
8.00E+06
1.00E+07
1.20E+07
1.40E+07
1.60E+07
1.80E+07
2.00E+07
0 2000 4000 6000 8000 10000 12000
Angle 15
Angle 25
Angle 30
Angle 35
0
1E+10
2E+10
3E+10
4E+10
5E+10
6E+10
7E+10
8E+10
9E+10
0 2000 4000 6000 8000 10000 12000
Angle 15
Angle 25
Angle 30
Angle 35

61
Figure 57: Cumulative Oil Production for Cohesion 2900 psia of Well #4
Figure 58: Cumulative Gas Production for Cohesion 2900 psia of Well #4
0.00E+00
1.00E+07
2.00E+07
3.00E+07
4.00E+07
5.00E+07
6.00E+07
0 2000 4000 6000 8000 10000 12000
Angle 15
Angle 25
Angle 30
Angle 35
0
5E+10
1E+11
1.5E+11
2E+11
2.5E+11
0 2000 4000 6000 8000 10000 12000
Angle 15
Angle 25
Angle 30
Angle 35

62
Figure 59: Cumulative Oil Production for Cohesion 4350 psia of Well #4
Figure 60: Cumulative Gas Production for Cohesion 4350 psia of Well #4
0.00E+00
1.00E+07
2.00E+07
3.00E+07
4.00E+07
5.00E+07
6.00E+07
0 2000 4000 6000 8000 10000 12000
Angle 15
Angle 25
Angle 30
Angle 35
0
5E+10
1E+11
1.5E+11
2E+11
2.5E+11
3E+11
0 2000 4000 6000 8000 10000 12000
Angle 15
Angle 25
Angle 30
Angle 35

63
Figure 61: Cumulative Oil Production for Cohesion 5800 psia of Well #4
Figure 62: Cumulative Gas Production for Cohesion 5800 psia of Well #4
0.00E+00
1.00E+07
2.00E+07
3.00E+07
4.00E+07
5.00E+07
6.00E+07
0 2000 4000 6000 8000 10000 12000
Angle 15
Angle 25
Angle 30
Angle 35
0
5E+10
1E+11
1.5E+11
2E+11
2.5E+11
0 2000 4000 6000 8000 10000 12000
Angle 15
Angle 25
Angle 30
Angle 35

64
Figure 63 : Stress profiles after 10 years for Well #1
ɸ =15 ɸ =25
ɸ =30 ɸ =35

65
Figure 64 : Stress profiles after 20 years for Well #1
ɸ =25 ɸ =15
ɸ =30 ɸ =35
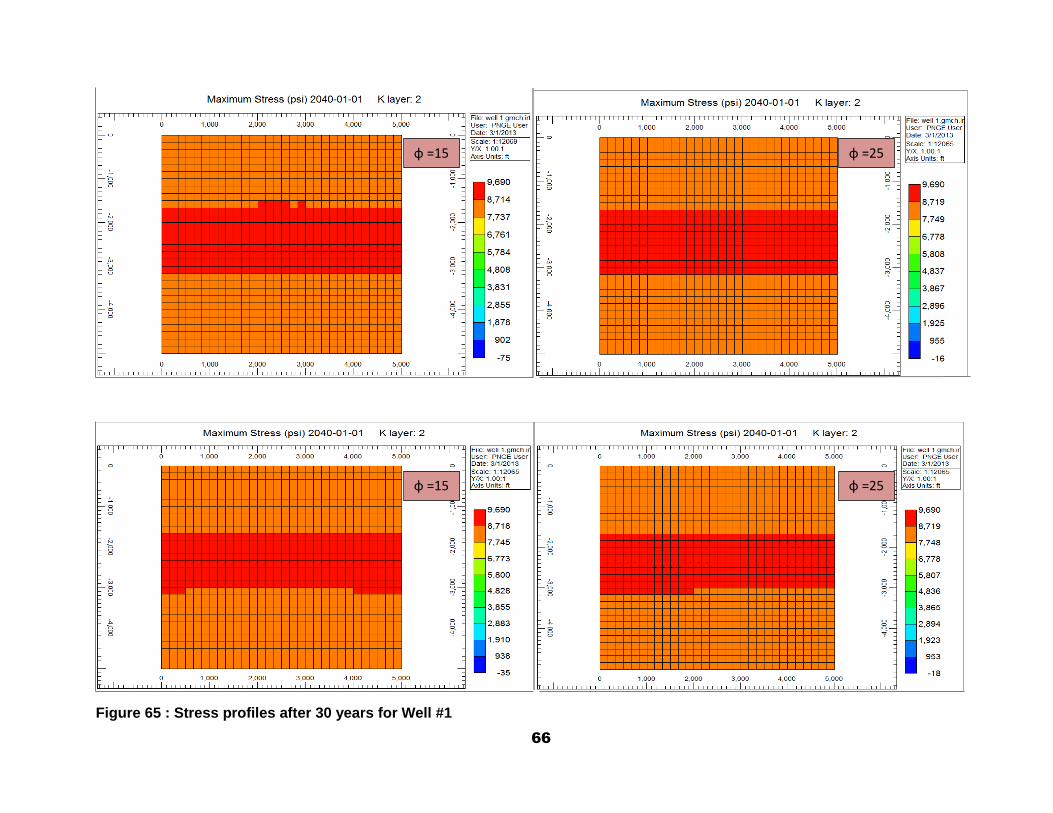
66
Figure 65 : Stress profiles after 30 years for Well #1
ɸ =25 ɸ =15
ɸ =25 ɸ =15

67
Figure 66 : Stress profiles after 10 years for Well #2
ɸ =25 ɸ =15
ɸ =35 ɸ =30

68
Maximum Stress (psi) 2030-01-01 K layer : 3 Maximum Stress (psi) 2030-01-01 K layer : 3
Maximum Stress (psi) 2030-01-01 K layer : 3 Maximum Stress (psi) 2030-01-01 K layer : 3
Figure 67 : Stress profiles after 20 years for Well #2
ɸ =25 ɸ =15
ɸ =35 ɸ =30

69
Figure 68 : Stress profiles after 30 years for Well #2
Maximum Stress (psi) 2040-01-01 K layer : 3 Maximum Stress (psi) 2040-01-01 K layer : 3
Maximum Stress (psi) 2040-01-01 K layer : 3 Maximum Stress (psi) 2040-01-01 K layer : 3
ɸ =25
ɸ =30 ɸ =35
ɸ =15

70
Figure 69 : Stress profiles after 10 years for Well #3
Maximum Stress (psi) 2020-01-01 K layer : 11 Maximum Stress (psi) 2020-01-01 K layer : 11
Maximum Stress (psi) 2020-01-01 K layer : 11 Maximum Stress (psi) 2020-01-01 K layer : 11
ɸ =25
ɸ =30 ɸ =35
ɸ =15

71
Figure 70 : Stress profiles after 20 years for Well #3
Maximum Stress (psi) 2030-01-01 K layer : 11 Maximum Stress (psi) 2030-01-01 K layer : 11
Maximum Stress (psi) 2030-01-01 K layer : 11 Maximum Stress (psi) 2030-01-01 K layer : 11
ɸ =25 ɸ =15
ɸ =30 ɸ =35
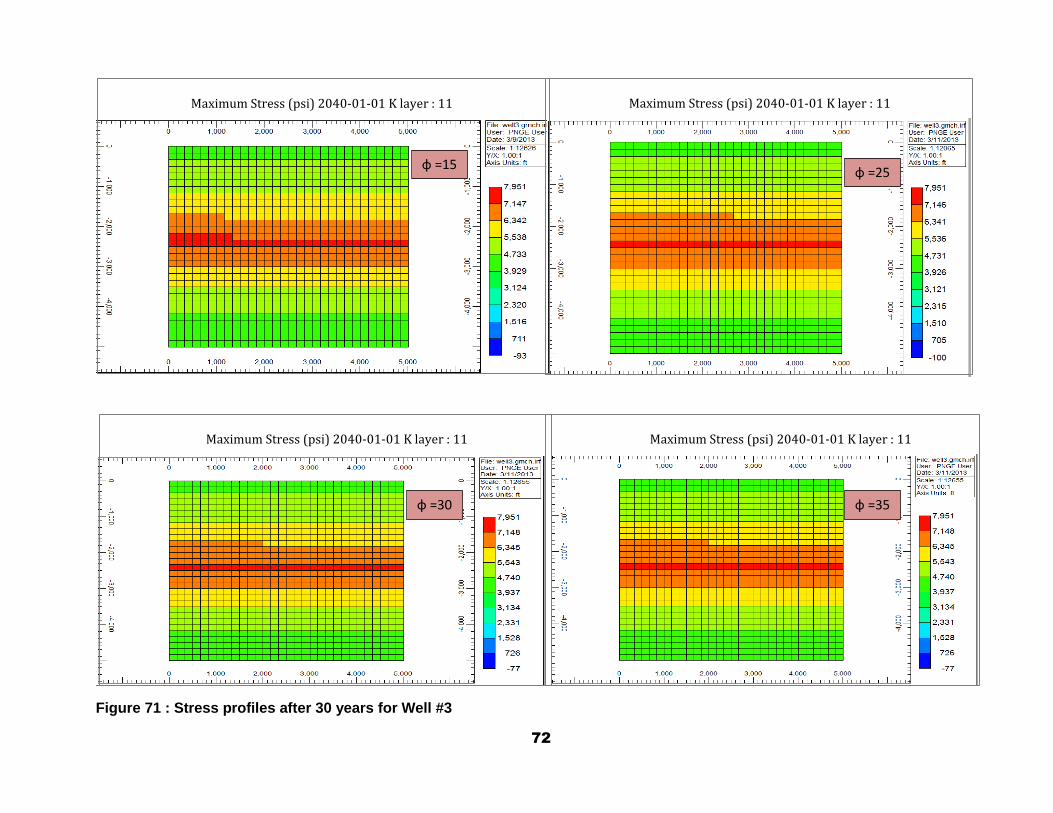
72
Figure 71 : Stress profiles after 30 years for Well #3
Maximum Stress (psi) 2040-01-01 K layer : 11 Maximum Stress (psi) 2040-01-01 K layer : 11
Maximum Stress (psi) 2040-01-01 K layer : 11 Maximum Stress (psi) 2040-01-01 K layer : 11
ɸ =25
ɸ =30 ɸ =35
ɸ =15

73
Figure 72 : Stress profiles after 10 years for Well #4
Maximum Stress (psi) 2020-01-01 K layer : 13 Maximum Stress (psi) 2020-01-01 K layer : 13
Maximum Stress (psi) 2020-01-01 K layer : 13 Maximum Stress (psi) 2020-01-01 K layer : 13
ɸ =25
ɸ =35 ɸ =30
ɸ =15

74
Figure 73 : Stress profiles after 20 years for Well #4
Maximum Stress (psi) 2030-01-01 K layer : 13 Maximum Stress (psi) 2030-01-01 K layer : 13
Maximum Stress (psi) 2030-01-01 K layer : 13 Maximum Stress (psi) 2030-01-01 K layer : 13
ɸ =35 ɸ =35
ɸ =35 ɸ =35

75
Figure 74 : Stress profiles after 30 years for Well #4
Maximum Stress (psi) 2030-01-01 K layer : 13 Maximum Stress (psi) 2030-01-01 K layer : 13
Maximum Stress (psi) 2030-01-01 K layer : 13 Maximum Stress (psi) 2030-01-01 K layer : 13
ɸ =15
ɸ =30 ɸ =35
ɸ =25
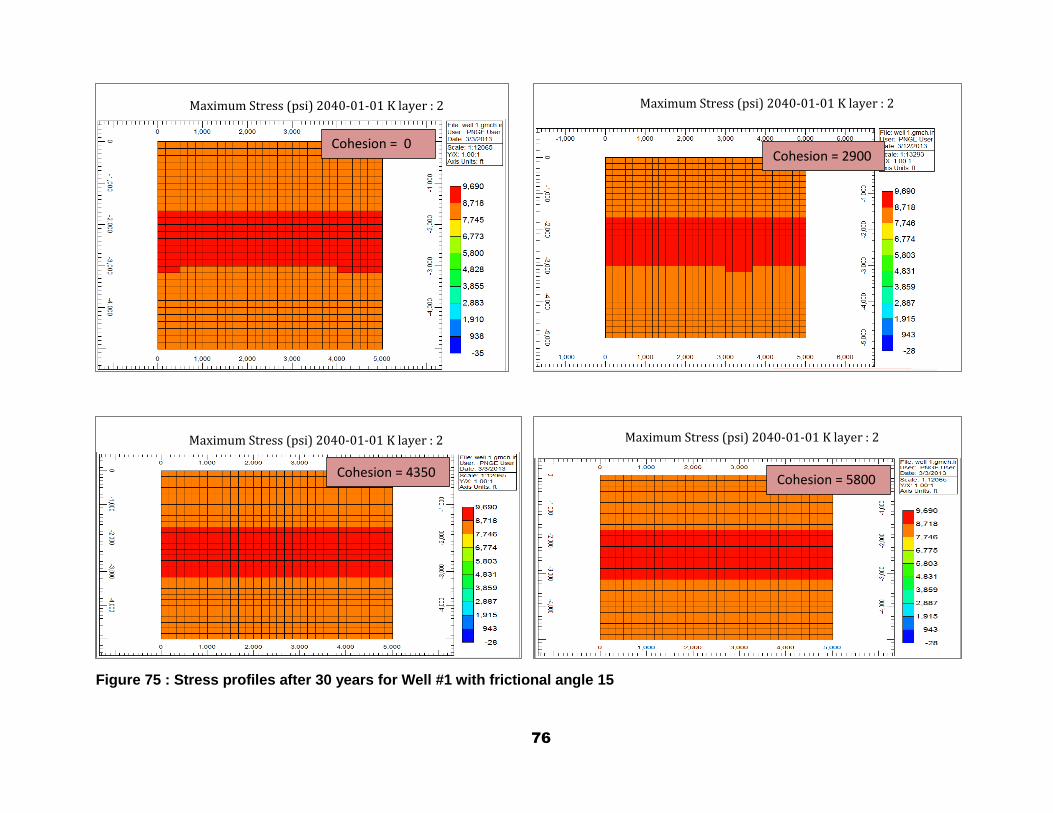
76
Figure 75 : Stress profiles after 30 years for Well #1 with frictional angle 15
Maximum Stress (psi) 2040-01-01 K layer : 2 Maximum Stress (psi) 2040-01-01 K layer : 2
Maximum Stress (psi) 2040-01-01 K layer : 2 Maximum Stress (psi) 2040-01-01 K layer : 2
Cohesion = 2900
=35
Cohesion = 5800
58005
Cohesion = 4350
Cohesion = 0

77
Figure 76 : Stress profiles after 30 years for Well #1 with frictional angle 25
Maximum Stress (psi) 2040-01-01 K layer : 2 Maximum Stress (psi) 2040-01-01 K layer : 2
Maximum Stress (psi) 2040-01-01 K layer : 2 Maximum Stress (psi) 2040-01-01 K layer : 2
Cohesion = 2900
Cohesion = 4350 Cohesion = 5800
Cohesion = 0

78
Figure 77 : Stress profiles after 30 years for Well #1 with frictional angle 30
Maximum Stress (psi) 2040-01-01 K layer : 2 Maximum Stress (psi) 2040-01-01 K layer : 2
Maximum Stress (psi) 2040-01-01 K layer : 2 Maximum Stress (psi) 2040-01-01 K layer : 2
Cohesion = 2900
=35
Cohesion = 5800 Cohesion = 4350
===========
Cohesion = 0
=35

79
Figure 78 : Stress profiles after 30 years for Well #1 with frictional angle 35
Maximum Stress (psi) 2040-01-01 K layer : 2 Maximum Stress (psi) 2040-01-01 K layer : 2
Maximum Stress (psi) 2040-01-01 K layer : 2 Maximum Stress (psi) 2040-01-01 K layer : 2
Cohesion = 2900
Cohesion = 4350 Cohesion = 5800
Cohesion = 0
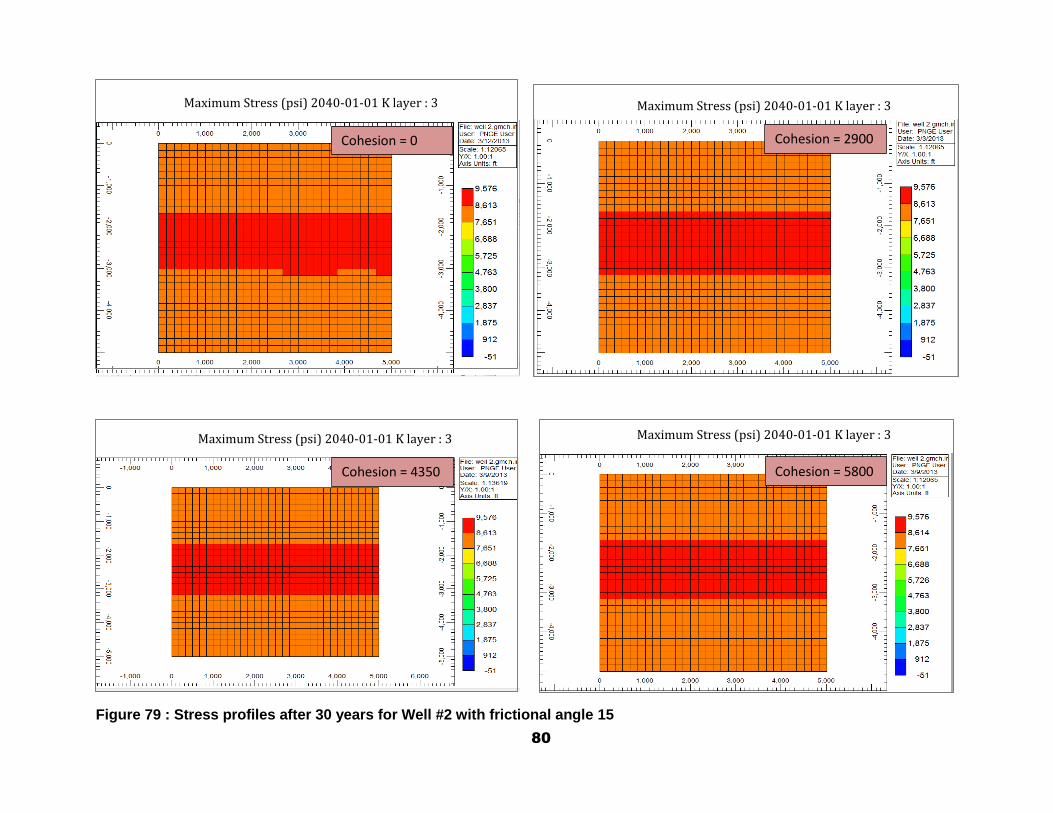
80
Figure 79 : Stress profiles after 30 years for Well #2 with frictional angle 15
Maximum Stress (psi) 2040-01-01 K layer : 3 Maximum Stress (psi) 2040-01-01 K layer : 3
Maximum Stress (psi) 2040-01-01 K layer : 3 Maximum Stress (psi) 2040-01-01 K layer : 3
Cohesion = 2900
Cohesion = 4350 Cohesion = 5800
Cohesion = 0

81
Figure 80 : Stress profiles after 30 years for Well #2 with frictional angle 25
Maximum Stress (psi) 2040-01-01 K layer : 3 Maximum Stress (psi) 2040-01-01 K layer : 3
Maximum Stress (psi) 2040-01-01 K layer : 3 Maximum Stress (psi) 2040-01-01 K layer : 3
Cohesion = 2900 Cohesion = 0
Cohesion = 5800 Cohesion = 4350
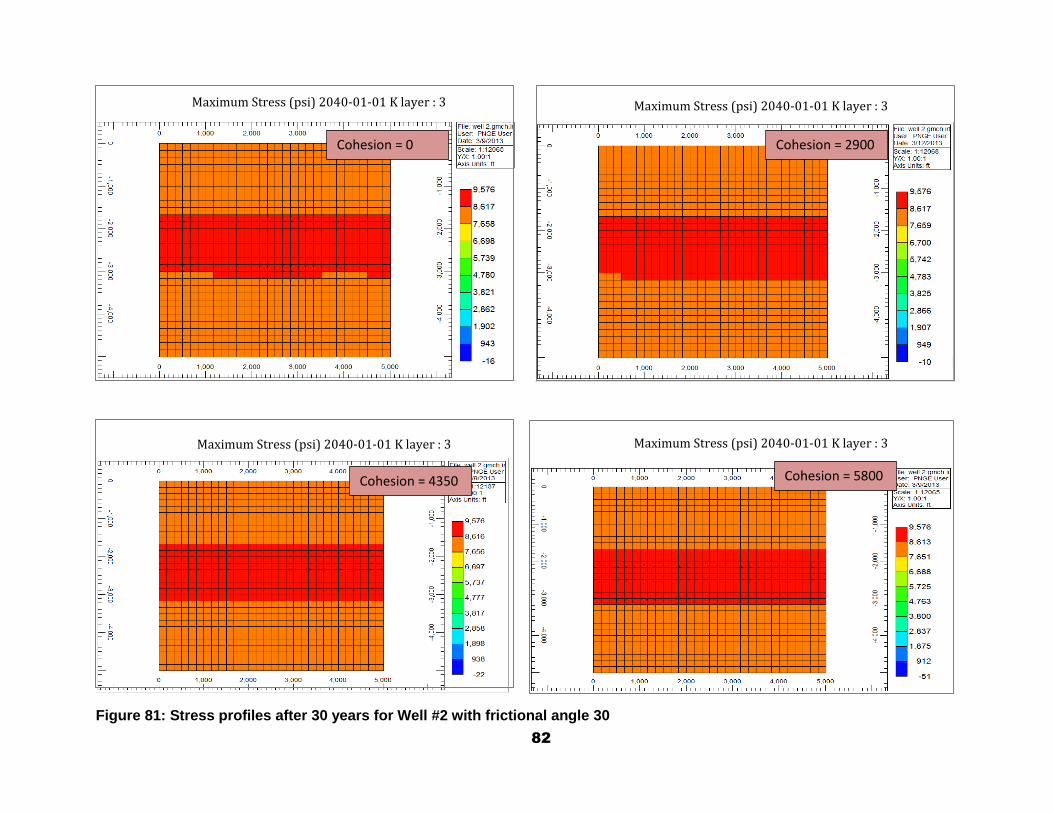
82
Figure 81: Stress profiles after 30 years for Well #2 with frictional angle 30
Maximum Stress (psi) 2040-01-01 K layer : 3 Maximum Stress (psi) 2040-01-01 K layer : 3
Maximum Stress (psi) 2040-01-01 K layer : 3 Maximum Stress (psi) 2040-01-01 K layer : 3
Cohesion = 2900
Cohesion = 5800 Cohesion = 4350
Cohesion = 0

83
Figure 82: Stress profiles after 30 years for Well #2 with frictional angle 35
Maximum Stress (psi) 2040-01-01 K layer : 3 Maximum Stress (psi) 2040-01-01 K layer : 3
Maximum Stress (psi) 2040-01-01 K layer : 3 Maximum Stress (psi) 2040-01-01 K layer : 3
Cohesion = 2900
Cohesion = 4350 Cohesion = 5800
Cohesion = 0

84
Figure 83: Stress profiles after 30 years for Well #3 with frictional angle 15
Maximum Stress (psi) 2040-01-01 K layer : 11 Maximum Stress (psi) 2040-01-01 K layer : 11
Maximum Stress (psi) 2040-01-01 K layer : 11 Maximum Stress (psi) 2040-01-01 K layer : 11
Cohesion = 2900
2900=29800
Cohesion = 0
Cohesion = 5800 Cohesion = 4350

85
Figure 84: Stress profiles after 30 years for Well #3 with frictional angle 25
Maximum Stress (psi) 2040-01-01 K layer : 11 Maximum Stress (psi) 2040-01-01 K layer : 11
Maximum Stress (psi) 2040-01-01 K layer : 11 Maximum Stress (psi) 2040-01-01 K layer : 11
Cohesion
=29800
Cohesion = 0
Cohesion = 4350 Cohesion = 5800
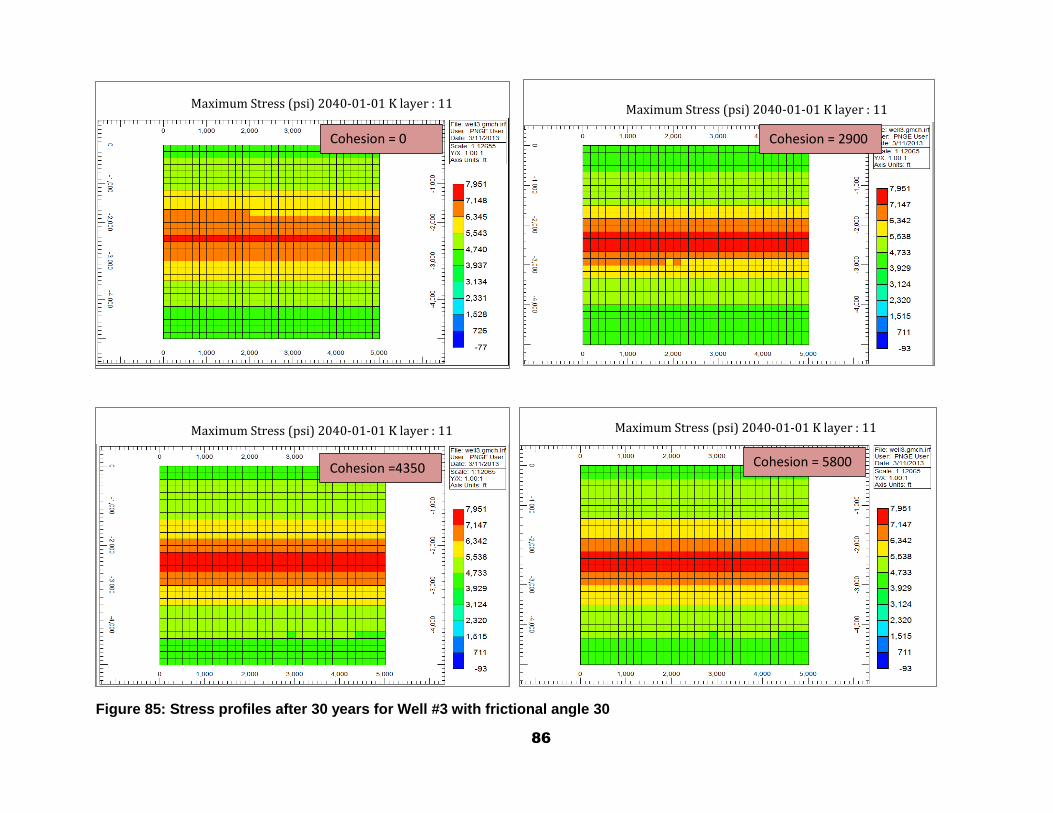
86
Figure 85: Stress profiles after 30 years for Well #3 with frictional angle 30
Maximum Stress (psi) 2040-01-01 K layer : 11 Maximum Stress (psi) 2040-01-01 K layer : 11
Maximum Stress (psi) 2040-01-01 K layer : 11 Maximum Stress (psi) 2040-01-01 K layer : 11
Cohesion = 2900
Cohesion =4350
43500
Cohesion = 5800
Cohesion = 0
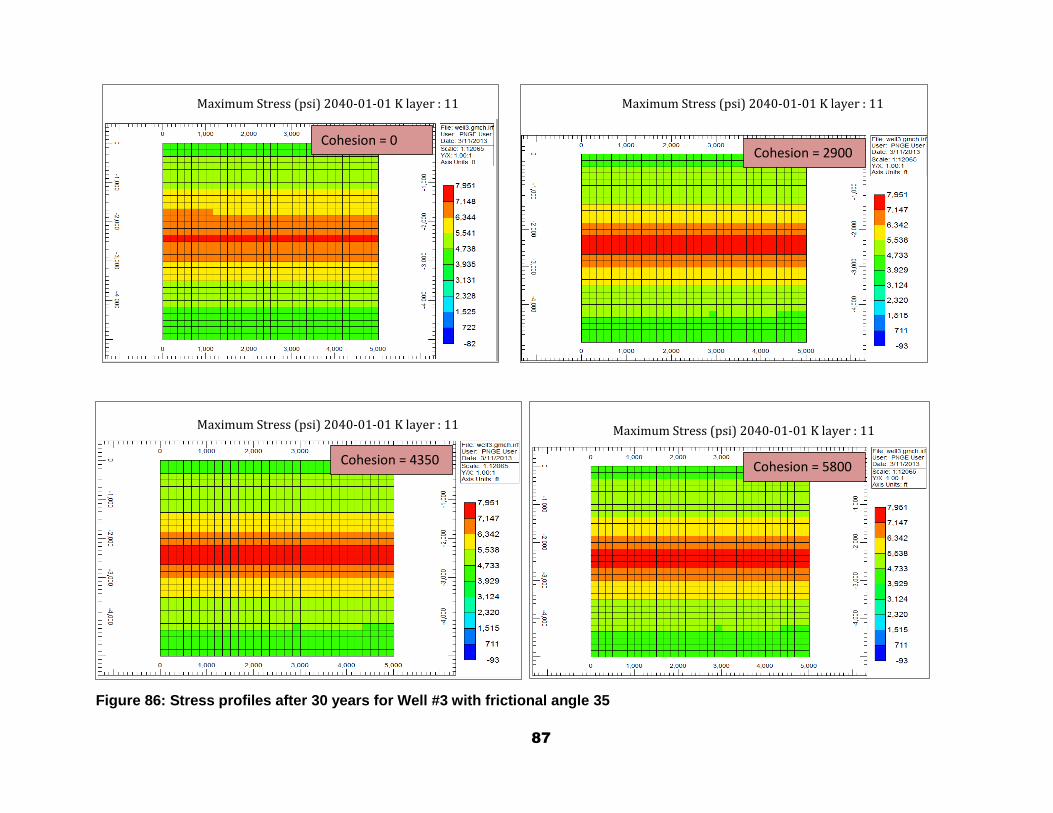
87
Figure 86: Stress profiles after 30 years for Well #3 with frictional angle 35
Maximum Stress (psi) 2040-01-01 K layer : 11 Maximum Stress (psi) 2040-01-01 K layer : 11
Maximum Stress (psi) 2040-01-01 K layer : 11 Maximum Stress (psi) 2040-01-01 K layer : 11
Cohesion = 2900
Cohesion = 4350 Cohesion = 5800
Cohesion = 0

88
Figure 87: Stress profiles after 30 years for Well #4 with frictional angle 15
Maximum Stress (psi) 2040-01-01 K layer : 13 Maximum Stress (psi) 2040-01-01 K layer : 13
Maximum Stress (psi) 2040-01-01 K layer : 13 Maximum Stress (psi) 2040-01-01 K layer : 13
Cohesion = 2900
Cohesion = 4350 Cohesion = 5800
Cohesion = 0

89
Maximum Stress (psi) 2040-01-01 K layer : 13
Maximum Stress (psi) 2040-01-01 K layer : 13
Maximum Stress (psi) 2040-01-01 K layer : 13
Maximum Stress (psi) 2040-01-01 K layer : 13
Cohesion = 2900
Cohesion = 4350 Cohesion = 5800
Cohesion = 0
Figure 88: Stress profiles after 30 years for Well #4 with frictional angle 25
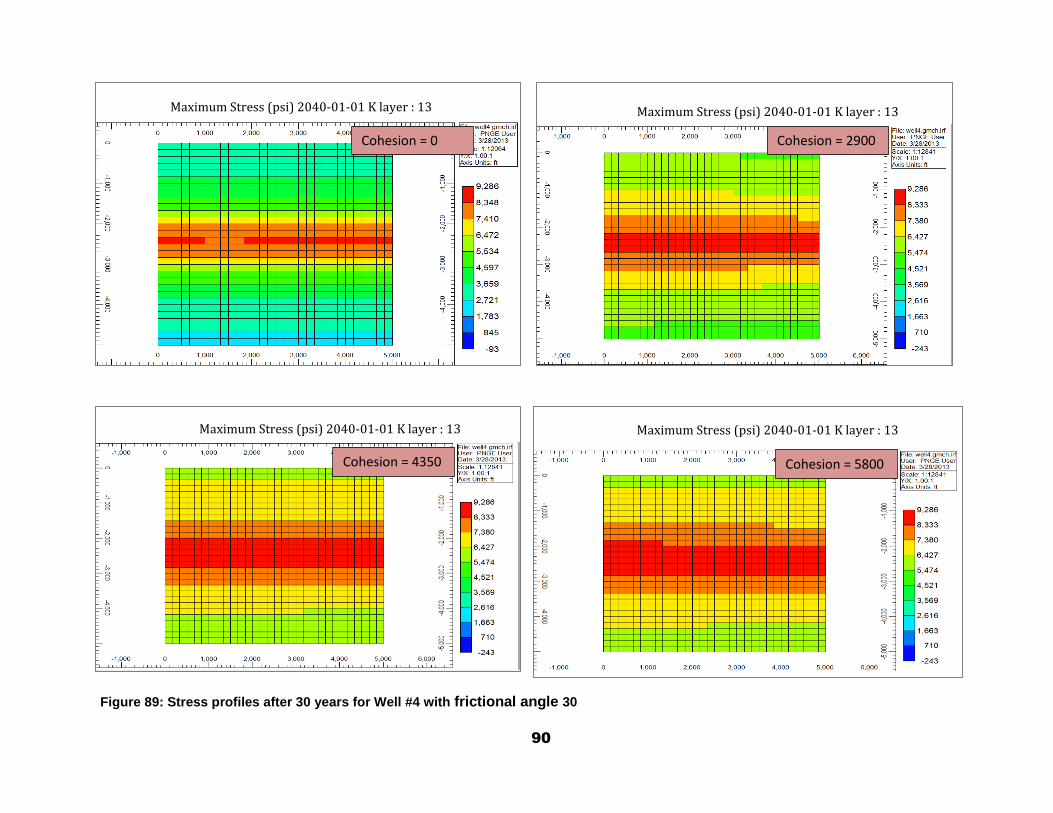
90
Maximum Stress (psi) 2040-01-01 K layer : 13 Maximum Stress (psi) 2040-01-01 K layer : 13
Maximum Stress (psi) 2040-01-01 K layer : 13 Maximum Stress (psi) 2040-01-01 K layer : 13
Cohesion = 2900
Cohesion = 4350 Cohesion = 5800
Cohesion = 0
Figure 89: Stress profiles after 30 years for Well #4 with frictional angle 30

91
Figure 90: Stress profiles after 30 years for Well #4 with frictional angle 35
Maximum Stress (psi) 2040-01-01 K layer : 13 Maximum Stress (psi) 2040-01-01 K layer : 13
Maximum Stress (psi) 2040-01-01 K layer : 13 Maximum Stress (psi) 2040-01-01 K layer : 13
Cohesion = 2900
Cohesion = 4350 Cohesion = 5800
Cohesion = 0

92
Wellbore Stability in Ultra-Deep Formations of the Gulf of Mexico
Thesis submitted to the
Benjamin M. Statler College of Engineering and Mineral Resources
at West Virginia University
in partial fulfillment of the requirements for the degree of
Master of Science in Petroleum and Natural Gas Engineering
Department of Petroleum and Natural Gas Engineering
Approval of the Examining Committee
_________________________________
H.Ilkin Bilgesu, Ph.D., Chair
_________________________________________
Sam Ameri, M.S
_________________________________________
Daniel Della Giustinia , Ph.D