Embed Size (px)
Citation preview

The opinions expressed in this presentation are those of the speaker. The International Foundationdisclaims responsibility for views expressed and statements made by the program speakers.
Wellness Benefits in Health Plans
William L. Blanchet, M.D.PresidentBoulder Internal MedicineBoulder, Colorado
Samuel J. Kenish, CEBSAdministratorTeamsters Local 830 Employee Benefit FundsPhiladelphia, Pennsylvania
James L. McGee, CEBSExecutive DirectorTransit Employees’ Health and Welfare PlanForestville, Maryland
H08-1

Transit Employees’ Health & Welfare Fund
• Members of Local 689 ATU (Amalgamated Transit Union)
• 8,500 Active • Employed by the Washington
Metropolitan Area Transit Authority (WMATA)
• 70% of WMATA workforce• 3,500 Retired
H08-2

Overweight Friends Leads to Overweight Self
H08-3

Overweight Friends Leads to Overweight Self
H08-4

Overweight Friends Leads to Overweight Self
H08-5

Obesity Trends* Among U.S. AdultsBRFSS, 1990, 2000, 2010
(*BMI 30, or about 30 lbs. overweight for 5’4” person)
10 states had a prevalence of obesity less than 10% andno state had prevalence equal to or greater than 15%.
1 9 9 0
H08-6

No Data <10% 10%–14% 15%–19% 20%–24% 25%–29% ≥30%
No state had a prevalence of obesity less than 10%,
From 10 to 0
23 states had a prevalence between 20–24%,
From 0 to 23
No state had prevalence equal to or greater than 25%.
2 0 0 0
Obesity Trends* Among U.S. AdultsBRFSS, 1990, 2000, 2010
(*BMI 30, or about 30 lbs. overweight for 5’4” person)
H08-7

No state had a prevalence of obesity less than 20%.
Thirty-six states had a prevalence equal to or greater than 25%;
From 0 to 36
12 of these states had a prevalence equal to or greater than 30%.
2 0 1 0
Obesity Trends* Among U.S. AdultsBRFSS, 1990, 2000, 2010
(*BMI 30, or about 30 lbs. overweight for 5’4” person)
H08-8

Obesity Trends* Among U.S. AdultsBRFSS, 1985
(*BMI ≥30, or ~ 30 lbs. overweight for 5’ 4” person)
H08-9

Obesity Trends* Among U.S. AdultsBRFSS, 1991
(*BMI ≥30, or ~ 30 lbs. overweight for 5’ 4” person)
H08-10

Obesity Trends* Among U.S. AdultsBRFSS, 1997
(*BMI ≥30, or ~ 30 lbs. overweight for 5’ 4” person)
No Data <10% 10%–14% 15%–19% ≥20%
H08-11

Obesity Trends* Among U.S. AdultsBRFSS, 2001
(*BMI ≥30, or ~ 30 lbs. overweight for 5’ 4” person)
No Data <10% 10%–14% 15%–19% 20%–24% ≥25%
H08-12
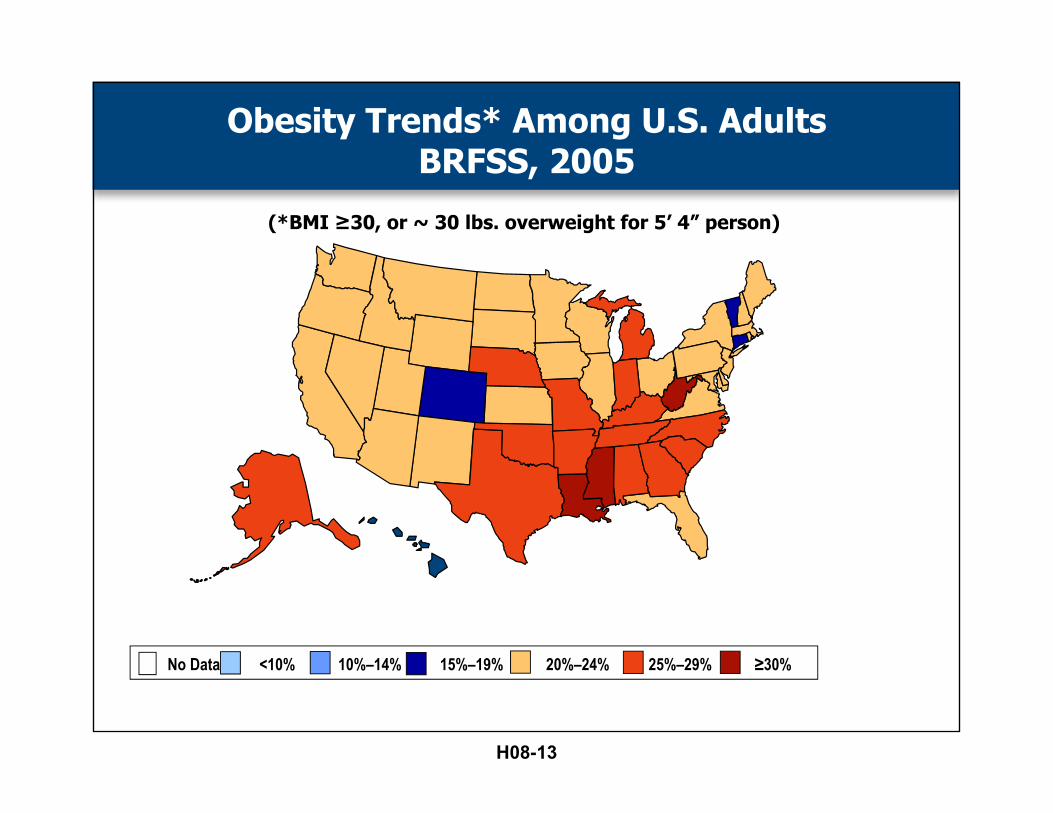
Obesity Trends* Among U.S. AdultsBRFSS, 2005
(*BMI ≥30, or ~ 30 lbs. overweight for 5’ 4” person)
No Data <10% 10%–14% 15%–19% 20%–24% 25%–29% ≥30%
H08-13

Obesity Trends* Among U.S. AdultsBRFSS, 2010
(*BMI ≥30, or ~ 30 lbs. overweight for 5’ 4” person)
H08-14
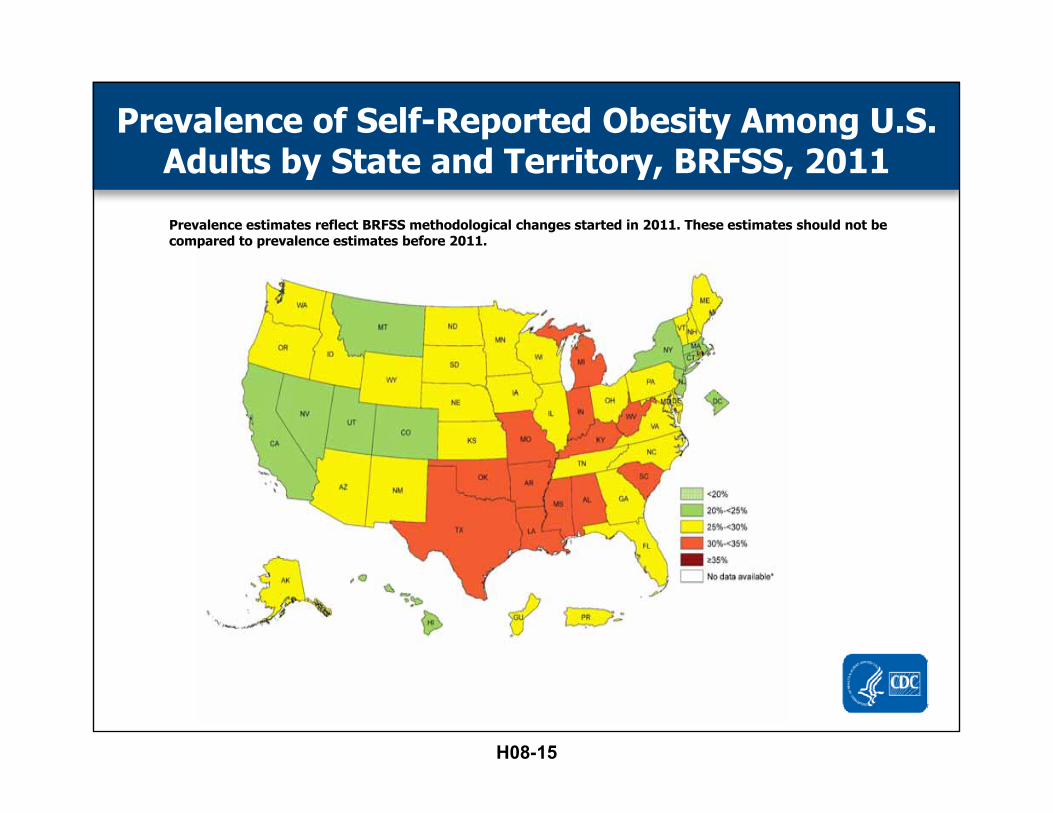
Prevalence of Self-Reported Obesity Among U.S. Adults by State and Territory, BRFSS, 2011
Prevalence estimates reflect BRFSS methodological changes started in 2011. These estimates should not be compared to prevalence estimates before 2011.
H08-15
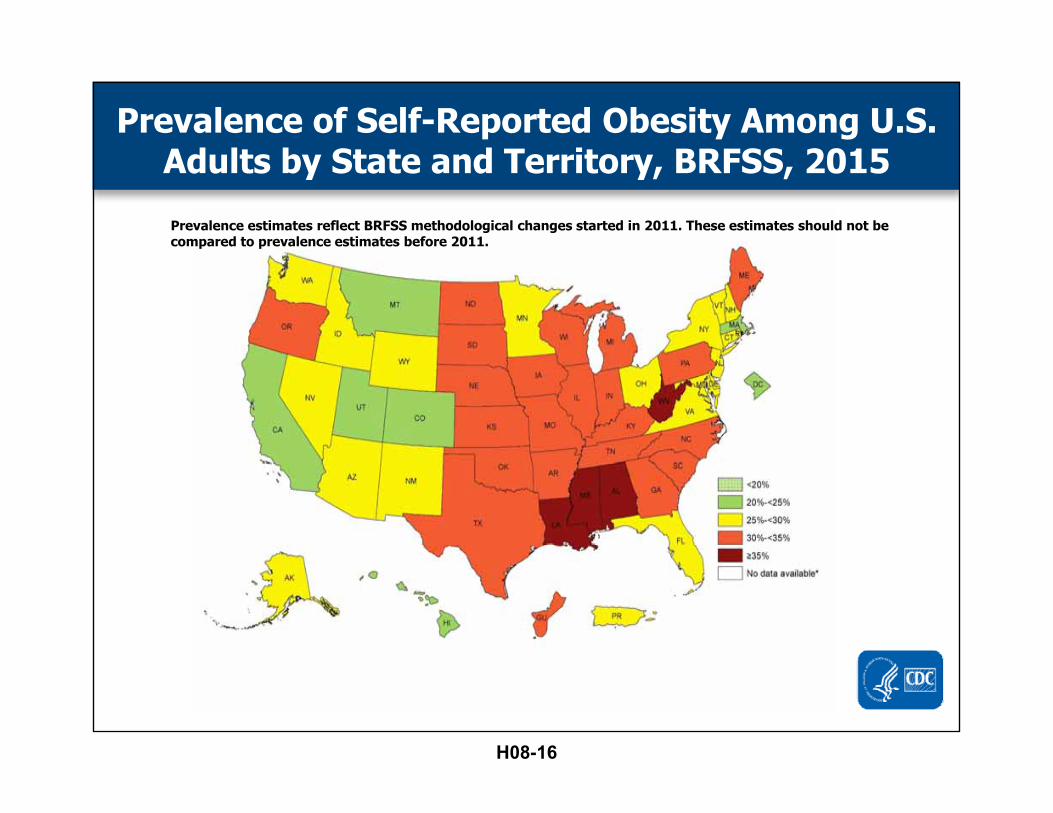
Prevalence of Self-Reported Obesity Among U.S. Adults by State and Territory, BRFSS, 2015
Prevalence estimates reflect BRFSS methodological changes started in 2011. These estimates should not be compared to prevalence estimates before 2011.
H08-16

Prevalence of Self-Reported Obesity Among Non-Hispanic White Adults, by State and Territory, BRFSS, 2013-2015
*Sample size <50 or the relative standard error (dividing the standard error by the prevalence) ≥ 30%.
H08-17

Prevalence of Self-Reported Obesity Among Hispanic Adults, by State and Territory, BRFSS, 2013-2015
*Sample size <50 or the relative standard error (dividing the standard error by the prevalence) ≥ 30%.
H08-18

Prevalence of Self-Reported Obesity Among Non-Hispanic Black Adults, by State and Territory, BRFSS, 2013-2015
*Sample size <50 or the relative standard error (dividing the standard error by the prevalence) ≥ 30%.
H08-19

Transit Worker Challenges
• Dispersed work locations DC, MD, VA• Sedentary• Shift work• Irregular breaks• Traffic• Customer abuse
H08-20

Disease or ConditionPopulation
RateAdjusted Prevalence
Variance
Hypertension 27.6 41.5 150.4%Depression 10.5 16.2 154.3%Cardiovascular disease 8.1 14.5 179.0%Diabetes 7.8 17.3 221.8%
P. Timothy Bushnell, PhD, MPA, et al; Group Medical Claims as a Source of Information on Worker health and Potentially Work‐Related Diseases; Journal of Occupational and Environmental Medicine, V 53, N 12, December 2011
Industry Groups with adjusted prevalence more than 120% of population averageLocal and interurban transport
Transit Industry is Sicker
H08-21

First Steps
• Hired Wellness Program Manager in June 2014
• Hired Wellness Worksite Specialist in October 2015
• Started premium incentives in Jan 2016
H08-22

First Steps
• Surveyed the population• Identify early champions• Developed a brand• Developed a mission statement• Developed a strategy• Identify a vendor partner
H08-23

Mission Statement
We aim to empower Local 689 members and their families by equipping them with the
information and tools needed to make small changes moving toward a healthier life.
H08-24

Organizational Support
• One wellness program for Local 689 members
• One wellness program for non-rep• We can’t change the work environment• We can help them cope
H08-25

Data Support
• For Members– Track activity– Participate in challenges– Get tips on healthy living– Earn points
• For the program– Track activity– Reward points
H08-26
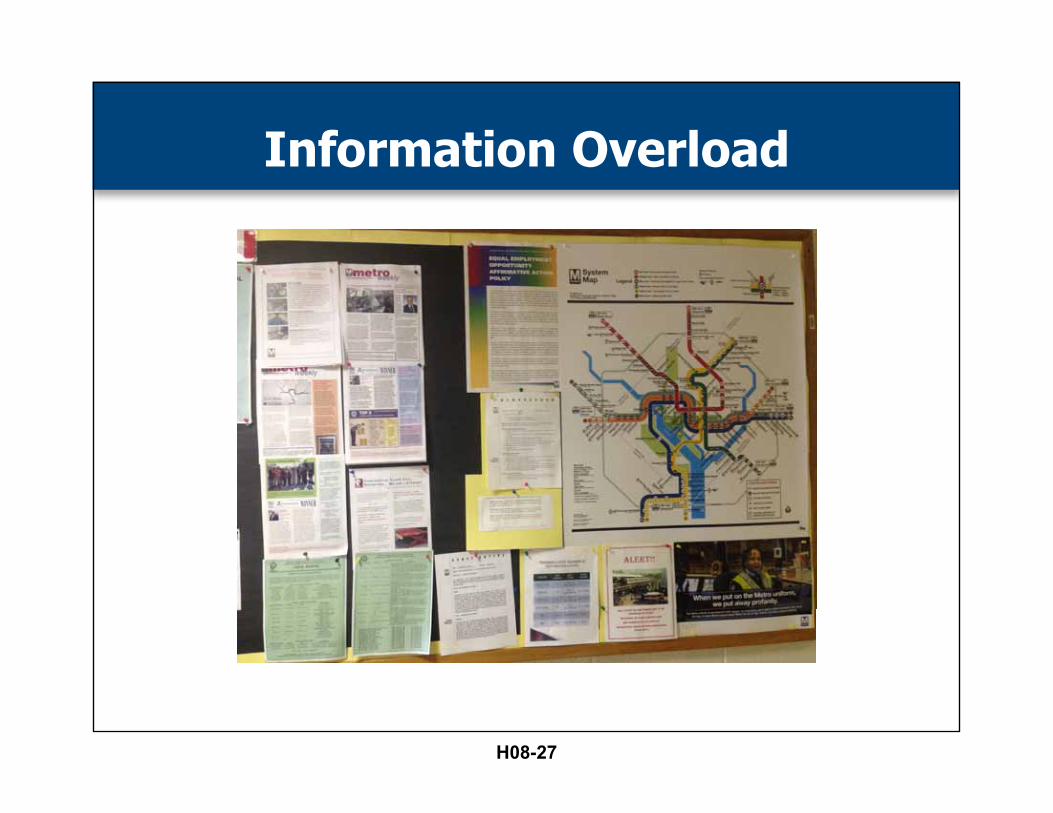
Information Overload
H08-27

• https://www.youtube.com/watch?v=-aniqJOKt8o&index=7&list=FLC61ykCDGxtcwTuqX-qcyPA
Our Promotional Video
H08-28

• Health Fairs
Activities
H08-29

• Exercise Classes
Activities
H08-30

• Screenings
Activities
H08-31

• Information
Activities
H08-32

Starlings and Behavior Change
H08-33

The opinions expressed in this presentation are those of the speaker. The International Foundationdisclaims responsibility for views expressed and statements made by the program speakers.
Effective Identification and Management of Heart Disease
H08-34

The Problem
• Heart Disease—The leading cause of death and disability among men and women in the U.S.
• For many, the first and only symptom is a fatal heart attack
• AHA reports heart disease affects 40% of U.S. adults (116 million) and associated annual costs expected to reach $818 billion in the U.S. by 2030
American Heart Association
H08-35

Why?
• Poor diet
• Sedentary lifestyle
H08-36

Ineffective Management
• Fails to identify and effectively treat those most at risk
• Focused on intervention instead of prevention
H08-37

The Solution
• Non-invasive ultrafast CT Scan of coronary arteries to objectively measure presence of disease and to validate effectiveness of recommended interventions over time
• Lifestyle changes coupled with medical management interventions proven to halt progression of disease
H08-38

H08-39

Direct and Indirect Medical Cost of Cardiovascular Diseases 2011
• Heart Disease $190.3 Billion• Hypertension $ 50.6 Billion• Stroke $ 34.3 Billion• Other CardioVascular $ 22.5 Billion
»TOTAL: $297.70 Billion
Source: National Heart, Lung, Blood Institute2011 American Heart Association
Published: Roger VL et al., Circulation Dec. 15, 2011
H08-40

Non Medical Economic Impact of CAD
Estimated at$400,000,000,000
a year.
H08-41

American Heart AssociationHeart Disease and Stroke
Statistics Update
1 out of 4 Americansdie from
Coronary Vascular Disease.
(More than all cancers and accidents combined)
H08-42

Primary Coronary Prevention
• An expensive failure. • Although we are much better at keeping
people alive when they survive their first heart attack . . .
• We have made almost no gains in preventing the first heart attack.
H08-43
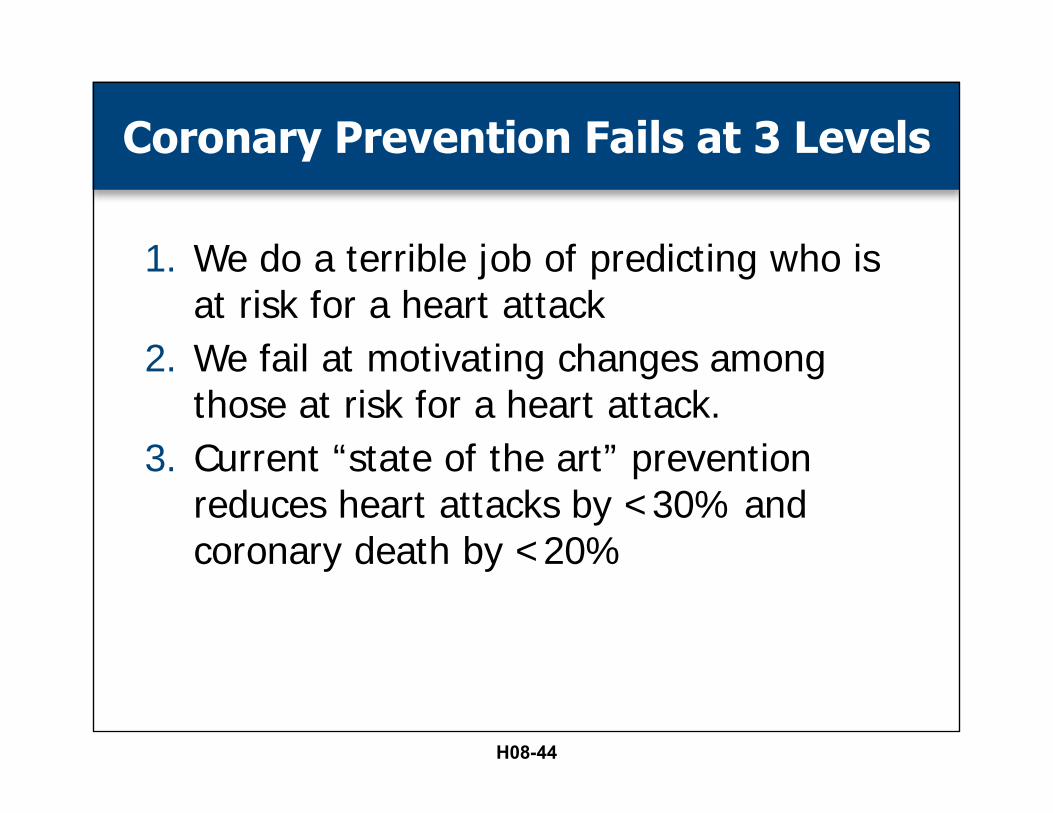
Coronary Prevention Fails at 3 Levels
1. We do a terrible job of predicting who is at risk for a heart attack
2. We fail at motivating changes among those at risk for a heart attack.
3. Current “state of the art” prevention reduces heart attacks by <30% and coronary death by <20%
H08-44

Developing an Effective Cardiovascular Prevention
Program
• There's a way to do it better—Find it.Thomas A. Edison
H08-45
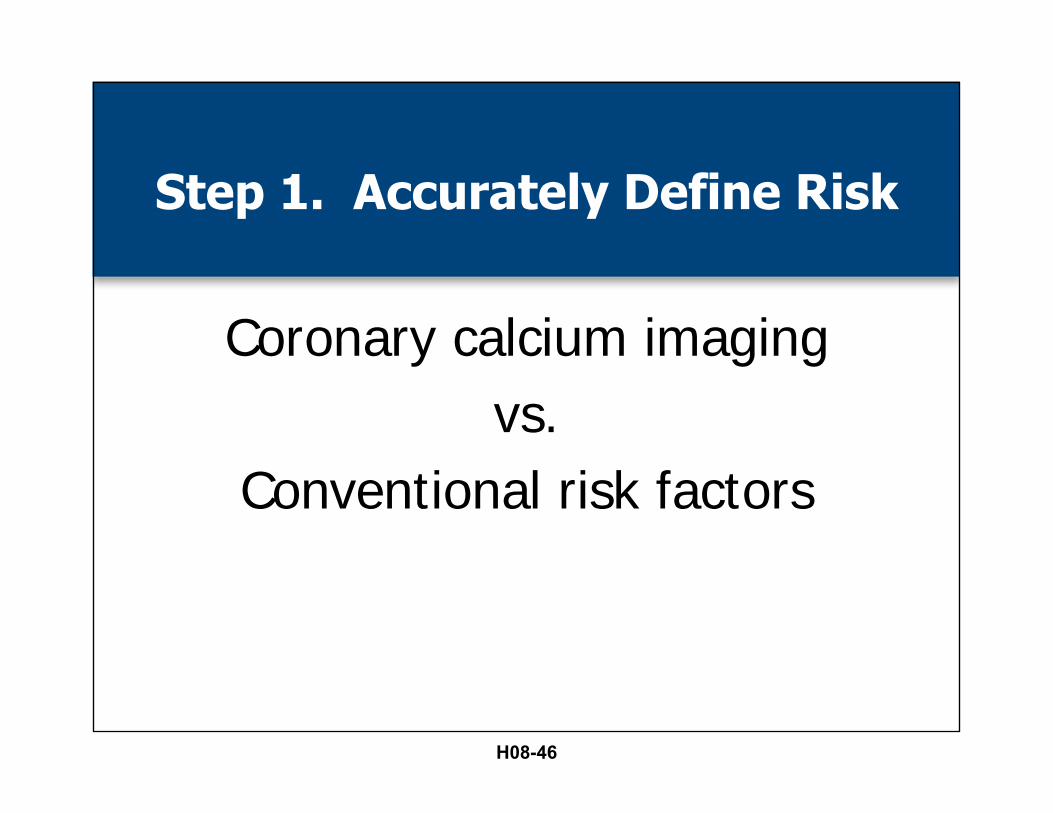
Step 1. Accurately Define Risk
Coronary calcium imaging vs.
Conventional risk factors
H08-46

Prevalence of Major Risk Factors in Men Prior to their Heart Attack
Khot, et al. JAMA. 2003
43.0%
1 major risk factor
0 major risk factors
19.4%2 major risk
factors
27.8%
3 major risk factors
8.9%
4 major risk factors
0.9%
62.4% have 0 to 1 major risk factor(s)
N=87,869
4 Major modifiable risk factors: hypertension, smoking, hypercholesterolemia, diabetes
Khot, et al. JAMA. 2003
H08-47

Sachdeva A et al. Am Heart J 2009; 157:111-117.
Cholesterol Levels Among Subjects Presenting with Symptomatic Coronary
Artery Disease. (n=103,632)
103,632 subjects presented with symptomatic coronary disease
48,093 subjects presented with non-cardiac diagnoses and no history of vascular disease.
LDL and HDL cholesterol were measured.
H08-48

• 77% with LDL <130
• 50% with LDL < 100
• 17% with LDL < 70
Cholesterol Levels Among Subjects Presenting with Symptomatic Coronary
Artery Disease. (n=103,632)
H08-49

LDL levels with and without CAD
77% of subjects with CAD had LDL < 130
72% of subjects without CAD had LDL < 130
Sachdeva A et al. Am Heart J 2009; 157:111-117.
H08-50

Non-Contrast Ultrafast CT Scan for Coronary Artery Calcium:
H08-51

Prediction of Cardiac Events in AsymptomaticPatients by Coronary Calcium
Kondos et al, Circulation 2003;107:2571-2176
5635 asymptomatic, low to intermediate risk patients, 37+12 m f/u
Cardiac events: MI, SCD, revascularization, age 30-76, avg 51+9 yrs.
1.00.75 1.25 1.50 3.0 30.0
Age: 1.04-1.071.05
1.39 Smoking: 1.04-1.870.87
Elevated TC: 0.65-1.07
1.98DM: 1.19-3.28
1.33HTN: 0.98-1.81
10.46Presence of CAC: 3.85-28.4
RelativeRisk
H08-52

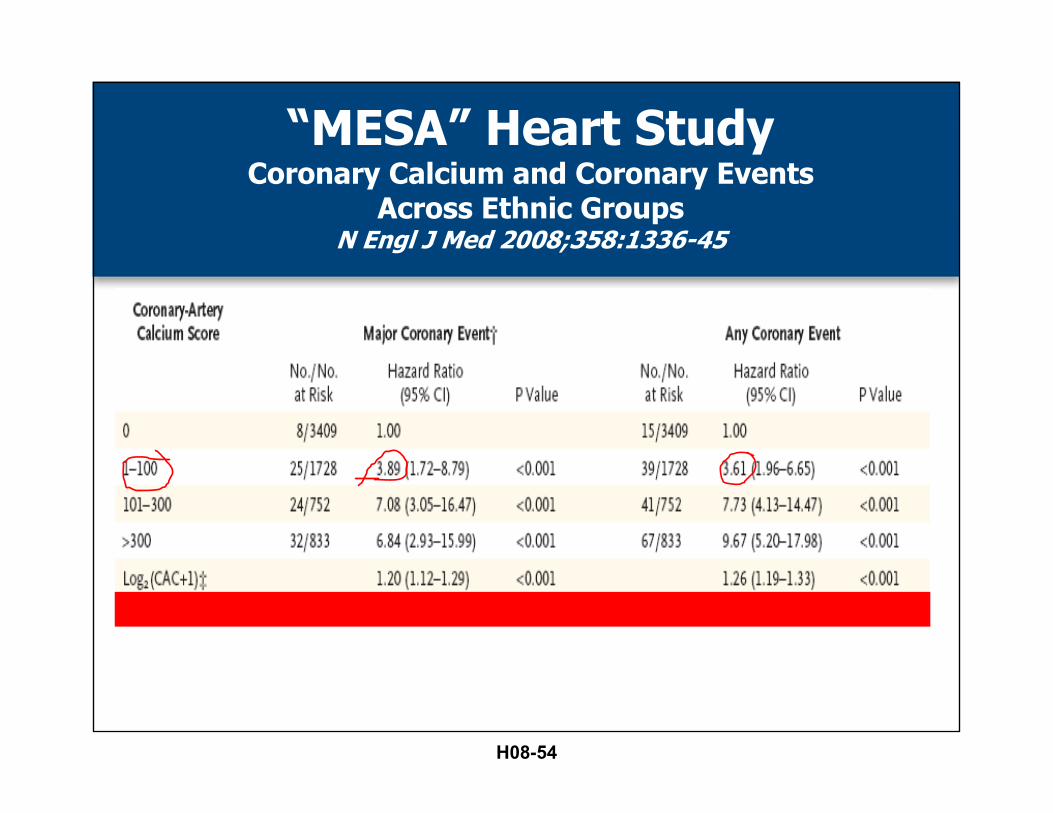
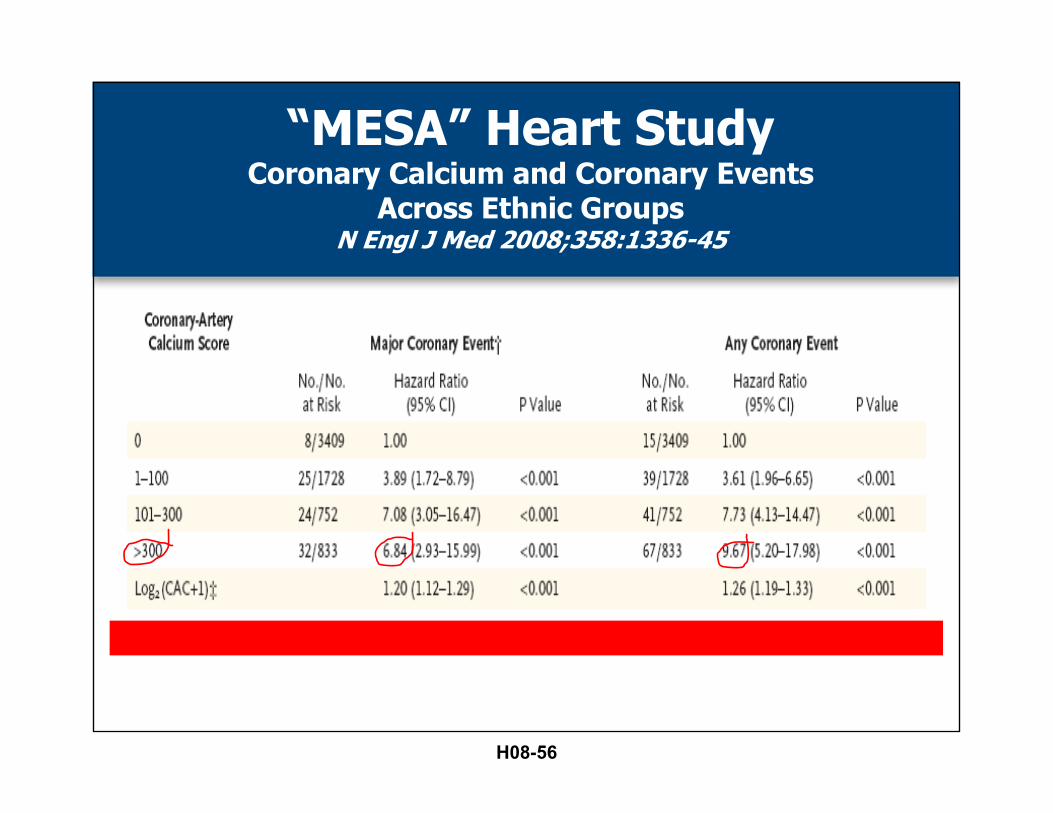
“MESA” Heart StudyCoronary Calcium and Coronary Events
Across Ethnic GroupsN Engl J Med 2008;358:1336-45
• 6,722 men and women• 38.6% White, 27.6% Black, 21.9%
Hispanic, 11.9% Chinese• No clinical cardiovascular disease at the
start of the study• Subjects followed for a median of 3.8
years
H08-53
“MESA” Heart StudyCoronary Calcium and Coronary Events
Across Ethnic GroupsN Engl J Med 2008;358:1336-45
H08-54

“MESA” Heart StudyCoronary Calcium and Coronary Events
Across Ethnic GroupsN Engl J Med 2008;358:1336-45
H08-55
“MESA” Heart StudyCoronary Calcium and Coronary Events
Across Ethnic GroupsN Engl J Med 2008;358:1336-45
H08-56

Prediction of Cardiac Events in AsymptomaticPatients by Coronary calcium
The St. Francis Heart Study
SFHS 3
0
0.5
1
1.5
2
2.5
3
3.5
0 > 0 > 100 > 200 > 600
0.1
0.7
2
2.4
3.3
Baseline EBT Calcium Score
Ann
ual E
vent
Rat
e (%
)
H08-57

CAC vs Angiography Keelan et al. (Circulation. 2001;104:412-417.)
• 288 Patients underwent Coronary Calcium score, risk factor assessment, and coronary angiography. Patients re-evaluated 7 years later. 22 heart attacks had occurred
• Calcium score was more predictive of heart attacks than angiographic plaque burden
• CAC score over 100 was the strongest predictor of heart attacks. Conventional risk factors provided no risk stratification.
H08-58

Step 2.
Inspire subjects to comply with medical therapeutic interventions.
DietExercise
SupplementsDental hygiene
MedicationsAdequate Sleep
Stress Management
H08-59
Diet
• High in fruits and vegetables• Especially pigmented berries• High in beneficial fats (fish oil, olive oil,
avocado, and tree nuts)• Low in sugar and carbs• Saturated fats are not the culpret
H08-60

Exercise
• 20 minute daily walk associated with a 50% reduction in heart attacks.
• 30 minute walk 3 X a week provides 90% of the benefit that any level of exercise gives.
H08-61

Supplements
• Fish oil• Vitamin D-3• Vitamin K-2• Niacin• Aged Garlic extract
H08-62
Dental Hygiene
• Brush twice a day• Floss at least once every day.
H08-63

Medication
• Aspirin• Cholesterol lowering meds• Blood Pressure• Diabetes
H08-64

Appropriate Sleep
• Over 6 hours a night• Shift work is associated with increased MI• Consider sleep apnea
H08-65

Stress Management
• Avoid stress
H08-66
How Effective are We in Promoting Heat Attack Prevention?
• Do people make the changes that results in improved outcomes?
H08-67

Less than 25% of patients who qualify for cholesterol
lowering medication are prescribed and take them.
Southern Medical Journal, 2001 Sachdeva A et al. Am Heart J 2009; 157:111-117.
Cholesterol
H08-68

Blood Pressure
• Only 1/3rd of adults with high blood pressure are treated to goals.
NCHS and NCLBI
H08-69
What Changes When We Add Coronary Calcium?
• Compliance with therapies dramatically improves
H08-70

505 patients followed for 3 years
H08-71

Odds Ratio for Drug Use, According to Presence of CAC or NCEP Risk Factors
Taylor AJ. American Heart Association 2006 Scientific Sessions; November 12-15, 2006; Chicago, IL.
Variable Odds ratio, CAC (95% CI)
Odds ratio, NCEP risk factors (95% CI)
Statin and aspirin use
6.97 (4.81-10.10) 1.52 (1.27-1.82)
H08-72

Eisner Trial
Measurement of coronary calcium correlates with a net improvement in:
• Blood pressure • LDL cholesterol • Waist circumference• Weight loss
J Am Coll Cardiol. 2011;57(15):1622-1632. doi:10.1016/j.jacc.2011.01.019
H08-73

Step 3.
Accurate measure of success of prevention.
H08-74

The Heart Protection Study Lancet 2002 Jul 6;360(9326):7-22.
• 20,536 UK adults (aged 40-80 years)• 40 mg simvastatin daily• Results at year 5: • Conclusion: Adding simvastatin to existing
treatments safely produces substantial additional benefits for a wide range of high-risk patients,irrespective of their initial cholesterol concentrations.
H08-75

• (12% reduction in all cause mortality)• (18% reduction in coronary death)• (23% reduction in first heart attack)
The Heart Protection Study Lancet 2002 Jul 6;360(9326):7-22.
H08-76
A Better Way
• Measuring serial coronary calcium is a much more powerful metric of adequacy of preventive strategies.
H08-77

Angiographic Progression and Coronary Calcium Score
The American Journal of cardiology, April 1, 2003
• 43 subjects with coronary artery diseaseunderwent coronary calcium score andquantitative coronary angiography thenrepeated both 26 months later.
• 10 subjects had angiographic progression.• 33 subjects were stable on the second
angiogram.
H08-78

CAC as a Predictor of Angiographic Progression
The American Journal of cardiology, April 1, 2003
H08-79

CAC Progression
• Mean annual increase in calcium scores was 38%
• Mean annualized increase in calcium scores of the 10 patients with plaque progression was 117%
• Mean annualized increase in calcium scores in 33 stable patients was 16%
H08-80

Raggi Intervention Study
• 495 asymptomatic patients with coronary artery calcium placed on 10 mg Lipitor.
• Serial ultrafast CAC scans performed for up to 6 years.
• 41 subjects had myocardial infarctions.• There was no difference in the LDL values
of the group with MIs(118) vs the group without(122).
Arteriosclerosis, Thrombosis, and Vascular Biology 2004;24:1272
H08-81

20% of patients had 0 increase in calcium score. There were 0heart attacks in this group over
6 years.
Raggi Intervention Study
H08-82

Progression of calcium score of <15%/year: 3% of subjects had a heart attack over the 6
year study.
Raggi Intervention Study
H08-83

Progression of calcium score of >15%/year: 34% of subjects
had a heart attack over the 6 year study.
Raggi Intervention Study
H08-84

There was a 17.2 foldincreased risk of MI with CAC progression > 15%/year.
Raggi Intervention Study
H08-85

Cumulative MI free survival for patients with yearly calcium
volume score change +/- 15%
H08-86

H08-87

Progression of Coronary Artery Calcium Predicts All-Cause Mortality
• The study sample consisted of 4,609 consecutive asymptomatic individuals referred by primary physicians for CAC measurement with electron beam tomography, who underwent repeat screening.
• Follow up for up to 16 yearsJ ACC : Ca r d io v a s c u l a r I m a g in g v o l . 3 , n o . 1 2 , 2 0 1 0
H08-88

• Progression of coronary calcium of >15% annually was associated with 3 fold increase in all cause mortality compared to stable plaque
JACC: Ca r d io v a s c u l a r I m a g in g v o l . 3 , n o . 1 2 , 2 0 1 0
Progression of Coronary Artery Calcium Predicts All-Cause Mortality
H08-89

H08-90

Using calcium imaging to:1. Diagnose coronary risk 2. Promote compliance with treatment3. Measure adequacy of preventive
therapies
CAN PREVENT THE VAST MAJORITY OF HEART ATTACKS.
Conclusion
H08-91

My experience in Colorado.
H08-92

573 subjects with 2 CAC scans (Boulder Internal Med PC 2013)
• Average age 66.6• % women 41.5 % men 58.5• Average calcium score 514 • Average age/gender percentile 57.7
H08-93

BP, Smoking and Medication
• Average BP 120/76 • Smokers 5.52% Previous Smoker 35.63% • Taking Statins 50.8% • Taking Ace/Arb 29.4% • Taking Beta Blockers 15.8% • Taking Ca++ Blockers 15.5% • Taking Niacin 29.5%
H08-94

Calcium Scores
• 112 (19.1%) AG Scores of (0)
• 166 (25.3%)AG Scores of (1-100)
• 63 (10.7%)AG Scores of (100-200)
• 64 (10.9%)AG Scores of (200-400)
• 34 (5.8%)AG Scores in (400-600]
• 56 (9.5%)AG Scores 600- 1000
• 92 (15.6%) AG Scores >1000
Expected MI over 6 years
0
3
3
5
4
10
55
80 (Total)
H08-95
Calcium progression
• Average annualized % change 15%• Average annualized square root change
0.75
• SqRt CA Change < 2.1 530 (90.3%)• SqRt CA Change > 2.1 57 (9.7%)
H08-96

Clinical Outcomes (as of July 9, 2013)
• There was 1 MI among these patients with 2 calcium scores (study>6 years ongoing).
• Number of coronary deaths = 0• Elective stents for angina control = 5 • Annual MI incidence after the second calcium
score 3438 pt/years = < 0.03%
H08-97

Perspective
• Framingham “low risk” = MI <1%/Year• Calcium score of “0”= MI <0.1%/Year• Experience among subjects followed with
serial CAC score = MI <0.03%/Year
H08-98

H08-99
Implementation in Philadelphia
• Worked with Bill and chief of cardiology (and other staff) at major university hospital in Philadelphia to construct a program we hope will emulate Bill’s success in Boulder using local labor health fund populations
• First group, Teamsters Local 830, implemented October, 2015
H08-100

Implementation in Philadelphia
• Since then program also implemented by Law Enforcement, Firefighters, Glaziers and Operating Engineers
• Scan generally offered to males age 40+ and females age 50+
• Developed and distributed prevention brochure to entire population and program brochure to age eligible (repeated annually)
H08-101

Implementation in Philadelphia
• Hospital coordinates scheduling, dissemination of results to both patients and PCPs which include specific recommended interventions, rescan interval, and serves as resource to patients and physicians
• Fee is $199 per scan (paid entirely by Fund)• Results information soon to be shared with
other clinical resources utilized by labor funds so they may offer additional support to patients
H08-102

Implementation in Philadelphia
• Also will soon begin to see reporting of fund specific and cross fund results
• Assuming we are able to achieve the intended results, hope to publish in medical journals
H08-103

Results
• As of mid-September 132 Teamsters members and 1,113 total labor fund members scanned
• Hope to significantly improve these numbers in the coming year using personal outreach to members
H08-104

Challenges
• Only two locations where scan is offered in our area (for some members, can be significant distance from home)
• Getting PCP’s cooperation in assisting members with recommended interventions
H08-105

Land Mines
• Avoid inappropriate use of stress testing and angiography simply because a person has a positive calcium scan.
• Stress tests are of almost no value in finding people at risk for heart attacks.
• 9 studies have determined that angiography and stents reduce heart attacks by 0% and coronary death by 0%.
H08-106
Session #H08
Wellness Benefits in Health Plans
• Wellness is about creating a culture of health• Changing the culture means
– Moving individuals one at a time– Finding those individuals who will motivate others– To change their world
• The measures of success are– Engaged and successful workers
• How do you measure that?• Heart Disease estimated to cost $880 billion by 2030• More people die from heart disease each year than
all cancers combined• Lifestyle and failure of conventional medicine to
identify and adequately treat risk are major reasons• Hi speed CT of coronary arteries to detect presence
of coronary calcium provides objective evidence of coronary disease
• Identifying patients earlier, intervening and measuring success with serial heart scans can lead to infinitely better health outcomes and significantly lower spending.
Website Resourceshttp://www.ifebp.org/inforequest/ifebp/0166666.pdfhttps://www.ifebp.org/inforequest/ifebp/0165693.pdf
62nd Annual Employee Benefits ConferenceNovember 13-16, 2016Orlando, Florida
H08-107

2017 Educational ProgramsHealth and Welfare
63rd Annual Employee Benefits Conference October 22-25, 2017 Las Vegas, Nevadawww.ifebp.org/usannual
Certificate SeriesFebruary 27-March 4, 2017 Lake Buena Vista (Orlando), FloridaJuly 24-29, 2017 Denver, Coloradowww.ifebp.org/certificateseries
Health Care Management ConferenceMay 1-3, 2017 New Orleans, Louisianawww.ifebp.org/healthcare
Certificate of Achievement in Public Plan Policy (CAPPP®)Part I and Part II, June 13-16, 2017 San Jose, CaliforniaPart II Only, October 21-22, 2017 Las Vegas, Nevadawww.ifebp.org/cappp
Related ReadingVisit one of the on-site Bookstore locations or see www.ifebp.org/bookstore for more books.
Self-Funding Health Benefit PlansItem #7563www.ifebp.org/SelfFunding
816
H08-108