Embed Size (px)
Citation preview

Wellness in the Workplace
Benefits Forum 2005
Atlanta Association of Health Underwriters
February 17, 2005
William BurkeCapital Health Associates, LLC
James PriceHispaniCare, a division of DrTango
2
Agenda
1. Common issues regarding “wellness”
2. Defining a wellness program
3. Critical Success Factors
4. Logic for investing in wellness
5. What’s different today from 1995
6. An interesting client example
7. Lessons learned
3
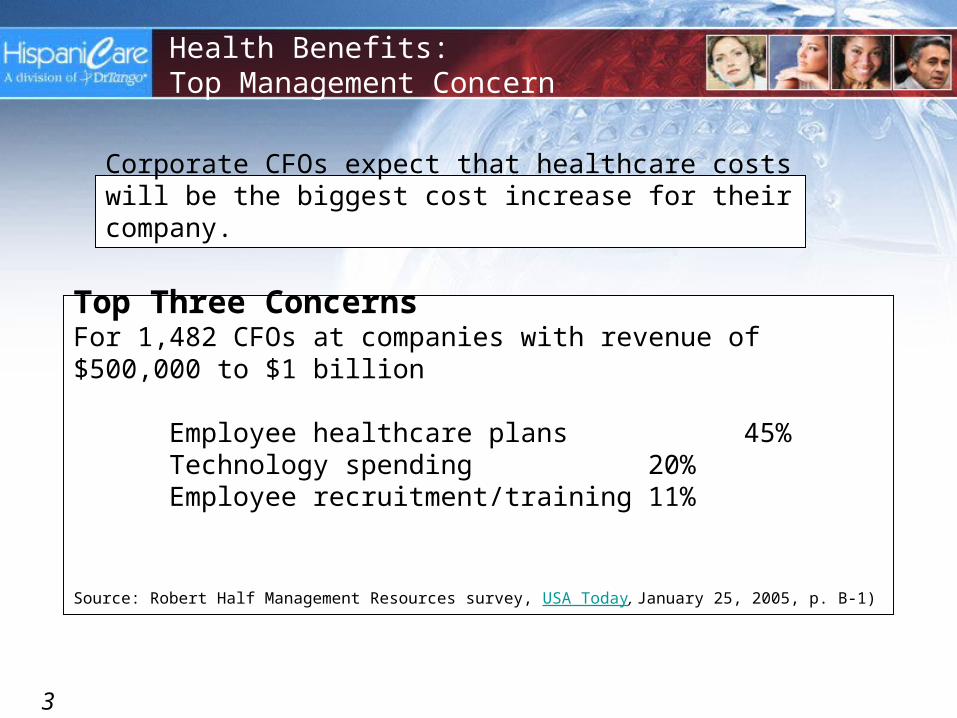
Corporate CFOs expect that healthcare costs will be the biggest cost increase for their company.
Health Benefits:Top Management Concern
Top Three ConcernsFor 1,482 CFOs at companies with revenue of $500,000 to $1 billion
Employee healthcare plans 45% Technology spending 20%Employee recruitment/training 11%
Source: Robert Half Management Resources survey, USA Today, January 25, 2005, p. B-1)
4
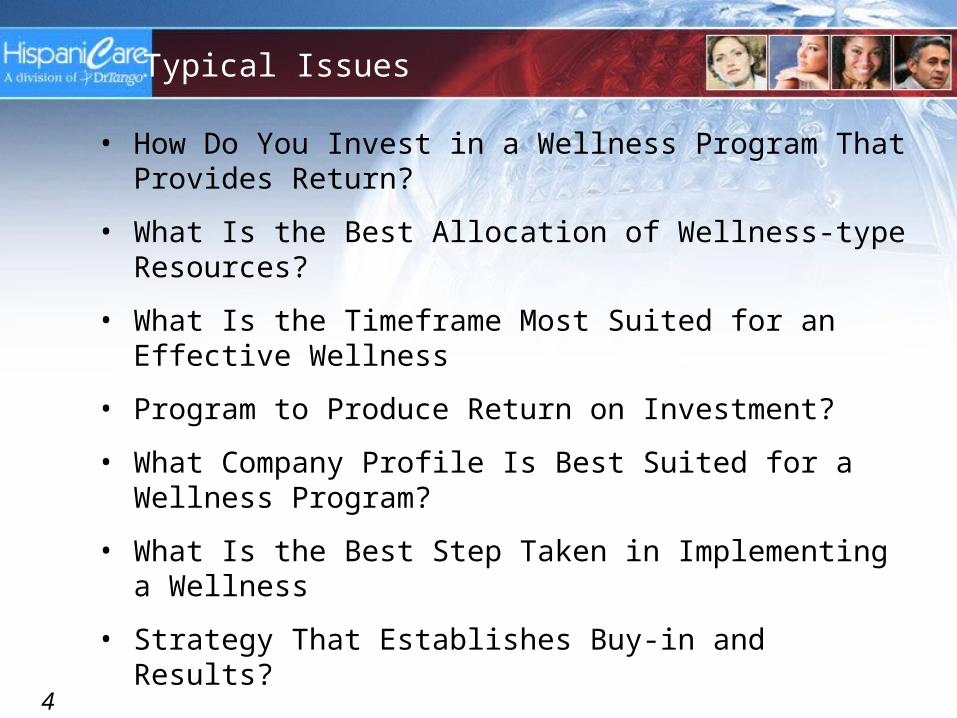
Typical Issues
• How Do You Invest in a Wellness Program That Provides Return?
• What Is the Best Allocation of Wellness-type Resources?
• What Is the Timeframe Most Suited for an Effective Wellness
• Program to Produce Return on Investment?
• What Company Profile Is Best Suited for a Wellness Program?
• What Is the Best Step Taken in Implementing a Wellness
• Strategy That Establishes Buy-in and Results?
5
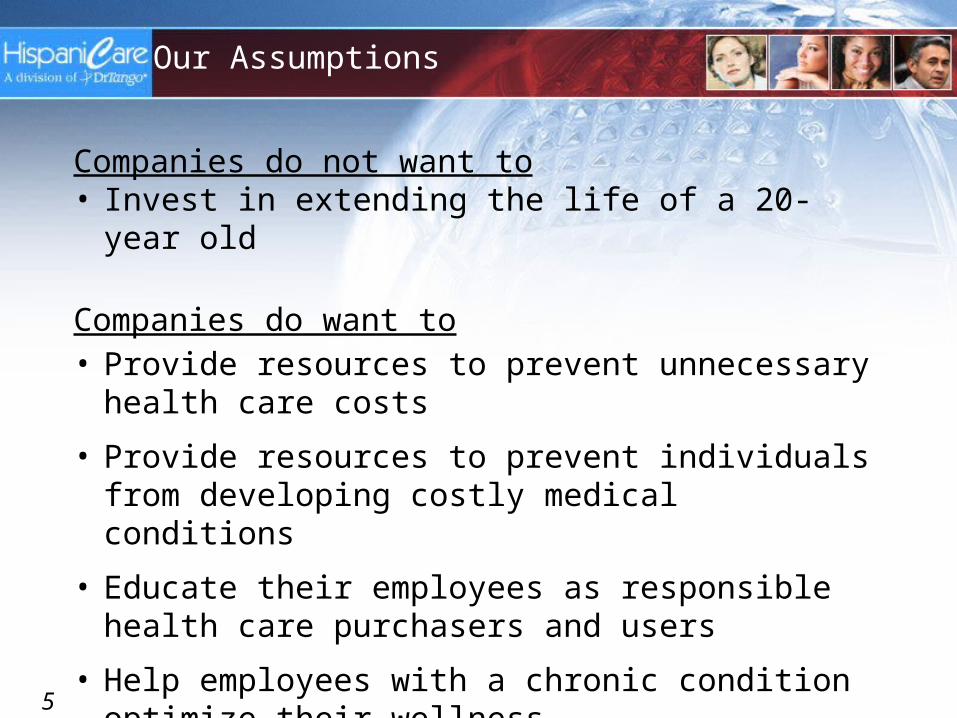
Our Assumptions
Companies do not want to• Invest in extending the life of a 20-year old
Companies do want to• Provide resources to prevent unnecessary
health care costs
• Provide resources to prevent individuals from developing costly medical conditions
• Educate their employees as responsible health care purchasers and users
• Help employees with a chronic condition optimize their wellness

8
How Does It Work Really?
Incentives• Financial• Non-financialDirectivesCultural MotivatorsBenefit Plan Design
Providing programs and tools that Providing programs and tools that empower People with information empower People with information
that encourages and supports them that encourages and supports them to take a more active role in their to take a more active role in their
health carehealth care
Providing programs and tools that Providing programs and tools that empower People with information empower People with information
that encourages and supports them that encourages and supports them to take a more active role in their to take a more active role in their
health carehealth care

9
IdealHealth
WorriedWell
Mod. ToSevere
ChronicallyIll
Sick, NotYet
Diagnosed
MildChronically
Ill
Segmenting your Covered Lives and Addressing each Segment’s Needs
Population Health Management/Wellness
DiseaseManagement
Prevention (for well people)
Awareness Compliance

10
Different Approach, Different Results Different Approach, Different Results
Health Maintenance VS Risk Management
• Have a problem, Fix It• Minimal organizational
commitment• Standard Plan Design• Willingness to allow benefit
plan design to control costs
• Assume there is Risk –
Find It, Fix It• Organizational Dedication• Wellness Integrated into
Plan Design
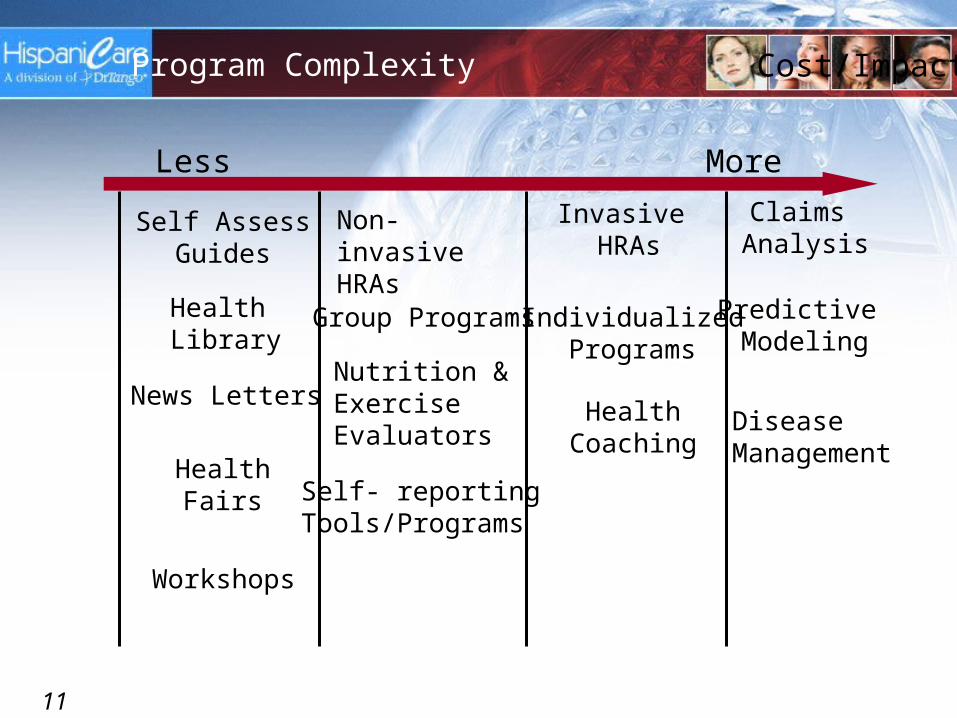
11
Predictive Modeling
Self AssessGuides
Cost/Impact
Invasive HRAs
Non-invasiveHRAs
Group Programs
DiseaseManagement
Health Library
News LettersNutrition &ExerciseEvaluators
Self- reportingTools/Programs
IndividualizedPrograms
HealthCoaching
HealthFairs
Claims Analysis
Workshops
Program Complexity
Less More
12
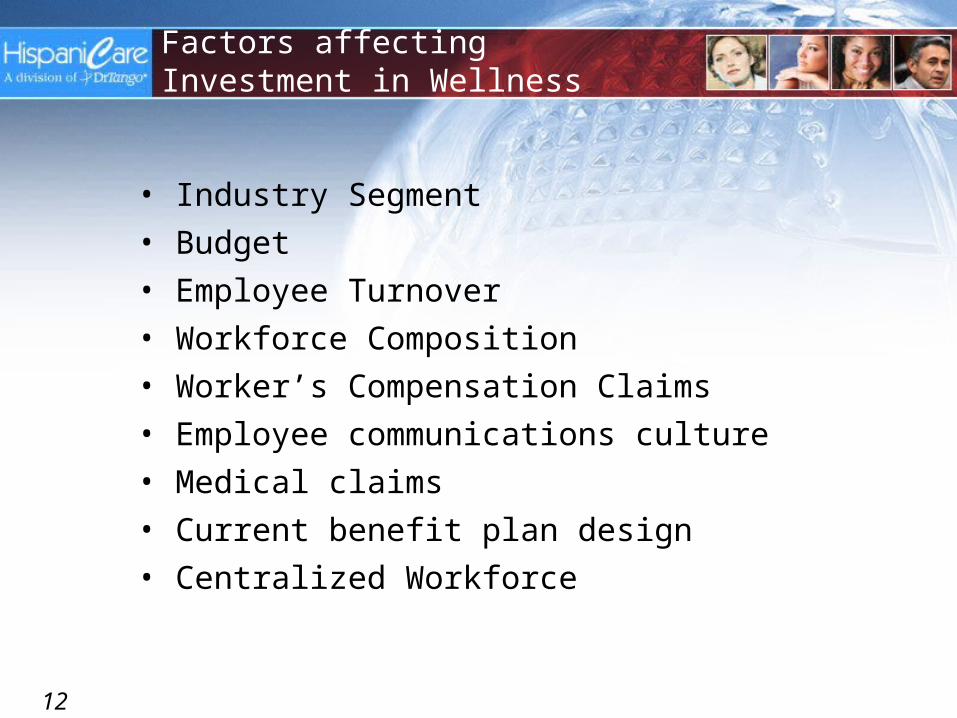
Factors affecting Investment in Wellness
• Industry Segment• Budget• Employee Turnover• Workforce Composition• Worker’s Compensation Claims• Employee communications culture• Medical claims• Current benefit plan design• Centralized Workforce
13
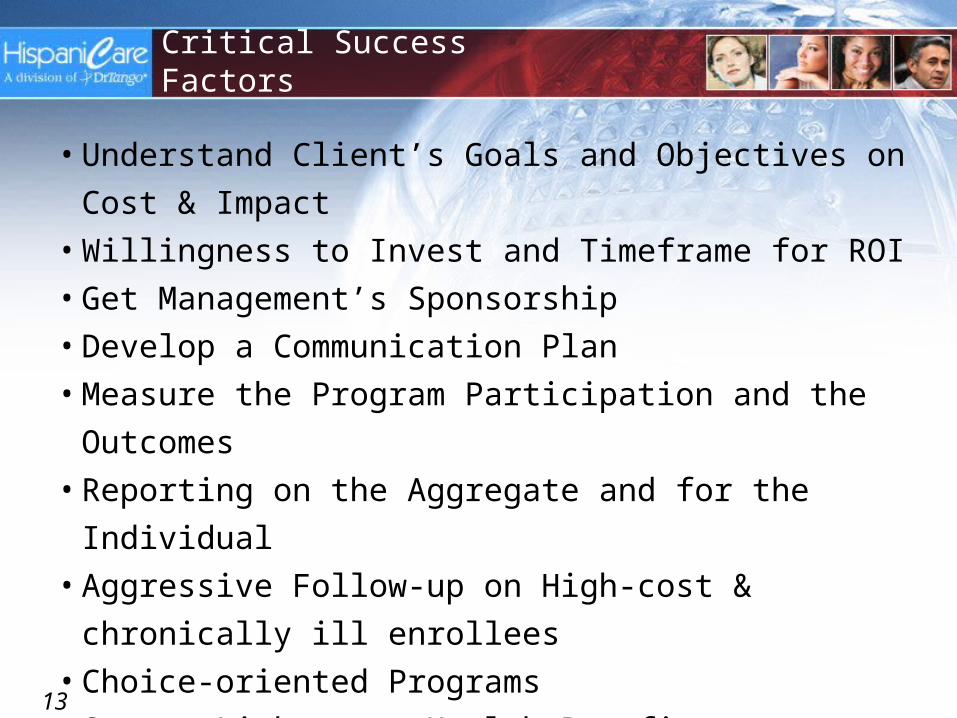
• Understand Client’s Goals and Objectives on Cost &
Impact• Willingness to Invest and Timeframe for ROI• Get Management’s Sponsorship• Develop a Communication Plan• Measure the Program Participation and the Outcomes• Reporting on the Aggregate and for the Individual• Aggressive Follow-up on High-cost & chronically ill
enrollees• Choice-oriented Programs• Strong Linkage to Health Benefits• Privacy, Privacy, Privacy
Critical Success Factors

14
Changes over past 10 years
1. Real healthcare costs per employee have tripled….so dollar value of 10% savings has tripled
2. Realization that chronic conditions drive healthcare costs
3. Realization that behavior change is required
4. Behavior change is hard to effect
5. Current health outcomes (awareness, status, process) are poor
6. The nation’s workforce is becoming very multi-cultural
7. Most people access the Internet
8. Explosion of Internet-based health/wellness applications…at very low costs
15
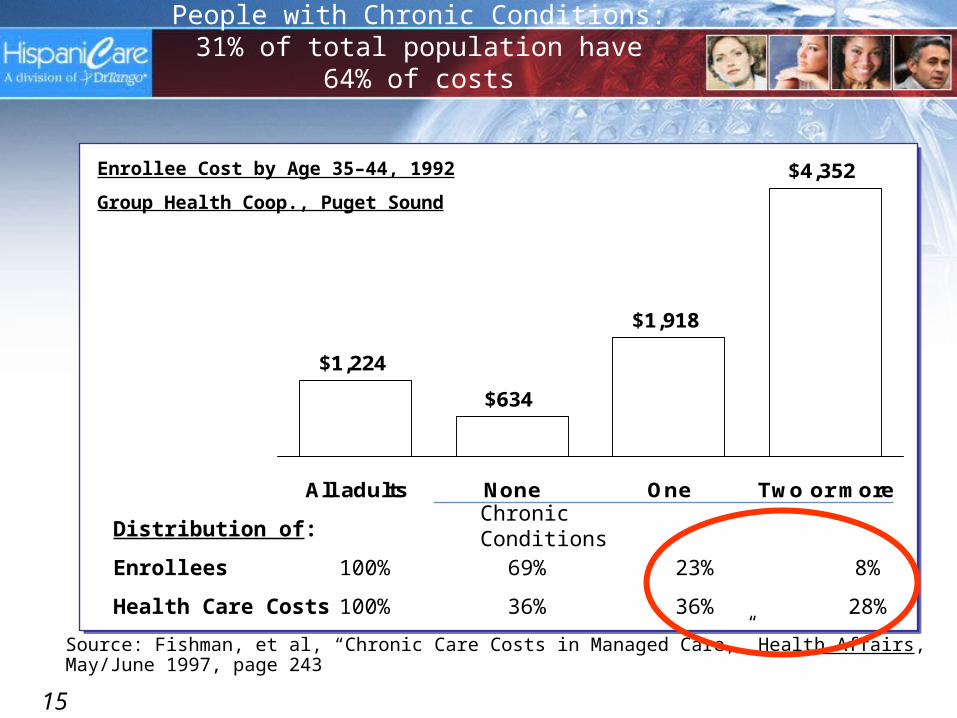
People with Chronic Conditions: 31% of total population have 64% of costs
$1,224
$634
$1,918
$4,352
All adults None One Two or more
Source: Fishman, et al, “Chronic Care Costs in Managed Care,” Health Affairs, May/June 1997, page 243
Enrollee Cost by Age 35–44, 1992
Group Health Coop., Puget Sound
Distribution of:
Enrollees 100% 69% 23% 8%
Health Care Costs 100% 36% 36% 28%
Chronic Conditions
16
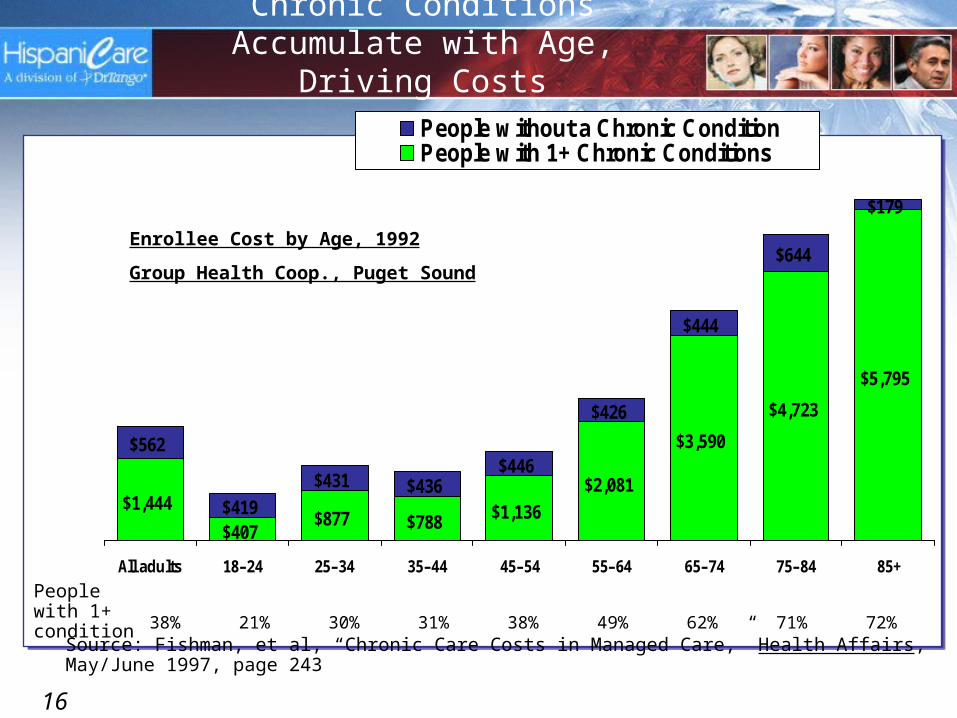
Chronic Conditions Accumulate with Age, Driving Costs
$1,444
$407$877 $788 $1,136
$2,081
$3,590
$4,723
$5,795
$179
$644
$444
$426
$446$436$431
$419
$562
All adults 18–24 25–34 35–44 45–54 55–64 65–74 75–84 85+
People without a Chronic ConditionPeople with 1+ Chronic Conditions
Enrollee Cost by Age, 1992
Group Health Coop., Puget Sound
Source: Fishman, et al, “Chronic Care Costs in Managed Care,” Health Affairs, May/June 1997, page 243
38% 21% 30% 31% 38% 49% 62% 71% 72%People with 1+ condition

17
Importance of Weight Management for Employers
45%
36%
17%
Normal Overweight Obese
Prevalence of Weight Status, Adults with Commercial Insurance
13%
37%
Overweight Obese
Increase in Adult per Capita Medical Spending Attributable to Weight
(Commercial)
Total Medical Expenditures due to Overweight/Obesity: 8.2%
$12-15 PMPM cost for typical commercial plan
Source: Health Affairs, May 2003

18
Relative risk of Selected Obesity-Related Diseases
Relative Risk, by BMI
< 25 25 – 28.9 > 29
“normal” “overweight” “obese”
Men
Hypertension 1.0 1.9 2.6
Type 2 Diabetes 1.0 2.6 10.4
Coronary heart disease 1.0 1.4 2.4
Women
Hypertension 1.0 2.3 3.8
Type 2 Diabetes 1.0 4.4 48.9
Coronary heart disease 1.0 1.7 3.0
Source: Oster et al, “The Clinical and Economic Burden of Obesity in a Managed Care Setting,” The American Journal of Managed Care, June 2000.

19
• Probability of diabetes, newborns:• 33% all American• 50% for Hispanics
• More than most other issues diet & health
driven by culture and language
20
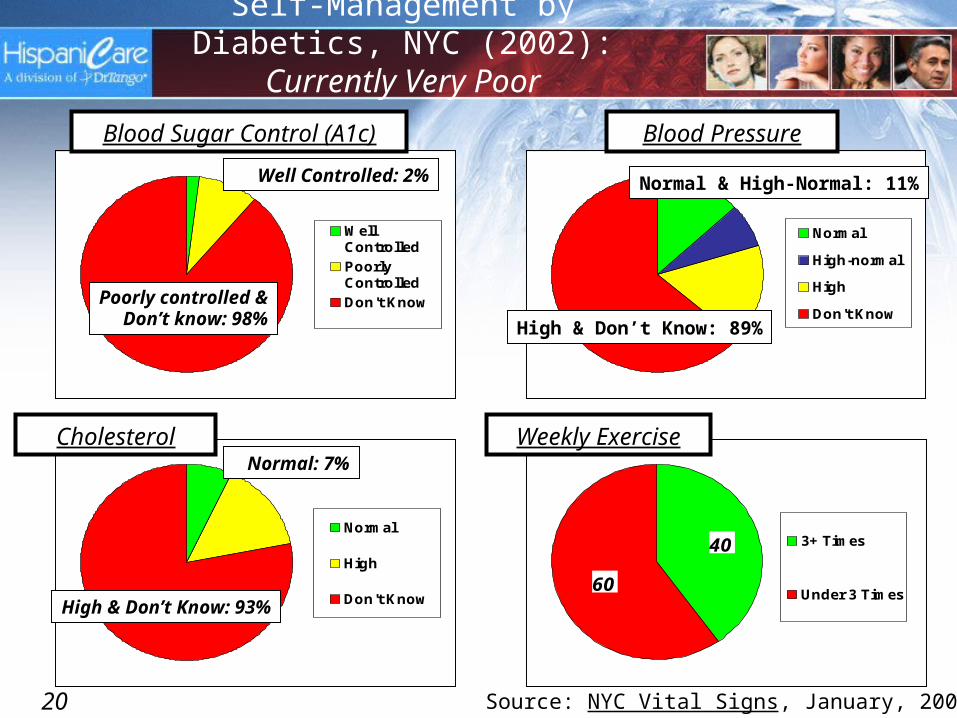
Self-Management by Diabetics, NYC (2002): Currently Very Poor
WellControlled
PoorlyControlled
Don't Know
Source: NYC Vital Signs, January, 2003
Well Controlled: 2%
Poorly controlled &Don’t know: 98%
Blood Sugar Control (A1c)
Normal
High-normal
High
Don't Know
Normal & High-Normal: 11%
High & Don’t Know: 89%
Blood Pressure
Normal
High
Don't Know
Normal: 7%
High & Don’t Know: 93%
Cholesterol
60
40 3+ Times
Under 3 Times
Weekly Exercise

21
“Minorities”: Driving population growth with Employer-Sponsored Insurance
Source: Census data; HispaniCare analysis
Demographic group 1990 2002 Growth
White non-Hispanic 123.3 130.8 7.6 6%
Hispanic 8.9 16.7 7.8 88%
African-American 13.6 18.8 5.2 38%
Asian 3.9 7.6 3.7 95%
Other 0.6 1.3 0.7 117%
Total 150.2 175.2 25.0 17%
Total “minority” 26.9 44.4 17.5 65%
Hispanic share 6% 10% 31%
Total U.S. Population with Employer-Sponsored Insurance (in millions)
22
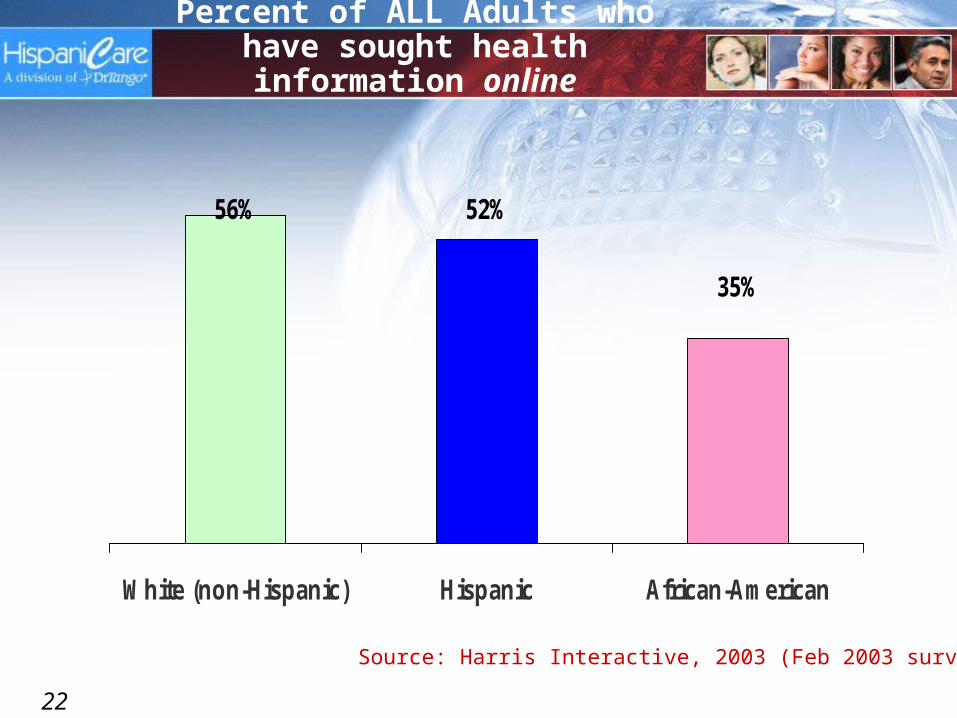
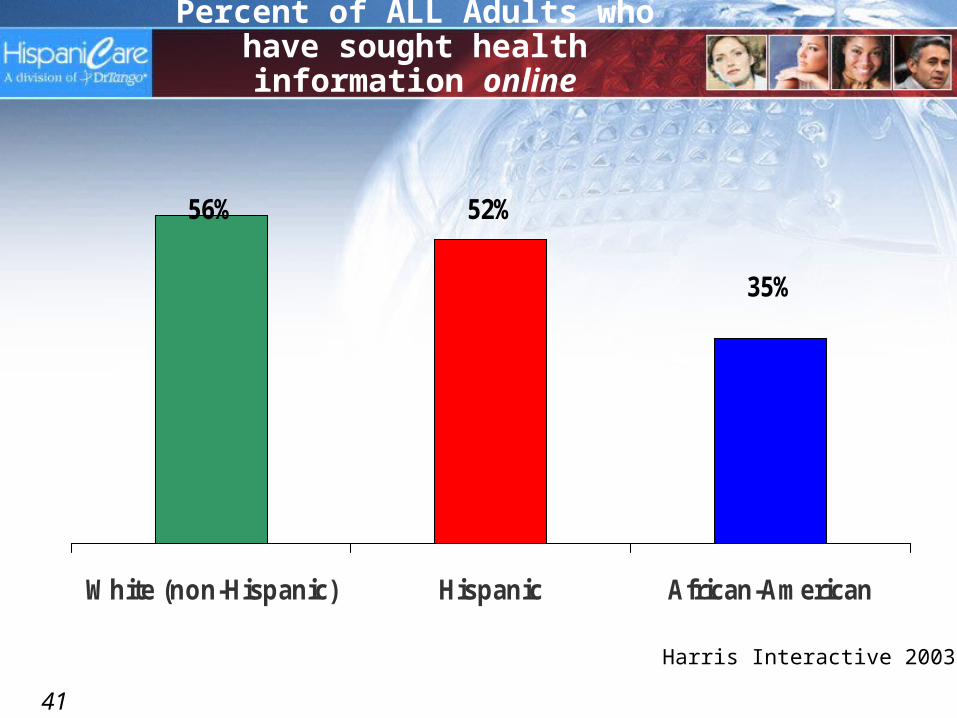
35%
52%56%
White (non-Hispanic) Hispanic African-American
Source: Harris Interactive, 2003 (Feb 2003 survey)
Percent of ALL Adults who have sought health information online
23
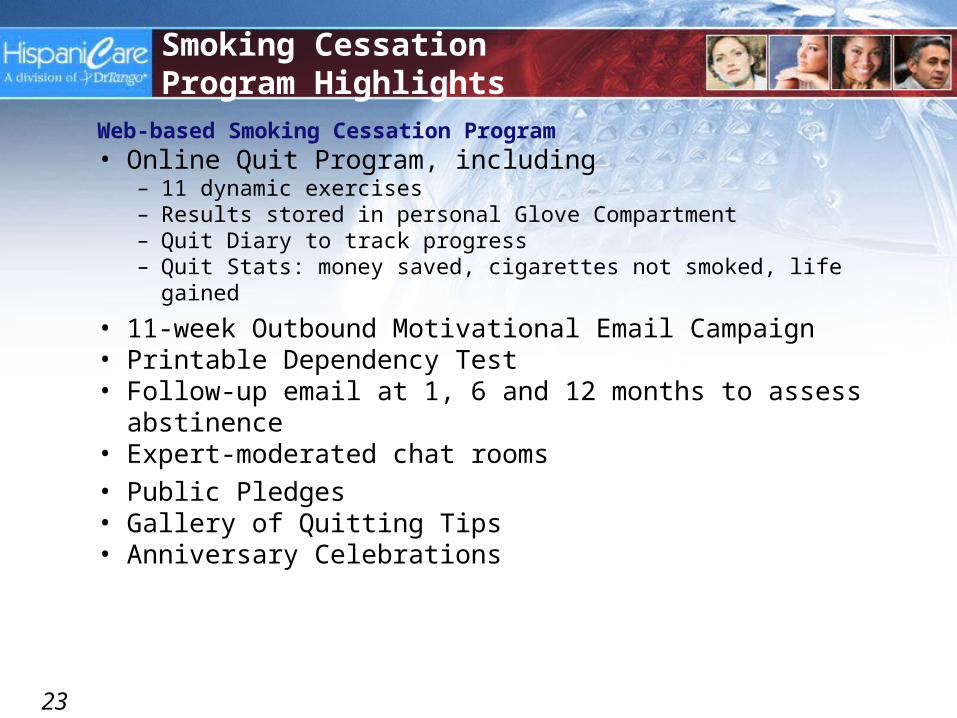
Web-based Smoking Cessation Program• Online Quit Program, including
– 11 dynamic exercises– Results stored in personal Glove Compartment– Quit Diary to track progress– Quit Stats: money saved, cigarettes not smoked, life gained
• 11-week Outbound Motivational Email Campaign• Printable Dependency Test• Follow-up email at 1, 6 and 12 months to assess
abstinence• Expert-moderated chat rooms
• Public Pledges • Gallery of Quitting Tips • Anniversary Celebrations
Smoking Cessation Program Highlights
24
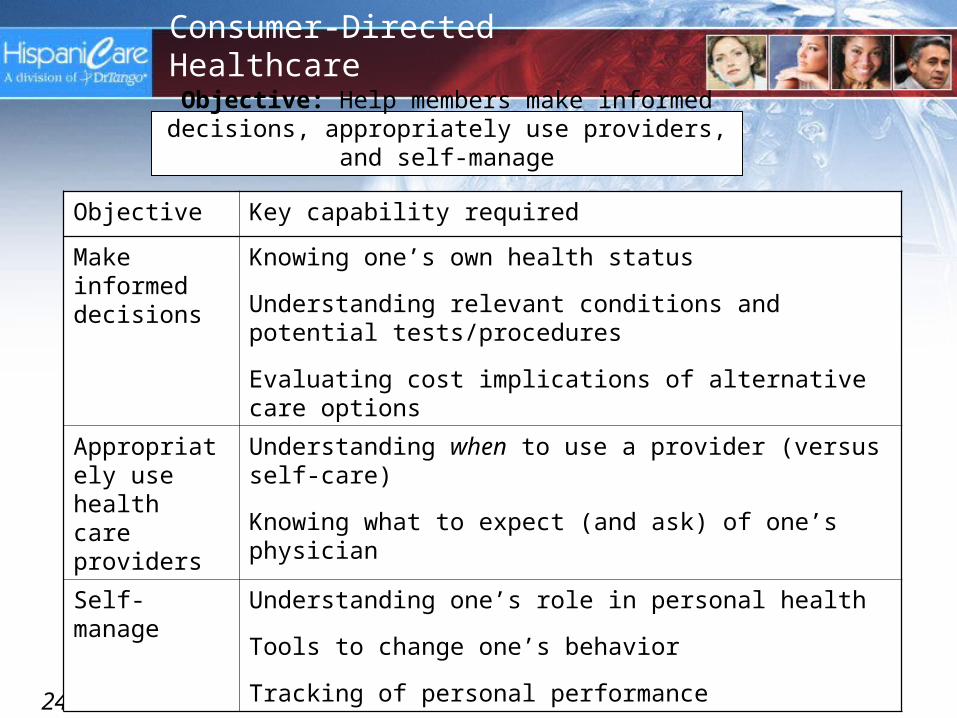
Consumer-Directed Healthcare
Objective Key capability required
Make informed decisions
Knowing one’s own health status
Understanding relevant conditions and potential tests/procedures
Evaluating cost implications of alternative care options
Appropriately use health care providers
Understanding when to use a provider (versus self-care)
Knowing what to expect (and ask) of one’s physician
Self-manage Understanding one’s role in personal health
Tools to change one’s behavior
Tracking of personal performance
Objective: Help members make informed decisions, appropriately use providers, and self-manage
25
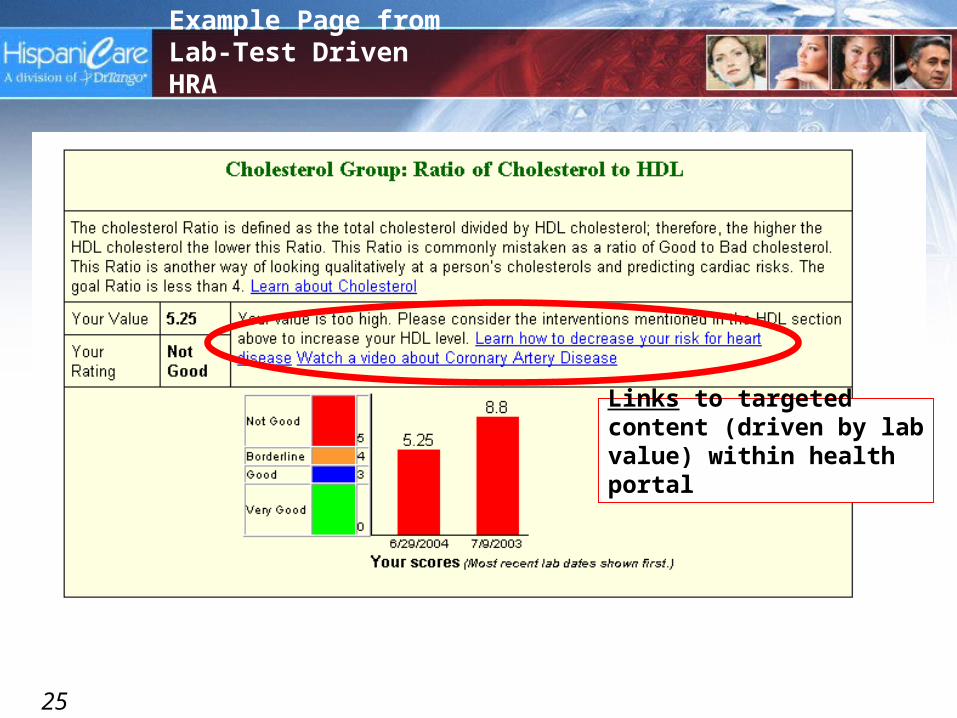
Example Page from Lab-Test Driven HRA
Links to targeted content (driven by lab value) within health portal

26
27
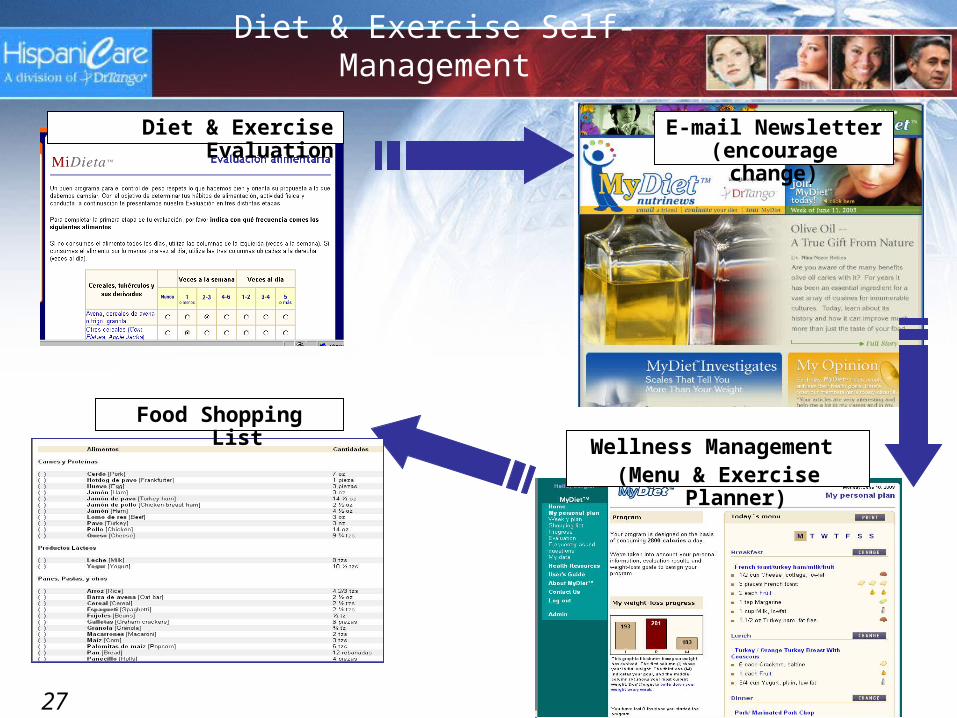
Diet & Exercise Self-Management
Diet & Exercise Evaluation
Wellness Management (Menu & Exercise Planner)
E-mail Newsletter (encourage change)
Food Shopping List
28
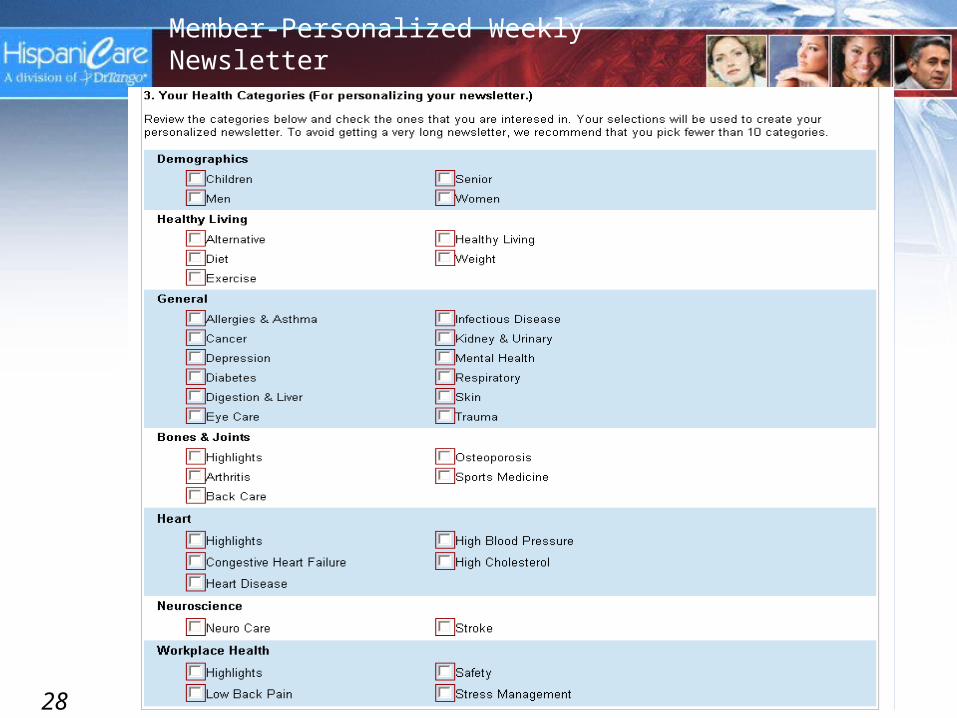
Member-Personalized Weekly Newsletter
29
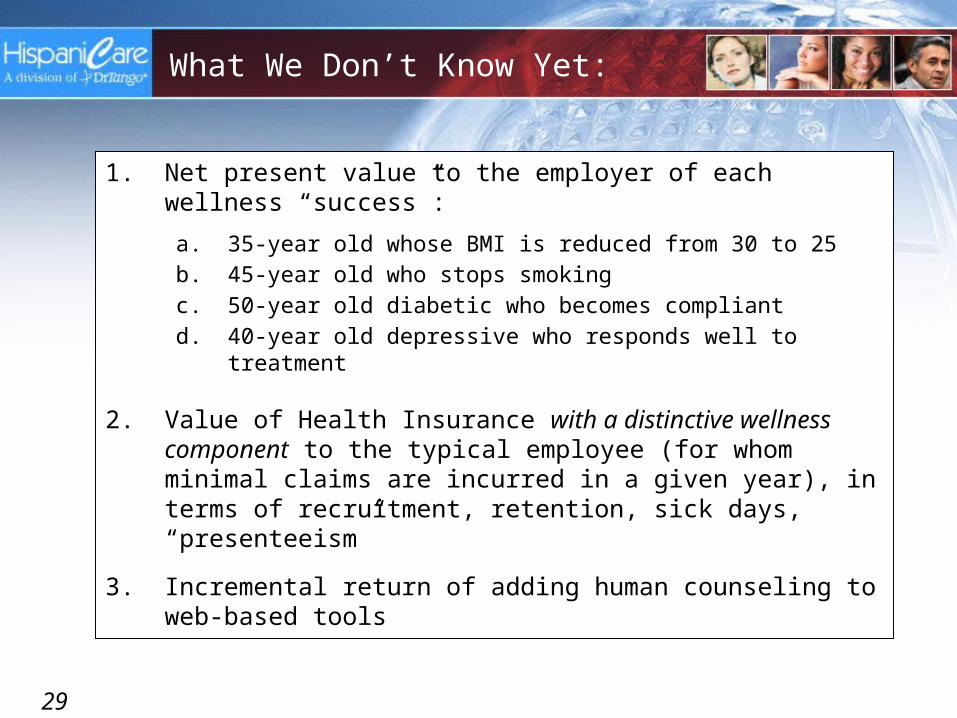
What We Don’t Know Yet:
1. Net present value to the employer of each wellness “success”:
a. 35-year old whose BMI is reduced from 30 to 25b. 45-year old who stops smokingc. 50-year old diabetic who becomes compliantd. 40-year old depressive who responds well to treatment
2. Value of Health Insurance with a distinctive wellness component to the typical employee (for whom minimal claims are incurred in a given year), in terms of recruitment, retention, sick days, “presenteeism”
3. Incremental return of adding human counseling to web-based tools

30
Robert Wood Johnson Health e_Technologies Research Project
Overall Goal: Rigorously evaluate the ability of the MiDieta™ (MyDiet) eHealth portal to facilitate improved diets, increased fitness-levels, and weight-loss among U.S. Hispanics.
Settings: Managed care (AtlantiCare, BCBS-FL) and Hospitals (Tenet, CHRISTUS)
Design: * Formative Research (6 m)* Randomized Trial (12 m)* n = 500 among four groups (at least)
Subjects: Overweight online Hispanics attending clinic / enrolled in managed care plan
Currently recruiting 2-5 employers by March 31

31
As a former VP-HR, I would:
1. Provide my employees with information to understand healthcare, increase awareness/interest, and help them make better decisions
2. Offer an inexpensive (but extensive-looking) basic wellness program/portal with:
a. Diet and exercise plannerb. Smoking cessationc. Depression supportd. Stress/anxietye. Guides for common chronic conditions
3. Increase awareness via:
a. Web-based Health Risk Assessmentb. Personalized weekly health newsletterc. Health fairsd. Incentives

32
As a former VP-HR, I would:
4. Explore:
a. Lab-test based Health Risk Assessmentb. Intensive support/tools for employees with chronic conditionsc. Offering employees (particularly those at high-risk or already
with a chronic condition) a Personal Health Recordd. On-site primary care
5. Document all outcomes, for future ROI discussions with the CFO

34
Appendix
• Slides we couldn’t delete
35
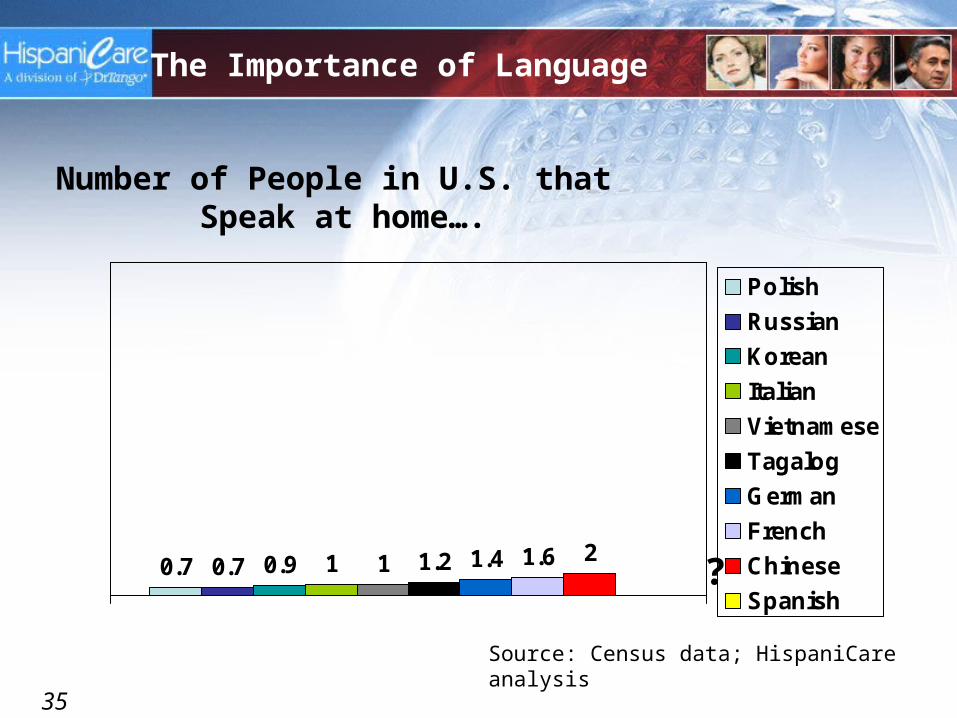
Number of People in U.S. that Speak at home….
0.7 0.7 0.9 1 1 1.2 1.4 1.6 2
Polish
Russian
Korean
Italian
Vietnamese
Tagalog
German
French
Chinese
Spanish?
The Importance of Language
Source: Census data; HispaniCare analysis

36
0.7 0.7 0.9 1 1 1.2 1.4 1.6 2
28.1Polish
Russian
Korean
Italian
Vietnamese
Tagalog
German
French
Chinese
Spanish
Spanish!
Number of People in U.S. that Speak at home….
Source: Census data; HispaniCare analysis

37
INSURED Hispanics Very sick, did NOT seek medical care
15
1930
0
5
10
15
20
25
30
NH-White English-Hisp. Spanish-Hisp
Source: Commonwealth Fund, Feb 2003
Percent
Language and culture are particularly relevant for health issues
38
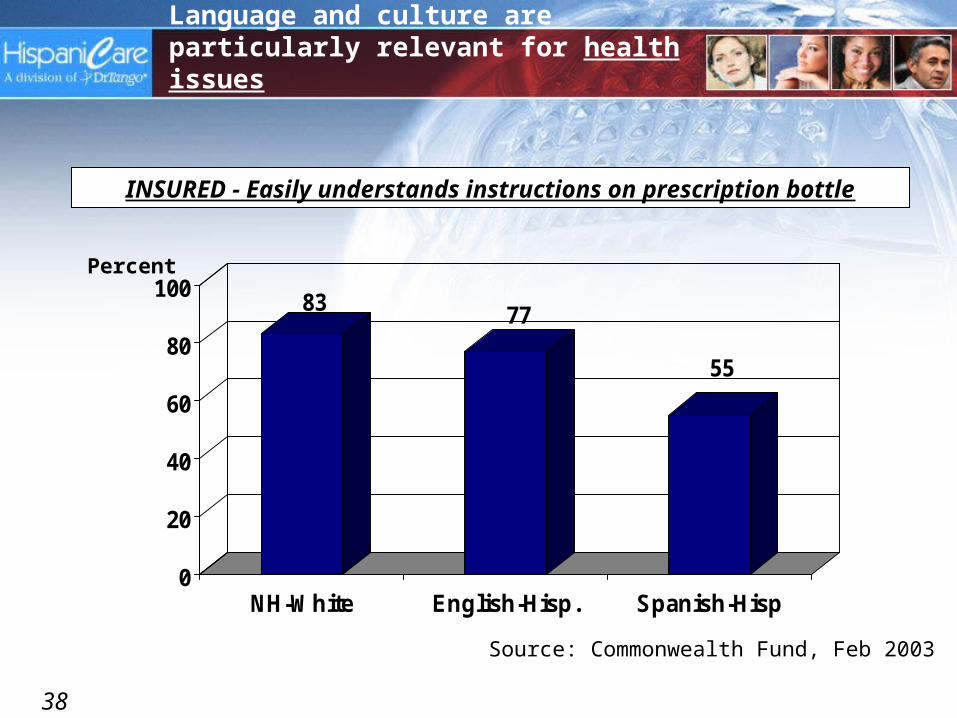
INSURED - Easily understands instructions on prescription bottle
83 77
55
0
20
40
60
80
100
NH-White English-Hisp. Spanish-Hisp
Source: Commonwealth Fund, Feb 2003
Percent
Language and culture are particularly relevant for health issues
39
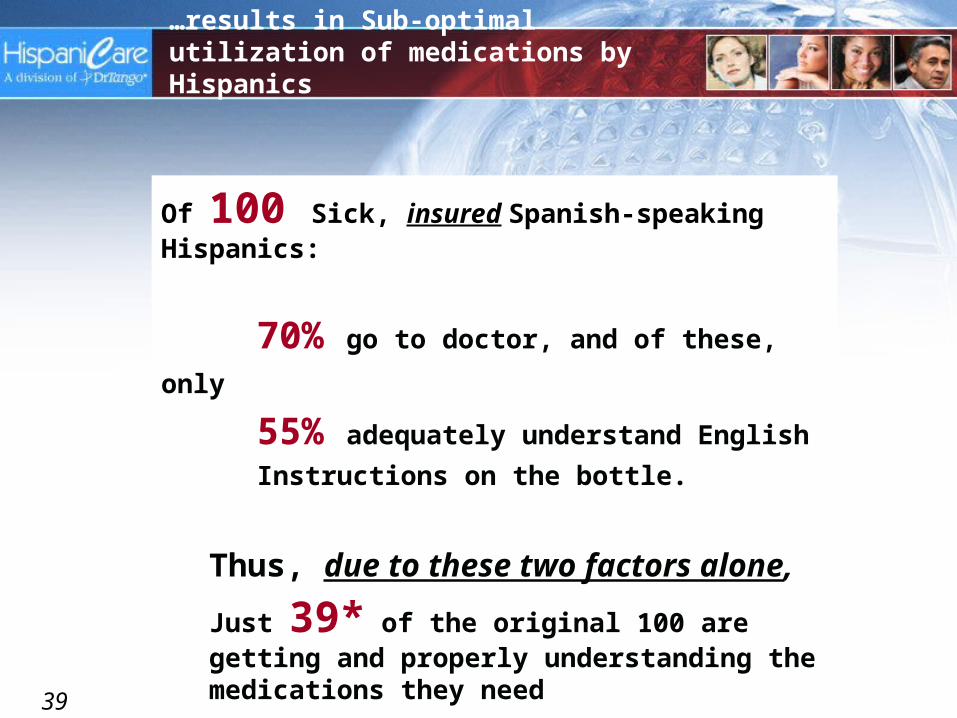
…results in Sub-optimal utilization of medications by Hispanics
Of 100 Sick, insured Spanish-speaking Hispanics:
70% go to doctor, and of these, only 55% adequately understand English
Instructions on the bottle.
Thus, due to these two factors alone,
Just 39* of the original 100 are getting and properly understanding the medications they need
*(100 x 0.7 x 0.55 = 39)
40
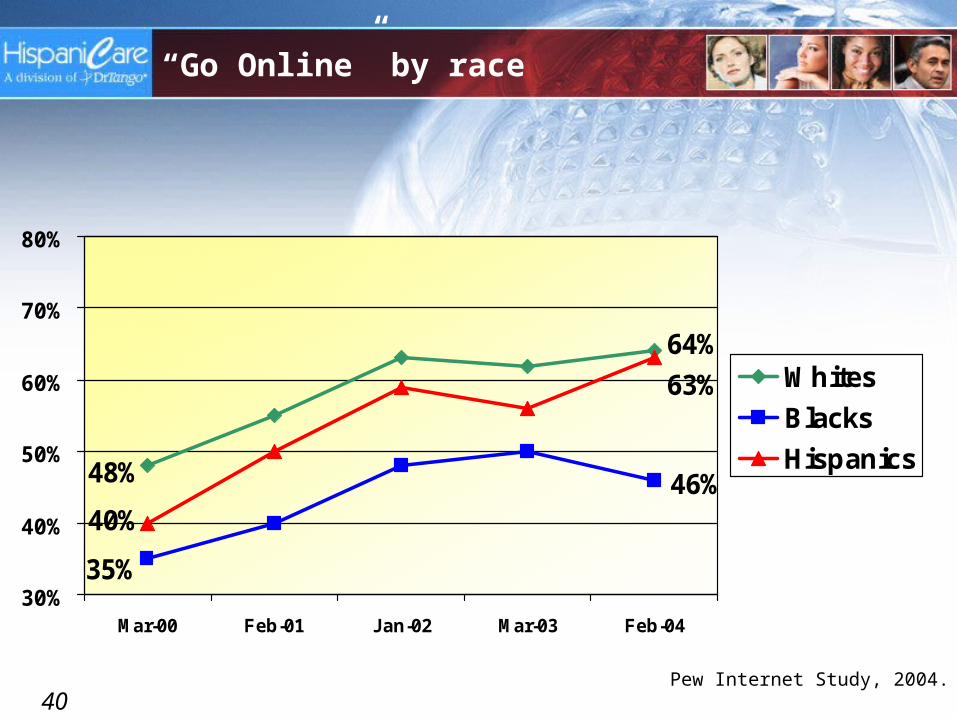
“Go Online” by race
46%48%
64%
35%
40%
63%
30%
40%
50%
60%
70%
80%
Mar-00 Feb-01 Jan-02 Mar-03 Feb-04
Whites
Blacks
Hispanics
Pew Internet Study, 2004.
41
35%
52%56%
White (non-Hispanic) Hispanic African-American
Harris Interactive 2003
Percent of ALL Adults who have sought health information online
42
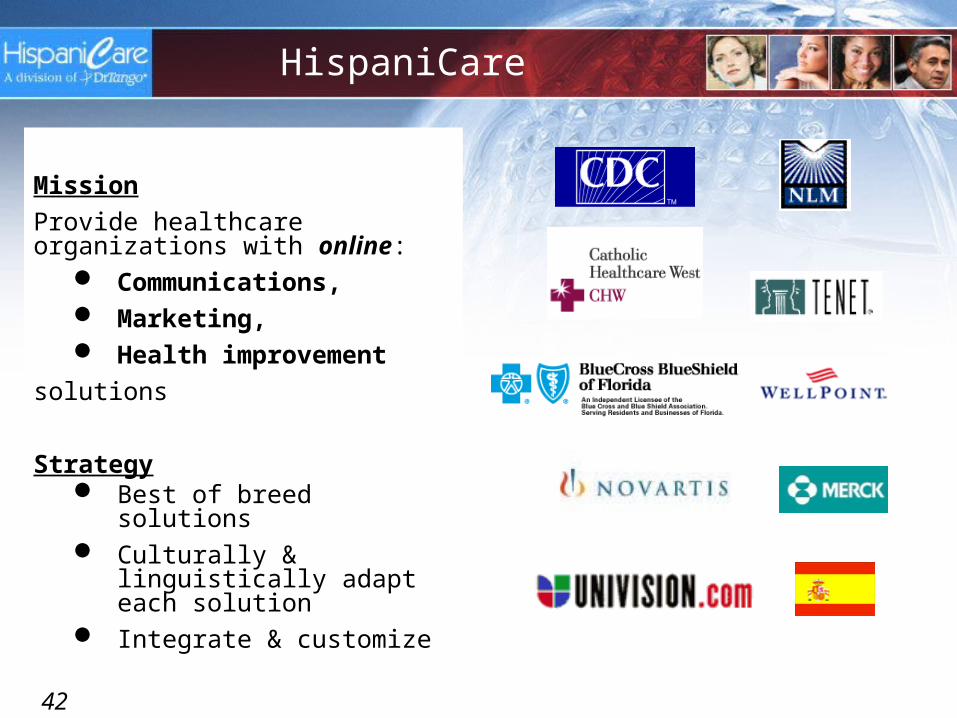
HispaniCare
Mission
Provide healthcare organizations with online:
Communications, Marketing, Health improvement
solutions
Strategy Best of breed solutions Culturally & linguistically
adapt each solution Integrate & customize