Embed Size (px)
Citation preview
Wellness: It’s Not Just for Health Claims Anymore
Conni Huber, City of Cedar Rapids HR Director
Lisa Powell, Linn County HR Director

City
Program Background
• Began in 2007• Utilized 3 vendors• Current vendor in place for 5 years• Initial incentive = $50 • Current incentive = premium reduction
of $40/month up to $78/month• Participation rate – 70%
Program components
• Biometric screening• Health questionnaire• Monthly coaching for high and moderate
risk individuals• Monthly wellness events planned by
employee group

Culture changing components• Wellness activities, education and
celebrations• Policies on healthy vending machines,
food at City functions, etc.• Health Fair• Newsletter articles including wellness
champion highlights• Fitness centers for very low cost
Linn County WellnessAnnual Health Risk Assessment (HRA)
and Biometric Screening - $50 gift card incentiveMonthly on-site Health Coaching for eligible employees (chronic condition or risk reduction)Health Awareness Team – department wellness liaisonsAnnual Health & Safety Fair – blood typing, skin cancer screenings, massages, etc.Challenge Activities – Lose It Linn County!; Walking Moai; Summer Fun Fitness CompetitionHealthy Lifestyle Education Seminars – exercise, nutrition, stress managementFinancial Education and Retirement Planning
Linn County WellnessHealthy Steps Newsletter – highlight
wellness champions, Preventative Exams – 100% paidSmoking Cessation – 100% paidBlue Zones Certifications Employee Well-Being and Healthy Vending PoliciesOn-site Fitness CentersFitness Reimbursement ProgramTargeted disease management for top diagnoses
Linn County WellnessAnnual screening is voluntary,
currently at 50% participation.Compare results between participants and non-participants.Each employee’s point where they decide to change an unhealthy behavior is different and what causes them to change is different.A comprehensive program designed to engage ALL employees increases ROI potential.

Linn County WellnessIs it working?
Engaged wellness vendor in 2005Had resistance from AFSCME union/ULPRebounded from that in 2007Participation now up to 50% of ee populationLow single digits increases in claims (3% last 6 years) even with blips in 2008 and 2013Employee testimonials as to how participation in the wellness program has made them healthier, changed their lives, etc.
Linn County Wellness
Health Solutions Data show the following:
Average health claims for participants are lower
Average workers’ compensation claims for participants are lower

City of Cedar Rapids Results
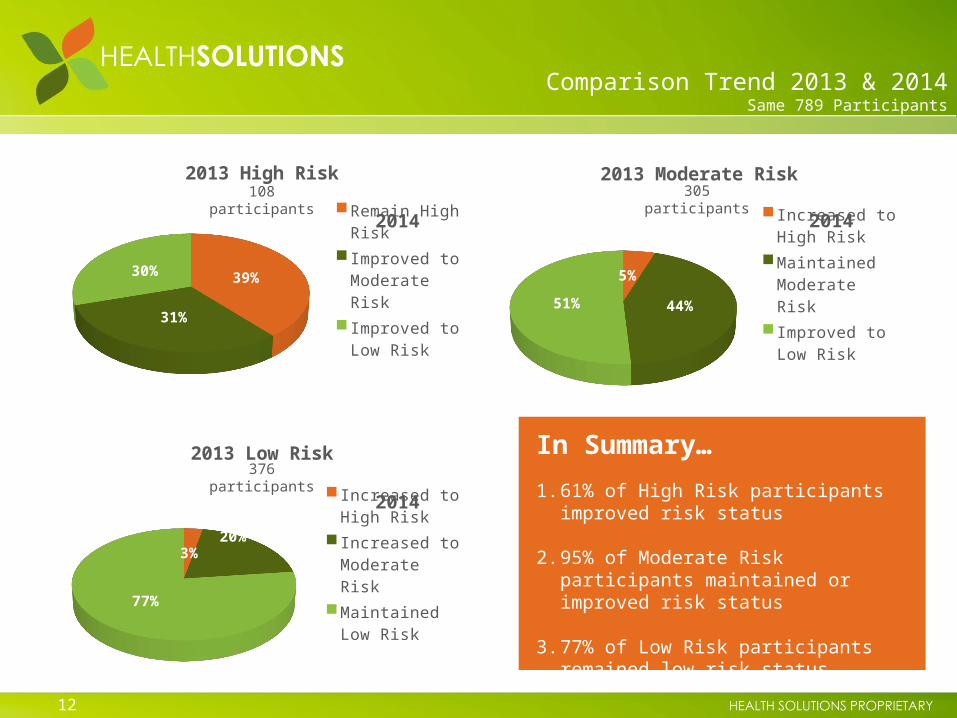
Comparison Trend 2013 & 2014Same 789 Participants
12
108 participants
In Summary…
1. 61% of High Risk participants improved risk status
2. 95% of Moderate Risk participants maintained or improved risk status
3. 77% of Low Risk participants remained low risk status
2014
39%
31%
30%
2013 High Risk
Remain High RiskImproved to Moderate RiskImproved to Low Risk
5%
44%51%
2013 Moderate Risk
Increased to High RiskMaintained Moderate RiskImproved to Low Risk
3%20%
77%
2013 Low Risk
Increased to High RiskIncreased to Moderate RiskMaintained Low Risk
2014 2014
305 participants
376 participants

13
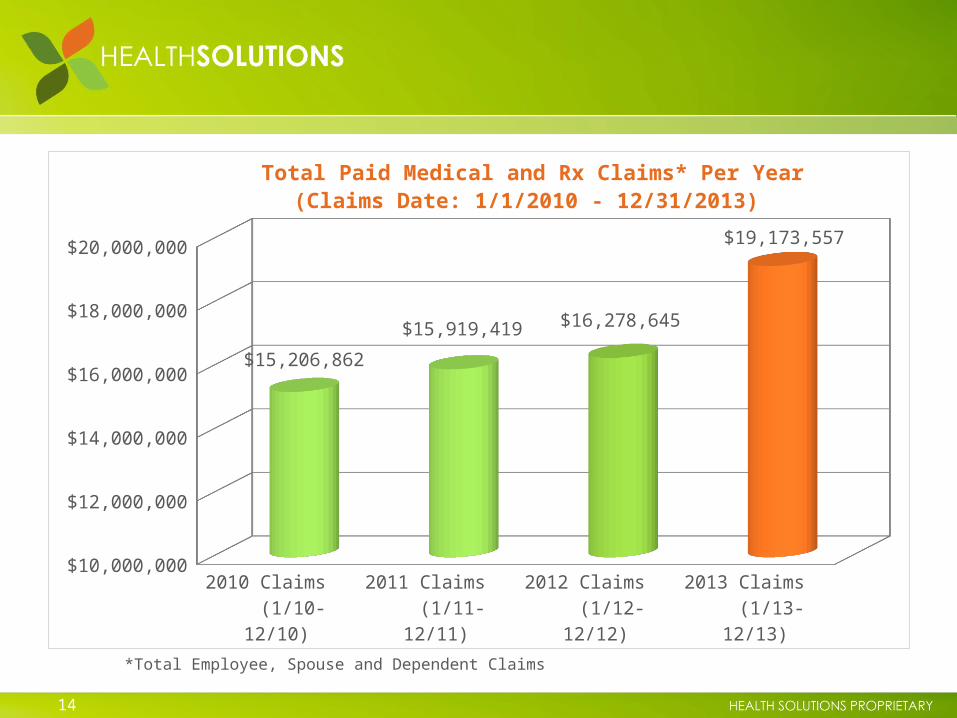
Medical and Rx Claims Analysis
14
2010 Claims (1/10-12/10)
2011 Claims (1/11-12/11)
2012 Claims (1/12-12/12)
2013 Claims (1/13-12/13)
$10,000,000
$12,000,000
$14,000,000
$16,000,000
$18,000,000
$20,000,000
$15,206,862
$15,919,419 $16,278,645
$19,173,557
Total Paid Medical and Rx Claims* Per Year(Claims Date: 1/1/2010 - 12/31/2013)
*Total Employee, Spouse and Dependent Claims
15
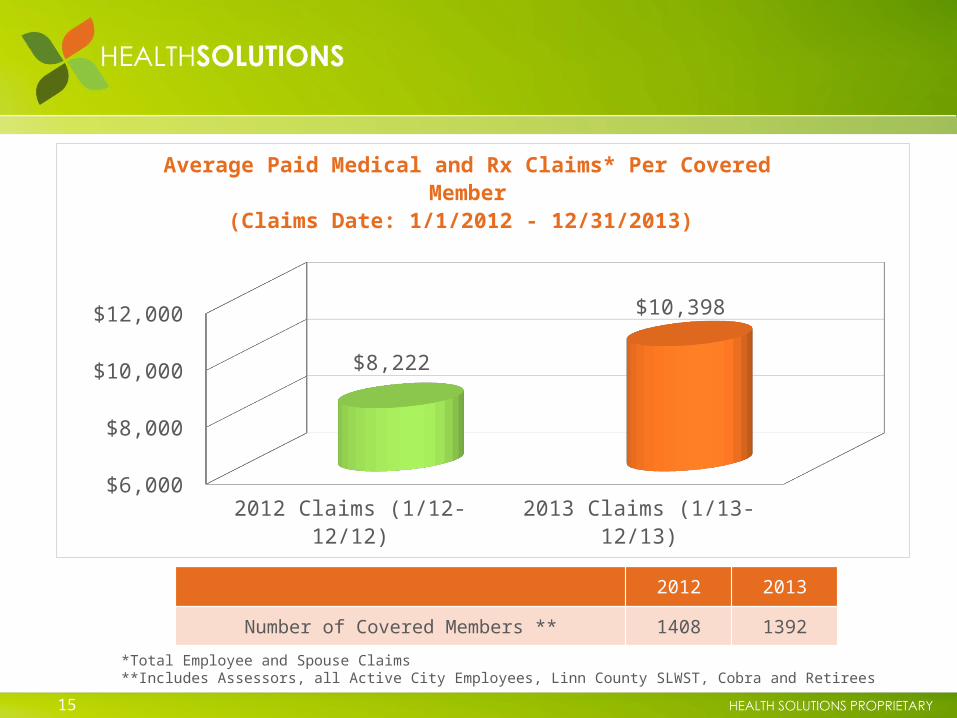
2012 Claims (1/12-12/12) 2013 Claims (1/13-12/13) $6,000
$8,000
$10,000
$12,000
$8,222
$10,398
Average Paid Medical and Rx Claims* Per Covered Member
(Claims Date: 1/1/2012 - 12/31/2013)
2012 2013
Number of Covered Members ** 1408 1392
*Total Employee and Spouse Claims**Includes Assessors, all Active City Employees, Linn County SLWST, Cobra and Retirees
16
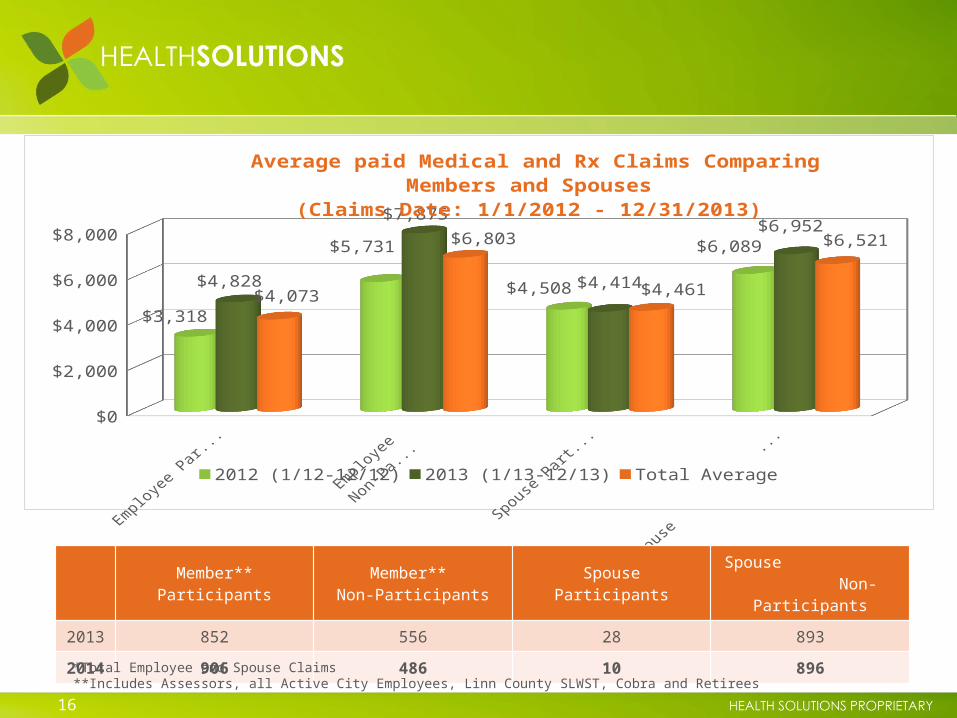
Employee Partic-ipants
Employee Non-Participants
Spouse Participants Spouse Non-Participants
$0
$2,000
$4,000
$6,000
$8,000
$3,318
$5,731
$4,508
$6,089
$4,828
$7,875
$4,414
$6,952
$4,073
$6,803
$4,461
$6,521
Average paid Medical and Rx Claims ComparingMembers and Spouses
(Claims Date: 1/1/2012 - 12/31/2013)
2012 (1/12-12/12) 2013 (1/13-12/13) Total Average
Member** Participants
Member** Non-Participants
Spouse ParticipantsSpouse
Non-Participants
2013
852 556 28 893
2014
906 486 10 896*Total Employee and Spouse Claims**Includes Assessors, all Active City Employees, Linn County SLWST, Cobra and Retirees
17
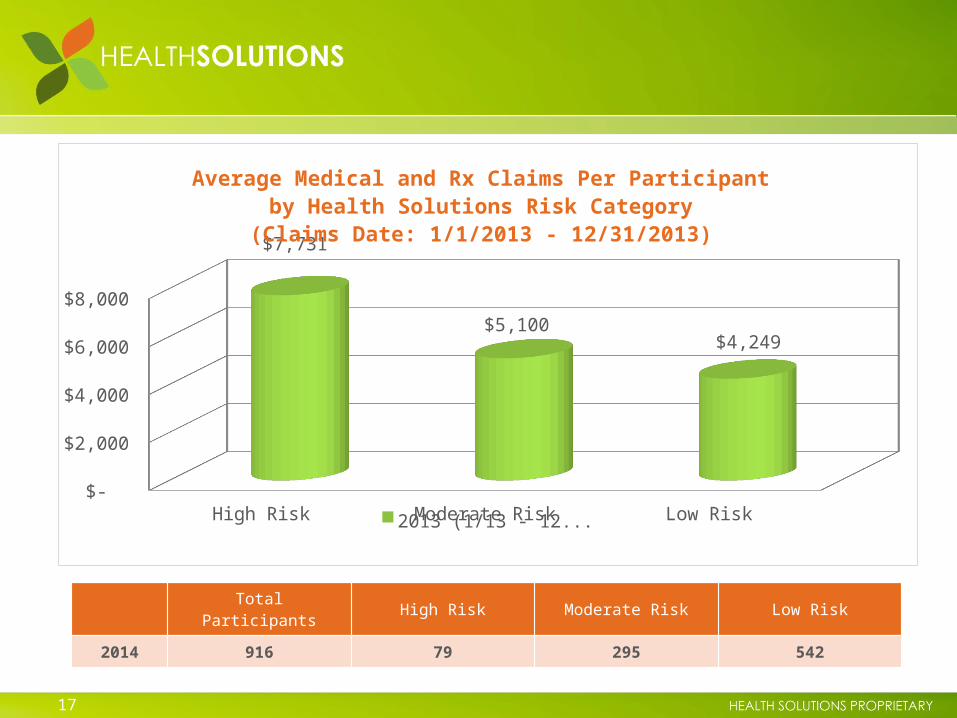
High Risk Moderate Risk Low Risk $-
$2,000
$4,000
$6,000
$8,000
$7,731
$5,100 $4,249
Average Medical and Rx Claims Per Participant by Health Solutions Risk Category
(Claims Date: 1/1/2013 - 12/31/2013)
2013 (1/13 - 12/13)
Total Participants High Risk Moderate Risk Low Risk
2014 916 79 295 542
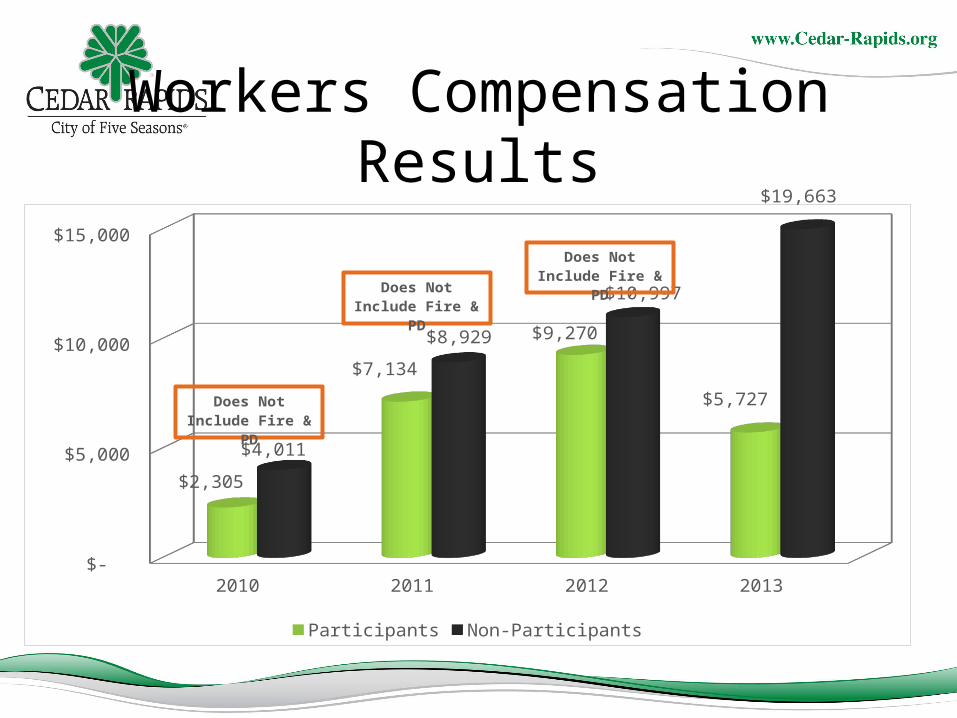
Workers Compensation Results
2010 2011 2012 2013 $-
$5,000
$10,000
$15,000
$2,305
$7,134
$9,270
$5,727
$4,011
$8,929
$10,997
$19,663
Participants Non-Participants
Does Not In-clude Fire &
PDDoes Not In-clude Fire &
PD
Does Not In-clude Fire &
PD
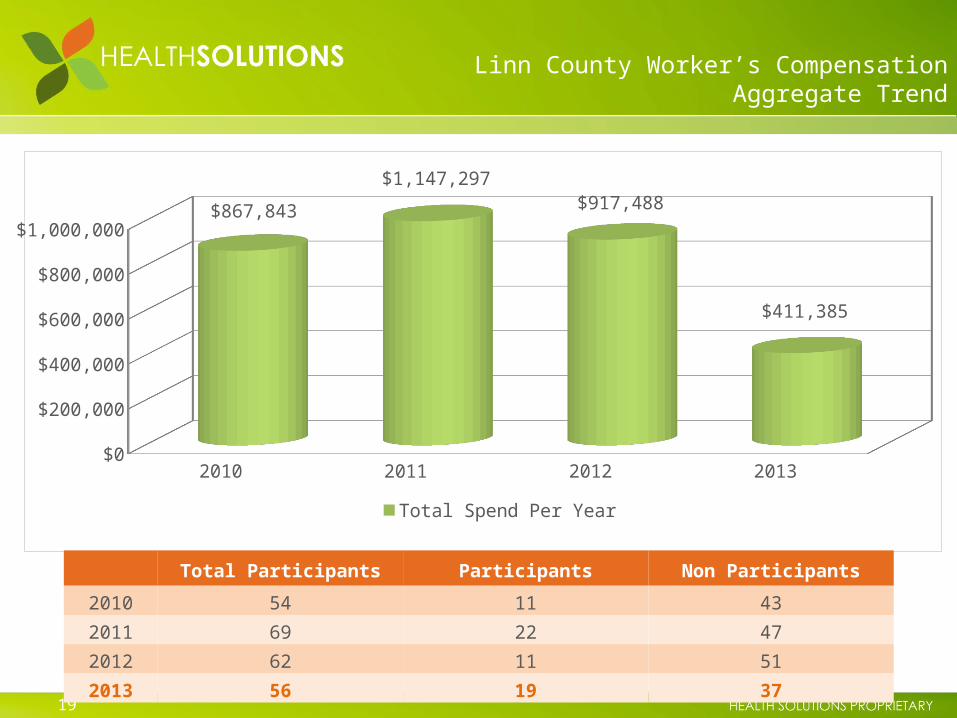
Linn County Worker’s Compensation Aggregate Trend
19
2010 2011 2012 2013$0
$200,000
$400,000
$600,000
$800,000
$1,000,000$867,843
$1,147,297 $917,488
$411,385
Total Spend Per Year
Total Participants Participants Non Participants
2010 54 11 432011 69 22 472012 62 11 512013 56 19 37
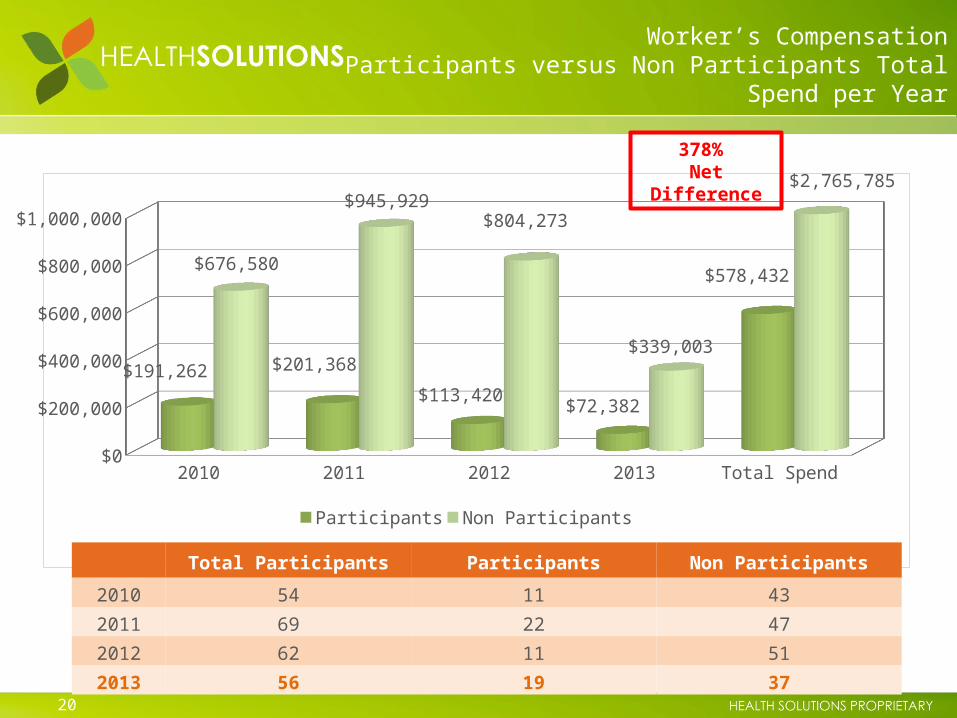
Worker’s CompensationParticipants versus Non Participants Total Spend per
Year
20
2010 2011 2012 2013 Total Spend$0
$200,000
$400,000
$600,000
$800,000
$1,000,000
$191,262 $201,368
$113,420 $72,382
$578,432 $676,580
$945,929 $804,273
$339,003
$2,765,785
Participants Non Participants
Total Participants Participants Non Participants
2010 54 11 432011 69 22 472012 62 11 512013 56 19 37
378% Net
Difference
21
2008 2009 2010 2011 2012 2013$0
$5,000
$10,000
$15,000
$20,000
$25,000
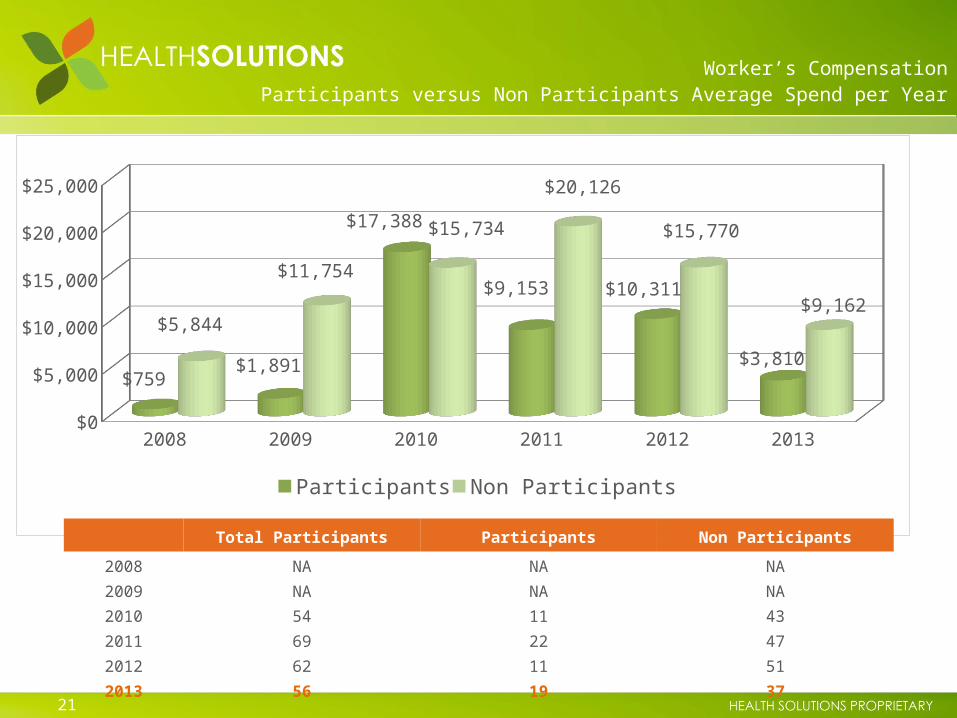
$759 $1,891
$17,388
$9,153 $10,311
$3,810
$5,844
$11,754
$15,734
$20,126
$15,770
$9,162
Participants Non Participants
Total Participants Participants Non Participants
2008 NA NA NA2009 NA NA NA2010 54 11 432011 69 22 472012 62 11 512013 56 19 37
Worker’s CompensationParticipants versus Non Participants Average Spend per Year
22
2006 2007 2008 2009 2010 2011 2012$5,000,000
$5,500,000
$6,000,000
$6,500,000
$7,000,000
$7,500,000
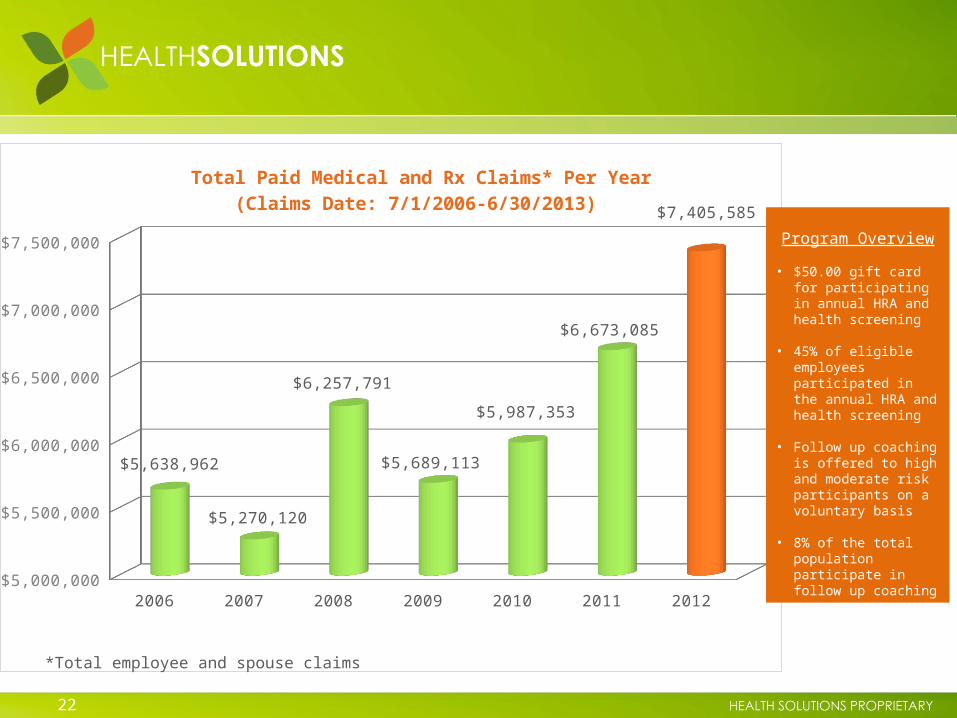
$5,638,962
$5,270,120
$6,257,791
$5,689,113
$5,987,353
$6,673,085
$7,405,585
Total Paid Medical and Rx Claims* Per Year(Claims Date: 7/1/2006-6/30/2013)
*Total employee and spouse claims
Program Overview
• $50.00 gift card for participating in annual HRA and health screening
• 45% of eligible employees participated in the annual HRA and health screening
• Follow up coaching is offered to high and moderate risk participants on a voluntary basis
• 8% of the total population participate in follow up coaching
23
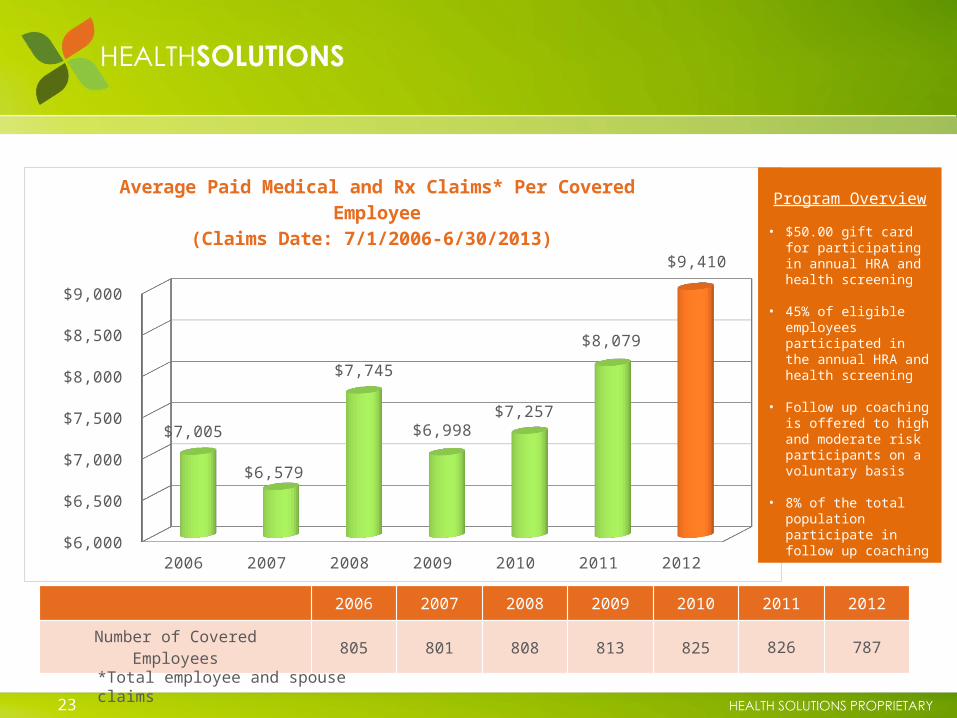
2006 2007 2008 2009 2010 2011 2012 $6,000
$6,500
$7,000
$7,500
$8,000
$8,500
$9,000
$7,005
$6,579
$7,745
$6,998 $7,257
$8,079
$9,410
Average Paid Medical and Rx Claims* Per Covered Employee
(Claims Date: 7/1/2006-6/30/2013)
2006 2007 2008 2009 2010 2011 2012
Number of Covered Employees 805 801 808 813 825 826 787
*Total employee and spouse claims
Program Overview
• $50.00 gift card for participating in annual HRA and health screening
• 45% of eligible employees participated in the annual HRA and health screening
• Follow up coaching is offered to high and moderate risk participants on a voluntary basis
• 8% of the total population participate in follow up coaching
24
Employee Participants Employee Non-Participants
Spouses$0
$2,000
$4,000
$6,000
$8,000
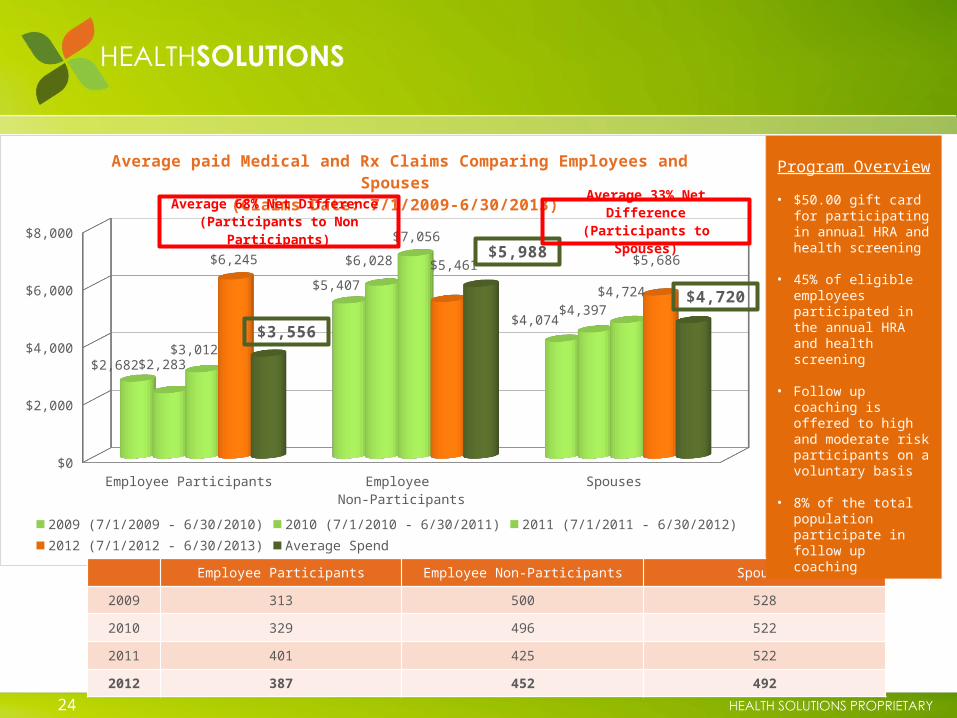
$2,682
$5,407
$4,074
$2,283
$6,028
$4,397
$3,012
$7,056
$4,724
$6,245 $5,461 $5,686
$3,556
$5,988
$4,720
Average paid Medical and Rx Claims Comparing Employees and Spouses
(Claims Date: 7/1/2009-6/30/2013)
2009 (7/1/2009 - 6/30/2010) 2010 (7/1/2010 - 6/30/2011) 2011 (7/1/2011 - 6/30/2012)
2012 (7/1/2012 - 6/30/2013) Average Spend
Average 68% Net Difference (Participants to Non Partici-
pants)
Average 33% Net Differ-ence
(Participants to Spouses)
Employee Participants Employee Non-Participants Spouses
2009 313 500 528
2010 329 496 522
2011 401 425 522
2012 387 452 492
Program Overview
• $50.00 gift card for participating in annual HRA and health screening
• 45% of eligible employees participated in the annual HRA and health screening
• Follow up coaching is offered to high and moderate risk participants on a voluntary basis
• 8% of the total population participate in follow up coaching
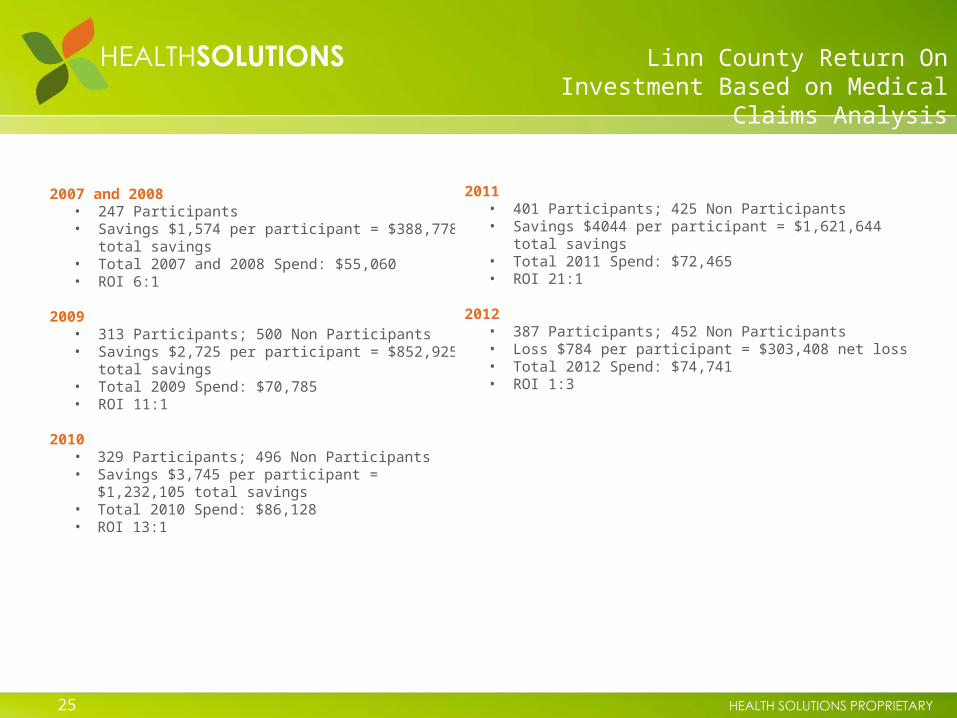
Linn County Return On Investment Based on Medical
Claims Analysis
25
2007 and 2008• 247 Participants• Savings $1,574 per participant = $388,778 total
savings• Total 2007 and 2008 Spend: $55,060• ROI 6:1
2009
• 313 Participants; 500 Non Participants• Savings $2,725 per participant = $852,925 total
savings• Total 2009 Spend: $70,785• ROI 11:1
2010
• 329 Participants; 496 Non Participants• Savings $3,745 per participant = $1,232,105
total savings• Total 2010 Spend: $86,128• ROI 13:1
2011
• 401 Participants; 425 Non Participants• Savings $4044 per participant = $1,621,644 total
savings• Total 2011 Spend: $72,465• ROI 21:1
2012• 387 Participants; 452 Non Participants• Loss $784 per participant = $303,408 net loss• Total 2012 Spend: $74,741• ROI 1:3
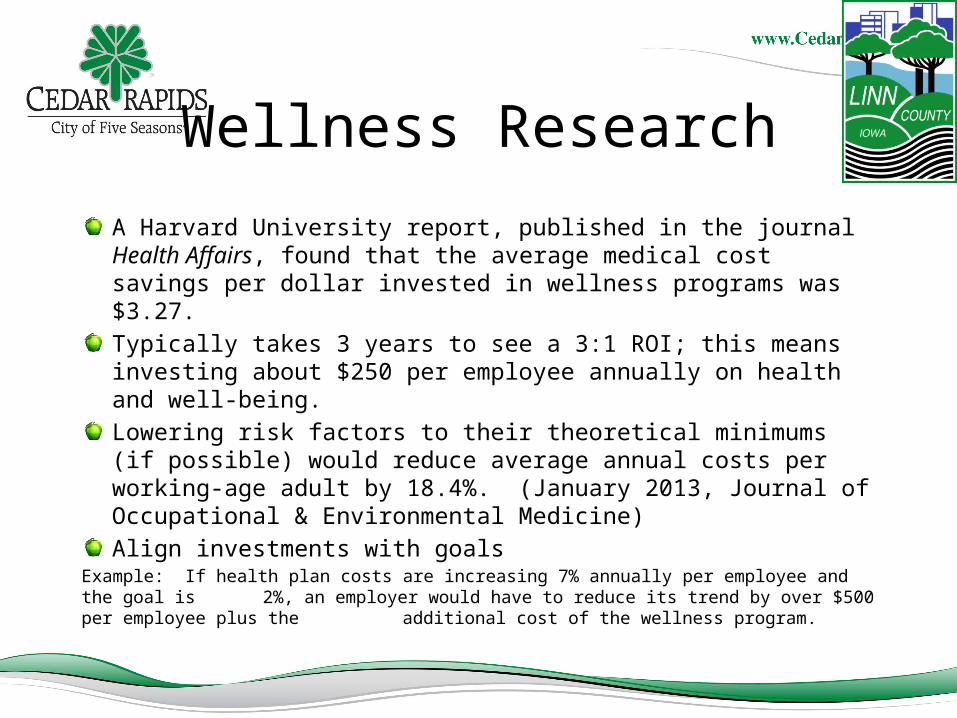
Wellness Research
A Harvard University report, published in the journal Health Affairs, found that the average medical cost savings per dollar invested in wellness programs was $3.27.Typically takes 3 years to see a 3:1 ROI; this means investing about $250 per employee annually on health and well-being.Lowering risk factors to their theoretical minimums (if possible) would reduce average annual costs per working-age adult by 18.4%. (January 2013, Journal of Occupational & Environmental Medicine)Align investments with goals
Example: If health plan costs are increasing 7% annually per employee and the goal is 2%, an employer would have to reduce its trend by over $500 per employee plus the additional cost of the wellness program.
Wellness Research
“The imperfect evidence that wellness programs reduce medical costs is better than the data corporate executives have for most key decision.” (David Anderson, Chief Health Officer for StayWell Health Management)
2012 employer study by StayWell Health Management and Towers Watson showed that:
If you reduce health risks, lower costs accrue quickly, so immediate savings from risk reduction makes the financial case for prevention stronger.Financial implications for prevention may be greater than for risk reduction. For every health risk added, costs increased by 45% above the cost savings resulting from eliminating a risk. In other words, preventing employees from adding new health risk over time produces greater cost savings than focusing on eliminating a health risk after it emerges.A long-term solution is better than a quick fix – greater savings realized from reducing health risks for people with chronic conditions; cost savings were 4 times greater for those with CC who reduced their health risks compared to those without CC!
Wellness Research
Other studies indicate that wellness programs can produce immediate savings in productivity-related costs, including reduced absenteeism, disability and workers’ compensation costs, as well as enhanced work performance. The combination of direct health care savings and indirect productivity savings support the business case for investing in a prevention-focused, population-based health management strategy.
Wellness Research
Bottom line for employees is that if you start to change employee behaviors, you will start seeing health care cost savings quickly. An employer can save an average of $100 in health care costs per employee per health risk eliminated in the year of change, and $105 per risk reduced in the year following the reduction. But if healthy people don’t stay healthy and start accumulating new health risks, not only are savings negated but health care costs increase by $145 per employee per health risk added in just one year.