Embed Size (px)
Citation preview
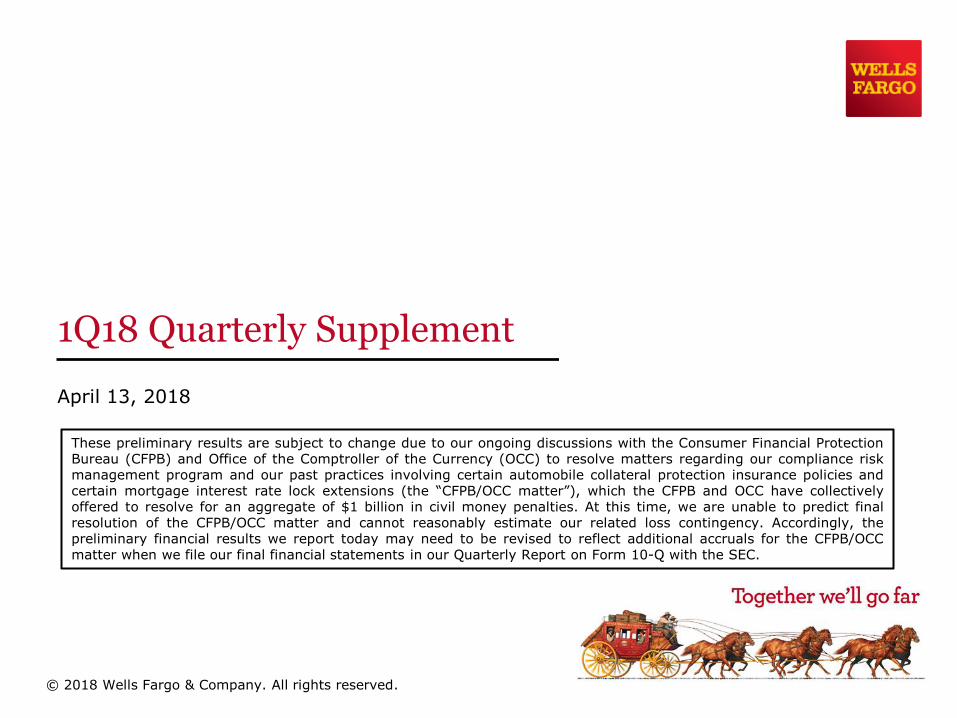
1Q18 Quarterly Supplement
April 13, 2018
These preliminary results are subject to change due to our ongoing discussions with the Consumer Financial Protection Bureau (CFPB) and Office of the Comptroller of the Currency (OCC) to resolve matters regarding our compliance risk management program and our past practices involving certain automobile collateral protection insurance policies and certain mortgage interest rate lock extensions (the “CFPB/OCC matter”), which the CFPB and OCC have collectively offered to resolve for an aggregate of $1 billion in civil money penalties. At this time, we are unable to predict final resolution of the CFPB/OCC matter and cannot reasonably estimate our related loss contingency. Accordingly, the preliminary financial results we report today may need to be revised to reflect additional accruals for the CFPB/OCC matter when we file our final financial statements in our Quarterly Report on Form 10-Q with the SEC.
© 2018 Wells Fargo & Company. All rights reserved.
Table of contents
1Q18 Results 1Q18 Highlights Page 2
Consent Order update 3
Balance Sheet and credit overview (linked quarter) 4
Income Statement overview (linked quarter) 5
Loans 6
Commercial loan trends 7
Consumer loan trends 8
Deposits 9
Net interest income 10
Noninterest income 11
Noninterest expense and efficiency ratio 12
Noninterest expense – linked quarter 13
Noninterest expense – year over year 14
2018 Expense expectations and efficiency
initiatives’ targets 15
Income Statement impact from business divestitures 16
Community Banking 17
Community Banking metrics 18-19
Wholesale Banking 20
Wealth and Investment Management 21
Credit quality 22
Capital 23
1Q18 Summary 24
Wells Fargo 1Q18 Supplement
Appendix Real estate 1-4 family mortgage portfolio 26
Consumer credit card portfolio 27
Auto portfolios 28
Student lending portfolio 29
Trading-related net interest income & noninterest income 30
Noninterest expense analysis (reference for slides 13-14) 31
Common Equity Tier 1 (Fully Phased-In) 32
Return on average tangible common equity (ROTCE) 33
Forward-looking statements and additional information 34
Final financial results and other disclosures will be reported in our Quarterly Report on Form 10-Q for the quarter ended March 31, 2018, and may differ materially from the results and disclosures in this document due to, among other things, the completion of final review procedures, the occurrence of subsequent events, including developments with respect to the resolution of regulatory matters, which could cause us to take additional accruals in the first quarter, or the discovery of additional information.
In first quarter 2018 we made accounting and presentation changes that resulted from the adoption of new accounting standards and a change in our methodology for measuring operating segment results. See pages 17 and 18 of the press release announcing our first quarter 2018 results for additional information.
1
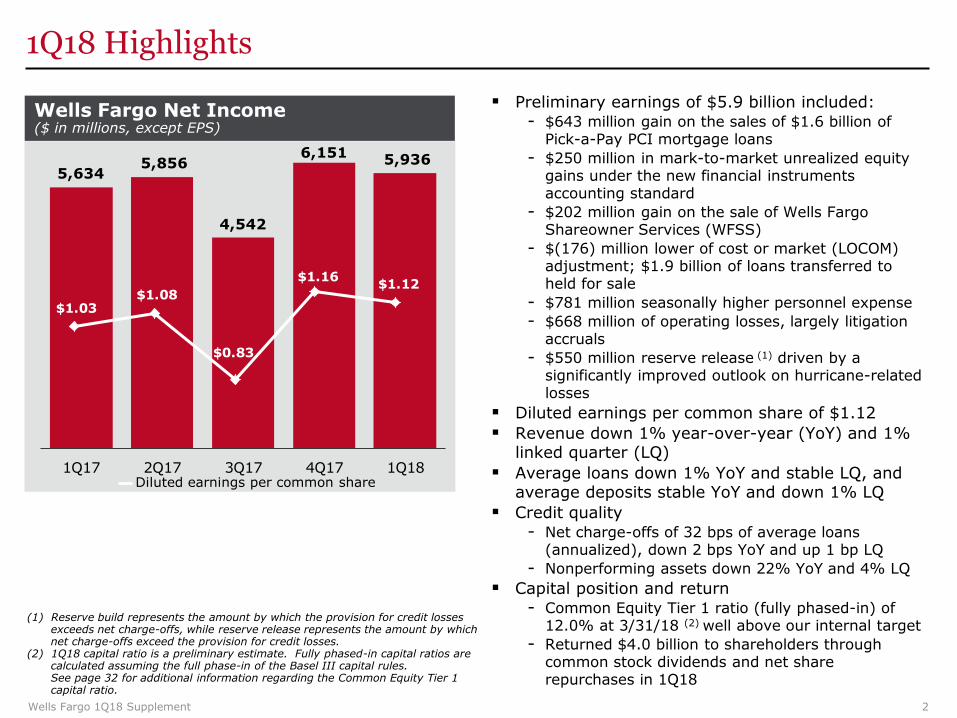
1Q18 Highlights
Wells Fargo Net Income ($ in millions, except EPS)
5,6345,856
4,542
6,151 5,936
1Q17 2Q17 3Q17 4Q17 1Q18Diluted earnings per common share
$1.03 $1.08
$0.83
$1.16 $1.12
(1) Reserve build represents the amount by which the provision for credit losses exceeds net charge-offs, while reserve release represents the amount by which net charge-offs exceed the provision for credit losses.
(2) 1Q18 capital ratio is a preliminary estimate. Fully phased-in capital ratios are calculated assuming the full phase-in of the Basel III capital rules. See page 32 for additional information regarding the Common Equity Tier 1 capital ratio.
Preliminary earnings of $5.9 billion included: - $643 million gain on the sales of $1.6 billion of
Pick-a-Pay PCI mortgage loans
- $250 million in mark-to-market unrealized equity gains under the new financial instruments accounting standard
- $202 million gain on the sale of Wells Fargo Shareowner Services (WFSS)
- $(176) million lower of cost or market (LOCOM) adjustment; $1.9 billion of loans transferred to held for sale
- $781 million seasonally higher personnel expense
- $668 million of operating losses, largely litigation accruals
- $550 million reserve release (1) driven by a significantly improved outlook on hurricane-related losses
Diluted earnings per common share of $1.12
Revenue down 1% year-over-year (YoY) and 1% linked quarter (LQ)
Average loans down 1% YoY and stable LQ, and average deposits stable YoY and down 1% LQ
Credit quality - Net charge-offs of 32 bps of average loans
(annualized), down 2 bps YoY and up 1 bp LQ
- Nonperforming assets down 22% YoY and 4% LQ
Capital position and return - Common Equity Tier 1 ratio (fully phased-in) of
12.0% at 3/31/18 (2) well above our internal target
- Returned $4.0 billion to shareholders through common stock dividends and net share repurchases in 1Q18
Wells Fargo 1Q18 Supplement 2
Consent Order (1) update
Submitted governance and oversight, and compliance and operational risk management program plans to the Federal Reserve
We take the Consent Order seriously and will work to fully satisfy all of the Consent Order’s requirements
Achieving compliance with the Consent Order’s asset cap and maintaining liquidity and other financial risk management targets while:
- Minimizing the impact to customers
- Minimizing adverse long-term strategic effects
- Maintaining our financial risk discipline
With nearly $2.0 trillion in total assets we believe we can meet our customers’ financial needs and continue to deliver strong results without growing the balance sheet near term
- We are already operating at scale
- We have been focused on reducing our exposure to riskier assets
• We have deliberately reduced our loan outstandings in certain legacy consumer real estate loan portfolios, both first and junior lien mortgages, and since 2016 we have tightened our credit underwriting standards in auto
- We have maintained our credit risk discipline with new originations across the loan portfolio
• Continued credit underwriting discipline in commercial real estate (CRE) lending during a period of high liquidity and increased competition, resulting in four consecutive quarters of lower balances
As of 3/31/18, total assets were down $36.4 billion from 12/31/17 (2)
- Reduction in the balance sheet primarily due to a $32 billon decline in commercial deposits from financial institutions, including ~$15 billion of actions taken to comply with the Consent Order asset cap
- The earnings impact from managing within the asset cap was relatively modest in 1Q18 due to the minimal actions taken in the quarter; the impact is expected to increase in subsequent quarters, but we continue to estimate that the net income after tax impact will be within our originally estimated $300-400 million range for 2018
(1) Consent Order issued by the Board of Governors of the Federal Reserve System on February 2, 2018. (2) The Consent Order’s asset cap requires the company to maintain a two-quarter daily average of total consolidated assets that is no greater than the
12/31/17 balance of $1.952 trillion.
Wells Fargo 1Q18 Supplement 3
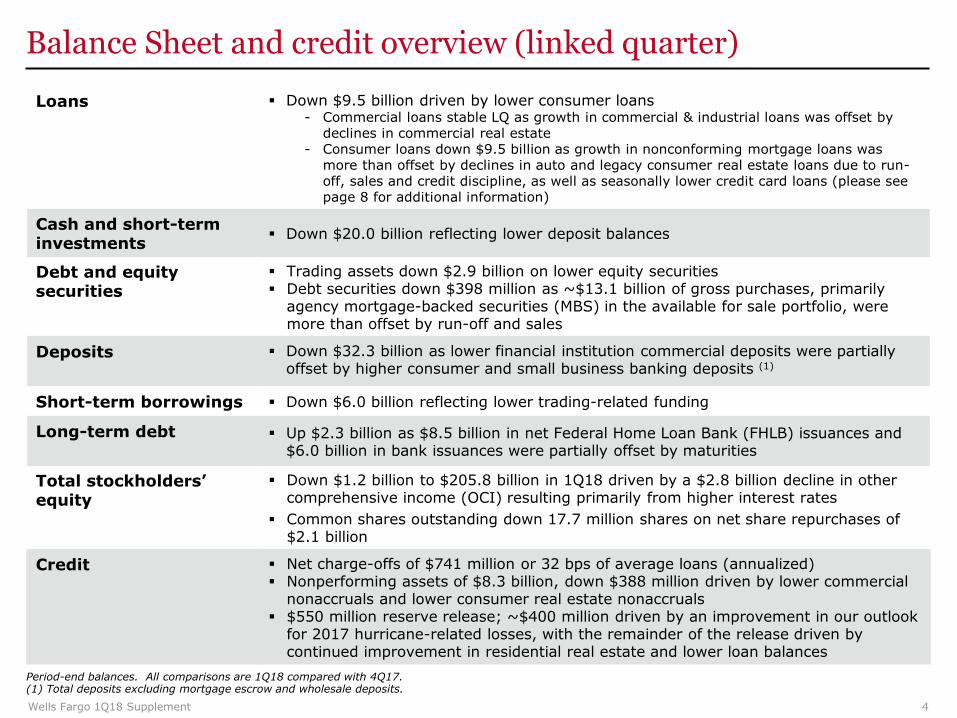
Balance Sheet and credit overview (linked quarter)
Loans
Cash and short-term investments
Debt and equity securities
Deposits
Down $9.5 billion driven by lower consumer loans - Commercial loans stable LQ as growth in commercial & industrial loans was offset by
declines in commercial real estate - Consumer loans down $9.5 billion as growth in nonconforming mortgage loans was
more than offset by declines in auto and legacy consumer real estate loans due to run-off, sales and credit discipline, as well as seasonally lower credit card loans (please see page 8 for additional information)
Down $20.0 billion reflecting lower deposit balances
Down $32.3 billion as lower financial institution commercial deposits were partially offset by higher consumer and small business banking deposits (1)
Trading assets down $2.9 billion on lower equity securities Debt securities down $398 million as ~$13.1 billion of gross purchases, primarily
agency mortgage-backed securities (MBS) in the available for sale portfolio, were more than offset by run-off and sales
Down $6.0 billion reflecting lower trading-related funding Short-term borrowings
Long-term debt Up $2.3 billion as $8.5 billion in net Federal Home Loan Bank (FHLB) issuances and $6.0 billion in bank issuances were partially offset by maturities
Down $1.2 billion to $205.8 billion in 1Q18 driven by a $2.8 billion decline in other Total stockholders’ comprehensive income (OCI) resulting primarily from higher interest rates equity
Common shares outstanding down 17.7 million shares on net share repurchases of $2.1 billion
Net charge-offs of $741 million or 32 bps of average loans (annualized) Credit Nonperforming assets of $8.3 billion, down $388 million driven by lower commercial
nonaccruals and lower consumer real estate nonaccruals $550 million reserve release; ~$400 million driven by an improvement in our outlook
for 2017 hurricane-related losses, with the remainder of the release driven by continued improvement in residential real estate and lower loan balances
Period-end balances. All comparisons are 1Q18 compared with 4Q17. (1) Total deposits excluding mortgage escrow and wholesale deposits.
Wells Fargo 1Q18 Supplement 4
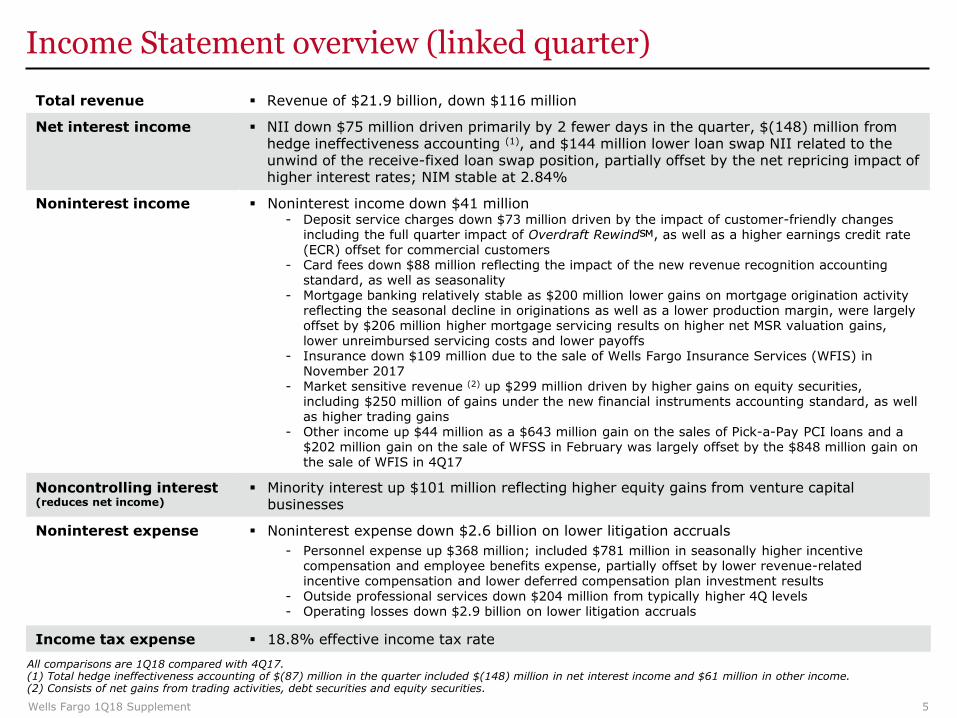
Income Statement overview (linked quarter)
Total revenue
Net interest income
Noninterest income
Noncontrolling interest (reduces net income)
Noninterest expense
Income tax expense
Revenue of $21.9 billion, down $116 million
NII down $75 million driven primarily by 2 fewer days in the quarter, $(148) million from hedge ineffectiveness accounting (1), and $144 million lower loan swap NII related to the unwind of the receive-fixed loan swap position, partially offset by the net repricing impact of higher interest rates; NIM stable at 2.84%
Noninterest income down $41 million - Deposit service charges down $73 million driven by the impact of customer-friendly changes
including the full quarter impact of Overdraft Rewind℠, as well as a higher earnings credit rate (ECR) offset for commercial customers
- Card fees down $88 million reflecting the impact of the new revenue recognition accounting standard, as well as seasonality
- Mortgage banking relatively stable as $200 million lower gains on mortgage origination activity reflecting the seasonal decline in originations as well as a lower production margin, were largely offset by $206 million higher mortgage servicing results on higher net MSR valuation gains, lower unreimbursed servicing costs and lower payoffs
- Insurance down $109 million due to the sale of Wells Fargo Insurance Services (WFIS) in November 2017
- Market sensitive revenue (2) up $299 million driven by higher gains on equity securities, including $250 million of gains under the new financial instruments accounting standard, as well as higher trading gains
- Other income up $44 million as a $643 million gain on the sales of Pick-a-Pay PCI loans and a $202 million gain on the sale of WFSS in February was largely offset by the $848 million gain on the sale of WFIS in 4Q17
Minority interest up $101 million reflecting higher equity gains from venture capital businesses
Noninterest expense down $2.6 billion on lower litigation accruals
- Personnel expense up $368 million; included $781 million in seasonally higher incentive compensation and employee benefits expense, partially offset by lower revenue-related incentive compensation and lower deferred compensation plan investment results
- Outside professional services down $204 million from typically higher 4Q levels - Operating losses down $2.9 billion on lower litigation accruals
18.8% effective income tax rate
All comparisons are 1Q18 compared with 4Q17. (1) Total hedge ineffectiveness accounting of $(87) million in the quarter included $(148) million in net interest income and $61 million in other income. (2) Consists of net gains from trading activities, debt securities and equity securities.
Wells Fargo 1Q18 Supplement 5
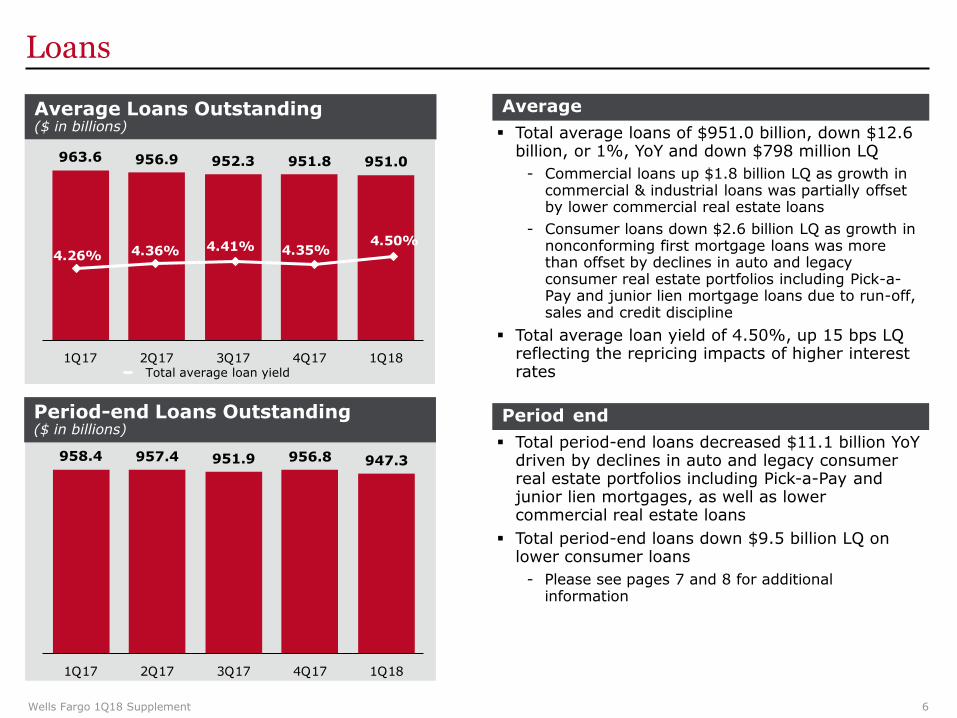
963.6 956.9 952.3 951.8 951.0
1Q17 2Q17 3Q17 4Q17 1Q18
-
Loans
Average Loans Outstanding ($ in billions)
Average
4.26% 4.36% 4.41% 4.35%4.50%
Total average loan yield
958.4 957.4 951.9 956.8 947.3
1Q17 2Q17 3Q17 4Q17 1Q18
Period-end Loans Outstanding ($ in billions)
Wells Fargo 1Q18 Supplement
Total average loans of $951.0 billion, down $12.6 billion, or 1%, YoY and down $798 million LQ
- Commercial loans up $1.8 billion LQ as growth in commercial & industrial loans was partially offset by lower commercial real estate loans
- Consumer loans down $2.6 billion LQ as growth in nonconforming first mortgage loans was more than offset by declines in auto and legacy consumer real estate portfolios including Pick-a-Pay and junior lien mortgage loans due to run-off, sales and credit discipline
Total average loan yield of 4.50%, up 15 bps LQ reflecting the repricing impacts of higher interest rates
Period end
Total period-end loans decreased $11.1 billion YoY driven by declines in auto and legacy consumer real estate portfolios including Pick-a-Pay and junior lien mortgages, as well as lower commercial real estate loans
Total period-end loans down $9.5 billion LQ on lower consumer loans
- Please see pages 7 and 8 for additional information
6
Commercial loan trends
Commercial loans down $1.6 billion YoY and up $8 million LQ:
($ in billions, Period-end balances)
Commercial and industrial (C&I) loans up $1.6 billion LQ
250
260
270
280
290
300
310
320
330
340
1Q17 4Q17 1Q18
Commercial and Industrial
100
110
120
130
140
150
160
1Q17 4Q17 1Q18
Commercial Real Estate
On growth of… $4.7 billion in Commercial Capital on
higher Asset Backed Finance reflecting strength in corporate businesses, higher Commercial Distribution Finance on seasonality, and higher Capital Finance on strong factoring volume in March
$1.1 billion in Middle Market Banking on higher line utilization
…partially offset by declines of: $1.5 billion in Commercial Real
Estate credit facilities to REITs and non-depository financial institutions
$1.4 billion in Special Situations Group related to an asset sale
$1.1 billion in Financial Institutions reflecting risk discipline
$250 million transfer to held for sale as a result of the previously announced sale of certain assets of Reliable Financial Services, Inc. (Reliable)
Commercial real estate loans down $1.5 billion LQ reflecting continued credit discipline CRE construction down $397 million due to lower originations and slower
funding on new and existing loans CRE mortgage down $1.1 billion due to lower originations reflecting continued
credit discipline in a competitive, highly liquid financing market, as well as ongoing paydowns/payoffs on existing and acquired loans
Wells Fargo 1Q18 Supplement 7
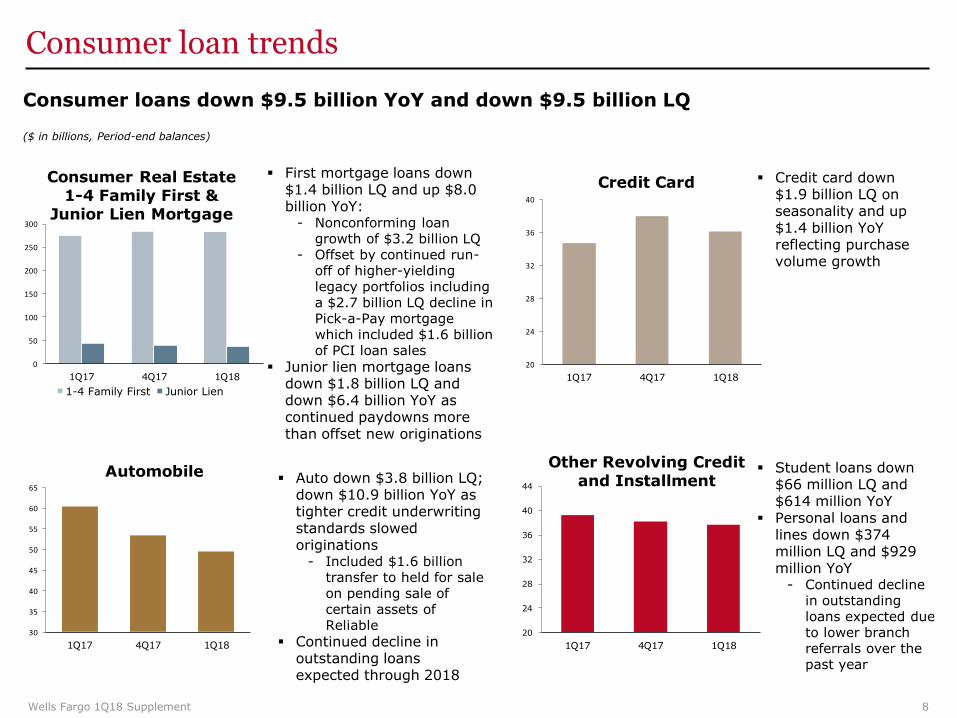
Consumer loan trends
Consumer loans down $9.5 billion YoY and down $9.5 billion LQ
($ in billions, Period-end balances)
First mortgage loans down $1.4 billion LQ and up $8.0 billion YoY:
- Nonconforming loan growth of $3.2 billion LQ
- Offset by continued run-off of higher-yielding legacy portfolios including a $2.7 billion LQ decline in Pick-a-Pay mortgage which included $1.6 billion of PCI loan sales
Junior lien mortgage loans down $1.8 billion LQ and
1-4 Family First Junior Lien down $6.4 billion YoY as continued paydowns more than offset new originations
Auto down $3.8 billion LQ; down $10.9 billion YoY as tighter credit underwriting standards slowed originations
Continued decline in outstanding loans expected through 2018
30
35
40
45
50
55
60
65
1Q17 4Q17 1Q18
Automobile
- Included $1.6 billion transfer to held for sale on pending sale of certain assets of Reliable
0
50
100
150
200
250
300
1Q17 4Q17 1Q18
Consumer Real Estate 1-4 Family First &
Junior Lien Mortgage
Credit card down $1.9 billion LQ on seasonality and up $1.4 billion YoY reflecting purchase volume growth
20
24
28
32
36
40
1Q17 4Q17 1Q18
Credit Card
Student loans down $66 million LQ and $614 million YoY
20
24
28
32
36
40
44
1Q17 4Q17 1Q18
Other Revolving Credit and Installment
Personal loans and lines down $374 million LQ and $929 million YoY
- Continued decline in outstanding loans expected due to lower branch referrals over the past year
Wells Fargo 1Q18 Supplement 8
935.5 944.1 938.3
363.7 367.5 358.9
1,299.2 1,311.6 1,297.2
1Q17 4Q17 1Q18
Noninterest-bearing deposits Interest-bearing deposits
-
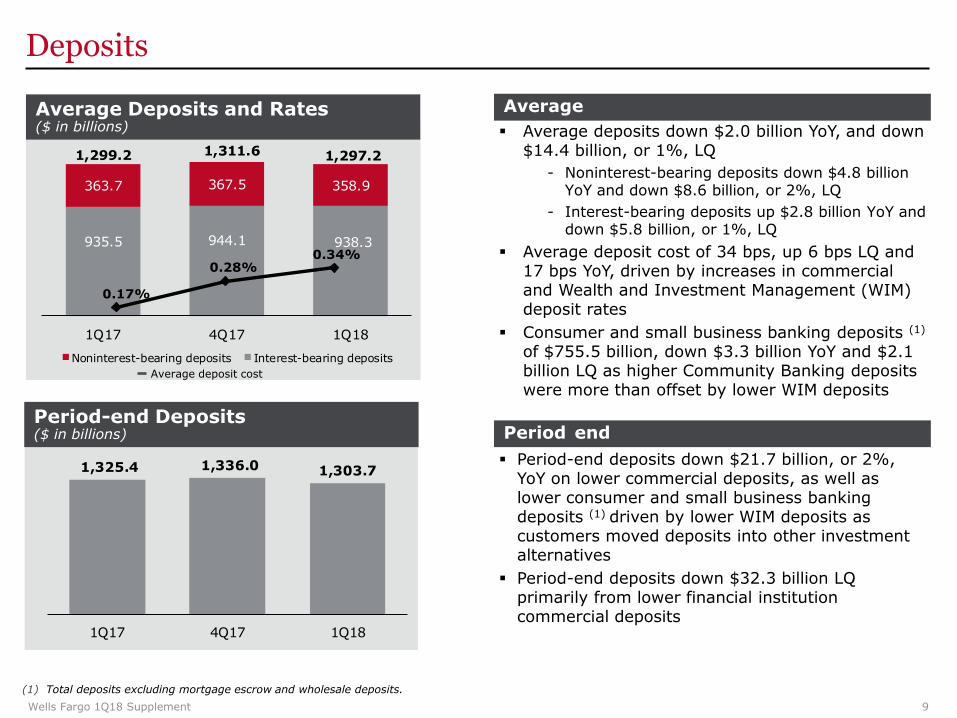
Deposits
Average Deposits and Rates ($ in billions)
Average
0.17%
0.28%0.34%
Average deposit cost
1,325.4 1,336.0 1,303.7
1Q17 4Q17 1Q18
Period-end Deposits ($ in billions)
(1) Total deposits excluding mortgage escrow and wholesale deposits.
Wells Fargo 1Q18 Supplement
Average deposits down $2.0 billion YoY, and down $14.4 billion, or 1%, LQ
- Noninterest-bearing deposits down $4.8 billion YoY and down $8.6 billion, or 2%, LQ
- Interest-bearing deposits up $2.8 billion YoY and down $5.8 billion, or 1%, LQ
Average deposit cost of 34 bps, up 6 bps LQ and 17 bps YoY, driven by increases in commercial and Wealth and Investment Management (WIM) deposit rates
Consumer and small business banking deposits (1)
of $755.5 billion, down $3.3 billion YoY and $2.1 billion LQ as higher Community Banking deposits were more than offset by lower WIM deposits
Period end
Period-end deposits down $21.7 billion, or 2%, YoY on lower commercial deposits, as well as lower consumer and small business banking deposits (1) driven by lower WIM deposits as customers moved deposits into other investment alternatives
Period-end deposits down $32.3 billion LQ primarily from lower financial institution commercial deposits
9
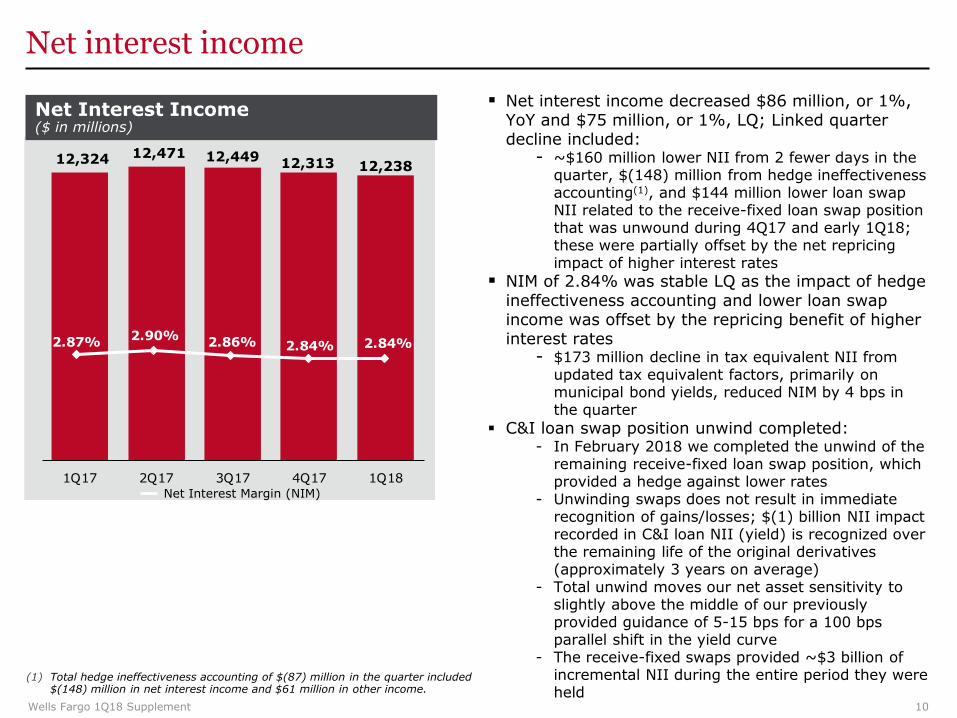
Net interest income
12,324 12,471 12,44912,313 12,238
1Q17 2Q17 3Q17 4Q17 1Q18Net Interest Margin (NIM)
Net Interest Income ($ in millions)
2.87%2.90%
2.86% 2.84% 2.84%
(1) Total hedge ineffectiveness accounting of $(87) million in the quarter included $(148) million in net interest income and $61 million in other income.
Net interest income decreased $86 million, or 1%, YoY and $75 million, or 1%, LQ; Linked quarter decline included:
- ~$160 million lower NII from 2 fewer days in the quarter, $(148) million from hedge ineffectiveness accounting(1), and $144 million lower loan swap NII related to the receive-fixed loan swap position that was unwound during 4Q17 and early 1Q18; these were partially offset by the net repricing impact of higher interest rates
NIM of 2.84% was stable LQ as the impact of hedge ineffectiveness accounting and lower loan swap income was offset by the repricing benefit of higher interest rates
- $173 million decline in tax equivalent NII from updated tax equivalent factors, primarily on municipal bond yields, reduced NIM by 4 bps in the quarter
C&I loan swap position unwind completed: - In February 2018 we completed the unwind of the
remaining receive-fixed loan swap position, which provided a hedge against lower rates
- Unwinding swaps does not result in immediate recognition of gains/losses; $(1) billion NII impact recorded in C&I loan NII (yield) is recognized over the remaining life of the original derivatives (approximately 3 years on average)
- Total unwind moves our net asset sensitivity to slightly above the middle of our previously provided guidance of 5-15 bps for a 100 bps parallel shift in the yield curve
- The receive-fixed swaps provided ~$3 billion of incremental NII during the entire period they were held
Wells Fargo 1Q18 Supplement 10
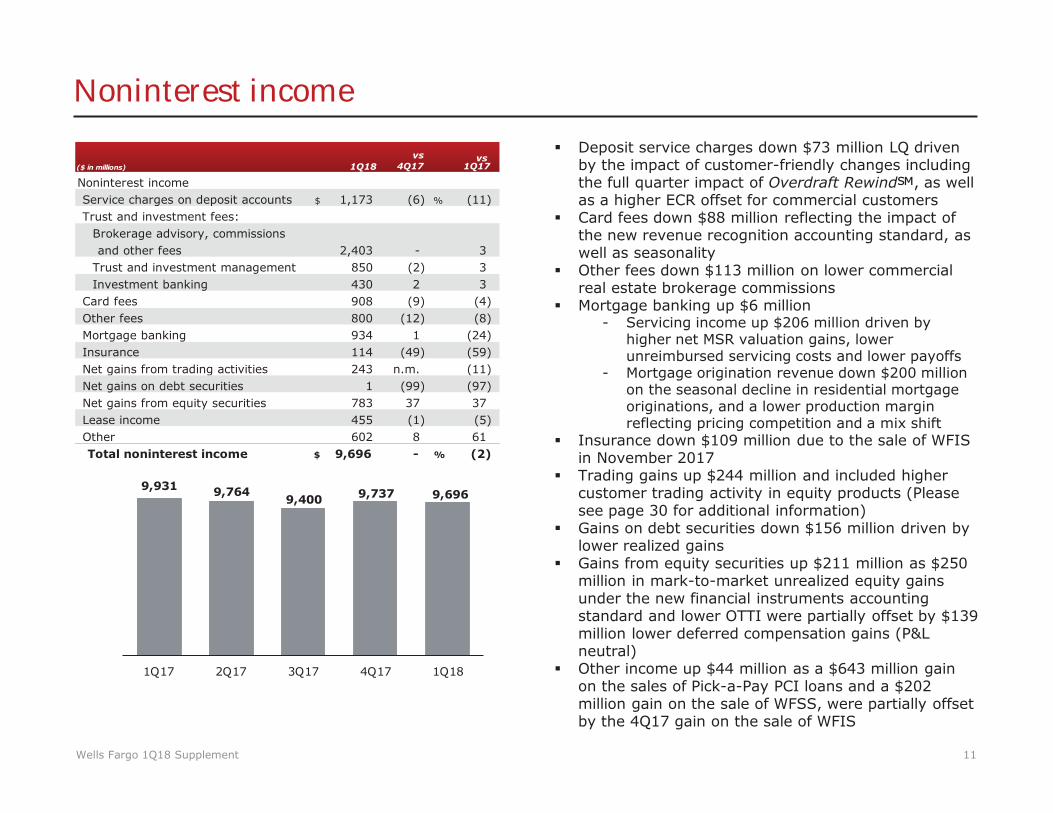
Noninterest income
($ in millions) 1Q18 vs
4Q17 vs
1Q17
Noninterest income Service charges on deposit accounts $ 1,173 (6) % (11) Trust and investment fees:
Brokerage advisory, commissions and other fees 2,403 - 3
Trust and investment management 850 (2) 3 Investment banking 430 2 3
Card fees 908 (9) (4) Other fees 800 (12) (8) Mortgage banking 934 1 (24) Insurance 114 (49) (59) Net gains from trading activities 243 n.m. (11) Net gains on debt securities 1 (99) (97) Net gains from equity securities 783 37 37 Lease income 455 (1) (5) Other 602 8 61 Total noninterest income $ 9,696 - % (2)
9,400 9,931 9,764 9,737 9,696
1Q17 2Q17 3Q17 4Q17 1Q18
Wells Fargo 1Q18 Supplement
Deposit service charges down $73 million LQ driven by the impact of customer-friendly changes including the full quarter impact of Overdraft Rewind℠, as well as a higher ECR offset for commercial customers Card fees down $88 million reflecting the impact of the new revenue recognition accounting standard, as well as seasonality Other fees down $113 million on lower commercial real estate brokerage commissions Mortgage banking up $6 million
- Servicing income up $206 million driven by higher net MSR valuation gains, lower unreimbursed servicing costs and lower payoffs
- Mortgage origination revenue down $200 million on the seasonal decline in residential mortgage originations, and a lower production margin reflecting pricing competition and a mix shift
Insurance down $109 million due to the sale of WFIS in November 2017 Trading gains up $244 million and included higher customer trading activity in equity products (Please see page 30 for additional information) Gains on debt securities down $156 million driven by lower realized gains Gains from equity securities up $211 million as $250 million in mark-to-market unrealized equity gains under the new financial instruments accounting standard and lower OTTI were partially offset by $139 million lower deferred compensation gains (P&L neutral) Other income up $44 million as a $643 million gain on the sales of Pick-a-Pay PCI loans and a $202 million gain on the sale of WFSS, were partially offset by the 4Q17 gain on the sale of WFIS
11
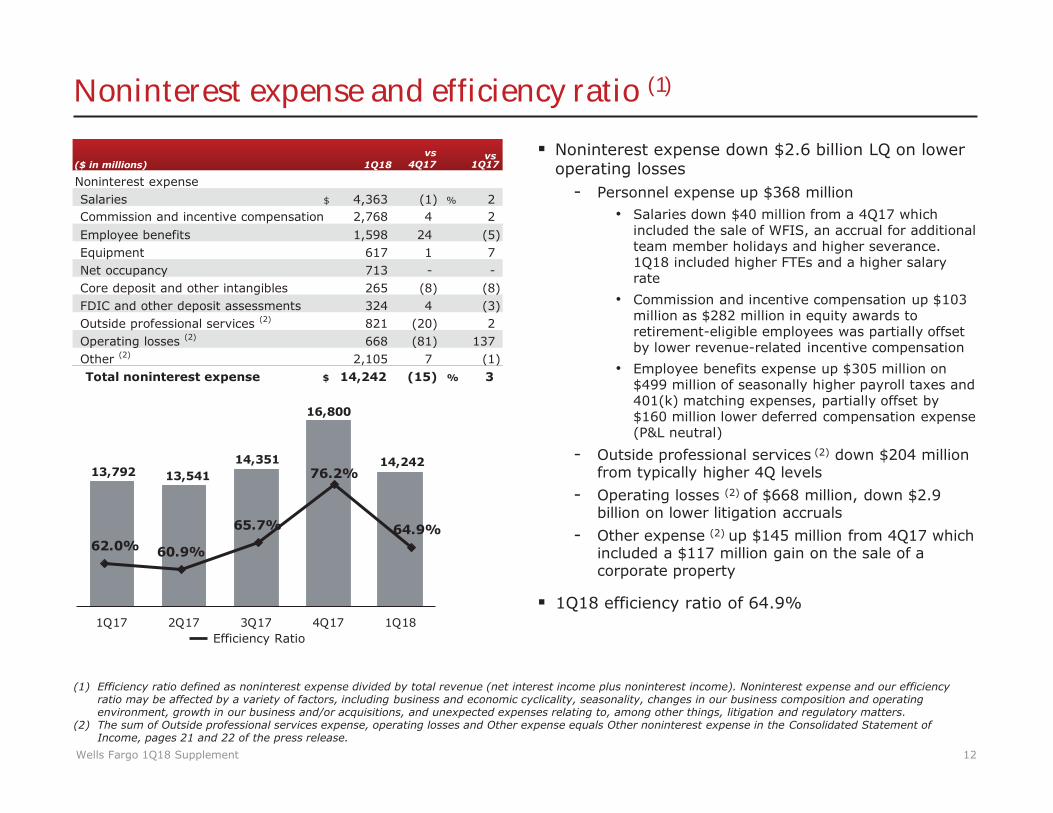
Noninterest expense and efficiency ratio (1)
16,800
Salaries $ 4,363 (1) % 2 Commission and incentive compensation 2,768 4 2 Employee benefits 1,598 24 (5) Equipment 617 1 7 Net occupancy 713 - -Core deposit and other intangibles 265 (8) (8) FDIC and other deposit assessments 324 4 (3) Outside professional services (2) 821 (20) 2 Operating losses (2) 668 (81) 137 Other (2) 2,105 7 (1) Total noninterest expense $ 14,242 (15) % 3
($ in millions) 1Q18 vs
4Q17 vs
1Q17
Noninterest expense
13,792 13,541 14,351 14,242
1Q17 2Q17 3Q17 4Q17 1Q18
62.0% 60.9%
65.7%
76.2%
64.9%
Efficiency Ratio
Noninterest expense down $2.6 billion LQ on lower operating losses
- Personnel expense up $368 million • Salaries down $40 million from a 4Q17 which
included the sale of WFIS, an accrual for additional team member holidays and higher severance. 1Q18 included higher FTEs and a higher salary rate
• Commission and incentive compensation up $103 million as $282 million in equity awards to retirement-eligible employees was partially offset by lower revenue-related incentive compensation
• Employee benefits expense up $305 million on $499 million of seasonally higher payroll taxes and 401(k) matching expenses, partially offset by $160 million lower deferred compensation expense (P&L neutral)
- Outside professional services (2) down $204 million from typically higher 4Q levels
- Operating losses (2) of $668 million, down $2.9 billion on lower litigation accruals
- Other expense (2) up $145 million from 4Q17 which included a $117 million gain on the sale of a corporate property
1Q18 efficiency ratio of 64.9%
(1) Efficiency ratio defined as noninterest expense divided by total revenue (net interest income plus noninterest income). Noninterest expense and our efficiency ratio may be affected by a variety of factors, including business and economic cyclicality, seasonality, changes in our business composition and operating environment, growth in our business and/or acquisitions, and unexpected expenses relating to, among other things, litigation and regulatory matters.
(2) The sum of Outside professional services expense, operating losses and Other expense equals Other noninterest expense in the Consolidated Statement of Income, pages 21 and 22 of the press release.
Wells Fargo 1Q18 Supplement 12
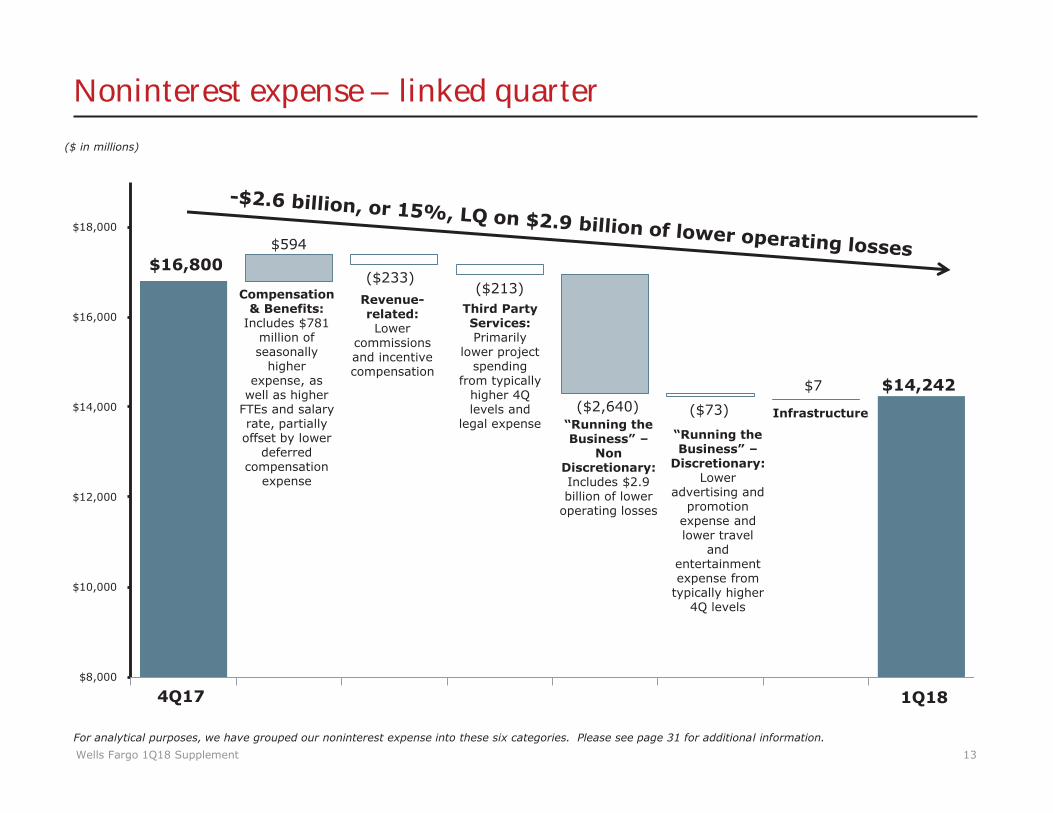
Noninterest expense – linked quarter ($ in millions)
$18,000
$16,000
$14,000
$12,000
$10,000
$8,000
$594 $16,800
($233) ($213)Compensation Revenue-
& Benefits: Third Party related: Includes $781 Services: Lower
million of Primarilycommissions seasonally lower project and incentive
higher spending compensation expense, as from typically $7 $14,242
well as higher higher 4Q FTEs and salary levels and ($2,640) ($73) Infrastructure rate, partially legal expense “Running the
“Running the offset by lower Business” – Business” – deferred Non
Discretionary: compensation Discretionary: Lower expense Includes $2.9
advertising and billion of lower promotionoperating losses
expense and lower travel
and entertainment expense from
typically higher 4Q levels
4Q17 1Q18
For analytical purposes, we have grouped our noninterest expense into these six categories. Please see page 31 for additional information. Wells Fargo 1Q18 Supplement 13
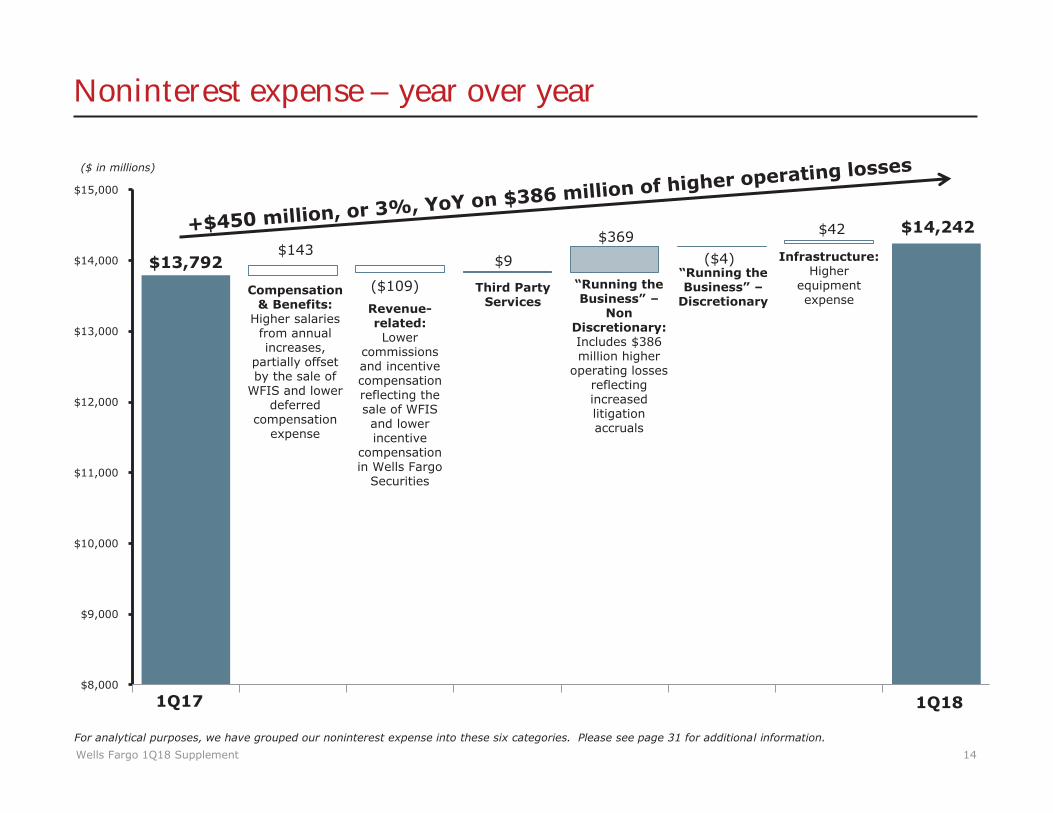
Noninterest expense – year over year
($ in millions)
$15,000
$14,242$369 $42 $143 ($4) Infrastructure: $14,000 $13,792 $9
“Running the Higher ($109) Third Party “Running the Business” – equipment Compensation
& Benefits: Services Business” – Discretionary expense Revenue- Non Higher salaries related: Discretionary: $13,000 from annual Lower Includes $386 increases, commissions million higher partially offset and incentive operating losses by the sale of compensation reflecting WFIS and lower reflecting the increased $12,000 deferred sale of WFIS litigationcompensation and lower accruals expense incentive
compensation in Wells Fargo $11,000
Securities
$10,000
$9,000
$8,000
1Q17 1Q18
For analytical purposes, we have grouped our noninterest expense into these six categories. Please see page 31 for additional information. Wells Fargo 1Q18 Supplement 14
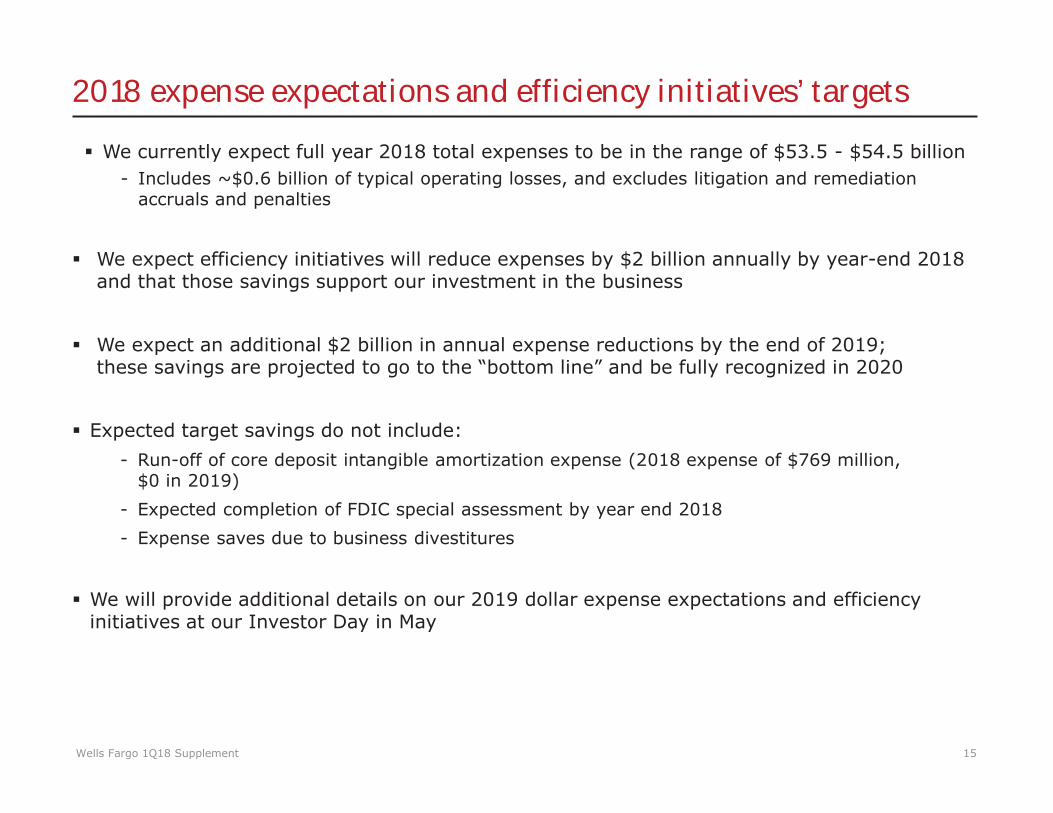
2018 expense expectations and efficiency initiatives’ targets
We currently expect full year 2018 total expenses to be in the range of $53.5 - $54.5 billion - Includes ~$0.6 billion of typical operating losses, and excludes litigation and remediation
accruals and penalties
We expect efficiency initiatives will reduce expenses by $2 billion annually by year-end 2018 and that those savings support our investment in the business
We expect an additional $2 billion in annual expense reductions by the end of 2019; these savings are projected to go to the “bottom line” and be fully recognized in 2020
Expected target savings do not include: - Run-off of core deposit intangible amortization expense (2018 expense of $769 million,
$0 in 2019) - Expected completion of FDIC special assessment by year end 2018 - Expense saves due to business divestitures
We will provide additional details on our 2019 dollar expense expectations and efficiency initiatives at our Investor Day in May
Wells Fargo 1Q18 Supplement 15
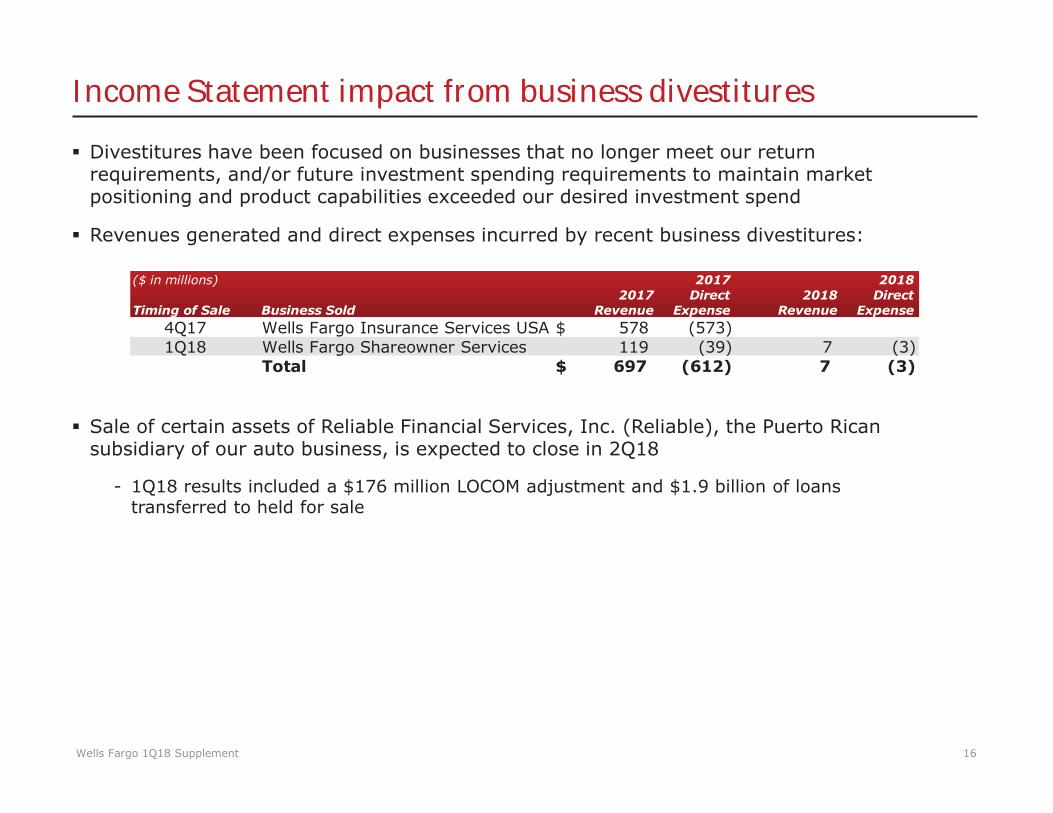
Income Statement impact from business divestitures
Divestitures have been focused on businesses that no longer meet our return requirements, and/or future investment spending requirements to maintain market positioning and product capabilities exceeded our desired investment spend
Revenues generated and direct expenses incurred by recent business divestitures:
($ in millions) 2017 2018 2017 Direct 2018 Direct
Timing of Sale Business Sold Revenue Expense Revenue Expense 4Q17 Wells Fargo Insurance Services USA $ 578 (573) 1Q18 Wells Fargo Shareowner Services 119 (39) 7 (3)
Total $ 697 (612) 7 (3)
Sale of certain assets of Reliable Financial Services, Inc. (Reliable), the Puerto Rican subsidiary of our auto business, is expected to close in 2Q18
- 1Q18 results included a $176 million LOCOM adjustment and $1.9 billion of loans transferred to held for sale
Wells Fargo 1Q18 Supplement 16
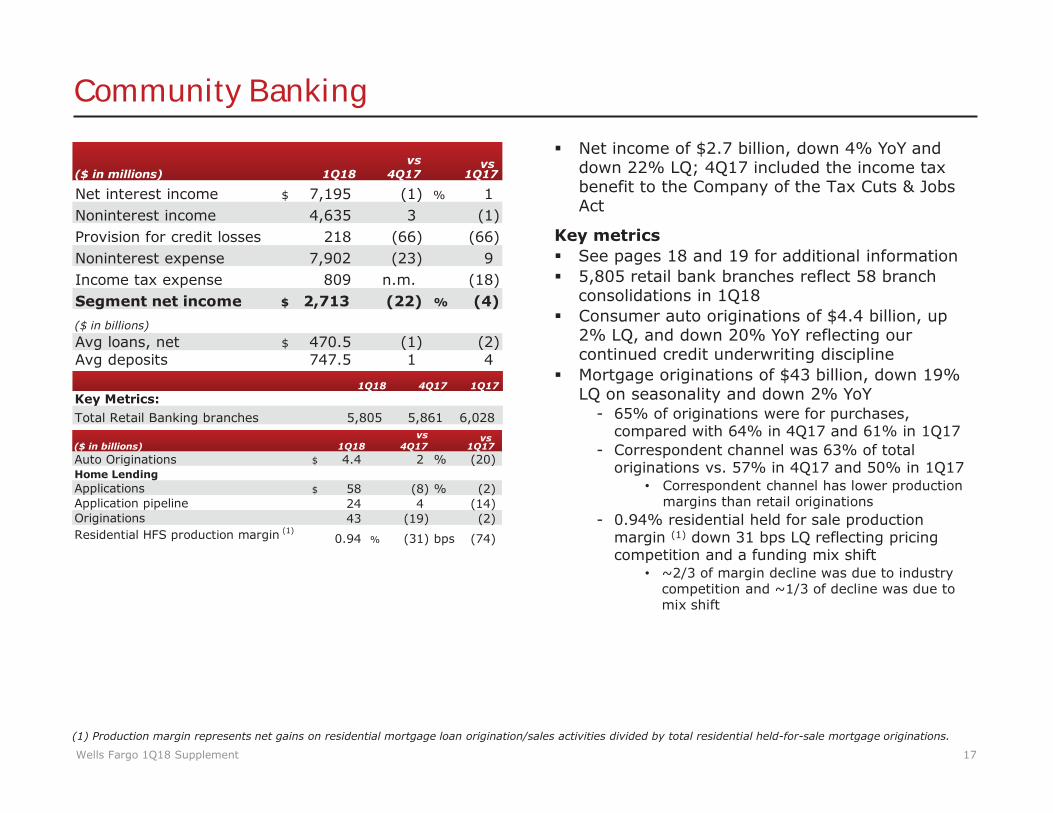
Community Banking
($ in millions) 1Q18 vs
4Q17 vs
1Q17
Net interest income $
Noninterest income Provision for credit losses Noninterest expense Income tax expense Segment net income $
($ in billions) Avg loans, net $ Avg deposits
1Q18 4Q17 1Q17 Key Metrics: Total Retail Banking branches
7,195 (1) % 1 4,635 3 (1)
218 (66) (66) 7,902 (23) 9
809 n.m. (18) 2,713 (22) % (4)
470.5 (1) (2) 747.5 1 4
5,805 5,861 6,028
($ in billions) 1Q18 vs
4Q17 vs
1Q17 Auto Originations $ 4.4 2 % (20) Home Lending Applications $ 58 (8) % (2) Application pipeline 24 4 (14) Originations 43 (19) (2) Residential HFS production margin (1)
0.94 % (31) bps (74)
Net income of $2.7 billion, down 4% YoY and down 22% LQ; 4Q17 included the income tax benefit to the Company of the Tax Cuts & Jobs Act
Key metrics See pages 18 and 19 for additional information 5,805 retail bank branches reflect 58 branch consolidations in 1Q18 Consumer auto originations of $4.4 billion, up 2% LQ, and down 20% YoY reflecting our continued credit underwriting discipline Mortgage originations of $43 billion, down 19% LQ on seasonality and down 2% YoY
- 65% of originations were for purchases, compared with 64% in 4Q17 and 61% in 1Q17
- Correspondent channel was 63% of total originations vs. 57% in 4Q17 and 50% in 1Q17
• Correspondent channel has lower production margins than retail originations
- 0.94% residential held for sale production margin (1) down 31 bps LQ reflecting pricing competition and a funding mix shift
• ~2/3 of margin decline was due to industry competition and ~1/3 of decline was due to mix shift
(1) Production margin represents net gains on residential mortgage loan origination/sales activities divided by total residential held-for-sale mortgage originations.
Wells Fargo 1Q18 Supplement 17
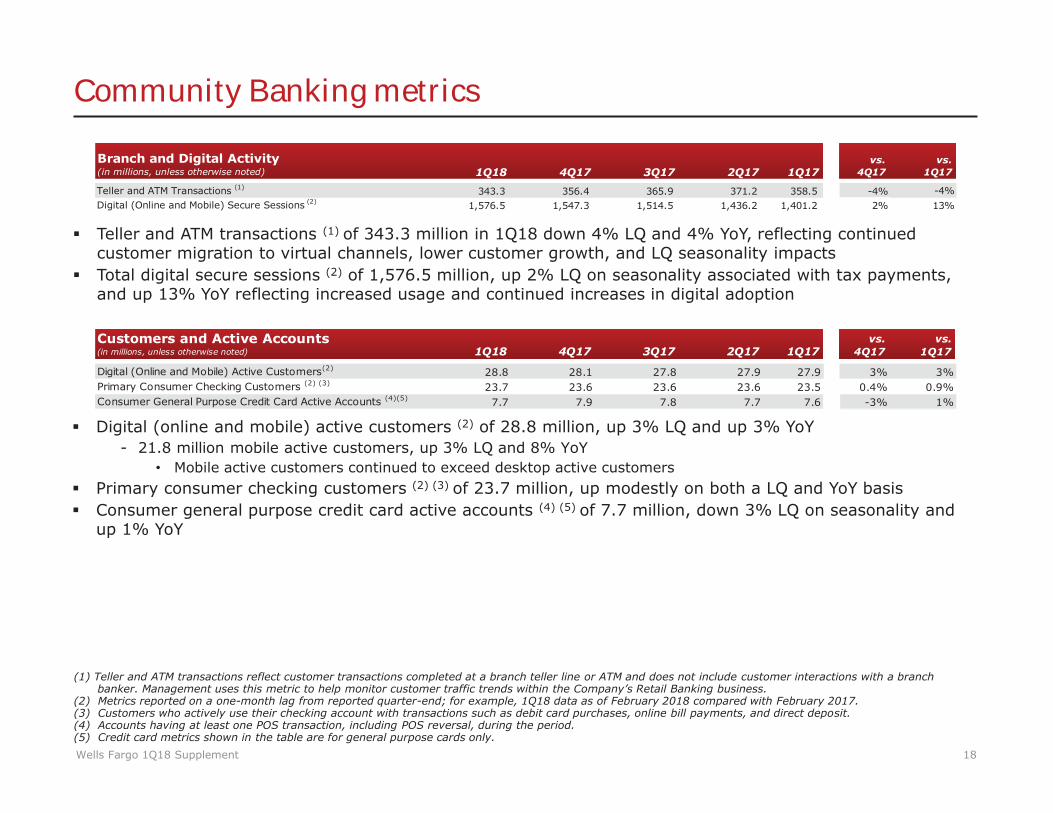
Community Banking metrics
Branch and Digital Activity (in millions, unless otherwise noted) 1Q18 4Q17 3Q17 2Q17 1Q17
vs. 4Q17
vs. 1Q17
Teller and ATM Transactions (1) 343.3 356.4 365.9 371.2 358.5 -4% -4% 2%Digital (Online and Mobile) Secure Sessions (2) 1,576.5 1,547.3 1,514.5 1,436.2 1,401.2 13%
Teller and ATM transactions (1) of 343.3 million in 1Q18 down 4% LQ and 4% YoY, reflecting continued customer migration to virtual channels, lower customer growth, and LQ seasonality impacts Total digital secure sessions (2) of 1,576.5 million, up 2% LQ on seasonality associated with tax payments, and up 13% YoY reflecting increased usage and continued increases in digital adoption
Customers and Active Accounts (in millions, unless otherwise noted) 1Q18 4Q17 3Q17 2Q17 1Q17
vs. 4Q17
vs. 1Q17
Digital (Online and Mobile) Active Customers(2) 28.8 28.1 27.8 27.9 27.9 3% 3% Primary Consumer Checking Customers (2) (3) 23.7 23.6 23.6 23.6 23.5 0.4% 0.9% Consumer General Purpose Credit Card Active Accounts (4)(5) 7.7 7.9 7.8 7.7 7.6 -3% 1%
Digital (online and mobile) active customers (2) of 28.8 million, up 3% LQ and up 3% YoY - 21.8 million mobile active customers, up 3% LQ and 8% YoY
• Mobile active customers continued to exceed desktop active customers Primary consumer checking customers (2) (3) of 23.7 million, up modestly on both a LQ and YoY basis Consumer general purpose credit card active accounts (4) (5) of 7.7 million, down 3% LQ on seasonality and up 1% YoY
(1) Teller and ATM transactions reflect customer transactions completed at a branch teller line or ATM and does not include customer interactions with a branch banker. Management uses this metric to help monitor customer traffic trends within the Company’s Retail Banking business.
(2) Metrics reported on a one-month lag from reported quarter-end; for example, 1Q18 data as of February 2018 compared with February 2017. (3) Customers who actively use their checking account with transactions such as debit card purchases, online bill payments, and direct deposit. (4) Accounts having at least one POS transaction, including POS reversal, during the period. (5) Credit card metrics shown in the table are for general purpose cards only. Wells Fargo 1Q18 Supplement 18
-
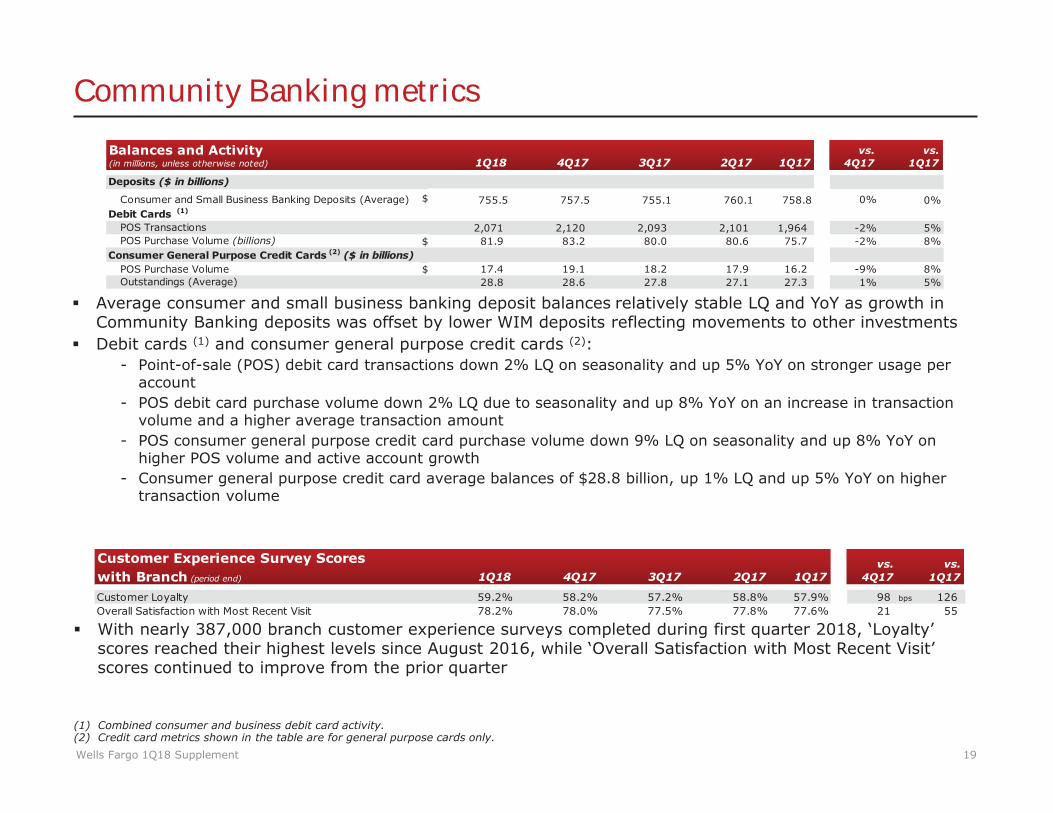
Community Banking metrics
Balances and Activity (in millions, unless otherwise noted) 1Q18 4Q17 3Q17 2Q17 1Q17
vs. 4Q17
vs. 1Q17
Deposits ($ in billions)
Consumer and Small Business Banking Deposits (Average) $ Debit Cards (1)
POS Transactions 2,071 2,120 2,093 2,101 1,964 -2% 5% POS Purchase Volume (billions) $ 81.9 83.2 80.0 80.6 75.7 -2% 8%
Consumer General Purpose Credit Cards (2) ($ in billions) POS Purchase Volume $ 17.4 19.1 18.2 17.9 16.2 -9% 8% Outstandings (Average) 28.8 28.6 27.8 27.1 27.3 1% 5%
Average consumer and small business banking deposit balances relatively stable LQ and YoY as growth in Community Banking deposits was offset by lower WIM deposits reflecting movements to other investments Debit cards (1) and consumer general purpose credit cards (2):
- Point-of-sale (POS) debit card transactions down 2% LQ on seasonality and up 5% YoY on stronger usage per account
- POS debit card purchase volume down 2% LQ due to seasonality and up 8% YoY on an increase in transaction volume and a higher average transaction amount
- POS consumer general purpose credit card purchase volume down 9% LQ on seasonality and up 8% YoY on higher POS volume and active account growth
- Consumer general purpose credit card average balances of $28.8 billion, up 1% LQ and up 5% YoY on higher transaction volume
755.5 757.5 755.1 760.1 758.8 0% 0%
Customer Experience Survey Scores with Branch (period end) 1Q18 4Q17 3Q17 2Q17 1Q17
vs. 4Q17
vs. 1Q17
Customer Loyalty 59.2% 58.2% 57.2% 58.8% 57.9% 98 bps 126 Overall Satisfaction with Most Recent Visit 78.2% 78.0% 77.5% 77.8% 77.6% 21 55
With nearly 387,000 branch customer experience surveys completed during first quarter 2018, ‘Loyalty’ scores reached their highest levels since August 2016, while ‘Overall Satisfaction with Most Recent Visit’ scores continued to improve from the prior quarter
(1) Combined consumer and business debit card activity. (2) Credit card metrics shown in the table are for general purpose cards only. Wells Fargo 1Q18 Supplement 19
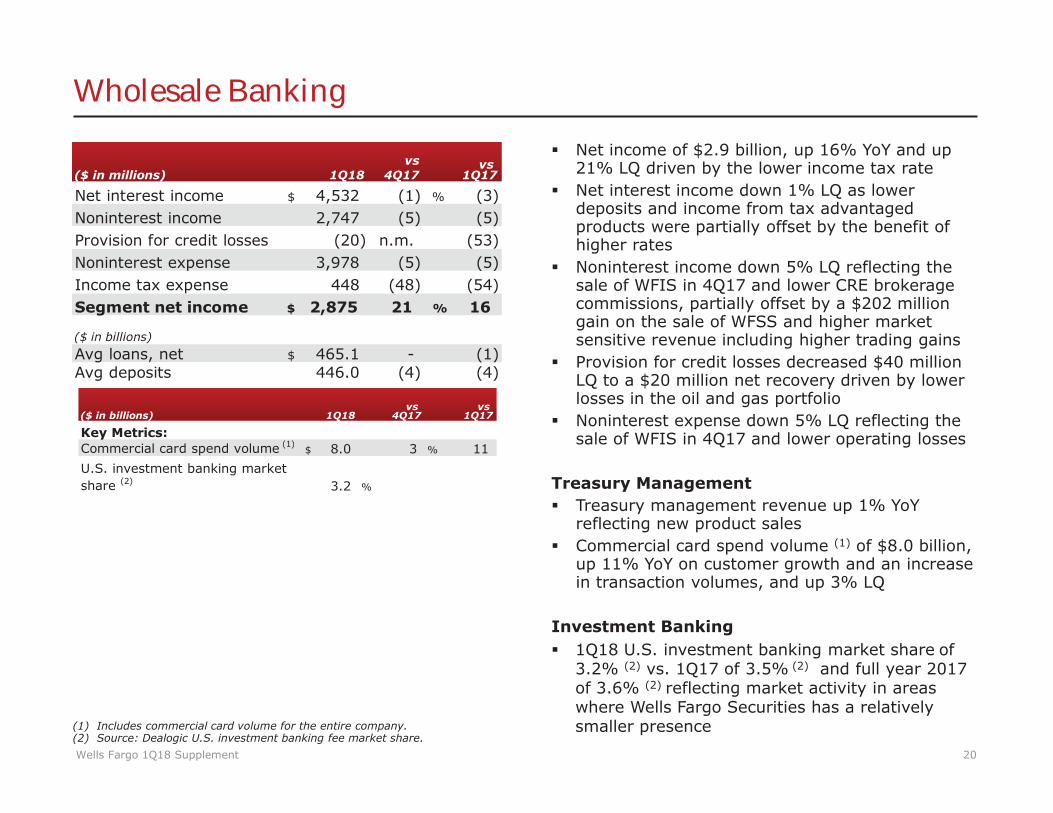
Wholesale Banking
($ in millions) 1Q18 vs
4Q17 vs
1Q17
Net interest income $ 4,532 (1) % (3) Noninterest income 2,747 (5) (5) Provision for credit losses (20) n.m. (53) Noninterest expense 3,978 (5) (5) Income tax expense 448 (48) (54) Segment net income $ 2,875 21 % 16
($ in billions) Avg loans, net $ 465.1 - (1) Avg deposits 446.0 (4) (4)
($ in billions) 1Q18 4Q17 1Q17 vs vs
Key Metrics: Commercial card spend volume (1) $ 8.0 3 % 11 U.S. investment banking market share (2) 3.2 %
(1) Includes commercial card volume for the entire company. (2) Source: Dealogic U.S. investment banking fee market share. Wells Fargo 1Q18 Supplement
Net income of $2.9 billion, up 16% YoY and up 21% LQ driven by the lower income tax rate Net interest income down 1% LQ as lower deposits and income from tax advantaged products were partially offset by the benefit of higher rates Noninterest income down 5% LQ reflecting the sale of WFIS in 4Q17 and lower CRE brokerage commissions, partially offset by a $202 million gain on the sale of WFSS and higher market sensitive revenue including higher trading gains Provision for credit losses decreased $40 million LQ to a $20 million net recovery driven by lower losses in the oil and gas portfolio Noninterest expense down 5% LQ reflecting the sale of WFIS in 4Q17 and lower operating losses
Treasury Management Treasury management revenue up 1% YoY reflecting new product sales Commercial card spend volume (1) of $8.0 billion, up 11% YoY on customer growth and an increase in transaction volumes, and up 3% LQ
Investment Banking 1Q18 U.S. investment banking market share of 3.2% (2) vs. 1Q17 of 3.5% (2) and full year 2017 of 3.6% (2) reflecting market activity in areas where Wells Fargo Securities has a relatively smaller presence
20
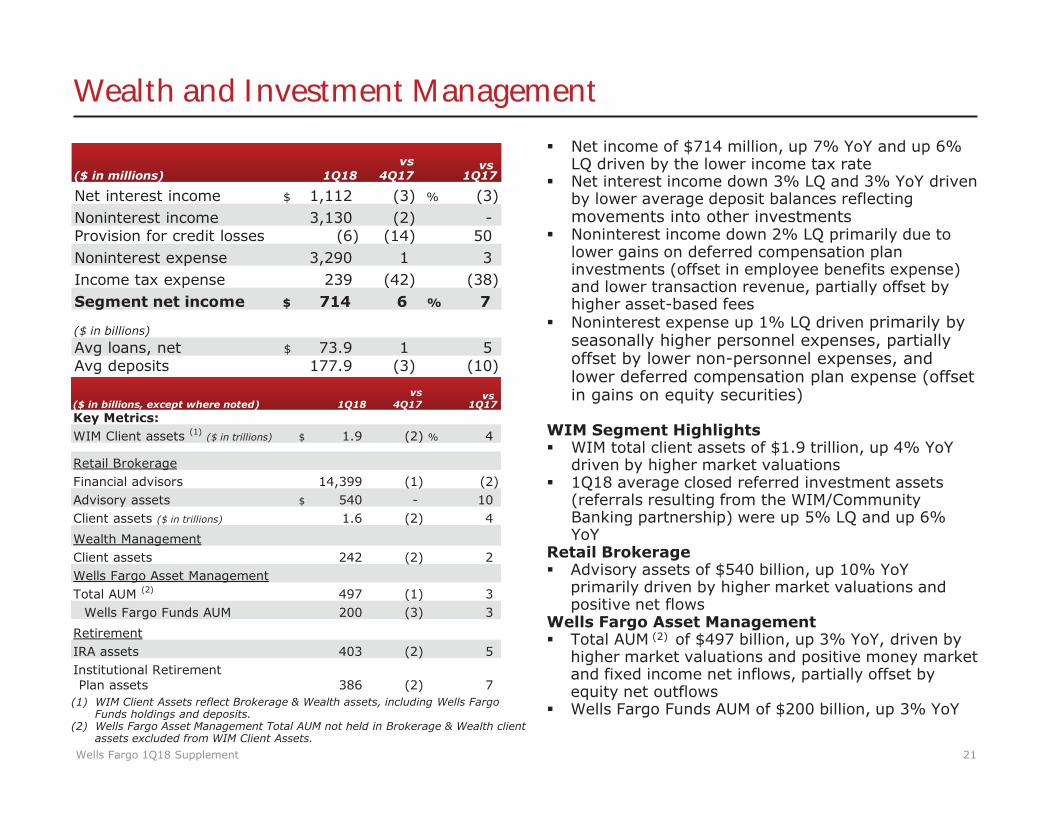
Wealth and Investment Management
($ in millions) 1Q18 vs
4Q17 vs
1Q17
Net interest income $ 1,112 (3) % (3) Noninterest income 3,130 (2) -Provision for credit losses (6) (14) 50 Noninterest expense 3,290 1 3 Income tax expense 239 (42) (38) Segment net income $ 714 6 % 7
($ in billions) Avg loans, net $ 73.9 1 5 Avg deposits 177.9 (3) (10)
($ in billions, except where noted) 1Q18 vs
4Q17 vs
1Q17 Key Metrics: WIM Client assets (1) ($ in trillions) $ 1.9 (2) % 4
Retail Brokerage Financial advisors 14,399 (1) (2) Advisory assets $ 540 - 10 Client assets ($ in trillions) 1.6 (2) 4 Wealth Management Client assets 242 (2) 2 Wells Fargo Asset Management Total AUM (2) 497 (1) 3
Wells Fargo Funds AUM 200 (3) 3 Retirement IRA assets 403 (2) 5 Institutional Retirement Plan assets 386 (2) 7
(1) WIM Client Assets reflect Brokerage & Wealth assets, including Wells Fargo Funds holdings and deposits.
(2) Wells Fargo Asset Management Total AUM not held in Brokerage & Wealth client assets excluded from WIM Client Assets.
Net income of $714 million, up 7% YoY and up 6% LQ driven by the lower income tax rate Net interest income down 3% LQ and 3% YoY driven by lower average deposit balances reflecting movements into other investments Noninterest income down 2% LQ primarily due to lower gains on deferred compensation plan investments (offset in employee benefits expense) and lower transaction revenue, partially offset by higher asset-based fees Noninterest expense up 1% LQ driven primarily by seasonally higher personnel expenses, partially offset by lower non-personnel expenses, and lower deferred compensation plan expense (offset in gains on equity securities)
WIM Segment Highlights WIM total client assets of $1.9 trillion, up 4% YoY driven by higher market valuations 1Q18 average closed referred investment assets (referrals resulting from the WIM/Community Banking partnership) were up 5% LQ and up 6% YoY
Retail Brokerage Advisory assets of $540 billion, up 10% YoY primarily driven by higher market valuations and positive net flows
Wells Fargo Asset Management Total AUM (2) of $497 billion, up 3% YoY, driven by higher market valuations and positive money market and fixed income net inflows, partially offset by equity net outflows Wells Fargo Funds AUM of $200 billion, up 3% YoY
Wells Fargo 1Q18 Supplement 21
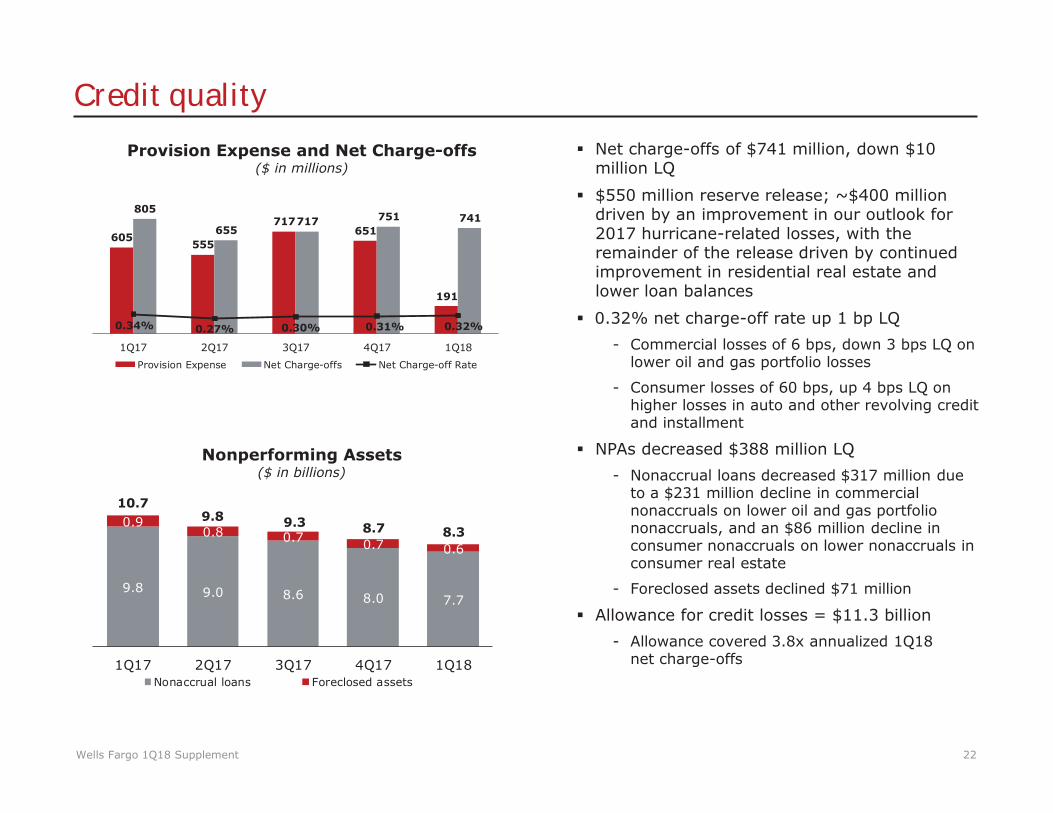
605
Credit quality
Provision Expense and Net Charge-offs ($ in millions)
805 751 741717717
655 651 555
191
0.34% 0.27% 0.30% 0.31% 0.32%
1Q17 2Q17 3Q17 4Q17 1Q18 Provision Expense Net Charge-offs Net Charge-off Rate
Nonperforming Assets ($ in billions)
10.7
9.8 9.0 8.6 8.0 7.7
0.9 0.8 0.7 0.7 0.6
9.8 9.3 8.7 8.3
1Q17 2Q17 3Q17 4Q17 1Q18 Nonaccrual loans Foreclosed assets
Net charge-offs of $741 million, down $10 million LQ
$550 million reserve release; ~$400 million driven by an improvement in our outlook for 2017 hurricane-related losses, with the remainder of the release driven by continued improvement in residential real estate and lower loan balances
0.32% net charge-off rate up 1 bp LQ - Commercial losses of 6 bps, down 3 bps LQ on
lower oil and gas portfolio losses
- Consumer losses of 60 bps, up 4 bps LQ on higher losses in auto and other revolving credit and installment
NPAs decreased $388 million LQ - Nonaccrual loans decreased $317 million due
to a $231 million decline in commercial nonaccruals on lower oil and gas portfolio nonaccruals, and an $86 million decline in consumer nonaccruals on lower nonaccruals in consumer real estate
- Foreclosed assets declined $71 million
Allowance for credit losses = $11.3 billion - Allowance covered 3.8x annualized 1Q18
net charge-offs
Wells Fargo 1Q18 Supplement 22
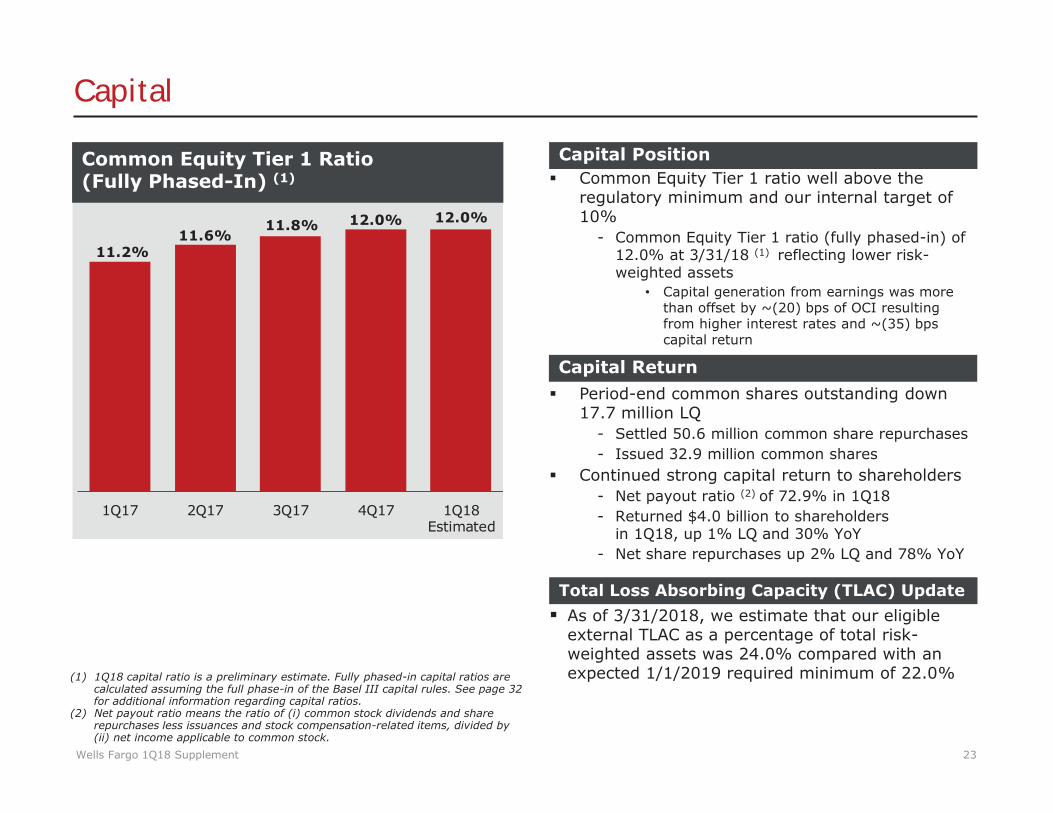
Capital
12.0% 12.0%
Common Equity Tier 1 Ratio (Fully Phased-In) (1)
11.8% 11.6%
11.2%
1Q17 2Q17 3Q17 4Q17 1Q18 Estimated
(1) 1Q18 capital ratio is a preliminary estimate. Fully phased-in capital ratios are calculated assuming the full phase-in of the Basel III capital rules. See page 32 for additional information regarding capital ratios.
(2) Net payout ratio means the ratio of (i) common stock dividends and share repurchases less issuances and stock compensation-related items, divided by (ii) net income applicable to common stock.
Capital Position Common Equity Tier 1 ratio well above the regulatory minimum and our internal target of 10%
- Common Equity Tier 1 ratio (fully phased-in) of 12.0% at 3/31/18 (1) reflecting lower risk-weighted assets
• Capital generation from earnings was more than offset by ~(20) bps of OCI resulting from higher interest rates and ~(35) bps capital return
Capital Return Period-end common shares outstanding down 17.7 million LQ
- Settled 50.6 million common share repurchases - Issued 32.9 million common shares
Continued strong capital return to shareholders - Net payout ratio (2) of 72.9% in 1Q18 - Returned $4.0 billion to shareholders
in 1Q18, up 1% LQ and 30% YoY - Net share repurchases up 2% LQ and 78% YoY
Total Loss Absorbing Capacity (TLAC) Update As of 3/31/2018, we estimate that our eligible external TLAC as a percentage of total risk-weighted assets was 24.0% compared with an expected 1/1/2019 required minimum of 22.0%
Wells Fargo 1Q18 Supplement 23
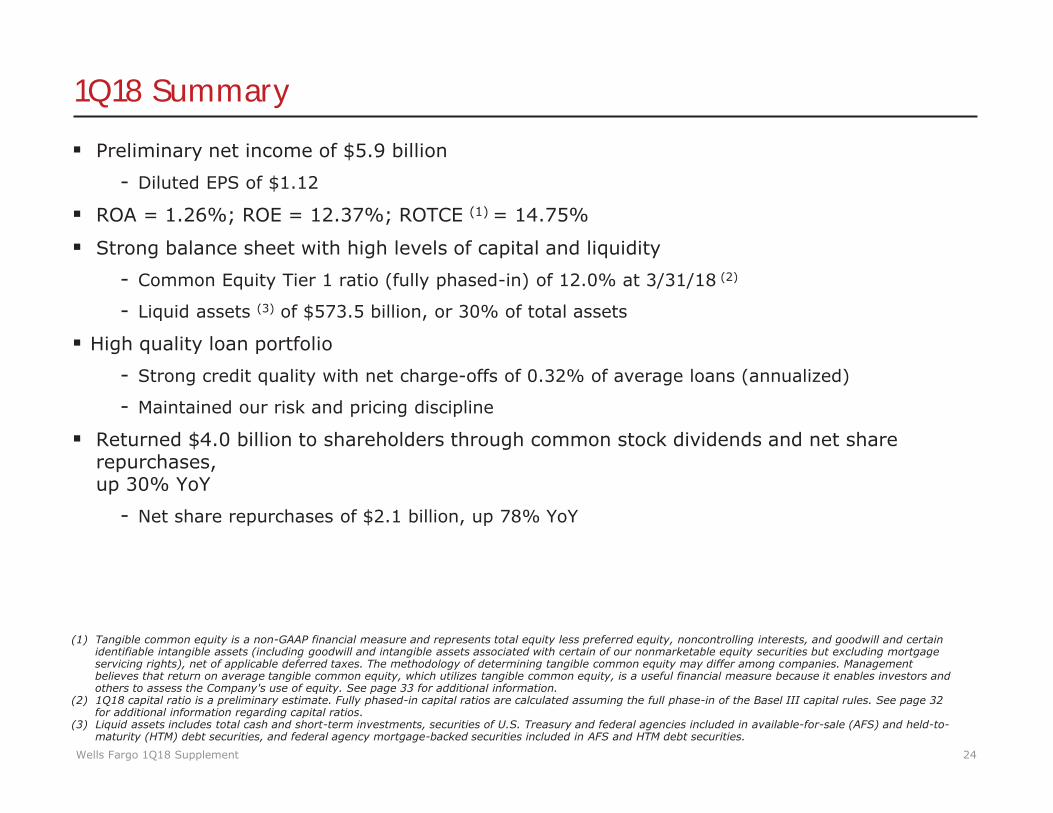
1Q18 Summary
Preliminary net income of $5.9 billion - Diluted EPS of $1.12
ROA = 1.26%; ROE = 12.37%; ROTCE (1) = 14.75%
Strong balance sheet with high levels of capital and liquidity - Common Equity Tier 1 ratio (fully phased-in) of 12.0% at 3/31/18 (2)
- Liquid assets (3) of $573.5 billion, or 30% of total assets
High quality loan portfolio
- Strong credit quality with net charge-offs of 0.32% of average loans (annualized)
- Maintained our risk and pricing discipline
Returned $4.0 billion to shareholders through common stock dividends and net share repurchases, up 30% YoY
- Net share repurchases of $2.1 billion, up 78% YoY
(1) Tangible common equity is a non-GAAP financial measure and represents total equity less preferred equity, noncontrolling interests, and goodwill and certain identifiable intangible assets (including goodwill and intangible assets associated with certain of our nonmarketable equity securities but excluding mortgage servicing rights), net of applicable deferred taxes. The methodology of determining tangible common equity may differ among companies. Management believes that return on average tangible common equity, which utilizes tangible common equity, is a useful financial measure because it enables investors and others to assess the Company's use of equity. See page 33 for additional information.
(2) 1Q18 capital ratio is a preliminary estimate. Fully phased-in capital ratios are calculated assuming the full phase-in of the Basel III capital rules. See page 32 for additional information regarding capital ratios.
(3) Liquid assets includes total cash and short-term investments, securities of U.S. Treasury and federal agencies included in available-for-sale (AFS) and held-to-maturity (HTM) debt securities, and federal agency mortgage-backed securities included in AFS and HTM debt securities.
Wells Fargo 1Q18 Supplement 24

Appendix
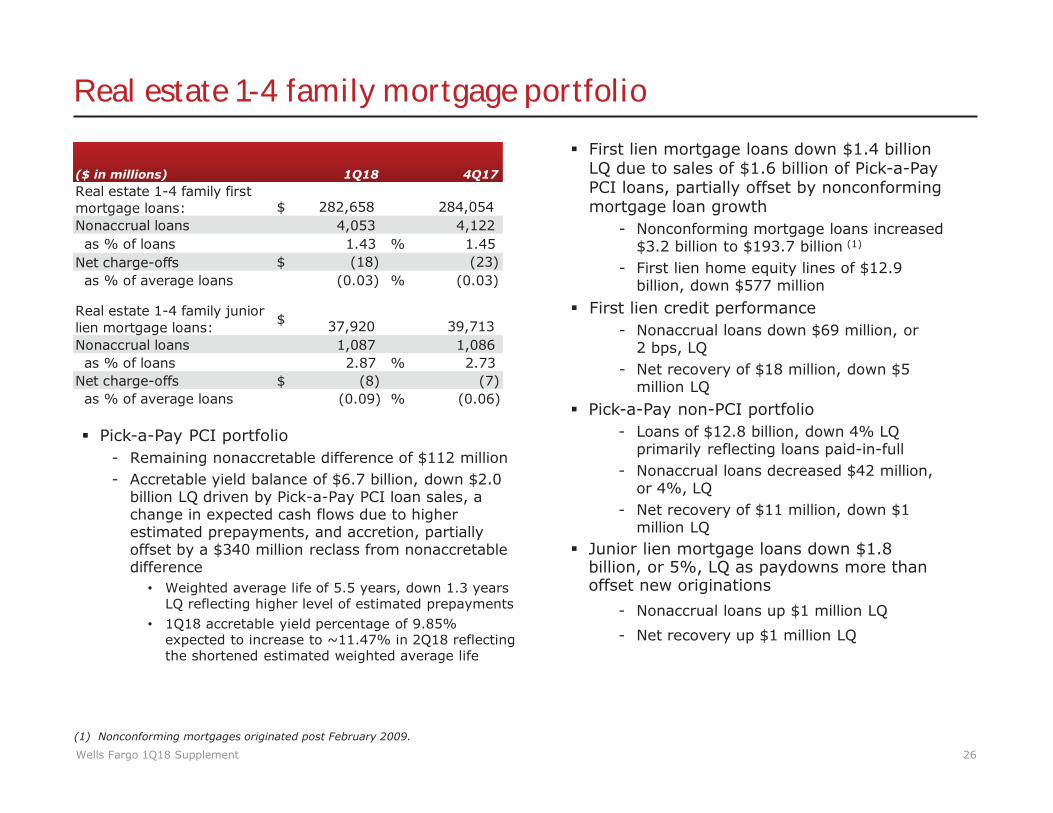
Real estate 1-4 family mortgage portfolio
($ in millions) 1Q18 4Q17 Real estate 1-4 family first mortgage loans: $ 282,658 284,054 Nonaccrual loans 4,053 4,122 as % of loans 1.43 % 1.45 Net charge-offs $ (18) (23) as % of average loans (0.03) % (0.03)
Real estate 1-4 family junior $lien mortgage loans: 37,920 39,713 Nonaccrual loans 1,087 1,086 as % of loans 2.87 % 2.73 Net charge-offs $ (8) (7) as % of average loans (0.09) % (0.06)
Pick-a-Pay PCI portfolio - Remaining nonaccretable difference of $112 million - Accretable yield balance of $6.7 billion, down $2.0
billion LQ driven by Pick-a-Pay PCI loan sales, a change in expected cash flows due to higher estimated prepayments, and accretion, partially offset by a $340 million reclass from nonaccretable difference • Weighted average life of 5.5 years, down 1.3 years
LQ reflecting higher level of estimated prepayments • 1Q18 accretable yield percentage of 9.85%
expected to increase to ~11.47% in 2Q18 reflecting the shortened estimated weighted average life
First lien mortgage loans down $1.4 billion LQ due to sales of $1.6 billion of Pick-a-Pay PCI loans, partially offset by nonconforming mortgage loan growth
- Nonconforming mortgage loans increased $3.2 billion to $193.7 billion (1)
- First lien home equity lines of $12.9 billion, down $577 million
First lien credit performance - Nonaccrual loans down $69 million, or
2 bps, LQ - Net recovery of $18 million, down $5
million LQ Pick-a-Pay non-PCI portfolio
- Loans of $12.8 billion, down 4% LQ primarily reflecting loans paid-in-full
- Nonaccrual loans decreased $42 million, or 4%, LQ
- Net recovery of $11 million, down $1 million LQ
Junior lien mortgage loans down $1.8 billion, or 5%, LQ as paydowns more than offset new originations
- Nonaccrual loans up $1 million LQ - Net recovery up $1 million LQ
(1) Nonconforming mortgages originated post February 2009.
Wells Fargo 1Q18 Supplement 26
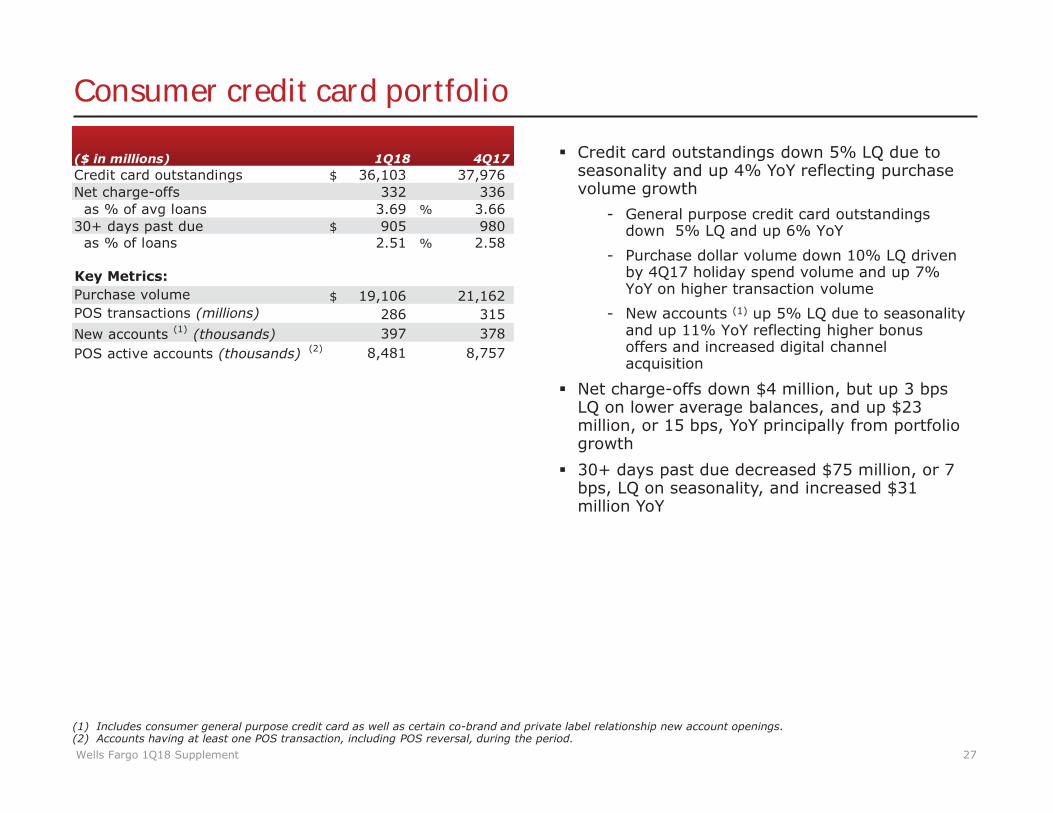
Consumer credit card portfolio
($ in millions) 1Q18 4Q17 Credit card outstandings $ 36,103 37,976 Net charge-offs 332 336 as % of avg loans 3.69 % 3.66 30+ days past due $ 905 980 as % of loans 2.51 % 2.58
Key Metrics: Purchase volume $ 19,106 21,162 POS transactions (millions) 286 315 New accounts (1) (thousands) 397 378 POS active accounts (thousands) (2) 8,481 8,757
Credit card outstandings down 5% LQ due to seasonality and up 4% YoY reflecting purchase volume growth
- General purpose credit card outstandings down 5% LQ and up 6% YoY
- Purchase dollar volume down 10% LQ driven by 4Q17 holiday spend volume and up 7% YoY on higher transaction volume
- New accounts (1) up 5% LQ due to seasonality and up 11% YoY reflecting higher bonus offers and increased digital channel acquisition
Net charge-offs down $4 million, but up 3 bps LQ on lower average balances, and up $23 million, or 15 bps, YoY principally from portfolio growth 30+ days past due decreased $75 million, or 7 bps, LQ on seasonality, and increased $31 million YoY
(1) Includes consumer general purpose credit card as well as certain co-brand and private label relationship new account openings. (2) Accounts having at least one POS transaction, including POS reversal, during the period. Wells Fargo 1Q18 Supplement 27
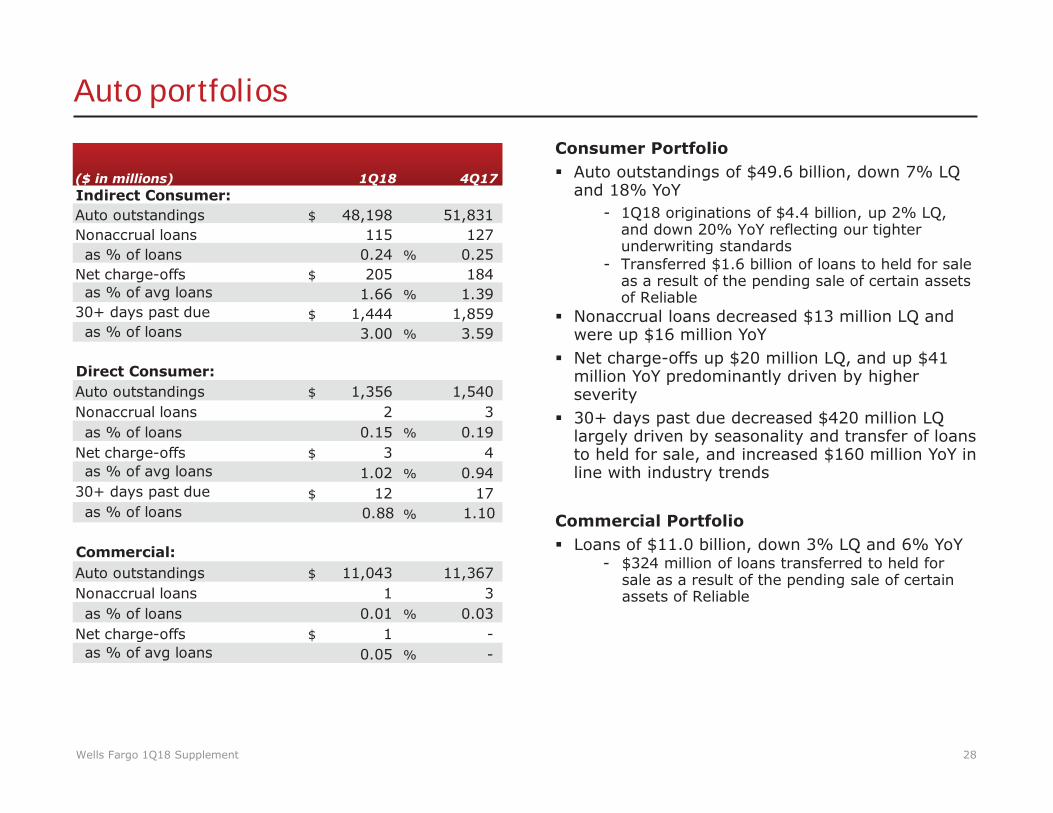
Auto portfolios
($ in millions) 1Q18 4Q17
Auto outstandings $ 48,198 51,831 Nonaccrual loans 115 127 as % of loans 0.24 % 0.25 Net charge-offs $ 205 184 as % of avg loans 1.66 % 1.39 30+ days past due $ 1,444 1,859 as % of loans 3.00 % 3.59
Auto outstandings $ 1,356 1,540 Nonaccrual loans 2 3 as % of loans 0.15 % 0.19 Net charge-offs $ 3 4 as % of avg loans 1.02 % 0.94 30+ days past due $ 12 17 as % of loans 0.88 % 1.10
Commercial: Auto outstandings $ 11,043 11,367 Nonaccrual loans 1 3 as % of loans 0.01 % 0.03 Net charge-offs $ 1 - as % of avg loans 0.05 % -
Indirect Consumer:
Direct Consumer:
Wells Fargo 1Q18 Supplement
Consumer Portfolio Auto outstandings of $49.6 billion, down 7% LQ and 18% YoY
- 1Q18 originations of $4.4 billion, up 2% LQ, and down 20% YoY reflecting our tighter underwriting standards
- Transferred $1.6 billion of loans to held for sale as a result of the pending sale of certain assets of Reliable
Nonaccrual loans decreased $13 million LQ and were up $16 million YoY Net charge-offs up $20 million LQ, and up $41 million YoY predominantly driven by higher severity 30+ days past due decreased $420 million LQ largely driven by seasonality and transfer of loans to held for sale, and increased $160 million YoY in line with industry trends
Commercial Portfolio Loans of $11.0 billion, down 3% LQ and 6% YoY
- $324 million of loans transferred to held for sale as a result of the pending sale of certain assets of Reliable
28
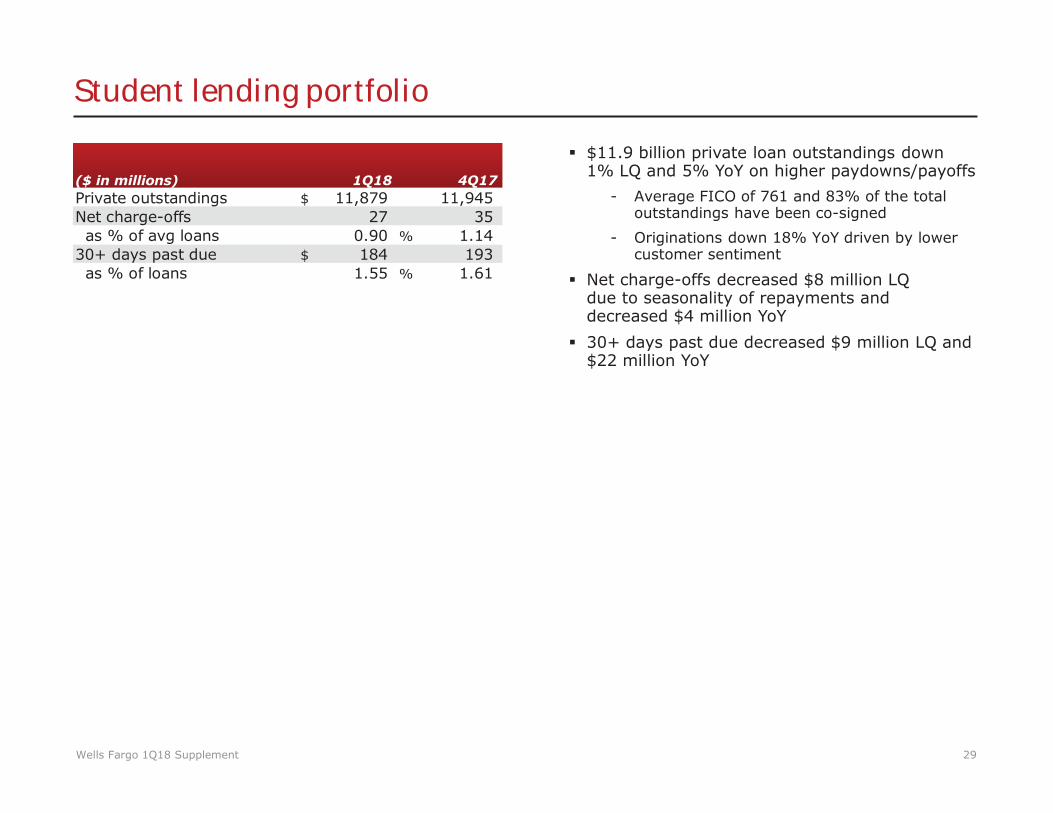
Student lending portfolio
($ in millions) 1Q18 4Q17 Private outstandings $ 11,879 11,945 Net charge-offs 27 35 as % of avg loans 0.90 % 1.14 30+ days past due $ 184 193 as % of loans 1.55 % 1.61
$11.9 billion private loan outstandings down 1% LQ and 5% YoY on higher paydowns/payoffs
- Average FICO of 761 and 83% of the total outstandings have been co-signed
- Originations down 18% YoY driven by lower customer sentiment
Net charge-offs decreased $8 million LQ due to seasonality of repayments and decreased $4 million YoY 30+ days past due decreased $9 million LQ and $22 million YoY
Wells Fargo 1Q18 Supplement 29
-
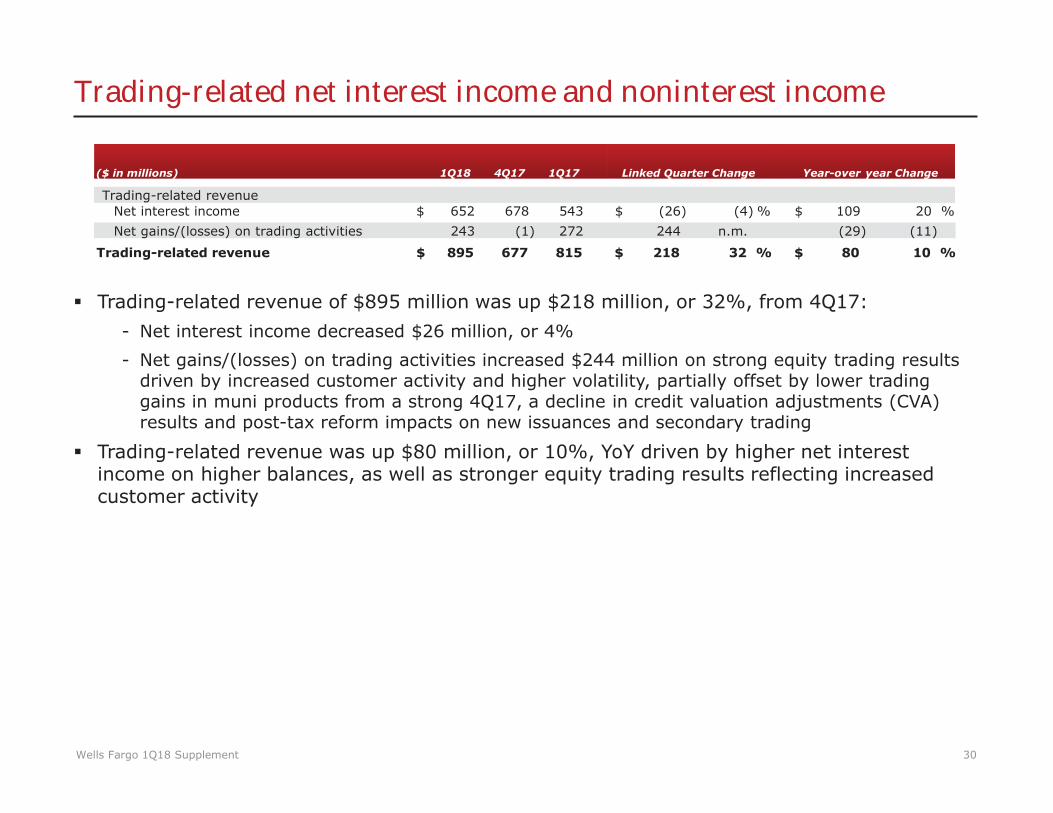
Trading-related net interest income and noninterest income
($ in millions) 1Q18 4Q17 1Q17
Trading-related revenue
Linked Quarter Change Year-over year Change
Net interest income $ 652 678 543 $ (26) (4) % $ 109 20 % Net gains/(losses) on trading activities 243 (1) 272 244 n.m. (29) (11)
Trading-related revenue $ 895 677 815 $ 218 32 % $ 80 10 %
Trading-related revenue of $895 million was up $218 million, or 32%, from 4Q17: - Net interest income decreased $26 million, or 4% - Net gains/(losses) on trading activities increased $244 million on strong equity trading results
driven by increased customer activity and higher volatility, partially offset by lower trading gains in muni products from a strong 4Q17, a decline in credit valuation adjustments (CVA) results and post-tax reform impacts on new issuances and secondary trading
Trading-related revenue was up $80 million, or 10%, YoY driven by higher net interest income on higher balances, as well as stronger equity trading results reflecting increased customer activity
Wells Fargo 1Q18 Supplement 30
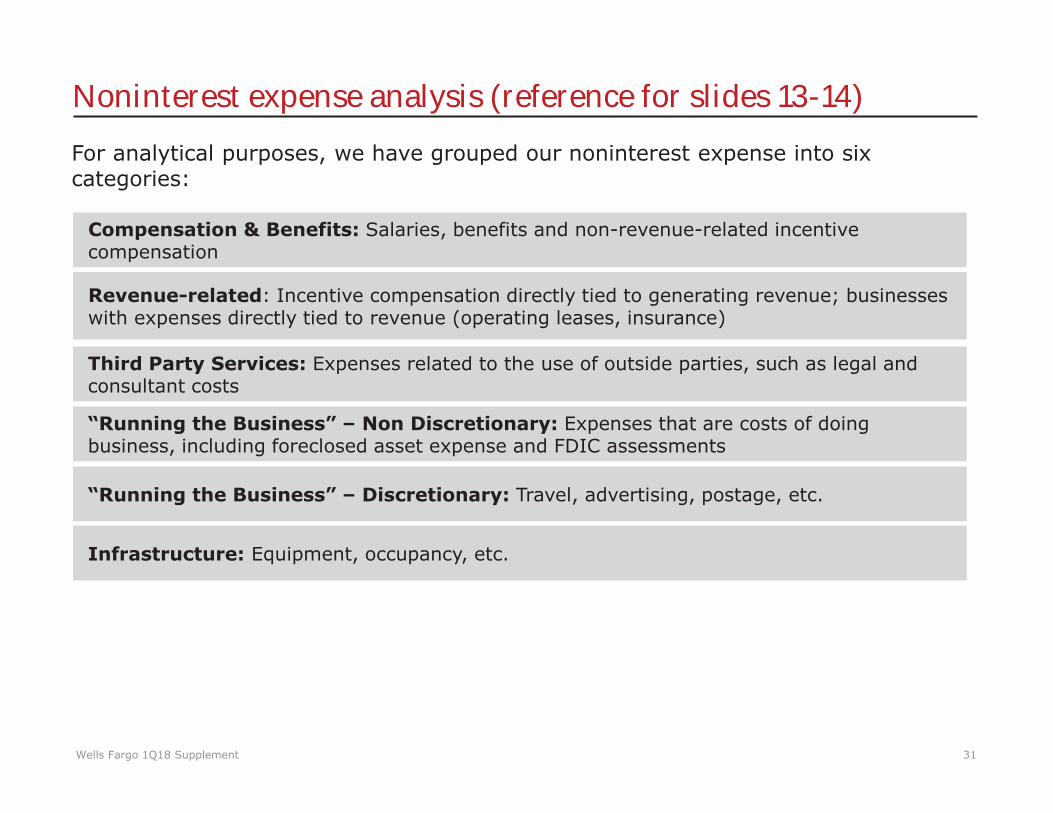
Noninterest expense analysis (reference for slides 13-14)
For analytical purposes, we have grouped our noninterest expense into six categories:
Compensation & Benefits: Salaries, benefits and non-revenue-related incentive compensation
Revenue-related: Incentive compensation directly tied to generating revenue; businesses with expenses directly tied to revenue (operating leases, insurance)
Third Party Services: Expenses related to the use of outside parties, such as legal and consultant costs
“Running the Business” – Non Discretionary: Expenses that are costs of doing business, including foreclosed asset expense and FDIC assessments
“Running the Business” – Discretionary: Travel, advertising, postage, etc.
Infrastructure: Equipment, occupancy, etc.
Wells Fargo 1Q18 Supplement 31
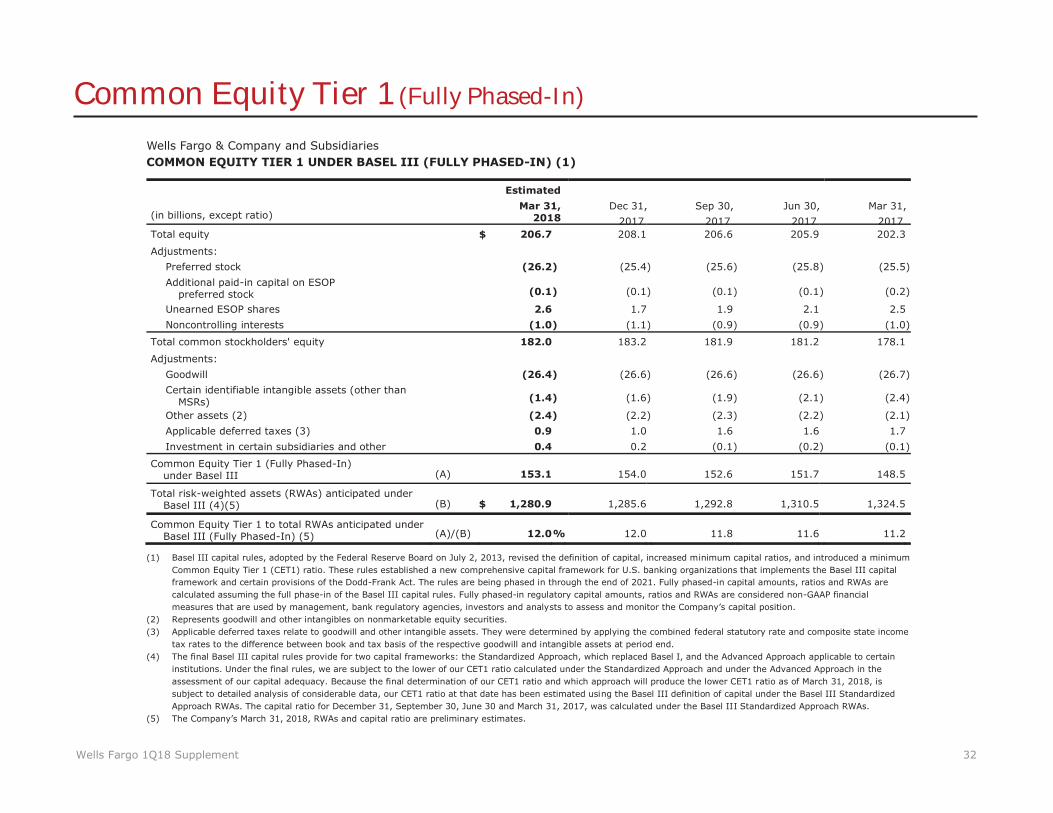
Common Equity Tier 1 (Fully Phased-In)
Wells Fargo & Company and Subsidiaries COMMON EQUITY TIER 1 UNDER BASEL III (FULLY PHASED-IN) (1)
Estimated Mar 31, Dec 31, Sep 30, Jun 30, Mar 31,
(in billions, except ratio) 2018 2017 2017 2017 2017 Total equity $ 206.7 208.1 206.6 205.9 202.3
Adjustments: Preferred stock (26.2) (25.4) (25.6) (25.8) (25.5) Additional paid-in capital on ESOP
preferred stock (0.1) (0.1) (0.1) (0.1) (0.2)
Unearned ESOP shares 2.6 1.7 1.9 2.1 2.5 Noncontrolling interests (1.0) (1.1) (0.9) (0.9) (1.0)
Total common stockholders' equity 182.0 183.2 181.9 181.2 178.1
Adjustments: Goodwill (26.4) (26.6) (26.6) (26.6) (26.7) Certain identifiable intangible assets (other than
(1.4) (1.6) (1.9) (2.1) (2.4)MSRs) Other assets (2) (2.4) (2.2) (2.3) (2.2) (2.1) Applicable deferred taxes (3) 0.9 1.0 1.6 1.6 1.7 Investment in certain subsidiaries and other 0.4 0.2 (0.1) (0.2) (0.1)
Common Equity Tier 1 (Fully Phased-In) under Basel III (A) 153.1 154.0 152.6 151.7 148.5
Total risk-weighted assets (RWAs) anticipated under Basel III (4)(5) (B) $ 1,280.9 1,285.6 1,292.8 1,310.5 1,324.5
Common Equity Tier 1 to total RWAs anticipated under Basel III (Fully Phased-In) (5) (A)/(B) 12.0% 12.0 11.8 11.6 11.2
(1) Basel III capital rules, adopted by the Federal Reserve Board on July 2, 2013, revised the definition of capital, increased minimum capital ratios, and introduced a minimum Common Equity Tier 1 (CET1) ratio. These rules established a new comprehensive capital framework for U.S. banking organizations that implements the Basel III capital framework and certain provisions of the Dodd-Frank Act. The rules are being phased in through the end of 2021. Fully phased-in capital amounts, ratios and RWAs are calculated assuming the full phase-in of the Basel III capital rules. Fully phased-in regulatory capital amounts, ratios and RWAs are considered non-GAAP financial measures that are used by management, bank regulatory agencies, investors and analysts to assess and monitor the Company’s capital position.
(2) Represents goodwill and other intangibles on nonmarketable equity securities. (3) Applicable deferred taxes relate to goodwill and other intangible assets. They were determined by applying the combined federal statutory rate and composite state income
tax rates to the difference between book and tax basis of the respective goodwill and intangible assets at period end. (4) The final Basel III capital rules provide for two capital frameworks: the Standardized Approach, which replaced Basel I, and the Advanced Approach applicable to certain
institutions. Under the final rules, we are subject to the lower of our CET1 ratio calculated under the Standardized Approach and under the Advanced Approach in the assessment of our capital adequacy. Because the final determination of our CET1 ratio and which approach will produce the lower CET1 ratio as of March 31, 2018, is subject to detailed analysis of considerable data, our CET1 ratio at that date has been estimated using the Basel III definition of capital under the Basel III Standardized Approach RWAs. The capital ratio for December 31, September 30, June 30 and March 31, 2017, was calculated under the Basel III Standardized Approach RWAs.
(5) The Company’s March 31, 2018, RWAs and capital ratio are preliminary estimates.
Wells Fargo 1Q18 Supplement 32
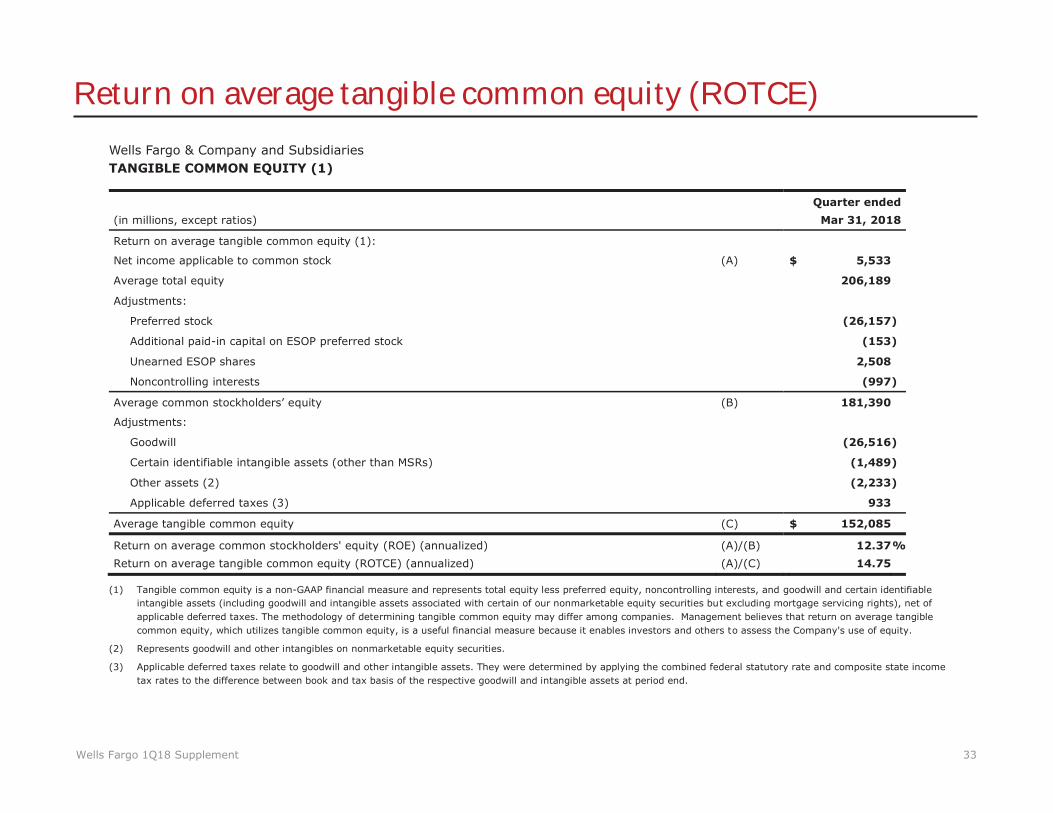
Return on average tangible common equity (ROTCE)
Wells Fargo & Company and Subsidiaries TANGIBLE COMMON EQUITY (1)
Quarter ended (in millions, except ratios) Mar 31, 2018
Return on average tangible common equity (1):
Net income applicable to common stock (A) $ 5,533
Average total equity 206,189
Adjustments:
Preferred stock (26,157)
Additional paid-in capital on ESOP preferred stock (153)
Unearned ESOP shares 2,508
Noncontrolling interests (997)
Average common stockholders’ equity (B) 181,390
Adjustments:
Goodwill (26,516)
Certain identifiable intangible assets (other than MSRs) (1,489)
Other assets (2) (2,233)
Applicable deferred taxes (3) 933
Average tangible common equity (C) $ 152,085
Return on average common stockholders' equity (ROE) (annualized) (A)/(B) 12.37% Return on average tangible common equity (ROTCE) (annualized) (A)/(C) 14.75
(1) Tangible common equity is a non-GAAP financial measure and represents total equity less preferred equity, noncontrolling interests, and goodwill and certain identifiable intangible assets (including goodwill and intangible assets associated with certain of our nonmarketable equity securities but excluding mortgage servicing rights), net of applicable deferred taxes. The methodology of determining tangible common equity may differ among companies. Management believes that return on average tangible common equity, which utilizes tangible common equity, is a useful financial measure because it enables investors and others to assess the Company's use of equity.
(2) Represents goodwill and other intangibles on nonmarketable equity securities.
(3) Applicable deferred taxes relate to goodwill and other intangible assets. They were determined by applying the combined federal statutory rate and composite state income tax rates to the difference between book and tax basis of the respective goodwill and intangible assets at period end.
Wells Fargo 1Q18 Supplement 33
Forward-looking statements and additional information
Forward-looking statements: This document contains “forward-looking statements” within the meaning of the Private Securities Litigation Reform Act of 1995. In addition, we may make forward-looking statements in our other documents filed or furnished with the SEC, and our management may make forward-looking statements orally to analysts, investors, representatives of the media and others. Forward-looking statements can be identified by words such as “anticipates,” “intends,” “plans,” “seeks,” “believes,” “estimates,” “expects,” “target,” “projects,” “outlook,” “forecast,” “will,” “may,” “could,” “should,” “can” and similar references to future periods. In particular, forward-looking statements include, but are not limited to, statements we make about: (i) the future operating or financial performance of the Company, including our outlook for future growth; (ii) our noninterest expense and efficiency ratio; (iii) future credit quality and performance, including our expectations regarding future loan losses and allowance levels; (iv) the appropriateness of the allowance for credit losses; (v) our expectations regarding net interest income and net interest margin; (vi) loan growth or the reduction or mitigation of risk in our loan portfolios; (vii) future capital or liquidity levels or targets and our estimated Common Equity Tier 1 ratio under Basel III capital standards; (viii) the performance of our mortgage business and any related exposures; (ix) the expected outcome and impact of legal, regulatory and legislative developments, as well as our expectations regarding compliance therewith; (x) future common stock dividends, common share repurchases and other uses of capital; (xi) our targeted range for return on assets and return on equity; (xii) the outcome of contingencies, such as legal proceedings; and (xiii) the Company’s plans, objectives and strategies. Forward-looking statements are not based on historical facts but instead represent our current expectations and assumptions regarding our business, the economy and other future conditions. Investors are urged to not unduly rely on forward-looking statements as actual results could differ materially from expectations. Forward-looking statements speak only as of the date made, and we do not undertake to update them to reflect changes or events that occur after that date. For more information about factors that could cause actual results to differ materially from expectations, refer to the “Forward-Looking Statements” discussion in Wells Fargo’s press release announcing our first quarter 2018 results and in our most recent Quarterly Report on Form 10-Q, as well as to Wells Fargo’s other reports filed with the Securities and Exchange Commission, including the discussion under “Risk Factors” in our Annual Report on Form 10-K for the year ended December 31, 2017.
Purchased credit-impaired loan portfolios: Loans acquired that were considered credit impaired at acquisition were written down at that date in purchase accounting to an amount estimated to be collectible and the related allowance for loan losses was not carried over to Wells Fargo’s allowance. In addition, such purchased credit-impaired loans are not classified as nonaccrual or nonperforming, and are not included in loans that were contractually 90+ days past due and still accruing. Any losses on such loans are charged against the nonaccretable difference established in purchase accounting and are not reported as charge-offs (until such difference is fully utilized). As a result of accounting for purchased loans with evidence of credit deterioration, certain ratios of Wells Fargo are not comparable to a portfolio that does not include purchased credit-impaired loans. In certain cases, the purchased credit-impaired loans may affect portfolio credit ratios and trends. Management believes that the presentation of information adjusted to exclude the purchased credit-impaired loans provides useful disclosure regarding the credit quality of the non-impaired loan portfolio. Accordingly, certain of the loan balances and credit ratios in this document have been adjusted to exclude the purchased credit-impaired loans. References in this document to impaired loans mean the purchased credit-impaired loans. Please see page 34 of the press release announcing our 1Q18 results for additional information regarding the purchased credit-impaired loans.
Wells Fargo 1Q18 Supplement 34