Embed Size (px)
Citation preview

Wells Fargo 9th Annual Pipelineand MLP Symposium
Wells Fargo 9th Annual Pipelineand MLP Symposiumand MLP Symposiumand MLP Symposium
Barry E. DavisPresident and CEO
Barry E. DavisPresident and CEO
1
President and CEOCrosstex Energy
President and CEOCrosstex Energy
Forward Looking StatementsForward Looking StatementsForward Looking StatementsForward Looking StatementsThis presentation contains forward looking statements within the meaning of the federal securities laws. Forward looking statements are not guarantees of performance. Th i l i k t i ti d ti Th f t lt f C tThey involve risks, uncertainties and assumptions. The future results of Crosstex Energy, L.P. and its affiliates (collectively known as “Crosstex”) may differ materially from those expressed in the forward‐looking statements contained throughout this presentation and in documents filed with the SEC. Many of the factors that willpresentation and in documents filed with the SEC. Many of the factors that will determine these results are beyond Crosstex’s ability to control or predict. These statements are necessarily based upon various assumptions involving judgments with respect to the future, including, among others, the ability to achieve synergies and revenue growth; national, international, regional and local economic, competitive and regulatory conditions and developments; technological developments; capital markets conditions; inflation rates; interest rates; the political and economic stability of oil odu i atio e e y a ket eathe o ditio bu i e a d e ulato y oproducing nations; energy markets; weather conditions; business and regulatory or
legal decisions; the pace of deregulation of retail natural gas and electricity; the timing and success of business development efforts; and other uncertainties. You are cautioned not to put undue reliance on any forward looking statement. Crosstex has no obligation
2
ot to put u due e ia ce o a y o wa d oo i g state e t. C osste as o ob igatioto publicly update or revise any forward looking statement, whether as a result of new information, future events or otherwise.

Strategically Positioned for Strategically Positioned for Performance and GrowthPerformance and GrowthPerformance and GrowthPerformance and GrowthWell positioned assets
Access to full midstream value chain
Strong organizational capabilities
Financially strong with access to capitalFinancially strong with access to capital
Poised to take advantage of the macro environmentg
Focused on long‐term, high‐return growth projects
3Resumption of dividends and distributions

We We SpanSpan the Value Chainthe Value Chain
id i f d
Focused Midstream CompanyFocused Midstream Company Diversity of ServicesDiversity of Services
Over 2 800 miles of natural gas gathering
We We SpanSpan the Value Chainthe Value Chain
Midstream energy services company focused
on full value chain
Assets strategically located in key producing
Over 2,800 miles of natural gas gathering
and transmission pipeline
9 natural gas processing plants
areas and market regions
Focus on Barnett and Haynesville shale plays
3 fractionators
Over 450 miles of NGL pipeline
2 4 MM barrels of NGL storage capacity2.4 MM barrels of NGL storage capacity
Transmission Lines
Natural Gas Consumers
Gathering, Dehydration & Compression NGL Transportation &
Fractionation
4Wellhead Processing , Conditioning & Treating
NGL Markets
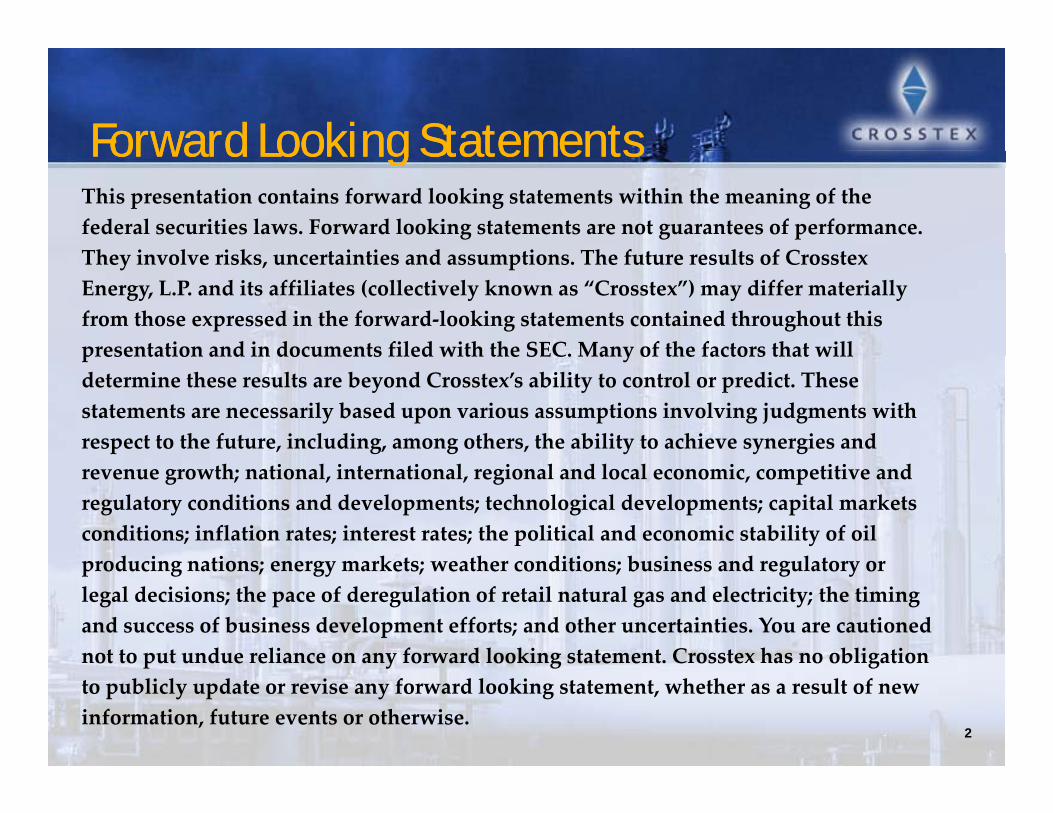
Crosstex Corporate StructureCrosstex Corporate Structure
P bli /Oth
pp
Public/OtherShareholdersPublic Unitholders
51%Crosstex Energy, Inc.Crosstex Energy, Inc.
Directors / Executive Officers
87% 13%
Crosstex Energy GP, L.P.Crosstex Energy GP, L.P.
100%2% GP Interest
gy,(NASDAQ: XTXI)
gy,(NASDAQ: XTXI)
25%GSO Crosstex
Holdings gy100% IDRs
2%Crosstex Energy, L.P.(NASDAQ: XTEX)Crosstex Energy, L.P.(NASDAQ: XTEX)
22%
Holdings
Crosstex Energy Services, L.P.
Crosstex Energy Services, L.P.
$725 MM Sr. Unsecured Notes
5
All Assets and OperationsAll Assets
and Operations
5

Strategically Positioned Assets Strategically Positioned Assets Strategically Positioned Assets Strategically Positioned Assets North Texas
~780 miles of pipeline3 processing plants3 processing plants
Processing & NGLs ~440 miles of NGL pipeline
LIG ~2,100 miles of pipeline2 processing plants
440 miles of NGL pipeline4 processing plants
2 fractionation facilities
$352010 Guidance ($MM)
$111 (50%)
$35 (16%)
6
$74 (34%)
NTX LIG PNGL

North TexasNorth Texas
7

NTX: Strategically Positioned in the NTX: Strategically Positioned in the Barnett ShaleBarnett ShaleBarnett ShaleBarnett Shale
Fossil CreekFossil Creek
Benbrook
Well Positioned Assets (current capacity) :
NTPL – 375 MMcfd
NTX Gathering Assets – 1 Bcfd +
Azle plant – 50 MMcfdNorth Texas Gathering Systems
8
Goforth plant – 30 MMcfd
Silvercreek plant – 200 MMcfd
SystemsNorth Texas Pipeline
Processing Plant

NTX: New Long Term Gathering NTX: New Long Term Gathering AgreementsAgreementsNorth Texas Expansion Project 1:
N 10 t t t N TX V l it t f t l t 50
AgreementsAgreements
New 10 yr. transport agreement on N.TX Volume commitment of at least 50
MMBtu/d
Expected capital of less than $10 million cashExpected capital of less than $10 million cash
Expected annual run‐rate cash flow of approximately $8 million
System expected in operations first quarter 2011 y p p q
North Texas Expansion Project 2:
$25 million, 15‐mile expansion project supported by volumetric commitments$ , p p j pp y
Seven‐mile low‐pressure pipeline, eight‐mile high‐pressure pipeline and
compressor station in southwest Tarrant County
Peak flow rate in 2012 expected to be more than 100 MMBtu/d
System expected in operation first quarter 2011 9

Barnett Shale Volume / Undeveloped Barnett Shale Volume / Undeveloped Location ProjectionLocation ProjectionLocation ProjectionLocation Projection
Barnett Volume Projection(PIRA 2/10 Fcst)* Approximate number of undeveloped locations remaining as of April 1, 2009
10,000
12,000
(PIRA 2/10 Fcst) pp p g p
6,000
8,000
MMCFD
17K*
22K*
2,000
4,000
M
11K*
‐
J‐90
J‐91
J‐93
J‐94
J‐96
J‐97
J‐99
J‐00
J‐02
J‐03
J‐05
J‐06
J‐08
J‐09
J‐11
J‐12
J‐14
J‐15
J‐17
J‐18
Hi h B L
10Source: Netherland, Sewell & Associates, Inc.
High Base Low

LIGLIG
11
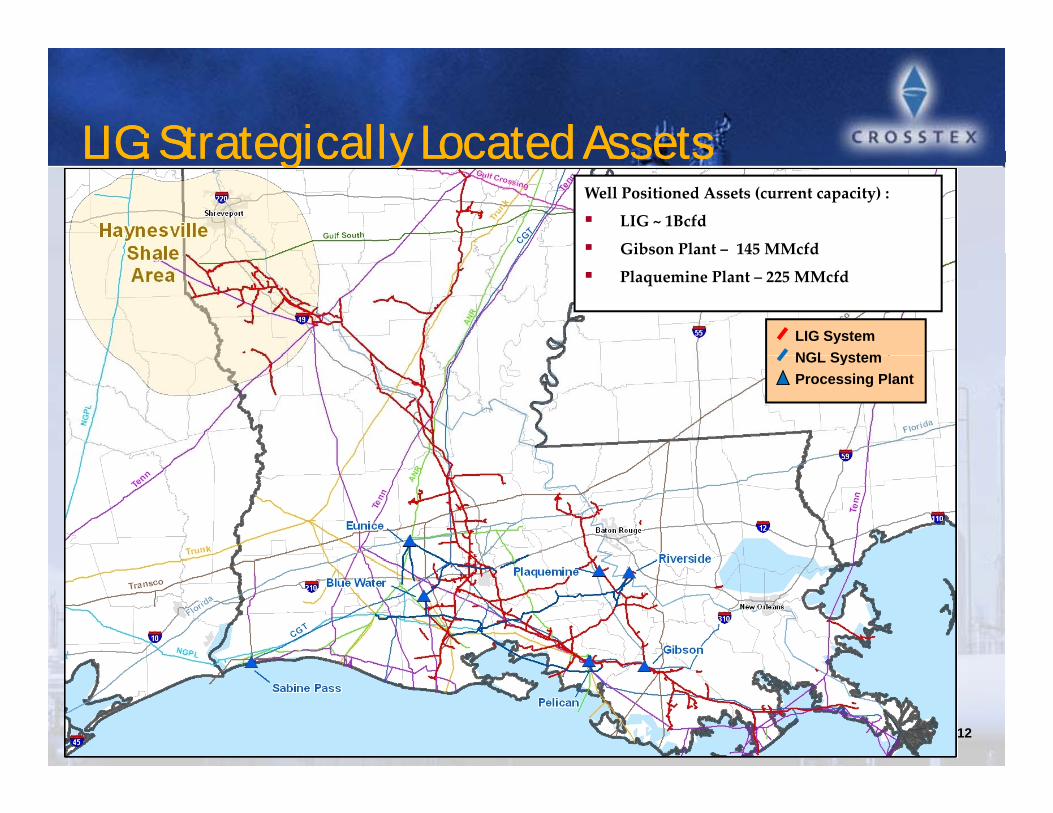
LIG: Strategically Located AssetsLIG: Strategically Located AssetsLIG: Strategically Located AssetsLIG: Strategically Located AssetsWell Positioned Assets (current capacity) :
LIG ~ 1Bcfd
Gibson Plant – 145 MMcfd
LIG System NGL System
Gibson Plant 145 MMcfd
Plaquemine Plant – 225 MMcfd
NGL System Processing Plant
12

LIG: Strong Execution LIG: Strong Execution Haynesville OpportunitiesHaynesville OpportunitiesHaynesville OpportunitiesHaynesville Opportunities
Haynesville ProjectsCapacity MMcf/d Avg. Contract
I S i T t l C t t d THaynesville Projects In Service Total Contracted Term
N. LIG Contracted Projects
Red River Project Q3 2007 240 240 5 yr
North LIG Expansion Phase I Q4 2008 35 35 10 yr
North LIG Expansion Phase II Q2 2009 100 100 10 yr
Black Lake Interconnect Phase III – Part I Q4 2009 35 35 3 yr
Red River Amine Unit (120 MMcf/d Capacity) Q4 2009 3 yr
Black Lake Interconnect Phase III – Part II Q2 2010 25 25 1.5 yrBlack Lake Interconnect Phase III Part II Q2 2010 25 25 1.5 yr
LIG Phase IV Expansion‐ Part I Q3 2010 30 30 5 yr
Total Contracted 465 465Wtd. Avg. Life
5 yearsy
13

Processing and NGL’sProcessing and NGL’s
14

PNGL: Strategically Located Assets PNGL: Strategically Located Assets PNGL: Strategically Located Assets PNGL: Strategically Located Assets
Truck and rail from Marcellus, Bakken, Eagle Ford, Permian Basin
Well Positioned Assets (current capacity) :
Eunice – 1.2 Bcf/d; 50,000 Bbls/d
15
; ,
Pelican – 600 MMcf/d
Sabine – 300 MMcf/d
Riverside ‐ 20,000 Bbls/d

PNGL: Eunice PNGL: Eunice FracFrac RestartRestartPNGL: Eunice PNGL: Eunice FracFrac RestartRestartRestarting 15,000 Bbls/d of existing 36,000 Bbls/d frac
Capex ‐ $9.3MM with op income contribution of $3.3MM annually
Economics supported by volume commitments and expense savings
Project will connect Plaquemine fractionation into our NGL system
Upside – additional capacity to bring liquids from other plays
16

Growth Opportunities Growth Opportunities
17

Shale OpportunitiesShale OpportunitiesShale OpportunitiesShale OpportunitiesShale OpportunitiesShale OpportunitiesShale OpportunitiesShale OpportunitiesKey Macro Trends:• Crude/gas ratio driving focus to wet
Montana Thrust Belt
Williston Basin
Gammon
Cody
AppalachianMichigan
Devonian (Ohio)
driving focus to wet gas/crude opportunities• Continued low gas prices could impact dry
Hilliard-Baxter Mancos
Hermosa
Mancos
Excello-
Antrim
New
AppalachianBasin
MichiganBasin
IllinoisBasin
ForestCity BasinPiceance
Basin
Unita Basin
GreaterGreenRiverBasin
Marcellus
Utica
prices could impact dry gas development •Producers sale of undivided property i te e t i etu fo
LewisPierre
Barnett
WoodfordFayetteville
Mulky Albany
Chattanooga
Conasauga
Valley andRidge Province
Black WarriorBasin
Floyd-NealTexas-
Louisiana
Arkoma Basin
Cherokee Platform
AnadarkoBasin
Ardmore Basin
Permian
Palo DuroBasin Bend
RatonBasin
San JuanBasin
MarfaBasin
Paradox Basininterest in return for drilling carry has provided near‐term growth cap ex for drilling
Barnett-Woodford
Pearsall-Eagle Ford
EagleFord
Haynesville- Bossier
Ridge ProvinceLouisiana-Mississippi Salt Basin
Ft. WorthBasinMaverickSub-Basin
Rio GrandeEmbayment
Basindrilling• Lack of NGL infrastructure (RM transport and fractionation) will be
Basins Shale Gas Plays Shallowest / Youngest Deepest / Oldest
fractionation) will be key for continued development
18Source: EIA

Growth, Focus and PrioritizationGrowth, Focus and PrioritizationGrowth, Focus and PrioritizationGrowth, Focus and PrioritizationGrowth, Focus and PrioritizationGrowth, Focus and PrioritizationGrowth, Focus and PrioritizationGrowth, Focus and Prioritization
Company’s strategic advantages include:E f ti ti ith il d b– Excess fractionation with rail and barge access
– NGL market knowledge through PNGL– Experience with large shale developmentsp g p– Regional experience (i.e., Texas and Louisiana)– Producer relationships/customer service
Targeted areas include:– Emerging shale plays focusing on wet gas/crude– NGL opportunities utilizing existing infrastructure– Large scale gathering, processing and take‐away
19

Financial OverviewFinancial Overview
20

CurrentCurrent Financial FocusFinancial FocusCurrentCurrent Financial FocusFinancial Focus
Maintaining strong liquidity position for flexibility– No near term debt maturities– Over $300 million available on revolver
Deleveraging balance sheet
Improving cash flows
Focusing on high return investmentsFocusing on high return investments
21

Conservative Financial GuidelinesConservative Financial GuidelinesConservative Financial GuidelinesConservative Financial GuidelinesFund organic growth and strategic opportunities with internal cash flows and a balanced mix of debt and equityflows and a balanced mi of debt and equity
Maintain a balanced contract mix and an active commodity price hedging program consistent with risk management guidelines
N l i h d i i i i f ki– No speculative hedging positions, no compensation for takingpositions
– Utilization of product‐specific swaps
Maintain adequate liquidity to manage business cash flow requirements, margin requirements and business risks
Maintain a conser ati e capital structure and le erage ratiosMaintain a conservative capital structure and leverage ratios– Achieve a ratio of Debt/EBITDA of 4.0x
22

Operating Income Summary & Operating Income Summary & Operating Income Mix ($ MM)Operating Income Mix ($ MM)Operating Income Mix ($ MM)Operating Income Mix ($ MM)
2008 2009 2010 (3)
$100
$120
$140 NTX G&T NTX Fee Based NTX Commodity Based
North Texas $103 $113 $111
LIG $82 $80 $74$‐
$20
$40
$60
$80
2006 2007 2008 2009 2010
PNGL (1) $12 $23 $35
Shared Services & Other ($14) ($14) ($13)$50
$60
$70
$80
$90
LIG Mktg. & Trans. LIG Fee Based LIG Commodity Based
Total Continuing Operations $183 $202 $207 ….
Discontinued Operations(2) $91 $50 $0$‐
$10
$20
$30
$40
$50
2007 2008 2009 2010
Total $274 $252 $207
(1) Includes impact of Eunice lease buy‐out in 2009 and Intracoastal acquisition‐‐ $2 MM $20
$25
$30
$35
$40
$45
PNGL Fee Based PNGL Commodity Based
impact in 2009 and $13 MM impact in 2010
(2) Includes contributions from sold assets (STX, Miss, Ala, Treating, Seminole interest,
Arkoma, and ETX)
(3) 2010 represents mid‐point of guidance 23$‐
$5
$10
$15
$20
2007 2008 2009 2010

Gross Gross Margin By Contract Type Margin By Contract Type Gross Gross Margin By Contract Type Margin By Contract Type
2008 (1) 2009 (1)
Non‐commodity based margins have increased from ~68% in 2008 to greater than 81% in 2010 (in Guidance)
2010 (Guidance)
15%
G& T Fee POL Proc Margin
13%
9%
G& T Fee POL Proc Margin
14%
5%
G& T Fee POL Proc Margin
58%
10%
17%
66%
12%
65%
16%
YTD 09/30/10
G& T Fee POL Proc Margin
11%
12%
24
63%14%
(1) Excludes Discontinued Operations

Guidance for 2010Guidance for 2010Total Year 2010
Low HighNet income $ (41) $ (10)
Guidance for 2010Guidance for 2010
Depreciation and amortization 113 113
Stock‐based compensation 6 6
LOC Fees & Interest 80 79
Taxes and other 2 2
Adjusted EBITDA $ 160 $ 190Adjusted EBITDA $ 160 $ 190
Taxes and other $ (3) $ (3)
LOC Fees & Interest $ (80) $ (79)
Maintenance capital expenditures $ (12) $ (10)
Distributable cash flow $ 62 $ 96
Growth Capital $ 35 $ 35
Key Assumptions for Forecast
Weighted Average Liquids Price ($/gallon) $ 0.80 $ 1.09
Crude ($/Bbl) $ 69.37 $ 94.52
Natural Gas ($/MMBtu) $ 6.00 $ 5.00
Natural Gas Liquids to Gas Ratio 149 9% 245 0%
25
Natural Gas Liquids to Gas Ratio 149.9% 245.0%
XTEX Distribution per Unit $ 0.30
XTXI Dividends per Share $ 0.10 25

AppendixAppendix
26

Reconciliation to Net IncomeReconciliation to Net IncomeReconciliation to Net IncomeReconciliation to Net IncomeNet Income to DCF Reconciliation: Years Ended($ in millions) December 31
2009 2008(Unaudited)( )
Net income (loss) attributable to Crosstex Energy, L.P. $ 104 $ 11 Depreciation, amortization and impairments (1) 132 163 Stock‐based compensation 9 11 Interest expense, net (2) 130 105 L ti i h t f d bt 5Loss on extinguishment of debt 5 ‐Gain on sale of property (184) (51)Taxes and other 8 6
Adjusted EBITDA 204 245 ‐ ‐
Interest (2)(3)(4) (121) (83)Cash taxes and other (5) (3) (3)Maintenance capital expenditures (11) (18)Distributable cash flow $ 68 $ 141
(1) Excludes minority interest share of depreciation and amortization of $290 and $286K for the year ended 2009 and the year ended 2008 respectively. Includes depreciation, amortization and impairments related to discontinued operations of $10.7 and $26.4 million for the year ended 2009 and the year ended 2008 respectively.
(2) Includes interest expense allocated to discontinued operations of $34.9 and $30.0 million for the year ended 2009 and the year ended 2008, respectively.
(3) Excludes $4.3 million of debt issuance cost amortization, and $5.2 million of senior secured note make‐whole and call premium paid‐in‐kind interest resulting from repayment of such notes from the proceeds of asset sales for the year ended 2009
27 27
resulting from repayment of such notes from the proceeds of asset sales, for the year ended 2009.
(4) Excludes noncash interest rate swap mark to market of ($797K) for the year ended 2009, and $22.1 million for the year ended 2008.
(5)Includes Seminole Adjustment of $39 million for the year ended 2008.