Embed Size (px)
Citation preview
Wen, CP; Matsushita, K; Coresh, J; Iseki, K; Islam, M; Katz, R;McClellan, W; Peralta, CA; Wang, H; de Zeeuw, D; Astor, BC; Gan-sevoort, RT; Levey, AS; Levin, A; Chronic Kidney Disease PrognosisConsortium, . (incd. Fletcher, (2013) Relative risks of chronic kid-ney disease for mortality and end-stage renal disease across races aresimilar. Kidney international, 86 (4). pp. 819-27. ISSN 0085-2538DOI: 10.1038/ki.2013.553
Downloaded from: http://researchonline.lshtm.ac.uk/2293418/
DOI: 10.1038/ki.2013.553
Usage Guidelines
Please refer to usage guidelines at http://researchonline.lshtm.ac.uk/policies.html or alterna-tively contact [email protected].
Available under license: http://creativecommons.org/licenses/by-nc-nd/2.5/
Table of Contents Appendix 1. Acronyms or abbreviations for studies included in the current report and their key references
linked to the Web references .................................................................................................................................. 2
Appendix 2. Data analysis overview and analytic notes for some of individual studies .................................... 4
Appendix 3. Acknowledgements and funding for collaborating cohorts ............................................................. 8
Table S1. Number of events per study for Asians, whites, and blacks. ................................................................... 12
Table S2. Characteristics of individual studies by ethnicity for Hispanics and others. ........................................... 13
Figure S1. Crude and age-standardized distribution of eGFR and albuminuria across races in general population
cohorts. Panels A (eGFR) and B (albuminuria) show crude distribution, while panels C (eGFR) and D
(albuminuria) are adjusted for age by direct standardization using US NHANES III as a reference population.
Green, black, and red bars denote the proportions of Asian, white, and black populations, respectively. .............. 14
Figure S2. Distribution of eGFR (A and C) and albuminuria (B and D) across races in high risk (A and B) and
CKD (C and D) cohorts Panels A (eGFR) and B (albuminuria) show in high risk cohorts, while panels C (eGFR)
and D (albuminuria) for CKD cohorts. Green, black, and red bars denote the proportions of Asian, white, and
black populations, respectively. ............................................................................................................................... 15
Figure S3. Absolute risk overall of all-cause mortality (A and B), cardiovascular mortality (C and D), and ESRD
(E and F) in general population cohorts. .................................................................................................................. 16
Figure S4. Association of ACR by ethnicity with all-cause mortality (A) and cardiovascular mortality (B) in
general population cohorts ....................................................................................................................................... 17
Figure S5. Association of eGFR by ethnicity with all-cause mortality (A) and cardiovascular mortality (B) in high
risk cohorts .............................................................................................................................................................. 18
Figure S6. Association of eGFR by ethnicity with all-cause mortality (A), cardiovascular mortality (B), and
ESRD (C) in CKD cohorts ...................................................................................................................................... 19
Figure S7. Association of ACR by ethnicity with all-cause mortality (A) and cardiovascular mortality (B) in high
risk cohorts .............................................................................................................................................................. 20
Figure S8. Association of ACR/PCR by ethnicity with all-cause mortality (A), cardiovascular mortality (B), and
ESRD (C) in chronic kidney disease cohorts ........................................................................................................... 21
Figure S9. Forest plot across general population studies by grouping of Asian, white, black at eGFR 45-59
category and albuminuria 30-299 category for all-cause mortality ......................................................................... 22
Figure S10. Forest plot across general population studies by grouping of Asian, white, black at eGFR 45-59
category and albuminuria 30-299 category for cardiovascular mortality ................................................................ 23
Figure S11. Forest plot across general population studies by grouping of Asian, white, black at eGFR 45-59
category and albuminuria 30-299 category for end-stage renal disease .................................................................. 24
Figure S12. Relative risk of all-cause and cardiovascular mortality according to eGFR and ACR/dipstick
categories in whites, Asian, and blacks in high risk cohorts .................................................................................... 25
Figure S13. Relative risk of all-cause and cardiovascular mortality according to eGFR and ACR/dipstick
categories in whites, Asian, and blacks in chronic kidney disease cohorts ............................................................. 26
Support Materials References .................................................................................................................................. 27
Appendix 1. Acronyms or abbreviations for studies included in the current report
and their key references linked to the Web references
1. General population cohorts
Aichi: Aichi Workers’ Cohort1
ARIC: Atherosclerosis Risk in Communities Study2
AusDiab: Australian Diabetes, Obesity, and Lifestyle Study3
Beaver Dam: Beaver Dam CKD Study4
Beijing: Beijing Cohort Study5
CHS: Cardiovascular Health Study6
CIRCS: Circulatory Risk in Communities Study7
COBRA: COBRA Study8
ESTHER: ESTHER Study9
Framingham: Framingham Heart Study10
Gubbio: Gubbio Study11
HUNT: Nord Trøndelag Health Study12
IPHS: Ibaraki Prefectural Health Study13
MESA: Multi-Ethnic Study of Atherosclerosis14
MRC Older People: MRC Study of assessment of older people15
NHANES III: Third US National Health and Nutrition Examination Survey16
Ohasama: Ohasama Study17
Okinawa83: Okinawa 83 Cohort18
Okinawa93: Okinawa 93 Cohort19
PREVEND: Prevention of Renal and Vascular End-stage Disease Study20
Rancho Bernardo: Rancho Bernardo Study21
REGARDS: Reasons for Geographic And Racial Differences in Stroke Study22
Severance: Severance Cohort Study23
Taiwan: Taiwan MJ Cohort Study24
ULSAM: Uppsala Longitudinal Study of Adult Men25
2. High-risk cohorts
ADVANCE: The Action in Diabetes and Vascular Disease: Preterax and Diamicron
Modified Release Controlled Evaluation (ADVANCE) trial26
CARE: The Cholesterol and Recurrent Events (CARE) Trial27
KEEP: Kidney Early Evaluation Program28
KPHawaii: Kaiser Permanente Hawaii Cohort29
MRFIT: Multiple Risk Factor Intervention Trial30
Pima: Pima Indian Study31
ZODIAC: Zwolle Outpatient Diabetes project Integrating Available Care32
3. CKD cohorts
AASK: African American Study of Kidney Disease and Hypertension33
BC CKD British Columbia CKD Study34
CRIB: Chronic Renal Impairment in Birmingham35
Geisinger: Geisinger CKD Study36
GLOMMS-1: GLOMMS-1: Grampian Laboratory Outcomes, Morbidity and Mortality
Studies – 137
KPNW: Kaiser Permanente Northwest38
MASTERPLAN: Multifactorial Approach and Superior Treatment Efficacy in Renal
Patients with the Aid of a Nurse Practitioner39
MDRD: Modification of Diet in Renal Disease Study40
MMKD: Mild to Moderate Kidney Disease Study41
Nephro Test: NephroTest Study42
RENAAL: Reduction of Endpoints in Non-insulin Dependent Diabetes Mellitus with
the Angiotensin II Antagonist Losartan43
Steno: Steno Type 1 Diabetes Study44
Sunnybrook: Sunnybrook Cohort45
4
Appendix 2. Data analysis overview and analytic notes for some of individual studies
Overview:
The participating studies were asked to prepare a dataset with approximately 30 variables
(follow-up time, event variable, and several predictors including age, gender, race and serum
creatinine to estimate GFR and albuminuria). To minimize heterogeneity, we circulated
guidelines for definitions of variables (e.g. hypertension, diabetes, smoking) and dataset
preparation. Analyses were restricted to subjects aged 18 years or older. We instructed studies
not to impute the two key kidney measures, eGFR (i.e., age, gender, race, and serum creatinine)
and albuminuria. For other variables in the models with missing values we imputed with the
mean value of the covariate. Individuals with practically impossible values of covariates, i.e.,
systolic blood pressure <50 or >300 mmHg or BMI <10 or >100 kg/m2 were excluded from the
analysis (<0.01 %).
For 35 of the 45 studies analysis was done at the Data Coordination Center at Johns Hopkins
University; for the remainder the standard code was run in-house at individual study centers,
with the output returned to the Data Coordinating Center. The code was written in STATA by
the Data Coordinating Center. The standard code was designed to automatically save all output
needed for the meta-analysis. The Data Coordinating Center then pooled the estimates across
studies using STATA.
Studies were instructed to standardize and calibrate their serum creatinine to their best ability and
report the method of standardization. The reported creatinine calibration allows grouping studies
into studies that reported using an IDMS traceable method or conducted some serum creatinine
calibration to IDMS traceable methods (AusDiab, Beaver Dam, Geisinger, GLOMMS-1,
Gubbio, HUNT, KEEP, KPNW, MMKD, NephroTest, NHANES III, Okinawa 83 and 93,
Rancho Bernardo, REGARDS) and studies where the creatinine standardization was not done
(AASK, ADVANCE, Aichi, ARIC, British Columbia CKD, Beijing, CARE, CHS, CIRCS,
COBRA, CRIB, ESTHER, Framingham, IPHS, KP Hawaii, MASTERPLAN, MDRD, MESA,
MRC Older People, MRFIT, Ohasama, Pima, PREVEND, RENAAL, Severance, STENO,
Sunnybrook, Taiwan, ULSAM, ZODIAC). Retrospective assessment of creatinine calibration
without direct collection of laboratory data is limited since substantial creatinine calibration
differences have been documented even within a single laboratory using the same method over
time.
The reference range of eGFR (90-104 ml/min/1.73 m2) was chosen based on the optimal level of
GFR (≥90 ml/min/1.73 m2) reported in current clinical guidelines
46, 47 and the fact that some
studies have reported higher mortality risk at high eGFR.48-50
The reference point of eGFR (95
ml/min/1.73 m2) was then arbitrarily chosen within the reference range but not in the knots (90
and 105) used to create splines.
Following the published results from individual studies, we assumed the proportional hazards
model provided the best summary of the data in each study and did not summarize statistics on
deviations from proportionality across the covariates.
5
Notes for individual studies:
1. General population cohorts
CHS: This study consists of participants only aged 65 or older and thus did not contribute to the
subgroup analysis of younger population.
COBRA: Current smokers in this study include chewable tobacco users.
ESTHER: This study only measured urine albumin excretion with the minimum detection value
of 11.3 mg/L (equivalent to ACR 17 mg/g) and thus its reference proteinuria group (≤11.3 mg/L)
was likely to contain individuals with ACR ≥10 mg/g. Therefore, this study was meta-analyzed
with the dipstick studies, translating urine albumin excretion (≤11.3, 11.4-19.9, 20-199 and ≥200
mg/L to -, ±, +, and ≥++).
Gubbio: This study consists of participants aged between 45 and 64 and thus did not contribute
to the subgroup analysis of older population.
HUNT: This study is a general-population study overall but measured urine albumin mainly in
participants with treated hypertension or diabetes. However, this study was categorized as a
general population cohort, since they measured albuminuria in a 5% random sample out of
≈65,000 participants and, thus, the relationship between kidney measures and risk was
maintained. This study has not collected use of anti-diabetic medication and use of statins (and
thus hypercholesterolemia). Most of the glucose measurements were non-fasting.
IPHS: This study categorized their dipstick data - and ± into the same group. Therefore, dipstick
data - and ± were treated as a reference group, and this study did not contribute to estimates of
dipstick ±.
MRC Older People: This study categorized their dipstick data - and ± into the same group.
Therefore, dipstick data - and ± were treated as a reference group, and this study did not
contribute to estimates of dipstick ±. This study has not collected total cholesterol. This study
consists of participants aged ≥75 years old and thus did not contribute to the subgroup analysis of
younger population.
NHANESIII: This study did not collect data on total cholesterol, hypercholesterolemia, or use of
anti-diabetic medications.
Ohasama: This study has not collected data on use of anti-diabetic medications.
Okinawa 83: This study has not collected data on fasting glucose, smoking, history of
cardiovascular disease, anti-diabetic or anti-hypertensive medications.
Okinawa 93: This study has not collected data on fasting glucose, smoking, history of
cardiovascular disease, anti-diabetic or anti-hypertensive medications.
ULSAM: This study measured urinary albumin excretion rate (µg/min), which was converted to
mg/day by multiplying 1.44. All participants aged 65 or older and thus this study did not
6
contribute to the subgroup analysis of younger population. This study consists of only men, thus
did not contribute to the subgroup analysis of women.
2. High-risk cohorts
ADVANCE: This study is an intervention study which includes participants with diabetes only.
CARE: This study is an intervention study in which all patients had a previous myocardial
infarction. This study did not include dipstick category “+++”. Due to many missing values, data
for fasting glucose and BMI were not included.
KP Hawaii: In this study for participants with only ACR, PCR was imputed by ACR * 1.5.
MRFIT: This study is an intervention study which includes men only and thus did not contribute
to the subgroup analysis of women.
Pima: This study consists entirely of Pima and the closely-related Tohono O’odham Indians.
ACR was measured in a spot urine specimen. History of cardiovascular disease was not recorded
in this study.
ZODIAC: This study includes only individuals with type 2 diabetes. This study has not collected
data on fasting glucose or hypercholesterolemia.
3. CKD cohorts
AASK: This study is an intervention study which includes African American participants only.
All participants were free of diabetes.
Geisinger: This study includes all Geisinger primary care recipients, 18 years or older as of index
date, and who have CKD, defined as two or more outpatient eGFR values < 60 by CKD-EPI
equation. Covariates obtained most closely to index date within a past year were included in
models.
GLOMMS-1: This study did not collect data on use of anti-diabetic or anti-hypertensive
medication, total cholesterol, systolic or diastolic blood pressure, or BMI. Diabetes and
hypertension status were coded based on hospital physician or general practitioner diagnosis
recorded in case notes. The ethnicity of the Grampian population is relatively homogenous with
overall 98.3% of males and 98.4% of females being white. Indians account for 0.2% of the
population, Pakistani and other South Asian individuals account for 0.3%, Chinese 0.3% and
0.8% are recorded as other.51
KPNW: This study defined diabetes using their own clinical tool that includes diagnosis codes,
treatment codes, and laboratory values. This study has not collected use of anti-diabetic
medications.
7
MASTERPLAN: This study measured ACR in patients with albuminuria in the low range, PCR
in patients with overt proteinuria. Thus, for those participants with only ACR, PCR was imputed
by ACR * 1.5.
MDRD: This study has not collected use of anti-diabetic or anti-hypertensive medications, use of
statins, or hypercholesterolemia.
MMKD: This study measured 24h proteinuria.
RENAAL: This was a randomized controlled trial to determine whether the angiotensin receptor
blocker losartan confers renoprotection in patients with type 2 diabetes and nephropathy.
Steno: Although this study has recruited type 1 diabetes mellitus patients with and without
diabetic nephropathy, only participants with ACR ≥ 30 mg/g at baseline were included in this
study as a CKD cohort. All participants had hypercholesterolemia.
8
Appendix 3. Acknowledgements and funding for collaborating cohorts
Study List of sponsors
AASK NIDDK
ADVANCE National Health and Medical Research Council of Australia program grant
571281; Servier
Aichi KAKENHI (09470112, 13470087, 17390185, 18590594, 20590641,
20790438, 22390133)
ARIC The Atherosclerosis Risk in Communities Study is carried out as a
collaborative study supported by National Heart, Lung, and Blood Institute
contracts (HHSN268201100005C, HHSN268201100006C,
HHSN268201100007C, HHSN268201100008C, HHSN268201100009C,
HHSN268201100010C, HHSN268201100011C, and
HHSN268201100012C). The authors thank the staff and participants of the
ARIC study for their important contributions.
AusDiab The Baker IDI Heart and Diabetes Institute, Melbourne, Australia, their
sponsors, and the National Health and Medical Research Council of
Australia (NHMRC grant 233200), Amgen Australia, Kidney Health
Australia and The Royal Prince Alfred Hospital, Sydney, Australia.
BC Cohort BC Provincial Renal Agency, an Agency of the Provincial Health Services
Authority in collaboration with University of British Columbia.
Beaver Dam NIH/NIDDK DK73217
NIH/NEI EY 006594
Beijing The research for this study was supported by the Program for New Century
Excellent Talents in University (BMU2009131) from the Ministry of
Education of the People’s Republic of China, and the grants for the Early
Detection and Prevention of Non-communicable Chronic Diseases from the
International Society of Nephrology Research Committee.
CARE Alberta Heritage Foundation for Medical Research/Alberta Innovates Health
Solutions Interdisciplinary Team Grants Program
CHS The research reported in this article was supported by contracts
HHSN268201200036C, N01-HC-85239, N01-HC-85079 through N01-HC-
85086, N01-HC-35129, N01 HC-15103, N01 HC-55222, N01-HC-75150,
N01-HC-45133, and grant HL080295 from the National Heart, Lung, and
Blood Institute (NHLBI), with additional contribution from the National
Institute of Neurological Disorders and Stroke (NINDS). Additional support
was provided through AG-023629, AG-15928, AG-20098, and AG-027058
from the National Institute on Aging (NIA). A full list of principal CHS
investigators and institutions can be found at http://www.chs-
nhlbi.org/pi.htm.
CIRCS N/A
COBRA Wellcome Trust, UK
CRIB British Renal Society Project Grant Award
British Heart Foundation Project Grant Award.
9
ESTHER Ministry of Research, Science and the Arts Baden-Württemberg (Stuttgart,
Germany), Federal Ministry of Education and Research (Berlin, Germany),
Federal Ministry of Family Affairs, Senior Citizens, Women and Youth
(Berlin, Germany), European Commission FP7 framework programme of
DG-Research (CHANCES Project). Measurement of urinary albumin was
funded by Dade-Behring, Marburg, Germany.
Framingham NHLBI Framingham Heart Study (N01-HC-25195).
Geisinger Geisinger Clinic
GLOMMS-1 Chief Scientist Office CZH/4/656
Gubbio Merck Sharp & Dohme – Italy; Municipal and Health Authorities of Gubbio,
Italy; Center of Preventive Medicine, Gubbio, Italy; Istituto Superiore di
Sanità, Rome, Italy; Federico II University, Naples, Italy; University of
Milan, Milan, Italy; Northwestern University, Chicago, USA; University of
Salerno, Italy.
HUNT N/A
IPHS N/A
KEEP US National Kidney Foundation
KP Hawaii N/A
KPNW Amgen
MASTERPLAN The MASTERPLAN study is a clinical trial with trial registration ISRCTN
registry: 73187232. Sources of funding: The MASTERPLAN Study was
supported by grants from the Dutch Kidney Foundation (Nierstichting
Nederland, number PV 01), and the Netherlands Heart Foundation
(Nederlandse Hartstichting, number 2003 B261). Unrestricted grants were
provided by Amgen, Genzyme, Pfizer and Sanofi-Aventis.
MDRD NIDDK UO1 DK35073 and K23 DK67303, K23 DK02904
MESA This research was supported by contracts N01-HC-95159 through N01-HC-
95169 from the National Heart, Lung, and Blood Institute. The authors
thank the other investigators, the staff, and the participants of the MESA
study for their valuable contributions. A full list of participating MESA
investigators and institutions can be found at http://www.mesa-nhlbi.org.
MMKD The MMKD study was funded by the Austrian Heart Fund and by the
Innsbruck Medical University.
MRC Older
People
UK Medical Research Council, Department of Health for England, Wales
and the Scottish Office and Kidney Research UK
MRFIT The Multiple Risk Factor Intervention Trial was contracted by the National
Heart, Lung, and Blood Institute (NHLBI), National Institutes of Health
(NIH), Bethesda, Md. Follow-up after the end of the trial was supported
with NIH/NHLBI grants R01-HL-43232 and R01-HL-68140. The principal
investigators and senior staff of the clinical centers, coordinating center,
other support centers and key committees are listed in a previous report
(JAMA 1982; 248: 1465-1477).
10
NHANES III United States Center for Disease Control
NephroTest The NephroTest CKD cohort study is supported by grants from: Inserm GIS-
IReSP AO 8113LS TGIR; French Ministry of Health AOM 09114 and AOM
10245; Inserm AO 8022LS; Agence de la Biomédecine R0 8156LL, AURA,
and Roche 2009-152-447G. The Nephrotest initiative was also sponsored by
unrestricted grants from F.Hoffman-La Roche Ltd.
The authors thank the collaborators and the staff of the NephroTest Study:
Gauci C, Karras A, Maruani G, Daugas E, d'Auzac C, Jacquot C, Thervet E,
Roland M, Letavernier E, Boffa JJ, Ronco P, Fessi H, du Halgouet C,
Vrtovsnik F, Urena P.
Ohasama Grant-in-Aid(H20-22Junkankitou[Seishuu]-Ippan-009, 013 and H23-
Junkankitou [Senshuu]-Ippan-005) from the Ministry of Health, Labor and
Welfare, Health and Labor Sciences Research Grants, Japan; Japan
Atherosclerosis Prevention Fund.
OKINAWA 83 N/A
OKINAWA 93 N/A
Pima This work was supported by the Intramural Research Program of the
National Institute of Diabetes and Digestive and Kidney Diseases
PREVEND The PREVEND study is supported by several grants from the Dutch Kidney
Foundation, and grants from the Dutch Heart Foundation, the Dutch
Government (NWO), the US National Institutes of Health (NIH) and the
University Medical Center Groningen, The Netherlands (UMCG). Dade
Behring, Marburg, Germany supplied equipment and reagents for
nephelometric measurement of urinary albumin.
Rancho
Bernardo
NIA AG07181 and AG028507 NIDDK DK31801
REGARDS This research project is supported by a cooperative agreement U01
NS041588 from the National Institute of Neurological Disorders and Stroke,
National Institutes of Health, Department of Health and Human Service. The
content is solely the responsibility of the authors and does not necessarily
represent the official views of the National Institute of Neurological
Disorders and Stroke or the National Institutes of Health. Representatives of
the funding agency have been involved in the review of the manuscript but
not directly involved in the collection, management, analysis or
interpretation of the data. The authors thank the other investigators, the staff,
and the participants of the REGARDS study for their valuable
contributions. A full list of participating REGARDS investigators and
institutions can be found at http://www.regardsstudy.org
Additional funding was provided by an investigator-initiated grant-in-aid
from Amgen. Representatives from Amgen did not have any role in the
design and conduct of the study, the collection, management, analysis, and
interpretation of the data, or the preparation or approval of the manuscript.
RENAAL The RENAAL trial was supported by Merck and Company.
11
Severance Seoul city R&BD program (10526), Korea, The National R&D Program for
Cancer Control, Ministry for Health, Welfare and Family affairs, Republic
of Korea (1220180), and The National Research Foundation of Korea(NRF)
grant funded by the Korea government(MEST) (2011-0029348).
STENO N/A
Taiwan This study was supported by Taiwan Department of Health Clinical Trial
and Research Centre of Excellence (DOH 101-TD-B-111-004)
ULSAM The Swedish Research Council (2006-6555), the Swedish Heart-Lung
Foundation, Dalarna University, and Uppsala University.
ZODIAC N/A
12
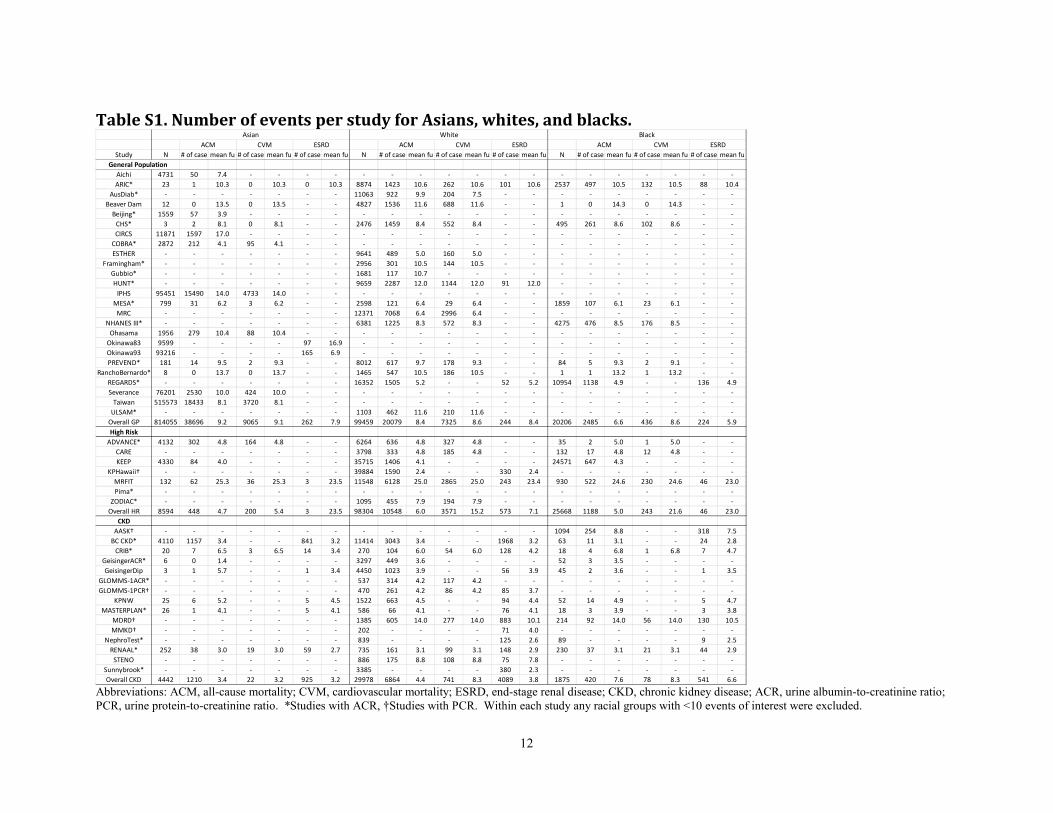
Table S1. Number of events per study for Asians, whites, and blacks.
Abbreviations: ACM, all-cause mortality; CVM, cardiovascular mortality; ESRD, end-stage renal disease; CKD, chronic kidney disease; ACR, urine albumin-to-creatinine ratio;
PCR, urine protein-to-creatinine ratio. *Studies with ACR, †Studies with PCR. Within each study any racial groups with <10 events of interest were excluded.
Study N # of case mean fu # of case mean fu # of case mean fu N # of case mean fu # of case mean fu # of case mean fu N # of case mean fu # of case mean fu # of case mean fu
Aichi 4731 50 7.4 - - - - - - - - - - - - - - - - - -
ARIC* 23 1 10.3 0 10.3 0 10.3 8874 1423 10.6 262 10.6 101 10.6 2537 497 10.5 132 10.5 88 10.4
AusDiab* - - - - - - - 11063 922 9.9 204 7.5 - - - - - - - - -
Beaver Dam 12 0 13.5 0 13.5 - - 4827 1536 11.6 688 11.6 - - 1 0 14.3 0 14.3 - -
Beijing* 1559 57 3.9 - - - - - - - - - - - - - - - - - -
CHS* 3 2 8.1 0 8.1 - - 2476 1459 8.4 552 8.4 - - 495 261 8.6 102 8.6 - -
CIRCS 11871 1597 17.0 - - - - - - - - - - - - - - - - - -
COBRA* 2872 212 4.1 95 4.1 - - - - - - - - - - - - - - - -
ESTHER - - - - - - - 9641 489 5.0 160 5.0 - - - - - - - - -
Framingham* - - - - - - - 2956 301 10.5 144 10.5 - - - - - - - - -
Gubbio* - - - - - - - 1681 117 10.7 - - - - - - - - - - -
HUNT* - - - - - - - 9659 2287 12.0 1144 12.0 91 12.0 - - - - - - -
IPHS 95451 15490 14.0 4733 14.0 - - - - - - - - - - - - - - - -
MESA* 799 31 6.2 3 6.2 - - 2598 121 6.4 29 6.4 - - 1859 107 6.1 23 6.1 - -
MRC - - - - - - - 12371 7068 6.4 2996 6.4 - - - - - - - - -
NHANES III* - - - - - - - 6381 1225 8.3 572 8.3 - - 4275 476 8.5 176 8.5 - -
Ohasama 1956 279 10.4 88 10.4 - - - - - - - - - - - - - - - -
Okinawa83 9599 - - - - 97 16.9 - - - - - - - - - - - - - -
Okinawa93 93216 - - - - 165 6.9 - - - - - - - - - - - - - -
PREVEND* 181 14 9.5 2 9.3 - - 8012 617 9.7 178 9.3 - - 84 5 9.3 2 9.1 - -
RanchoBernardo* 8 0 13.7 0 13.7 - - 1465 547 10.5 186 10.5 - - 1 1 13.2 1 13.2 - -
REGARDS* - - - - - - - 16352 1505 5.2 - - 52 5.2 10954 1138 4.9 - - 136 4.9
Severance 76201 2530 10.0 424 10.0 - - - - - - - - - - - - - - - -
Taiwan 515573 18433 8.1 3720 8.1 - - - - - - - - - - - - - - - -
ULSAM* - - - - - - - 1103 462 11.6 210 11.6 - - - - - - - - -
Overall GP 814055 38696 9.2 9065 9.1 262 7.9 99459 20079 8.4 7325 8.6 244 8.4 20206 2485 6.6 436 8.6 224 5.9
High Risk
ADVANCE* 4132 302 4.8 164 4.8 - - 6264 636 4.8 327 4.8 - - 35 2 5.0 1 5.0 - -
CARE - - - - - - - 3798 333 4.8 185 4.8 - - 132 17 4.8 12 4.8 - -
KEEP 4330 84 4.0 - - - - 35715 1406 4.1 - - - - 24571 647 4.3 - - - -
KPHawaii† - - - - - - - 39884 1590 2.4 - - 330 2.4 - - - - - - -
MRFIT 132 62 25.3 36 25.3 3 23.5 11548 6128 25.0 2865 25.0 243 23.4 930 522 24.6 230 24.6 46 23.0
Pima* - - - - - - - - - - - - - - - - - - - - -
ZODIAC* - - - - - - - 1095 455 7.9 194 7.9 - - - - - - - - -
Overall HR 8594 448 4.7 200 5.4 3 23.5 98304 10548 6.0 3571 15.2 573 7.1 25668 1188 5.0 243 21.6 46 23.0
CKD
AASK† - - - - - - - - - - - - - - 1094 254 8.8 - - 318 7.5
BC CKD* 4110 1157 3.4 - - 841 3.2 11414 3043 3.4 - - 1968 3.2 63 11 3.1 - - 24 2.8
CRIB* 20 7 6.5 3 6.5 14 3.4 270 104 6.0 54 6.0 128 4.2 18 4 6.8 1 6.8 7 4.7
GeisingerACR* 6 0 1.4 - - - - 3297 449 3.6 - - - - 52 3 3.5 - - - -
GeisingerDip 3 1 5.7 - - 1 3.4 4450 1023 3.9 - - 56 3.9 45 2 3.6 - - 1 3.5
GLOMMS-1ACR* - - - - - - - 537 314 4.2 117 4.2 - - - - - - - - -
GLOMMS-1PCR† - - - - - - - 470 261 4.2 86 4.2 85 3.7 - - - - - - -
KPNW 25 6 5.2 - - 5 4.5 1522 663 4.5 - - 94 4.4 52 14 4.9 - - 5 4.7
MASTERPLAN* 26 1 4.1 - - 5 4.1 586 66 4.1 - - 76 4.1 18 3 3.9 - - 3 3.8
MDRD† - - - - - - - 1385 605 14.0 277 14.0 883 10.1 214 92 14.0 56 14.0 130 10.5
MMKD† - - - - - - - 202 - - - - 71 4.0 - - - - - - -
NephroTest* - - - - - - - 839 - - - - 125 2.6 89 - - - - 9 2.5
RENAAL* 252 38 3.0 19 3.0 59 2.7 735 161 3.1 99 3.1 148 2.9 230 37 3.1 21 3.1 44 2.9
STENO - - - - - - - 886 175 8.8 108 8.8 75 7.8 - - - - - - -
Sunnybrook* - - - - - - - 3385 - - - - 380 2.3 - - - - - - -
Overall CKD 4442 1210 3.4 22 3.2 925 3.2 29978 6864 4.4 741 8.3 4089 3.8 1875 420 7.6 78 8.3 541 6.6
General Population
CVM ESRD
Asian White Black
ACM CVM ESRD ACM CVM ESRD ACM
13
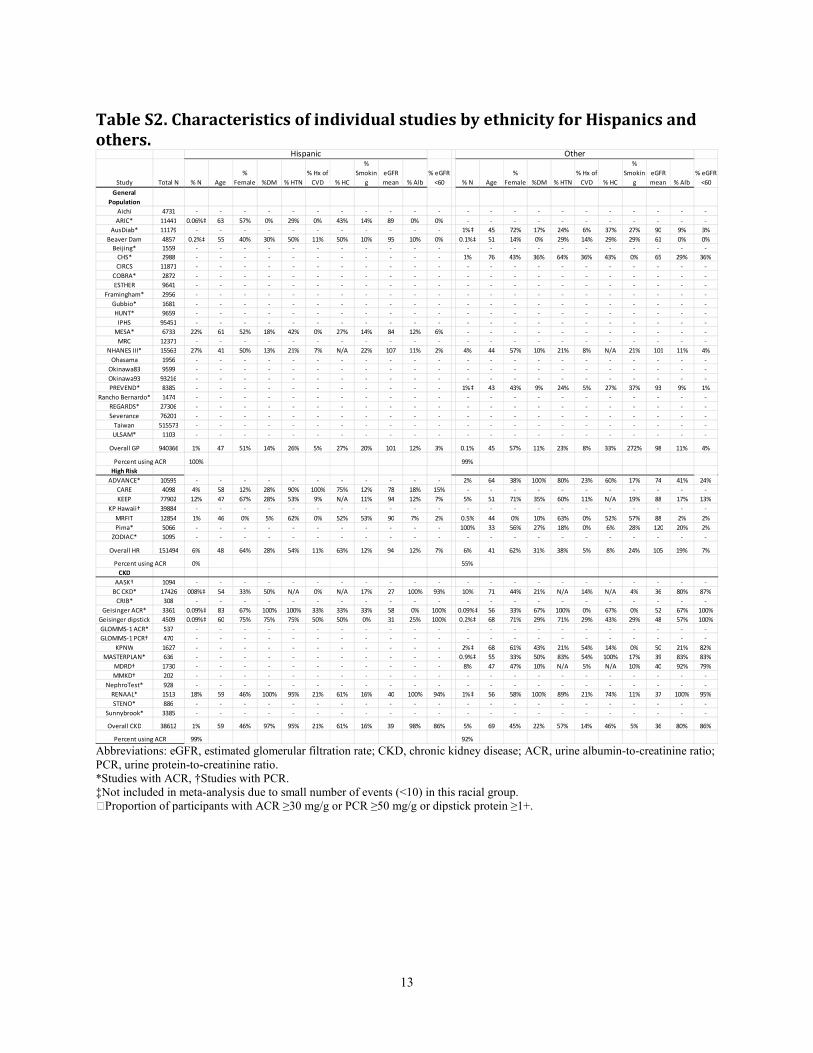
Table S2. Characteristics of individual studies by ethnicity for Hispanics and
others.
Abbreviations: eGFR, estimated glomerular filtration rate; CKD, chronic kidney disease; ACR, urine albumin-to-creatinine ratio;
PCR, urine protein-to-creatinine ratio.
*Studies with ACR, †Studies with PCR.
‡Not included in meta-analysis due to small number of events (<10) in this racial group.
ɑProportion of participants with ACR ≥30 mg/g or PCR ≥50 mg/g or dipstick protein ≥1+.
Study Total N % N Age
%
Female %DM % HTN
% Hx of
CVD % HC
%
Smokin
g
eGFR
mean % Alb
% eGFR
<60 % N Age
%
Female %DM % HTN
% Hx of
CVD % HC
%
Smokin
g
eGFR
mean % Alb
% eGFR
<60
General
Population
Aichi 4731 - - - - - - - - - - - - - - - - - - - - - -
ARIC* 11441 0.06%‡ 63 57% 0% 29% 0% 43% 14% 89 0% 0% - - - - - - - - - - -
AusDiab* 11179 - - - - - - - - - - - 1%‡ 45 72% 17% 24% 6% 37% 27% 90 9% 3%
Beaver Dam 4857 0.2%‡ 55 40% 30% 50% 11% 50% 10% 95 10% 0% 0.1%‡ 51 14% 0% 29% 14% 29% 29% 61 0% 0%
Beijing* 1559 - - - - - - - - - - - - - - - - - - - - - -
CHS* 2988 - - - - - - - - - - - 1% 76 43% 36% 64% 36% 43% 0% 65 29% 36%
CIRCS 11871 - - - - - - - - - - - - - - - - - - - - - -
COBRA* 2872 - - - - - - - - - - - - - - - - - - - - - -
ESTHER 9641 - - - - - - - - - - - - - - - - - - - - - -
Framingham* 2956 - - - - - - - - - - - - - - - - - - - - - -
Gubbio* 1681 - - - - - - - - - - - - - - - - - - - - - -
HUNT* 9659 - - - - - - - - - - - - - - - - - - - - - -
IPHS 95451 - - - - - - - - - - - - - - - - - - - - - -
MESA* 6733 22% 61 52% 18% 42% 0% 27% 14% 84 12% 6% - - - - - - - - - - -
MRC 12371 - - - - - - - - - - - - - - - - - - - - - -
NHANES III* 15563 27% 41 50% 13% 21% 7% N/A 22% 107 11% 2% 4% 44 57% 10% 21% 8% N/A 21% 101 11% 4%
Ohasama 1956 - - - - - - - - - - - - - - - - - - - - - -
Okinawa83 9599 - - - - - - - - - - - - - - - - - - - - - -
Okinawa93 93216 - - - - - - - - - - - - - - - - - - - - - -
PREVEND* 8385 - - - - - - - - - - - 1%‡ 43 43% 9% 24% 5% 27% 37% 93 9% 1%
Rancho Bernardo* 1474 - - - - - - - - - - - - - - - - - - - - - -
REGARDS* 27306 - - - - - - - - - - - - - - - - - - - - - -
Severance 76201 - - - - - - - - - - - - - - - - - - - - - -
Taiwan 515573 - - - - - - - - - - - - - - - - - - - - - -
ULSAM* 1103 - - - - - - - - - - - - - - - - - - - - - -
Overall GP 940366 1% 47 51% 14% 26% 5% 27% 20% 101 12% 3% 0.1% 45 57% 11% 23% 8% 33% 272% 98 11% 4%
100% 99%
High Risk
ADVANCE* 10595 - - - - - - - - - - - 2% 64 38% 100% 80% 23% 60% 17% 74 41% 24%
CARE 4098 4% 58 12% 28% 90% 100% 75% 12% 78 18% 15% - - - - - - - - - - -
KEEP 77902 12% 47 67% 28% 53% 9% N/A 11% 94 12% 7% 5% 51 71% 35% 60% 11% N/A 19% 88 17% 13%
KP Hawaii† 39884 - - - - - - - - - - - - - - - - - - - - - -
MRFIT 12854 1% 46 0% 5% 62% 0% 52% 53% 90 7% 2% 0.5% 44 0% 10% 63% 0% 52% 57% 88 2% 2%
Pima* 5066 - - - - - - - - - - - 100% 33 56% 27% 18% 0% 6% 28% 120 20% 2%
ZODIAC* 1095 - - - - - - - - - - - - - - - - - - - - - -
Overall HR 151494 6% 48 64% 28% 54% 11% 63% 12% 94 12% 7% 6% 41 62% 31% 38% 5% 8% 24% 105 19% 7%
0% 55%
CKD
AASK† 1094 - - - - - - - - - - - - - - - - - - - - - -
BC CKD* 17426 008%‡ 54 33% 50% N/A 0% N/A 17% 27 100% 93% 10% 71 44% 21% N/A 14% N/A 4% 36 80% 87%
CRIB* 308 - - - - - - - - - - - - - - - - - - - - - -
Geisinger ACR* 3361 0.09%‡ 83 67% 100% 100% 33% 33% 33% 58 0% 100% 0.09%‡ 56 33% 67% 100% 0% 67% 0% 52 67% 100%
Geisinger dipstick 4509 0.09%‡ 60 75% 75% 75% 50% 50% 0% 31 25% 100% 0.2%‡ 68 71% 29% 71% 29% 43% 29% 48 57% 100%
GLOMMS-1 ACR* 537 - - - - - - - - - - - - - - - - - - - - - -
GLOMMS-1 PCR† 470 - - - - - - - - - - - - - - - - - - - - - -
KPNW 1627 - - - - - - - - - - - 2%‡ 68 61% 43% 21% 54% 14% 0% 50 21% 82%
MASTERPLAN* 636 - - - - - - - - - - - 0.9%‡ 55 33% 50% 83% 54% 100% 17% 39 83% 83%
MDRD† 1730 - - - - - - - - - - - 8% 47 47% 10% N/A 5% N/A 10% 40 92% 79%
MMKD† 202 - - - - - - - - - - - - - - - - - - - - - -
NephroTest* 928 - - - - - - - - - - - - - - - - - - - - - -
RENAAL* 1513 18% 59 46% 100% 95% 21% 61% 16% 40 100% 94% 1%‡ 56 58% 100% 89% 21% 74% 11% 37 100% 95%
STENO* 886 - - - - - - - - - - - - - - - - - - - - - -
Sunnybrook* 3385 - - - - - - - - - - - - - - - - - - - - - -
Overall CKD 38612 1% 59 46% 97% 95% 21% 61% 16% 39 98% 86% 5% 69 45% 22% 57% 14% 46% 5% 36 80% 86%
99% 92%Percent using ACR
Percent using ACR
Percent using ACR
OtherHispanic
14
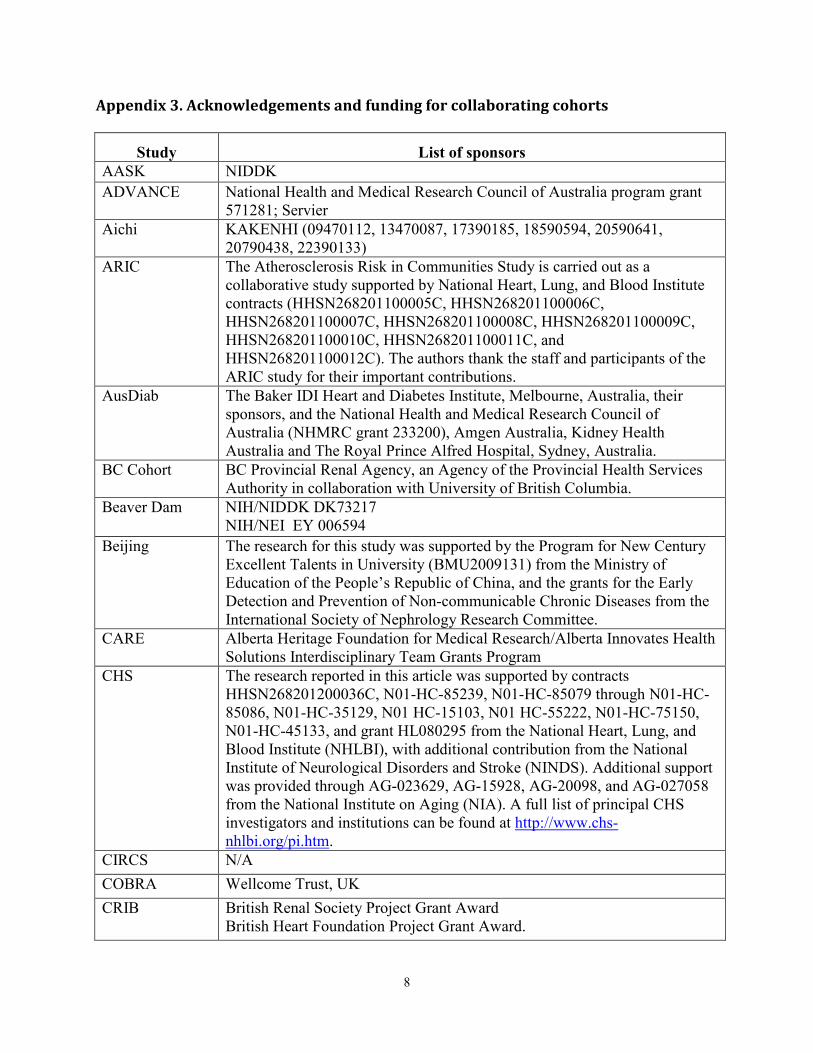
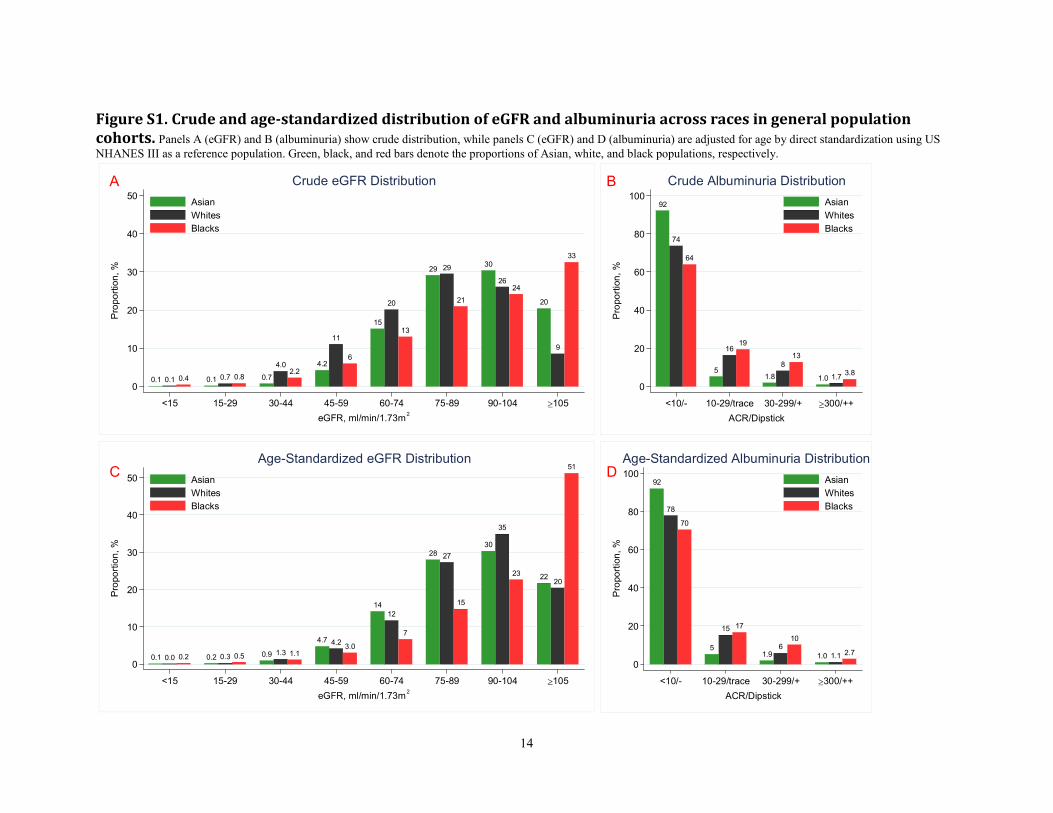
Figure S1. Crude and age-standardized distribution of eGFR and albuminuria across races in general population
cohorts. Panels A (eGFR) and B (albuminuria) show crude distribution, while panels C (eGFR) and D (albuminuria) are adjusted for age by direct standardization using US
NHANES III as a reference population. Green, black, and red bars denote the proportions of Asian, white, and black populations, respectively.
20
9
3330
2624
29 29
21
15
20
13
4.2
11
6
0.7
4.02.2
0.1 0.7 0.80.1 0.1 0.4
0
10
20
30
40
50
Proportion, %
<15 15-29 30-44 45-59 60-74 75-89 90-104 ≥105
eGFR, ml/min/1.73m2
Asian
Whites
Blacks
Crude eGFR Distribution
92
74
64
5
1619
1.8
8
13
1.0 1.73.8
0
20
40
60
80
100
Proportion, %
<10/- 10-29/trace 30-299/+ ≥300/++
ACR/Dipstick
Asian
Whites
Blacks
Crude Albuminuria Distribution
20
35
27
12
4.2
1.30.30.0
51
23
15
7
3.01.10.50.2
22
3028
14
4.7
0.90.20.10
10
20
30
40
50
Proportion, %
<15 15-29 30-44 45-59 60-74 75-89 90-104 ≥105
eGFR, ml/min/1.73m2
Asian
Whites
Blacks
Age-Standardized eGFR Distribution
78
15
6
1.1
70
17
10
2.7
92
51.9 1.0
0
20
40
60
80
100
Proportion, %
<10/- 10-29/trace 30-299/+ ≥300/++
ACR/Dipstick
Asian
Whites
Blacks
Age-Standardized Albuminuria Distribution
A B
C D
15
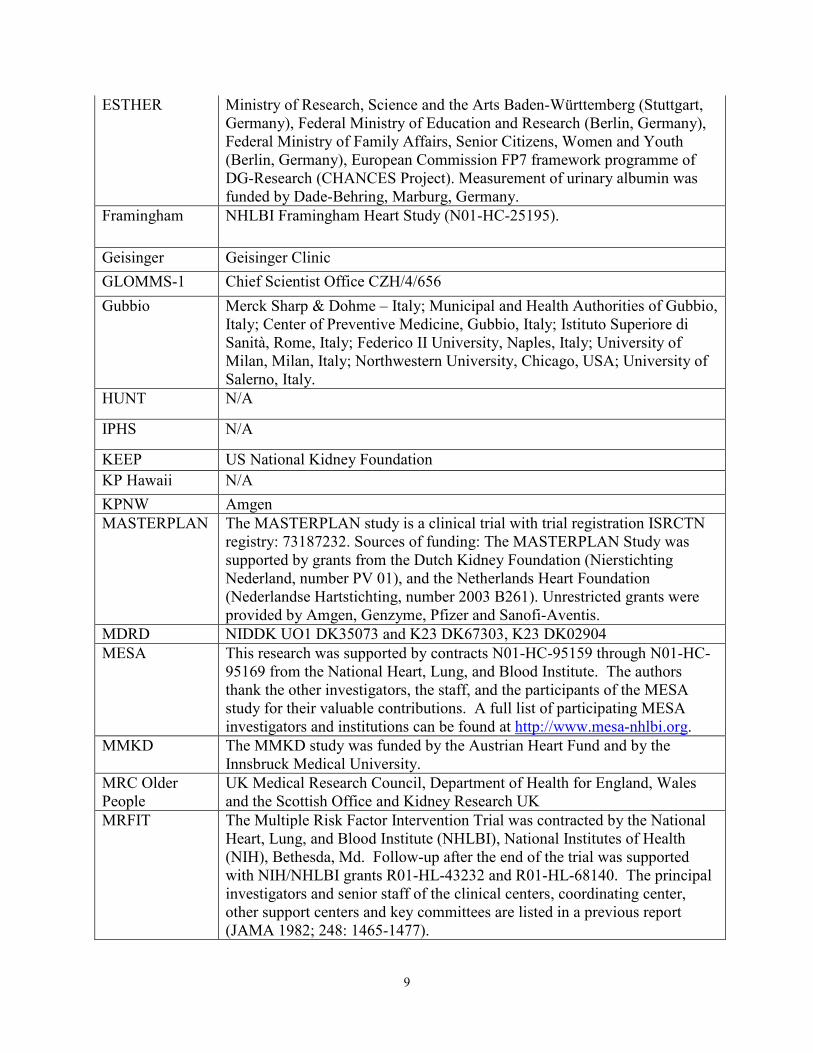
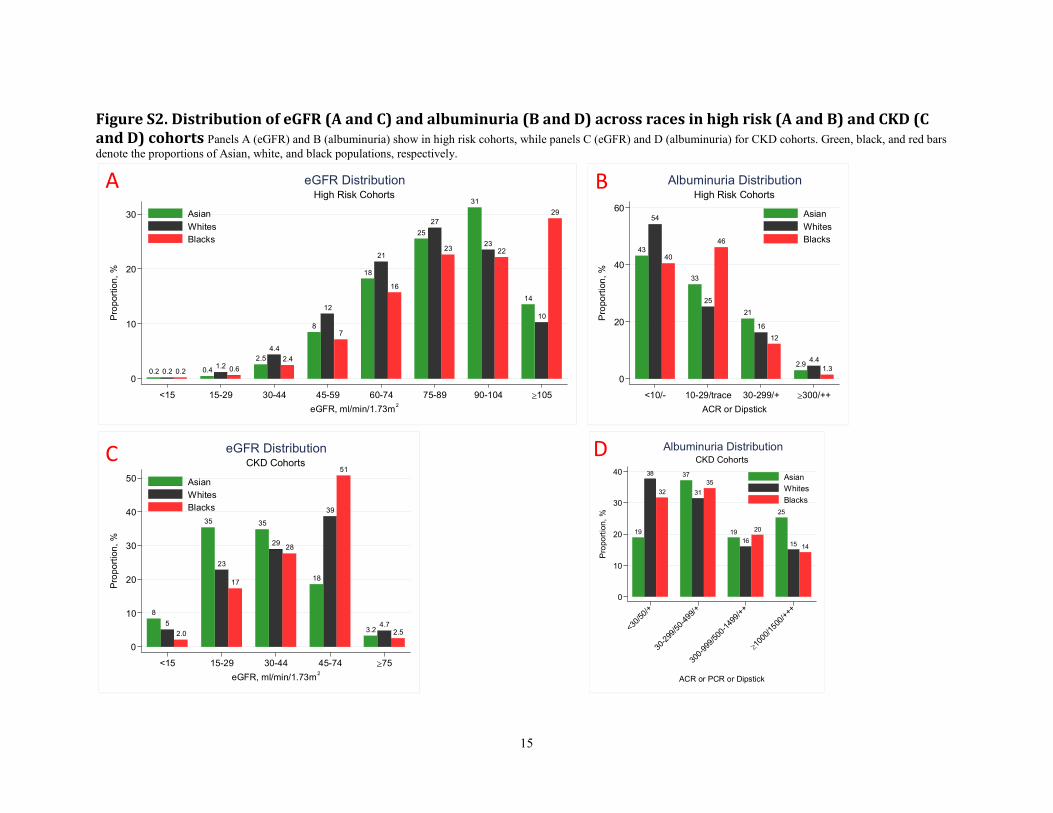
Figure S2. Distribution of eGFR (A and C) and albuminuria (B and D) across races in high risk (A and B) and CKD (C
and D) cohorts Panels A (eGFR) and B (albuminuria) show in high risk cohorts, while panels C (eGFR) and D (albuminuria) for CKD cohorts. Green, black, and red bars
denote the proportions of Asian, white, and black populations, respectively.
14
10
29
31
2322
25
27
23
18
21
16
8
12
7
2.5
4.4
2.4
0.41.2 0.60.2 0.2 0.2
0
10
20
30
Proportion, %
<15 15-29 30-44 45-59 60-74 75-89 90-104 ≥105
eGFR, ml/min/1.73m2
Asian
Whites
Blacks
High Risk Cohorts
eGFR Distribution
43
54
40
33
25
46
21
16
12
2.94.4
1.3
0
20
40
60
Proportion, %
<10/- 10-29/trace 30-299/+ ≥300/++
ACR or Dipstick
Asian
Whites
Blacks
High Risk Cohorts
Albuminuria Distribution
3.24.7
2.5
18
39
51
35
2928
35
23
17
8
5
2.0
0
10
20
30
40
50
Proportion, %
<15 15-29 30-44 45-74 ≥75
eGFR, ml/min/1.73m2
Asian
Whites
Blacks
CKD Cohorts
eGFR Distribution
19
38
32
37
31
35
19
16
20
25
15 14
0
10
20
30
40
Proportion, %
<30/
50/+
30-2
99/5
0-49
9/+
300-
999/
500-
1499
/++
≥10
00/1
500/
+++
ACR or PCR or Dipstick
Asian
Whites
Blacks
CKD Cohorts
Albuminuria Distribution
A B
C D
16
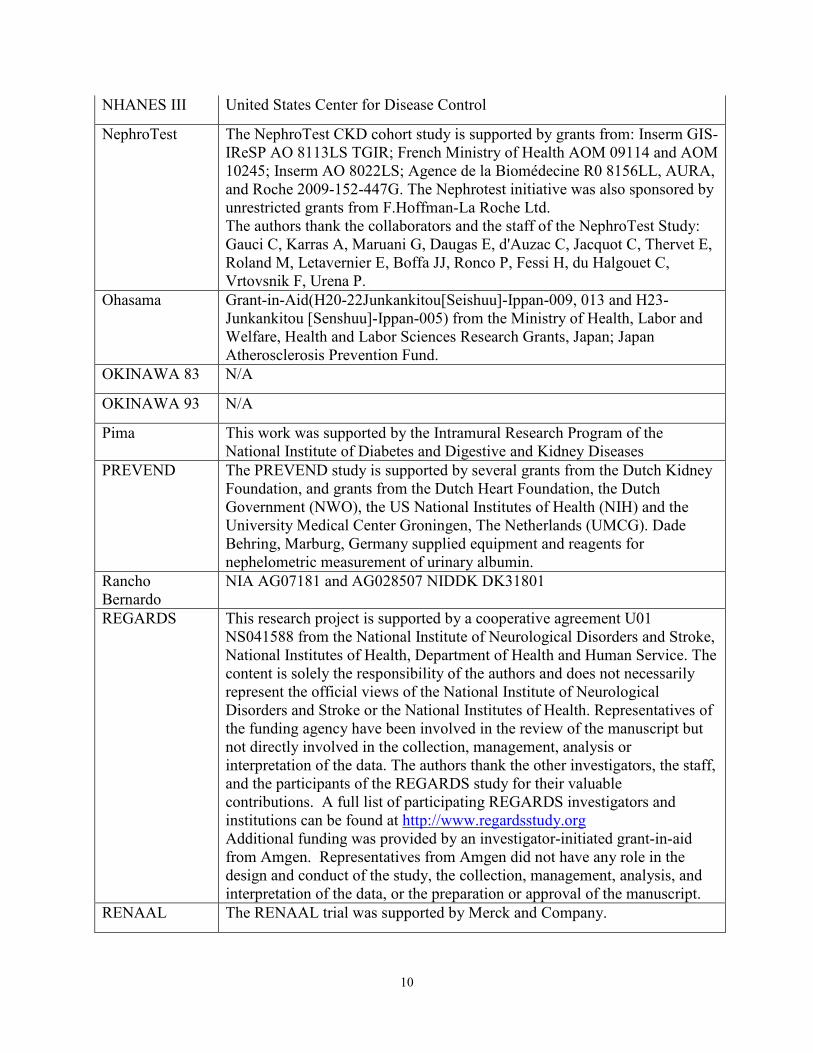
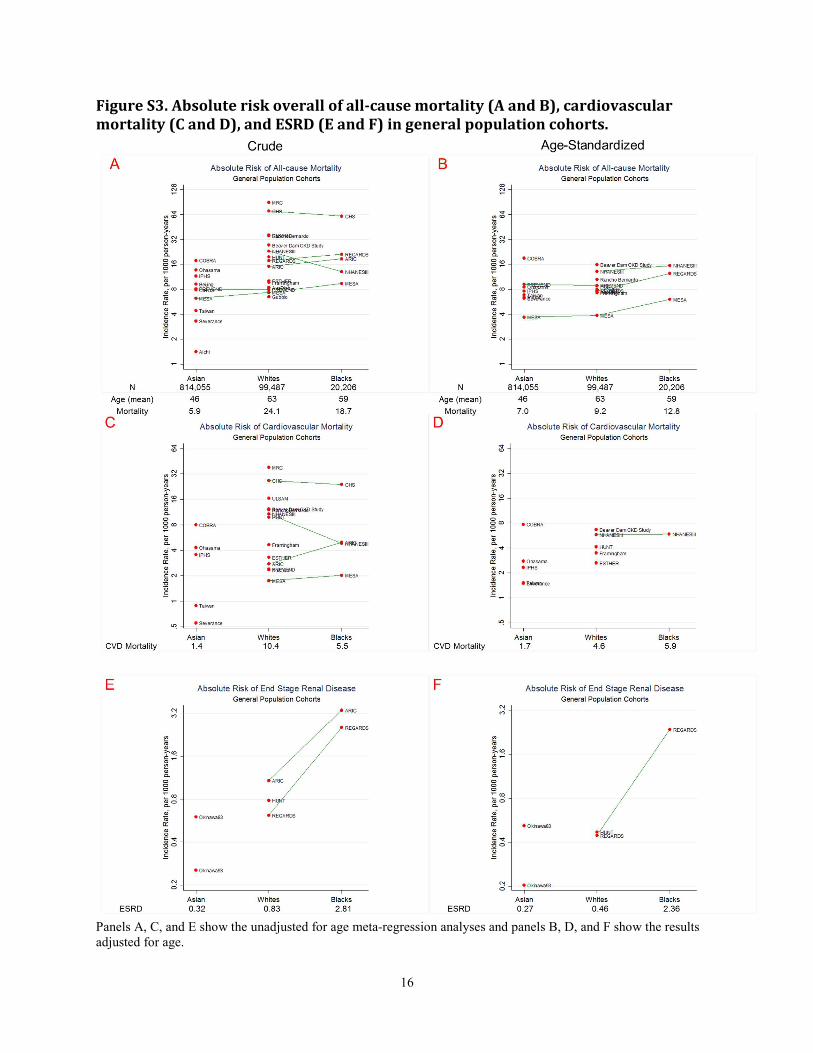
Figure S3. Absolute risk overall of all-cause mortality (A and B), cardiovascular
mortality (C and D), and ESRD (E and F) in general population cohorts.
Panels A, C, and E show the unadjusted for age meta-regression analyses and panels B, D, and F show the results
adjusted for age.
17
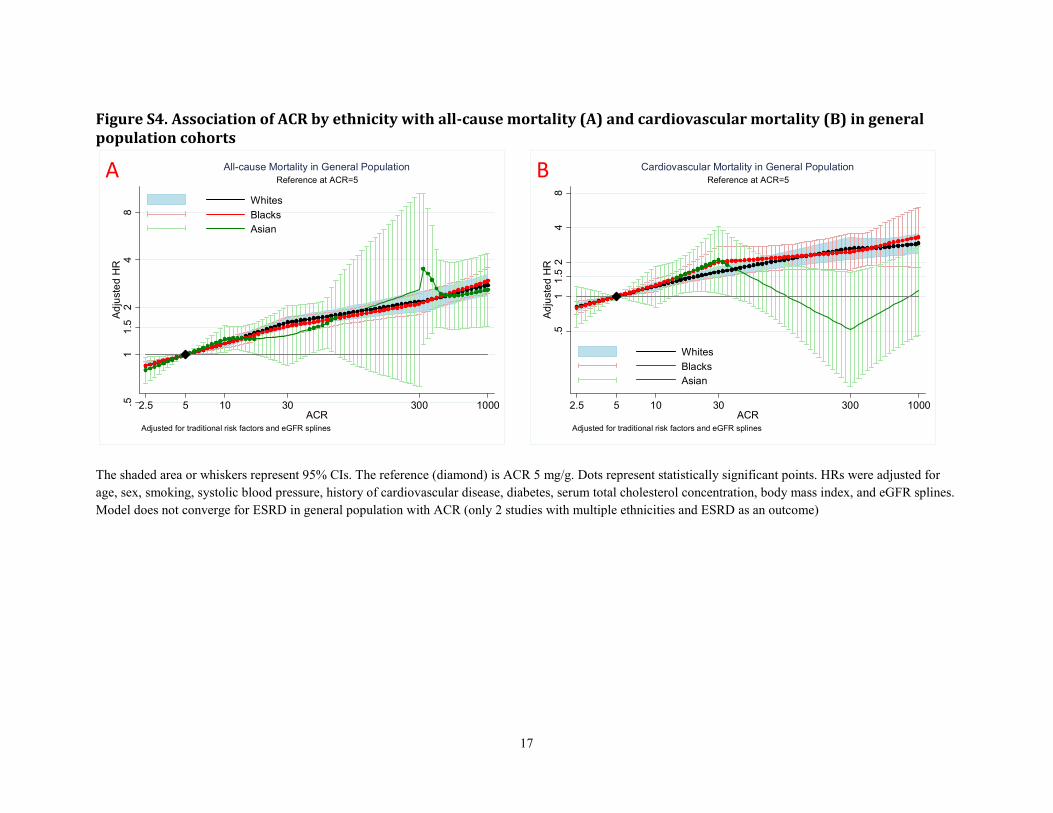
Figure S4. Association of ACR by ethnicity with all-cause mortality (A) and cardiovascular mortality (B) in general
population cohorts
The shaded area or whiskers represent 95% CIs. The reference (diamond) is ACR 5 mg/g. Dots represent statistically significant points. HRs were adjusted for
age, sex, smoking, systolic blood pressure, history of cardiovascular disease, diabetes, serum total cholesterol concentration, body mass index, and eGFR splines.
Model does not converge for ESRD in general population with ACR (only 2 studies with multiple ethnicities and ESRD as an outcome)
.51
1.5
24
8Adjusted H
R
2.5 5 10 30 300 1000ACR
Whites
Blacks
Asian
Adjusted for traditional risk factors and eGFR splines
Reference at ACR=5
All-cause Mortality in General Population
.51
1.5
24
8Adjusted H
R
2.5 5 10 30 300 1000ACR
Whites
Blacks
Asian
Adjusted for traditional risk factors and eGFR splines
Reference at ACR=5
Cardiovascular Mortality in General PopulationA B
18
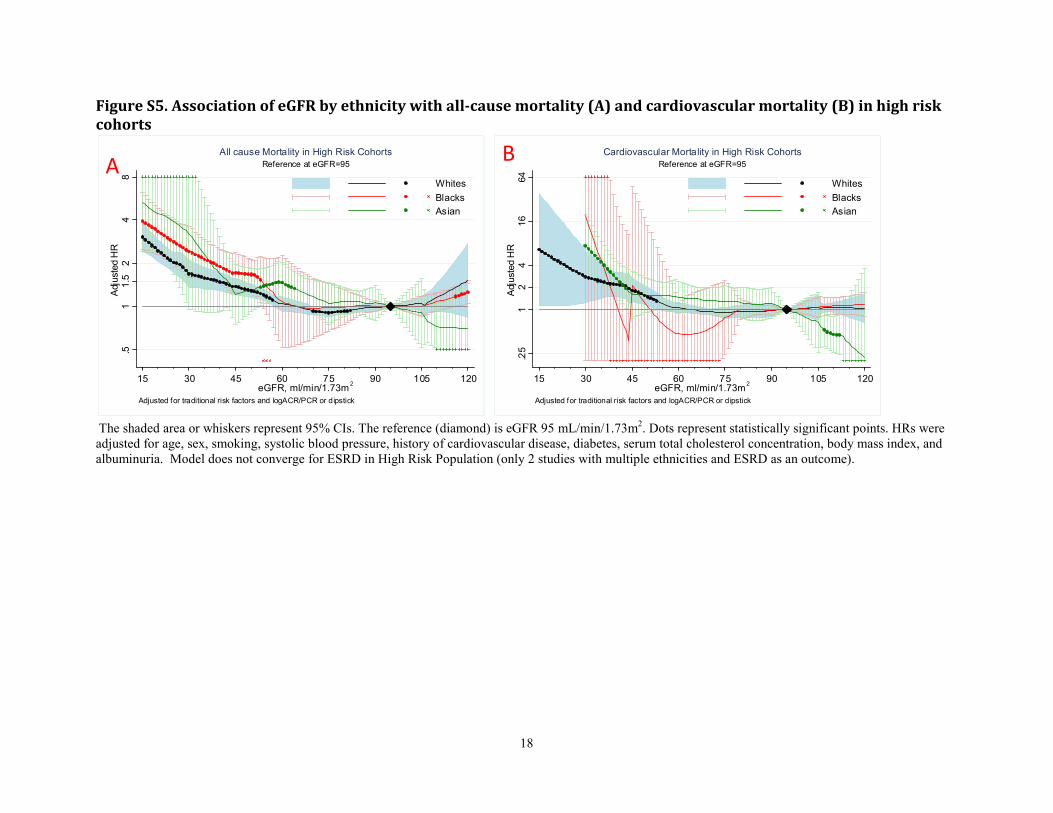
Figure S5. Association of eGFR by ethnicity with all-cause mortality (A) and cardiovascular mortality (B) in high risk
cohorts
The shaded area or whiskers represent 95% CIs. The reference (diamond) is eGFR 95 mL/min/1.73m2. Dots represent statistically significant points. HRs were
adjusted for age, sex, smoking, systolic blood pressure, history of cardiovascular disease, diabetes, serum total cholesterol concentration, body mass index, and
albuminuria. Model does not converge for ESRD in High Risk Population (only 2 studies with multiple ethnicities and ESRD as an outcome).
.51
1.5
24
8Adjusted HR
15 30 45 60 75 90 105 120eGFR, ml/min/1.73m
2
Whites
Blacks
Asian
Adjusted for traditional risk factors and logACR/PCR or dipstick
Reference at eGFR=95
All cause Mortality in High Risk Cohorts
.25
12
416
64
Adjusted HR
15 30 45 60 75 90 105 120eGFR, ml/min/1.73m
2
Whites
Blacks
Asian
Adjusted for traditional risk factors and logACR/PCR or dipstick
Reference at eGFR=95
Cardiovascular Mortality in High Risk Cohorts
AB
19
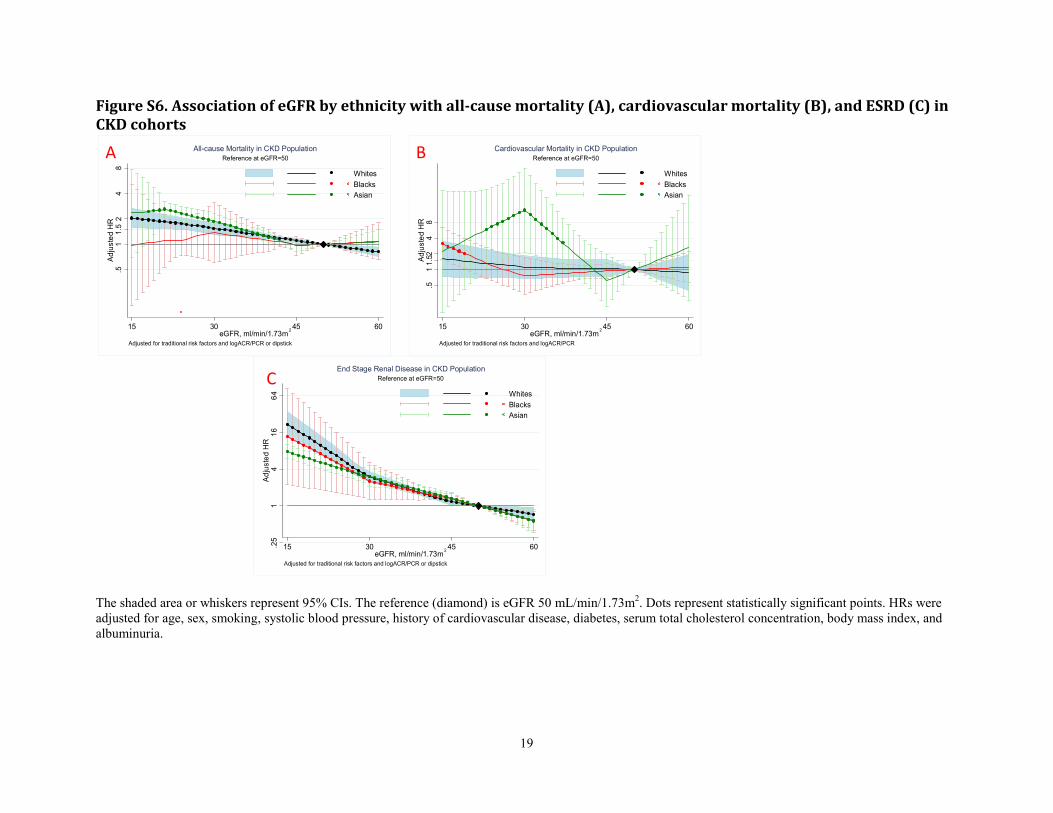
Figure S6. Association of eGFR by ethnicity with all-cause mortality (A), cardiovascular mortality (B), and ESRD (C) in
CKD cohorts
The shaded area or whiskers represent 95% CIs. The reference (diamond) is eGFR 50 mL/min/1.73m2. Dots represent statistically significant points. HRs were
adjusted for age, sex, smoking, systolic blood pressure, history of cardiovascular disease, diabetes, serum total cholesterol concentration, body mass index, and
albuminuria.
.25
14
16
64
Adjusted H
R
15 30 45 60eGFR, ml/min/1.73m
2
Whites
Blacks
Asian
Adjusted for traditional risk factors and logACR/PCR or dipstick
Reference at eGFR=50
End Stage Renal Disease in CKD Population
.511.52
48
Adjusted H
R
15 30 45 60eGFR, ml/min/1.73m
2
Whites
Blacks
Asian
Adjusted for traditional risk factors and logACR/PCR
Reference at eGFR=50
Cardiovascular Mortality in CKD Population
.51
1.5
24
8Adjusted H
R
15 30 45 60eGFR, ml/min/1.73m
2
Whites
Blacks
Asian
Adjusted for traditional risk factors and logACR/PCR or dipstick
Reference at eGFR=50
All-cause Mortality in CKD PopulationA B
C
20
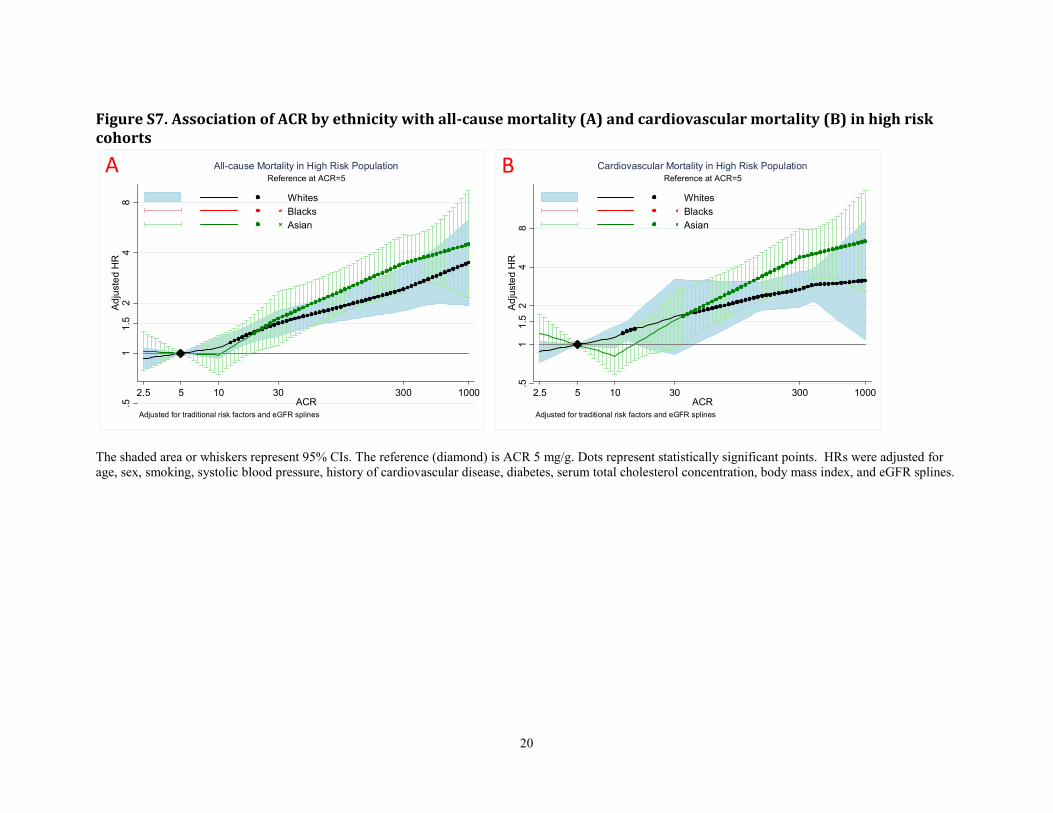
Figure S7. Association of ACR by ethnicity with all-cause mortality (A) and cardiovascular mortality (B) in high risk
cohorts
The shaded area or whiskers represent 95% CIs. The reference (diamond) is ACR 5 mg/g. Dots represent statistically significant points. HRs were adjusted for
age, sex, smoking, systolic blood pressure, history of cardiovascular disease, diabetes, serum total cholesterol concentration, body mass index, and eGFR splines.
.51
1.5
24
8Adjusted HR
2.5 5 10 30 300 1000ACR
Whites
Blacks
Asian
Adjusted for traditional risk factors and eGFR splines
Reference at ACR=5
All-cause Mortality in High Risk Population
.51
1.5
24
8Adjusted HR
2.5 5 10 30 300 1000ACR
Whites
Blacks
Asian
Adjusted for traditional risk factors and eGFR splines
Reference at ACR=5
Cardiovascular Mortality in High Risk PopulationA B
21
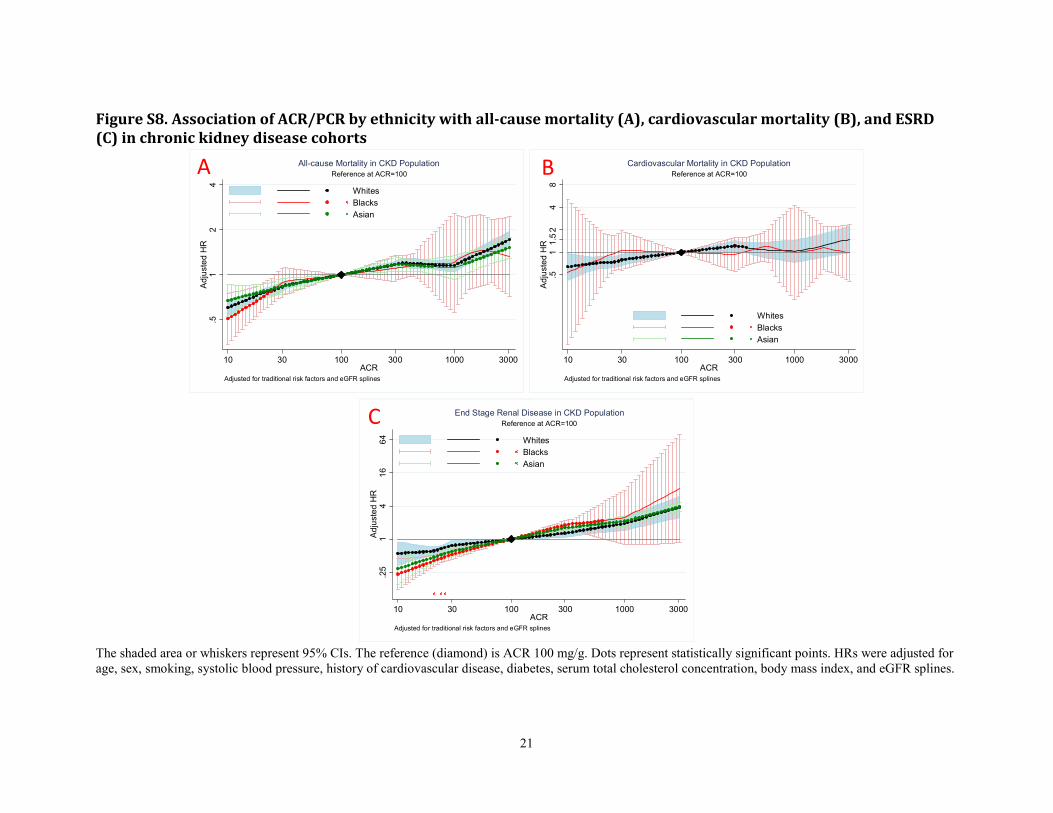
Figure S8. Association of ACR/PCR by ethnicity with all-cause mortality (A), cardiovascular mortality (B), and ESRD
(C) in chronic kidney disease cohorts
The shaded area or whiskers represent 95% CIs. The reference (diamond) is ACR 100 mg/g. Dots represent statistically significant points. HRs were adjusted for
age, sex, smoking, systolic blood pressure, history of cardiovascular disease, diabetes, serum total cholesterol concentration, body mass index, and eGFR splines.
.51
24
Adjusted H
R
10 30 100 300 1000 3000ACR
Whites
Blacks
Asian
Adjusted for traditional risk factors and eGFR splines
Reference at ACR=100
All-cause Mortality in CKD Population
.51
1.52
48
Adjusted H
R
10 30 100 300 1000 3000ACR
Whites
Blacks
Asian
Adjusted for traditional risk factors and eGFR splines
Reference at ACR=100
Cardiovascular Mortality in CKD Population
.25
14
16
64
Adjusted H
R
10 30 100 300 1000 3000ACR
Whites
Blacks
Asian
Adjusted for traditional risk factors and eGFR splines
Reference at ACR=100
End Stage Renal Disease in CKD Population
A B
C
22
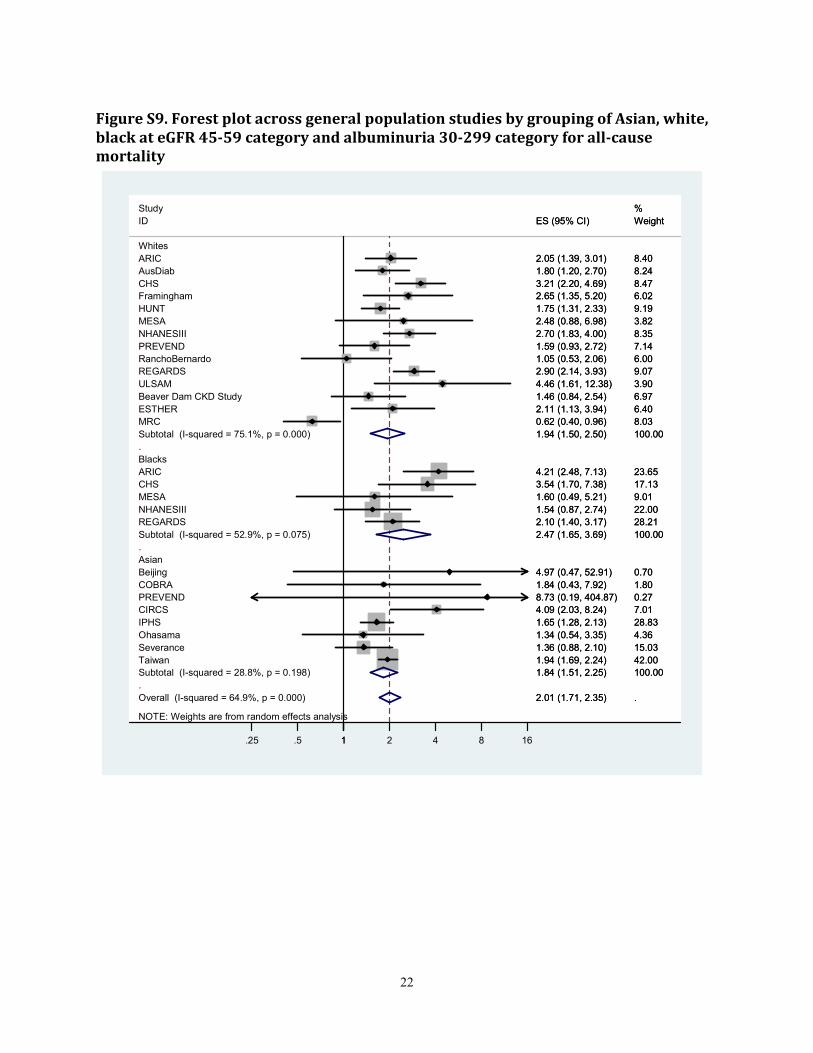
Figure S9. Forest plot across general population studies by grouping of Asian, white,
black at eGFR 45-59 category and albuminuria 30-299 category for all-cause
mortality
NOTE: Weights are from random effects analysis
.
.
.
Overall (I-squared = 64.9%, p = 0.000)
Study
Whites
Subtotal (I-squared = 75.1%, p = 0.000)
AusDiab
Beijing
Severance
ESTHER
Beaver Dam CKD Study
PREVEND
ARIC
MRC
Blacks
REGARDS
MESA
Subtotal (I-squared = 52.9%, p = 0.075)
REGARDS
Ohasama
COBRA
ID
PREVEND
Subtotal (I-squared = 28.8%, p = 0.198)
Taiwan
Framingham
NHANESIII
ULSAM
Asian
RanchoBernardo
IPHS
NHANESIII
MESA
ARIC
CHS
HUNT
CHS
CIRCS
2.01 (1.71, 2.35)
1.94 (1.50, 2.50)
1.80 (1.20, 2.70)
4.97 (0.47, 52.91)
1.36 (0.88, 2.10)
2.11 (1.13, 3.94)
1.46 (0.84, 2.54)
8.73 (0.19, 404.87)
2.05 (1.39, 3.01)
0.62 (0.40, 0.96)
2.90 (2.14, 3.93)
1.60 (0.49, 5.21)
2.47 (1.65, 3.69)
2.10 (1.40, 3.17)
1.34 (0.54, 3.35)
1.84 (0.43, 7.92)
ES (95% CI)
1.59 (0.93, 2.72)
1.84 (1.51, 2.25)
1.94 (1.69, 2.24)
2.65 (1.35, 5.20)
1.54 (0.87, 2.74)
4.46 (1.61, 12.38)
1.05 (0.53, 2.06)
1.65 (1.28, 2.13)
2.70 (1.83, 4.00)
2.48 (0.88, 6.98)
4.21 (2.48, 7.13)
3.21 (2.20, 4.69)
1.75 (1.31, 2.33)
3.54 (1.70, 7.38)
4.09 (2.03, 8.24)
.
%
100.00
8.24
0.70
15.03
6.40
6.97
0.27
8.40
8.03
9.07
9.01
100.00
28.21
4.36
1.80
Weight
7.14
100.00
42.00
6.02
22.00
3.90
6.00
28.83
8.35
3.82
23.65
8.47
9.19
17.13
7.01
1.25 .5 1 2 4 8 16
23
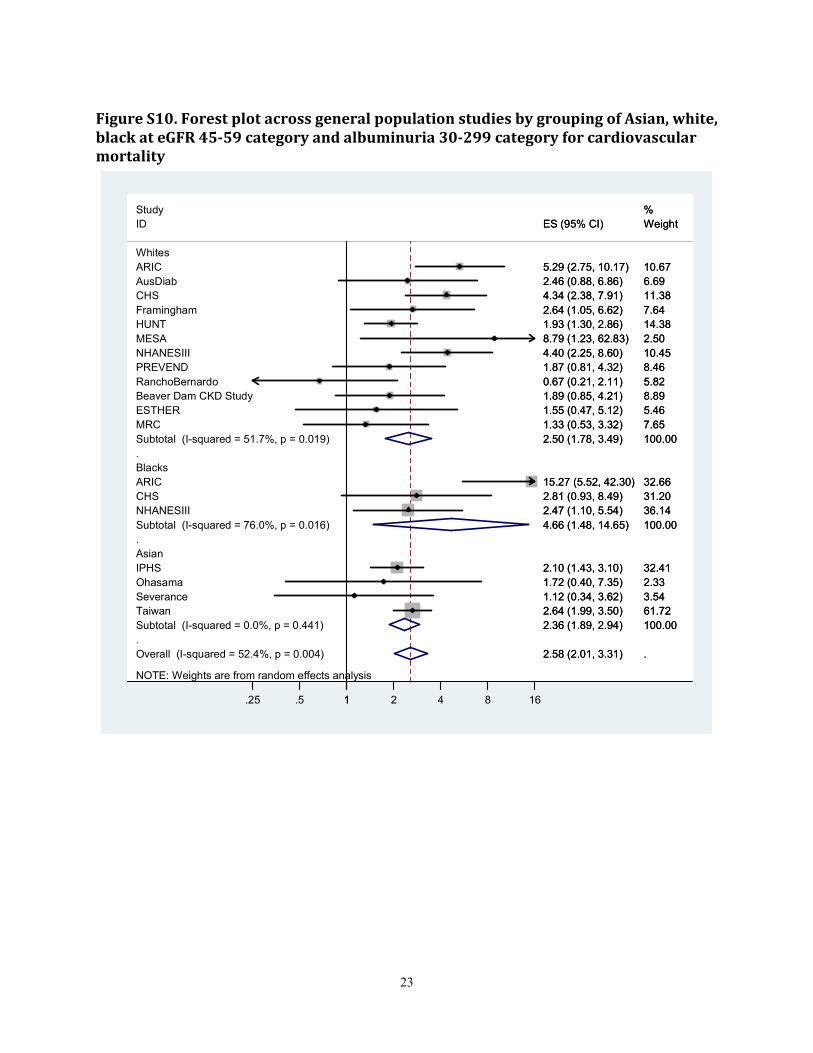
Figure S10. Forest plot across general population studies by grouping of Asian, white,
black at eGFR 45-59 category and albuminuria 30-299 category for cardiovascular
mortality
NOTE: Weights are from random effects analysis
.
.
.
Overall (I-squared = 52.4%, p = 0.004)
Ohasama
MRC
NHANESIII
Subtotal (I-squared = 0.0%, p = 0.441)
Taiwan
Framingham
HUNT
CHS
Subtotal (I-squared = 76.0%, p = 0.016)
Blacks
PREVEND
ESTHER
NHANESIII
Asian
RanchoBernardo
Study
Subtotal (I-squared = 51.7%, p = 0.019)
IPHS
CHS
Severance
ARIC
MESA
ARIC
Beaver Dam CKD Study
ID
AusDiab
Whites
2.58 (2.01, 3.31)
1.72 (0.40, 7.35)
1.33 (0.53, 3.32)
2.47 (1.10, 5.54)
2.36 (1.89, 2.94)
2.64 (1.99, 3.50)
2.64 (1.05, 6.62)
1.93 (1.30, 2.86)
2.81 (0.93, 8.49)
4.66 (1.48, 14.65)
1.87 (0.81, 4.32)
1.55 (0.47, 5.12)
4.40 (2.25, 8.60)
0.67 (0.21, 2.11)
2.50 (1.78, 3.49)
2.10 (1.43, 3.10)
4.34 (2.38, 7.91)
1.12 (0.34, 3.62)
15.27 (5.52, 42.30)
8.79 (1.23, 62.83)
5.29 (2.75, 10.17)
1.89 (0.85, 4.21)
ES (95% CI)
2.46 (0.88, 6.86)
.
2.33
7.65
36.14
100.00
61.72
7.64
14.38
31.20
100.00
8.46
5.46
10.45
5.82
%
100.00
32.41
11.38
3.54
32.66
2.50
10.67
8.89
Weight
6.69
1.25 .5 1 2 4 8 16
24
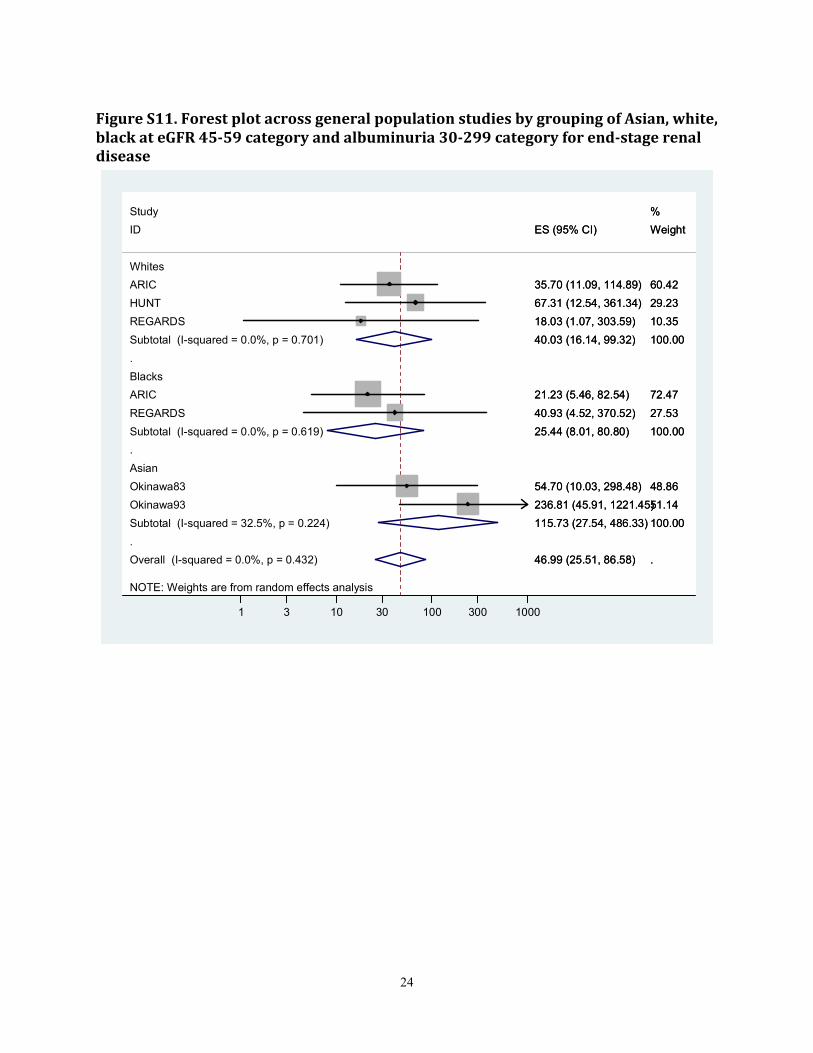
Figure S11. Forest plot across general population studies by grouping of Asian, white,
black at eGFR 45-59 category and albuminuria 30-299 category for end-stage renal
disease
NOTE: Weights are from random effects analysis
.
.
.
Overall (I-squared = 0.0%, p = 0.432)
HUNT
Blacks
Asian
Okinawa93
ID
REGARDS
REGARDS
ARIC
Subtotal (I-squared = 32.5%, p = 0.224)
ARIC
Subtotal (I-squared = 0.0%, p = 0.701)
Okinawa83
Subtotal (I-squared = 0.0%, p = 0.619)
Whites
Study
46.99 (25.51, 86.58)
67.31 (12.54, 361.34)
236.81 (45.91, 1221.45)
ES (95% CI)
18.03 (1.07, 303.59)
40.93 (4.52, 370.52)
35.70 (11.09, 114.89)
115.73 (27.54, 486.33)
21.23 (5.46, 82.54)
40.03 (16.14, 99.32)
54.70 (10.03, 298.48)
25.44 (8.01, 80.80)
.
29.23
51.14
Weight
10.35
27.53
60.42
100.00
72.47
100.00
48.86
100.00
%
1 3 10 30 100 300 1000
25
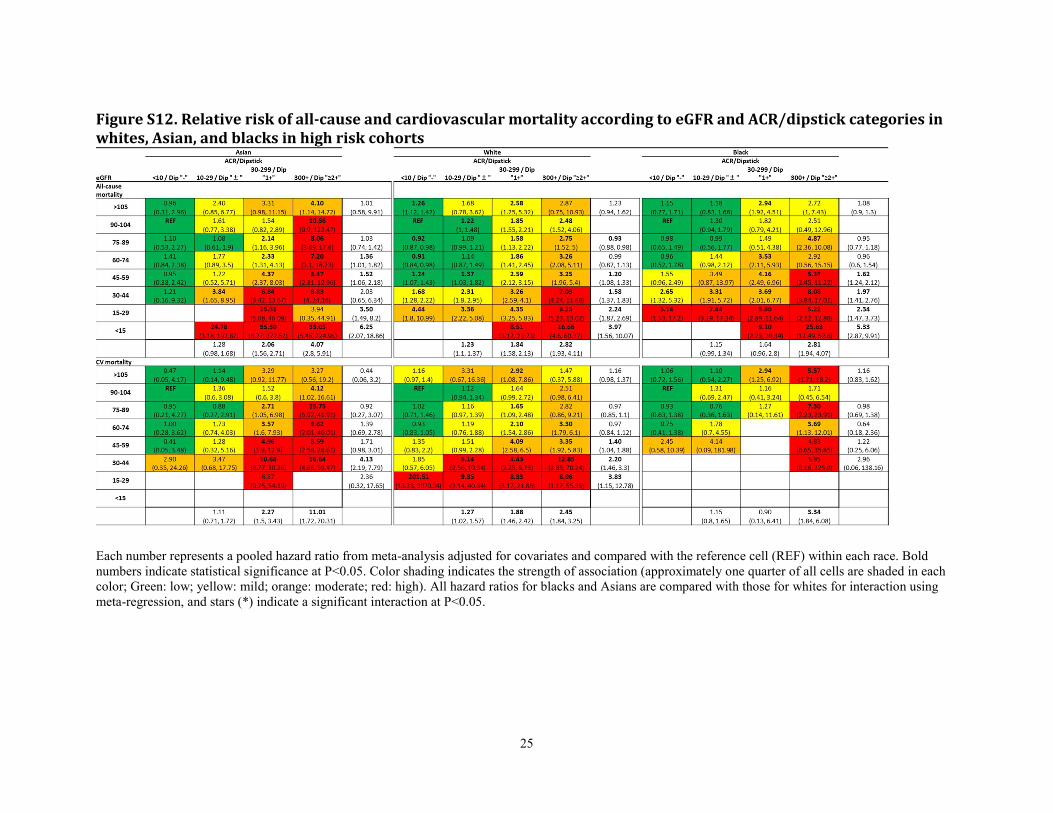
Figure S12. Relative risk of all-cause and cardiovascular mortality according to eGFR and ACR/dipstick categories in
whites, Asian, and blacks in high risk cohorts
Each number represents a pooled hazard ratio from meta-analysis adjusted for covariates and compared with the reference cell (REF) within each race. Bold
numbers indicate statistical significance at P<0.05. Color shading indicates the strength of association (approximately one quarter of all cells are shaded in each
color; Green: low; yellow: mild; orange: moderate; red: high). All hazard ratios for blacks and Asians are compared with those for whites for interaction using
meta-regression, and stars (*) indicate a significant interaction at P<0.05.
26
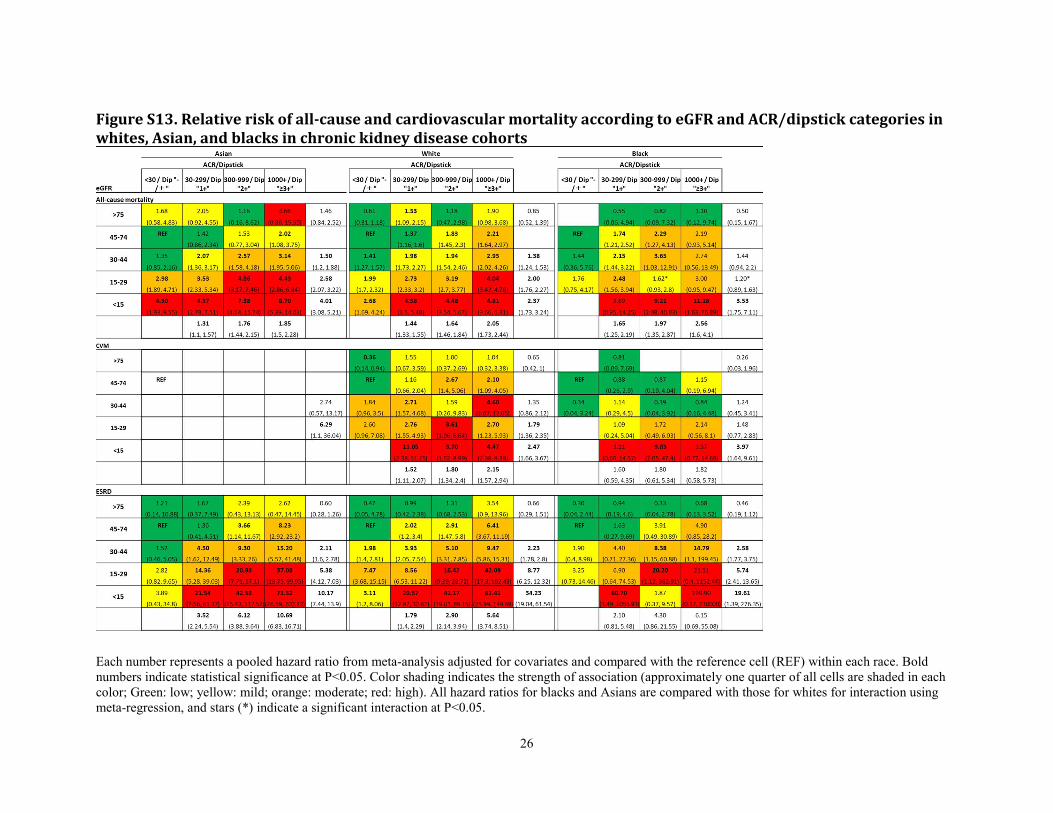
Figure S13. Relative risk of all-cause and cardiovascular mortality according to eGFR and ACR/dipstick categories in
whites, Asian, and blacks in chronic kidney disease cohorts
Each number represents a pooled hazard ratio from meta-analysis adjusted for covariates and compared with the reference cell (REF) within each race. Bold
numbers indicate statistical significance at P<0.05. Color shading indicates the strength of association (approximately one quarter of all cells are shaded in each
color; Green: low; yellow: mild; orange: moderate; red: high). All hazard ratios for blacks and Asians are compared with those for whites for interaction using
meta-regression, and stars (*) indicate a significant interaction at P<0.05.
27
Support Materials References
1. Mitsuhashi H, Yatsuya H, Matsushita K, et al. Uric acid and left ventricular hypertrophy in Japanese men.
Circ J 2009; 73: 667-672.
2. Matsushita K, Selvin E, Bash LD, et al. Change in estimated GFR associates with coronary heart disease
and mortality. J Am Soc Nephrol 2009; 20: 2617-2624.
3. White SL, Polkinghorne KR, Atkins RC, et al. Comparison of the Prevalence and Mortality Risk of CKD
in Australia Using the CKD Epidemiology Collaboration (CKD-EPI) and Modification of Diet in Renal
Disease (MDRD) Study GFR Estimating Equations: The AusDiab (Australian Diabetes, Obesity and
Lifestyle) Study. Am J Kidney Dis 2010; 55: 660-670.
4. Shankar A, Klein R, Klein BE. The association among smoking, heavy drinking, and chronic kidney
disease. Am J Epidemiol 2006; 164: 263-271.
5. Zhang L, Zuo L, Xu G, et al. Community-based screening for chronic kidney disease among populations
older than 40 years in Beijing. Nephrol Dial Transplant 2007; 22: 1093-1099.
6. Shlipak MG, Katz R, Kestenbaum B, et al. Rate of kidney function decline in older adults: a comparison
using creatinine and cystatin C. Am J Nephrol 2009; 30: 171-178.
7. Shimizu Y, Maeda K, Imano H, et al. Chronic kidney disease and drinking status in relation to risks of
stroke and its subtypes: the Circulatory Risk in Communities Study (CIRCS). Stroke 2011; 42: 2531-2537.
8. Jafar TH, Qadri Z, Hashmi S. Prevalence of microalbuminuria and associated electrocardiographic
abnormalities in an Indo-Asian population. Nephrol Dial Transplant 2009; 24: 2111-2116.
9. Zhang QL, Koenig W, Raum E, et al. Epidemiology of chronic kidney disease: results from a population of
older adults in Germany. Prev Med 2009; 48: 122-127.
10. Parikh NI, Hwang S-J, Larson MG, et al. Chronic Kidney Disease as a Predictor of Cardiovascular Disease
(from the Framingham Heart Study). Am J Cardiol 2008; 102: 47-53.
11. Cirillo M, Lanti MP, Menotti A, et al. Definition of kidney dysfunction as a cardiovascular risk factor: use
of urinary albumin excretion and estimated glomerular filtration rate. Arch Intern Med 2008; 168: 617-624.
12. Hallan SI, Coresh J, Astor BC, et al. International comparison of the relationship of chronic kidney disease
prevalence and ESRD risk. J Am Soc Nephrol 2006; 17: 2275-2284.
13. Noda H, Iso H, Irie F, et al. Low-density lipoprotein cholesterol concentrations and death due to
intraparenchymal hemorrhage: the Ibaraki Prefectural Health Study. Circulation 2009; 119: 2136-2145.
14. Bui AL, Katz R, Kestenbaum B, et al. Cystatin C and carotid intima-media thickness in asymptomatic
adults: the Multi-Ethnic Study of Atherosclerosis (MESA). Am J Kidney Dis 2009; 53: 389-398.
15. Roderick PJ, Atkins RJ, Smeeth L, et al. CKD and mortality risk in older people: a community-based
population study in the United Kingdom. Am J Kidney Dis 2009; 53: 950-960.
16. Astor BC, Hallan SI, Miller ER, 3rd, et al. Glomerular filtration rate, albuminuria, and risk of
cardiovascular and all-cause mortality in the US population. Am J Epidemiol 2008; 167: 1226-1234.
17. Nakayama M, Metoki H, Terawaki H, et al. Kidney dysfunction as a risk factor for first symptomatic stroke
events in a general Japanese population--the Ohasama study. Nephrol Dial Transplant 2007; 22: 1910-
1915.
28
18. Iseki K, Ikemiya Y, Iseki C, et al. Proteinuria and the risk of developing end-stage renal disease. Kidney Int
2003; 63: 1468-1474.
19. Iseki K, Kohagura K, Sakima A, et al. Changes in the demographics and prevalence of chronic kidney
disease in Okinawa, Japan (1993 to 2003). Hypertens Res 2007; 30: 55-62.
20. Hillege HL, Fidler V, Diercks GF, et al. Urinary albumin excretion predicts cardiovascular and
noncardiovascular mortality in general population. Circulation 2002; 106: 1777-1782.
21. Jassal SK, Kritz-Silverstein D, Barrett-Connor E. A Prospective Study of Albuminuria and Cognitive
Function in Older Adults: The Rancho Bernardo Study. Am J Epidemiol 2010; 171: 277-286.
22. Howard VJ, Cushman M, Pulley L, et al. The reasons for geographic and racial differences in stroke study:
objectives and design. Neuroepidemiology 2005; 25: 135-143.
23. Kimm H, Yun JE, Jo J, et al. Low Serum Bilirubin Level as an Independent Predictor of Stroke Incidence:
A Prospective Study in Korean Men and Women. Stroke 2009; 40: 3422-3427.
24. Wen CP, Cheng TY, Tsai MK, et al. All-cause mortality attributable to chronic kidney disease: a
prospective cohort study based on 462 293 adults in Taiwan. Lancet 2008; 371: 2173-2182.
25. Ingelsson E, Sundstrom J, Lind L, et al. Low-grade albuminuria and the incidence of heart failure in a
community-based cohort of elderly men. Eur Heart J 2007; 28: 1739-1745.
26. Patel A, MacMahon S, Chalmers J, et al. Effects of a fixed combination of perindopril and indapamide on
macrovascular and microvascular outcomes in patients with type 2 diabetes mellitus (the ADVANCE trial):
a randomised controlled trial. Lancet 2007; 370: 829-840.
27. Tonelli M, Jose P, Curhan G, et al. Proteinuria, impaired kidney function, and adverse outcomes in people
with coronary disease: analysis of a previously conducted randomised trial. BMJ 2006; 332: 1426.
28. Jurkovitz CT, Qiu Y, Wang C, et al. The Kidney Early Evaluation Program (KEEP): program design and
demographic characteristics of the population. Am J Kidney Dis 2008; 51: S3-12.
29. Lee BJ, Forbes K. The role of specialists in managing the health of populations with chronic illness: the
example of chronic kidney disease. BMJ 2009; 339: b2395.
30. Ishani A, Grandits GA, Grimm RH, et al. Association of single measurements of dipstick proteinuria,
estimated glomerular filtration rate, and hematocrit with 25-year incidence of end-stage renal disease in the
multiple risk factor intervention trial. J Am Soc Nephrol 2006; 17: 1444-1452.
31. Pavkov ME, Knowler WC, Hanson RL, et al. Predictive power of sequential measures of albuminuria for
progression to ESRD or death in Pima Indians with type 2 diabetes. Am J Kidney Dis 2008; 51: 759-766.
32. Bilo HJ, Logtenberg SJ, Joosten H, et al. Modification of diet in renal disease and Cockcroft-Gault
formulas do not predict mortality (ZODIAC-6). Diabet Med 2009; 26: 478-482.
33. Wright JT, Jr., Bakris G, Greene T, et al. Effect of blood pressure lowering and antihypertensive drug class
on progression of hypertensive kidney disease: results from the AASK trial. JAMA 2002; 288: 2421-2431.
34. Levin A, Djurdjev O, Beaulieu M, et al. Variability and risk factors for kidney disease progression and
death following attainment of stage 4 CKD in a referred cohort. Am J Kidney Dis 2008; 52: 661-671.
35. Landray MJ, Thambyrajah J, McGlynn FJ, et al. Epidemiological evaluation of known and suspected
cardiovascular risk factors in chronic renal impairment. Am J Kidney Dis 2001; 38: 537-546.
29
36. Perkins RM, Bucaloiu ID, Kirchner HL, et al. GFR decline and mortality risk among patients with chronic
kidney disease. Clin J Am Soc Nephrol 2011; 6: 1879-1886.
37. Marks A, Black C, Fluck N, et al. Translating chronic kidney disease epidemiology into patient care - the
individual/public health risk paradox. Nephrol Dial Transplant 2012.
38. Keith DS, Nichols GA, Gullion CM, et al. Longitudinal follow-up and outcomes among a population with
chronic kidney disease in a large managed care organization. Arch Intern Med 2004; 164: 659-663.
39. van Zuilen AD, Bots ML, Dulger A, et al. Multifactorial intervention with nurse practitioners does not
change cardiovascular outcomes in patients with chronic kidney disease. Kidney Int 2012; 82: 710-717.
40. Klahr S, Levey AS, Beck GJ, et al. The effects of dietary protein restriction and blood-pressure control on
the progression of chronic renal disease. Modification of Diet in Renal Disease Study Group. N Engl J Med
1994; 330: 877-884.
41. Kronenberg F, Kuen E, Ritz E, et al. Lipoprotein(a) serum concentrations and apolipoprotein(a) phenotypes
in mild and moderate renal failure. J Am Soc Nephrol 2000; 11: 105-115.
42. Moranne O, Froissart M, Rossert J, et al. Timing of onset of CKD-related metabolic complications. J Am
Soc Nephrol 2009; 20: 164-171.
43. Brenner BM, Cooper ME, de Zeeuw D, et al. Effects of losartan on renal and cardiovascular outcomes in
patients with type 2 diabetes and nephropathy. N Engl J Med 2001; 345: 861-869.
44. Jorsal A, Tarnow L, Frystyk J, et al. Serum adiponectin predicts all-cause mortality and end stage renal
disease in patients with type I diabetes and diabetic nephropathy. Kidney Int 2008; 74: 649-654.
45. Tangri N, Stevens LA, Griffith J, et al. A predictive model for progression of chronic kidney disease to
kidney failure. JAMA 2011; 305: 1553-1559.
46. The National Institute for Health and Clinical Excellence: Chronic kidney disease: early identification and
management of chronic kidney disease in adults in primary and secondary care. In (vol 2008), 2008
47. National Kidney Foundation. K/DOQI clinical practice guidelines for chronic kidney disease: evaluation,
classification, and stratification. Am J Kidney Dis 2002; 39: S1-266.
48. Shlipak MG, Sarnak MJ, Katz R, et al. Cystatin C and the risk of death and cardiovascular events among
elderly persons. N Engl J Med 2005; 352: 2049-2060.
49. Matsushita K, Selvin E, Bash LD, et al. Risk implications of the new CKD-EPI equation as compared to
the MDRD Study equation for estimated glomerular filtration rate: the Atherosclerosis Risk in
Communities (ARIC) Study. Am J Kidney Dis 2010; 55: 648-659.
50. Astor BC, Levey AS, Stevens LA, et al. Method of Glomerular Filtration Rate Estimation Affects
Prediction of Mortality Risk. J Am Soc Nephrol 2009; 20: 2214-2222.
51. S201 sex and age by ethnic group, all people, geographic level: Health board - Grampian 2001 census
[Internet]. In, General Register Office for Scotland, 2009


![ISEKI · ISEKI ISEKI [KM 17] [KM 27] [K C R 605] Pro duce b4Q . Created Date: 1/31/2017 10:33:51 AM](https://img.pdfslide.net/doc/110x75/5ac7cb787f8b9a40728c2ac1/iseki-km-17-km-27-k-c-r-605-pro-duce-b4q-created-date-1312017-103351.jpg)