Embed Size (px)
Citation preview
Greater Toronto Airports AuthorityToronto Pearson International Airport
P.O. Box 6031, 3111 Convair Drive
Toronto AMF, Ontario, Canada l5p 1b2
TorontoPearson.com
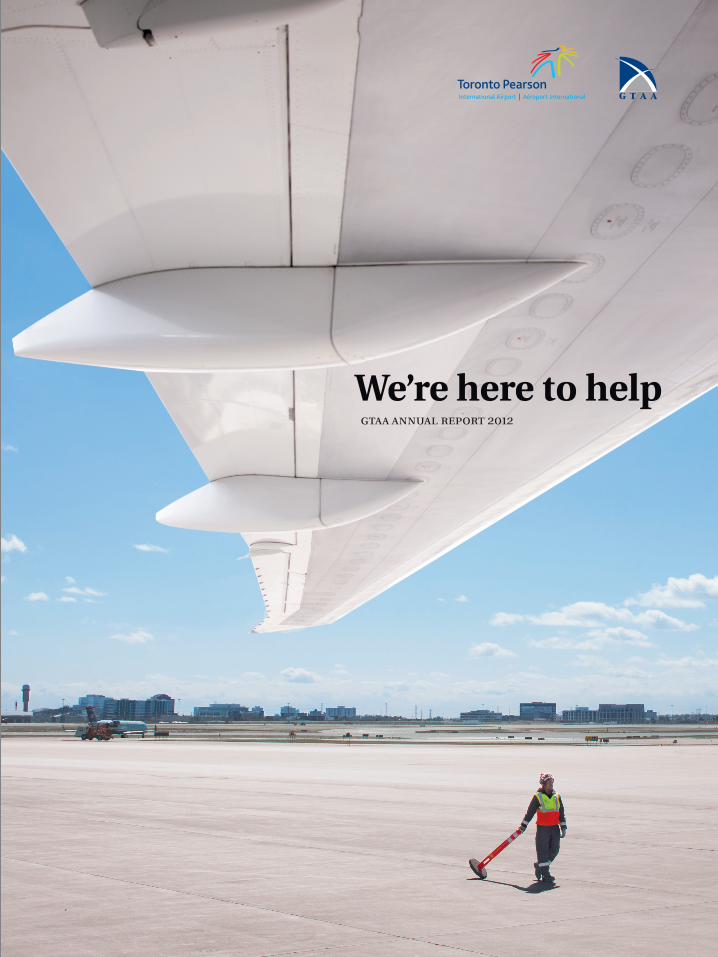
We’re here to helpgtaa annual report 2012
We’re h
ere to h
elp g
taa
an
nu
al r
ep
or
t 20
12
THE GREATER TORONTO AIRPORTS
AUTHORITY (GTAA) WAS INCORPORATED
IN 1993 AND MANAGES TORONTO PEARSON
INTERNATIONAL AIRPORT UNDER TERMS SET
OUT IN OUR DECEMBER 1996 LEASE WITH
THE CANADIAN FEDERAL GOVERNMENT.
Contents
A Message from the Chairman /22
A Message from the CEO /23
Board of Directors /24
Executive Team /26
Corporate Governance /28
Management’s Discussion and Analysis /30
Financial Statements /58
Corporate Information /104
Cover photo: Tashnee Solomon, Air Canada
Opposite page: Vernon Coté, Eurest Services
DESIGN & DIRECTION
jimryce.com
THEMATIC SECTION WRITING
Doug Dolan
PRINTING
Somerset Graphics Co. Ltd.
PRINCIPAL PHOTOGRAPHY
Chris Thomaidis
BOARD AND EXECUTIVE PHOTOGRAPHY
Lorella Zanetti
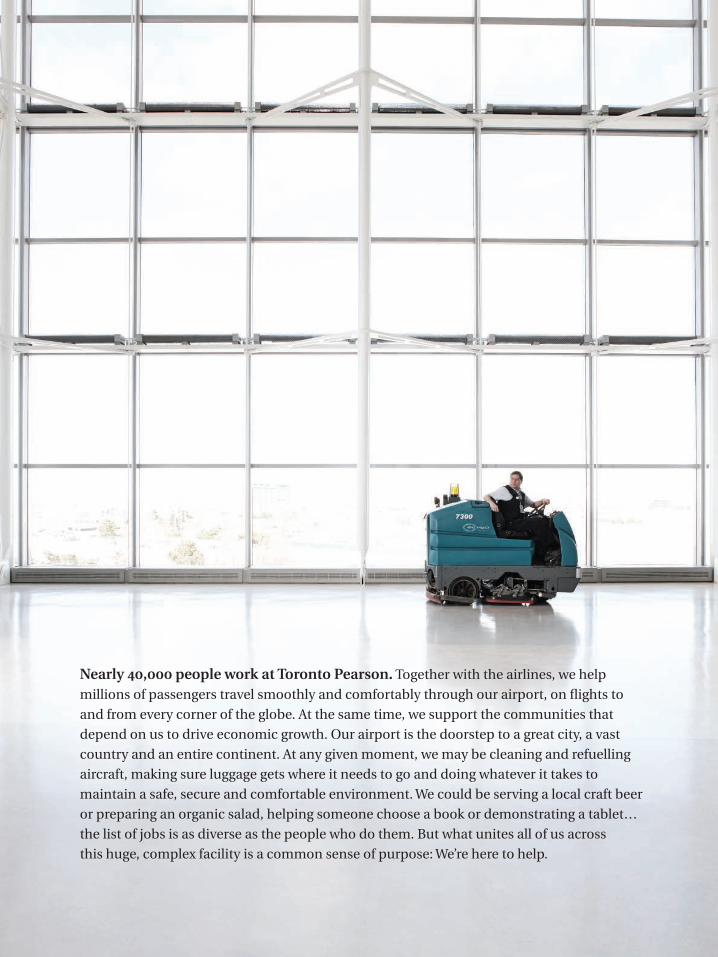
Nearly 40,000 people work at Toronto Pearson. Together with the airlines, we help
millions of passengers travel smoothly and comfortably through our airport, on flights to
and from every corner of the globe. At the same time, we support the communities that
depend on us to drive economic growth. Our airport is the doorstep to a great city, a vast
country and an entire continent. At any given moment, we may be cleaning and refuelling
aircraft, making sure luggage gets where it needs to go and doing whatever it takes to
maintain a safe, secure and comfortable environment. We could be serving a local craft beer
or preparing an organic salad, helping someone choose a book or demonstrating a tablet…
the list of jobs is as diverse as the people who do them. But what unites all of us across
this huge, complex facility is a common sense of purpose: We’re here to help.
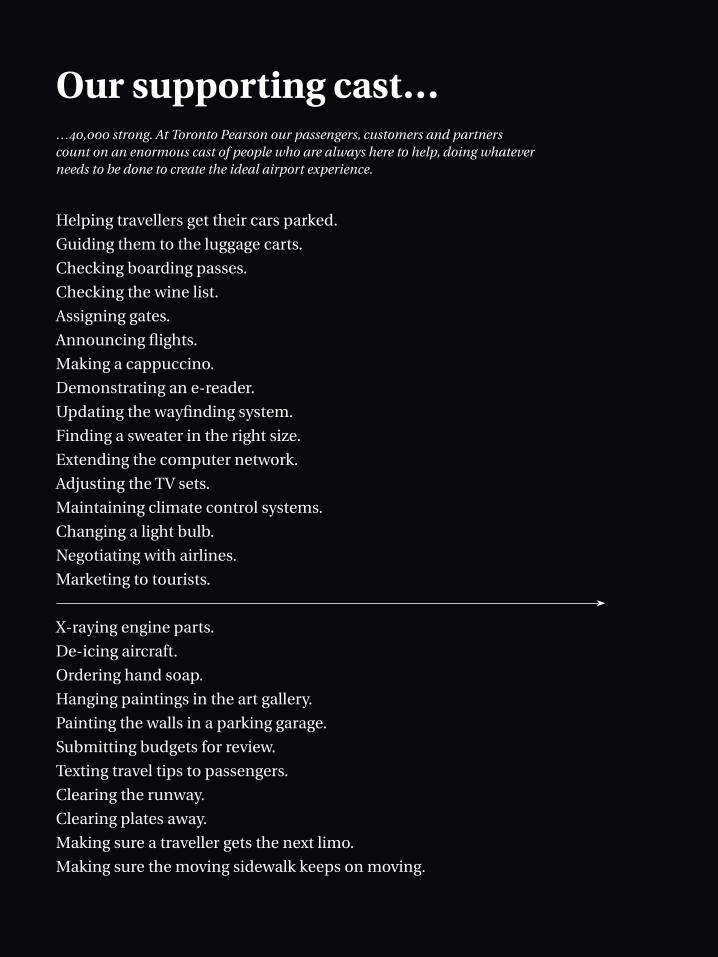
Our supporting cast……40,000 strong. At Toronto Pearson our passengers, customers and partners count on an enormous cast of people who are always here to help, doing whatever needs to be done to create the ideal airport experience.
Helping travellers get their cars parked.
Guiding them to the luggage carts.
Checking boarding passes.
Checking the wine list.
Assigning gates.
Announcing flights.
Making a cappuccino.
Demonstrating an e-reader.
Updating the wayfinding system.
Finding a sweater in the right size.
Extending the computer network.
Adjusting the TV sets.
Maintaining climate control systems.
Changing a light bulb.
Negotiating with airlines.
Marketing to tourists.
X-raying engine parts.
De-icing aircraft.
Ordering hand soap.
Hanging paintings in the art gallery.
Painting the walls in a parking garage.
Submitting budgets for review.
Texting travel tips to passengers.
Clearing the runway.
Clearing plates away.
Making sure a traveller gets the next limo.
Making sure the moving sidewalk keeps on moving.

Scanning luggage and ID cards.
Nadesha Warren
ASP Security Services

Toronto Pearson gained a new array of specialty retailers in 2012, including:
Hudson’s Bay Trading Company – debut shop from a classic Canadian retailer
The Body Shop – natural, ethically produced beauty products
David’s Tea – exotic blends and preparation/serving ware for tea lovers
iStore – electronics boutique celebrating “the digital lifestyle”
Samsonite – luggage and a wide range of travel accessories
Best Buy – innovative vending machines featuring personal electronics
Attention, Shoppers
It’s
getting
better
all the
time
Cheryl Ramos
LS Travel Retail North America
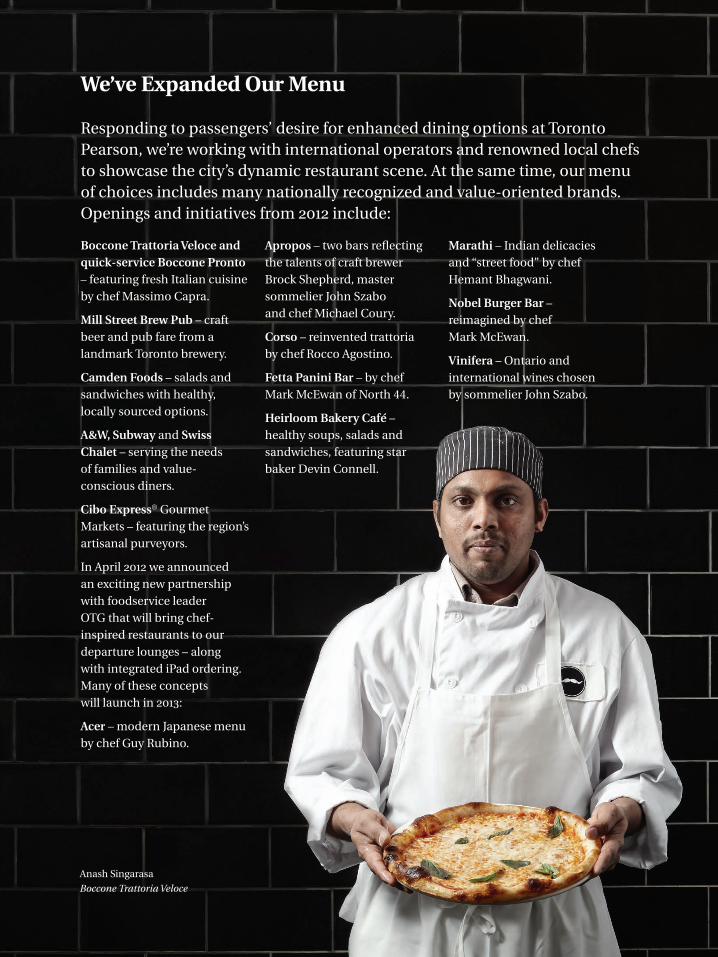
Responding to passengers’ desire for enhanced dining options at Toronto Pearson, we’re working with international operators and renowned local chefs to showcase the city’s dynamic restaurant scene. At the same time, our menu of choices includes many nationally recognized and value-oriented brands. Openings and initiatives from 2012 include:
We’ve Expanded Our Menu
Boccone Trattoria Veloce and quick-service Boccone Pronto – featuring fresh Italian cuisine by chef Massimo Capra.
Mill Street Brew Pub – craft beer and pub fare from a landmark Toronto brewery.
Camden Foods – salads and sandwiches with healthy, locally sourced options.
A&W, Subway and Swiss Chalet – serving the needs of families and value-conscious diners.
Cibo Express® Gourmet Markets – featuring the region’s artisanal purveyors.
In April 2012 we announced an exciting new partnership with foodservice leader OTG that will bring chef-inspired restaurants to our departure lounges – along with integrated iPad ordering. Many of these concepts will launch in 2013:
Acer – modern Japanese menu by chef Guy Rubino.
Apropos – two bars reflecting the talents of craft brewer Brock Shepherd, master sommelier John Szabo and chef Michael Coury.
Corso – reinvented trattoria by chef Rocco Agostino.
Fetta Panini Bar – by chef Mark McEwan of North 44.
Heirloom Bakery Café – healthy soups, salads and sandwiches, featuring star baker Devin Connell.
Marathi – Indian delicacies and “street food” by chef Hemant Bhagwani.
Nobel Burger Bar – reimagined by chef Mark McEwan.
Vinifera – Ontario and international wines chosen by sommelier John Szabo.
Anash Singarasa
Boccone Trattoria Veloce

The Toronto Pearson experience consists of countless thoughtful details that make travelling through our airport more relaxing, comfortable and enjoyable. Our job is to stay one step ahead of expectations, meeting passengers’ needs today and anticipating what they’ll want next. Like valet parking…free Wi-Fi…smartphone chargers…healthy meals…and, by the end of 2013, more than 2,500 Apple iPads provided by our foodservice partner OTG, enabling gate-area passengers to order meals, browse the Web and monitor flight information. These are the added touches, large and small, that the people who work at Toronto Pearson look after every day, whether we’re helping queues move faster or simply taking a passenger’s latte cup as she heads off to board her flight.
Every little thing
Krystle Formsma
Michigan passenger connecting via Toronto Pearson to Tokyo
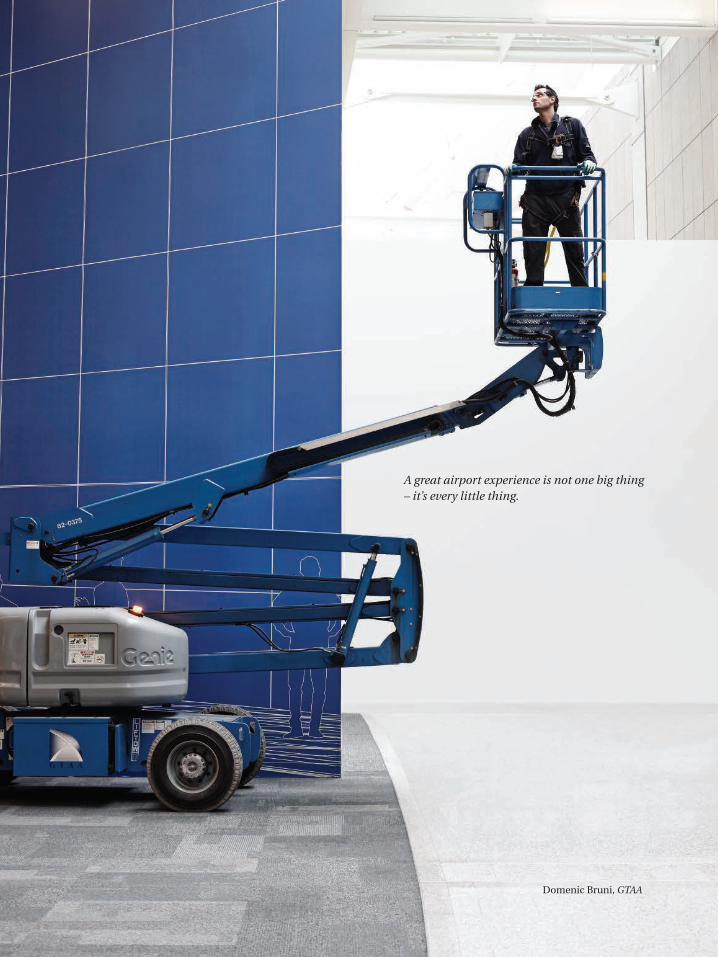
A great airport experience is not one big thing – it’s every little thing.
Domenic Bruni, GTAA
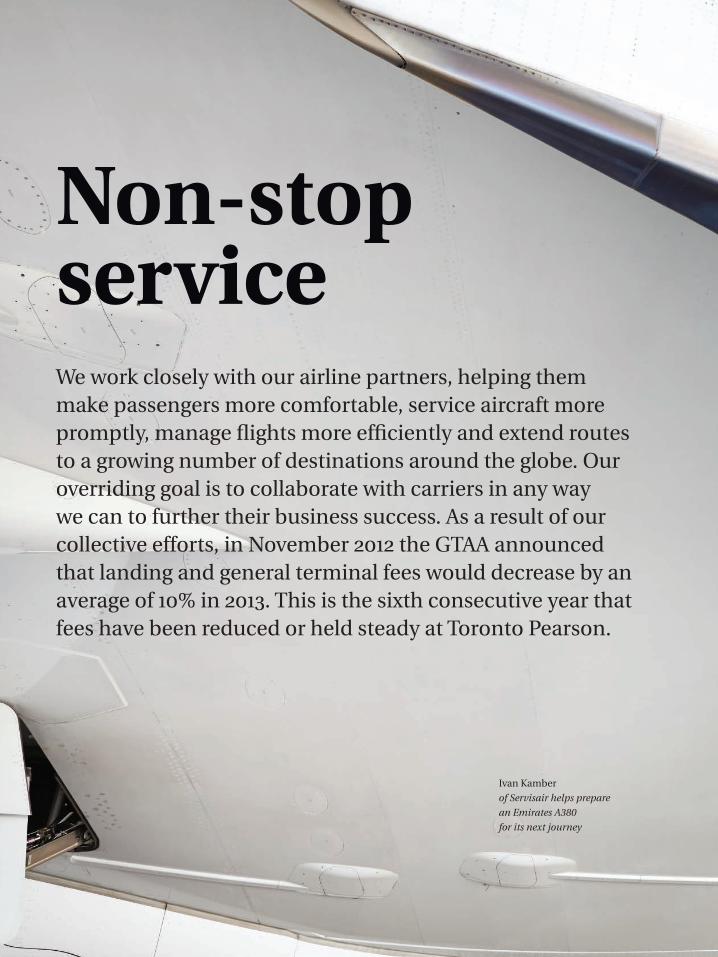
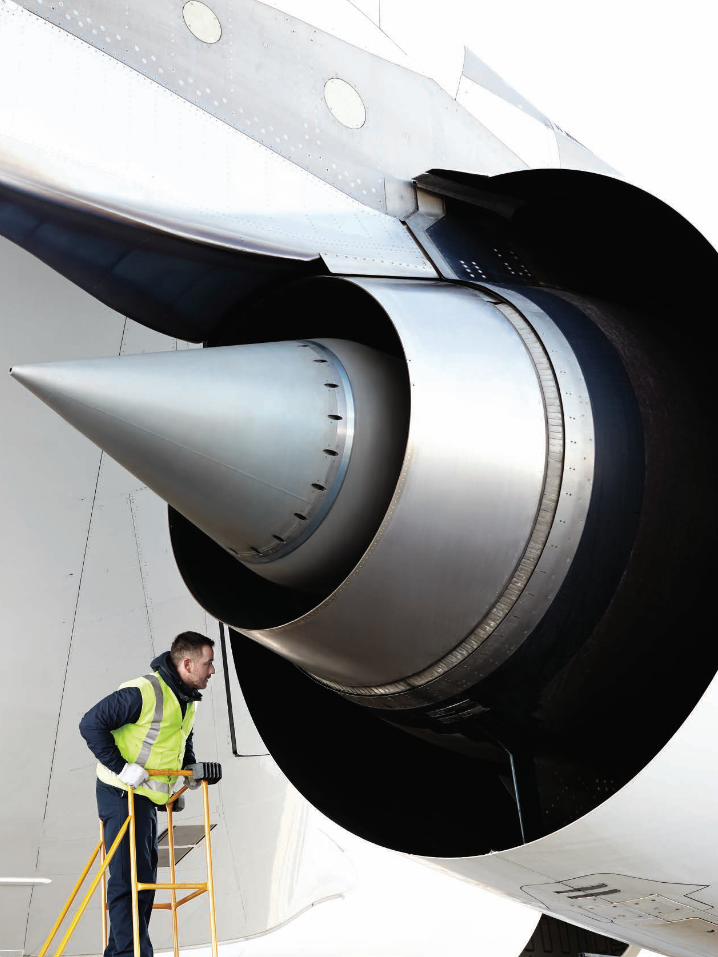
Non-stopserviceWe work closely with our airline partners, helping them make passengers more comfortable, service aircraft more promptly, manage flights more efficiently and extend routes to a growing number of destinations around the globe. Our overriding goal is to collaborate with carriers in any way we can to further their business success. As a result of our collective efforts, in November 2012 the GTAA announced that landing and general terminal fees would decrease by an average of 10% in 2013. This is the sixth consecutive year that fees have been reduced or held steady at Toronto Pearson.
Ivan Kamber
of Servisair helps prepare
an Emirates A380
for its next journey
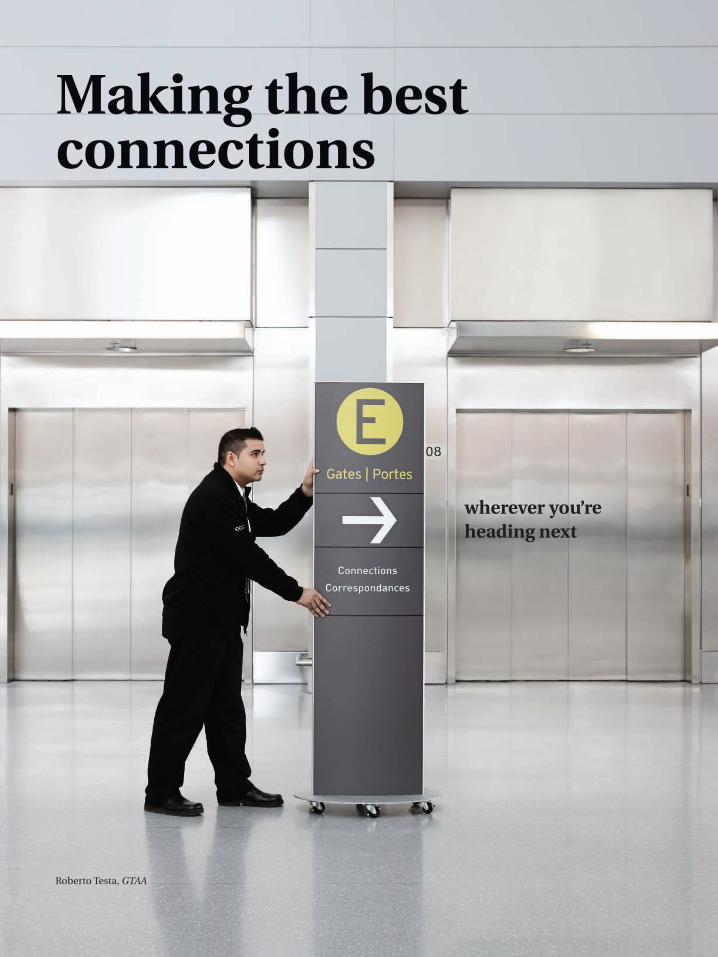
Making the best connections
wherever you’re heading next
Roberto Testa, GTAA
Saving Steps – for Everyone
A key element in our efforts to enhance the Toronto Pearson experience is passenger facilitation. As we explore ways of improving both required procedures and facilities design, our aim is to help all passengers – departing, arriving and connecting – move more quickly and efficiently through the airport.
In 2012 we saw significant progress in our multi-year collaboration with government agencies, carriers and other partners to streamline passenger processing. There are potential benefits for all stakeholders: simplified operations, quicker connections and optimization of our facilities investment – all of which will boost Toronto Pearson’s competitive advantage. Here are a few of the initiatives that will save steps for passengers and everyone involved in helping them move through our terminals:
Automated Border Clearance speeds up the document validation process for Canadians returning from abroad. Eligible passengers input their declarations into kiosks prior to speaking with Canada Border Services Agency (CBSA) officers; this helps the entire screening process move more promptly, reducing strain on limited resources. Plans were finalized in 2012, and the first kiosks were installed early in the current year.
Baggage Transfer for U.S. Connections will make it far simpler for travellers passing through Toronto Pearson to board onward flights to the U.S. by eliminating the need to collect their checked baggage before proceeding to U.S. Customs and Border Protection. We’ve worked closely with our partners to ensure that all requirements are met while streamlining the airport experience for 800,000 passengers a year who connect through Terminal 1 en route to the U.S.
Transfer Departure Facilities will make it possible for arriving transborder passengers connecting through Toronto Pearson to proceed directly to international departure lounges without reporting to the CBSA – improving connection times and walking distances. A pilot program has been approved, pending the finalization of related federal regulations.
Signs of Progress in the Air
In 2012 we continued our successful efforts to attract new carriers to Toronto Pearson while helping current partners add routes and expand existing services. Some highlights:
Air Canada: Toronto Pearson’s largest customer added two new destinations in 2012 – New York (JFK) and Costa Rica (Liberia) – for a total of 137. The country’s biggest airline also significantly increased capacity on existing routes by the equivalent of nine flight movements daily.
WestJet: Canada’s second-largest carrier added seven destinations last year, expanding service to New York (LaGuardia) and flying southern vacationers to Antigua, Aruba, Costa Rica (Liberia), Curaçao, Kingston and Port of Spain. On average, the airline increased its daily activities by 10 flight movements.
Together, Air Canada and WestJet carried an additional 1.3 million passengers compared to the previous year, responding to consumer demand for more travel options and reflecting the particular strength of the marketplace around the Greater Toronto Area.
Philippine Airlines: In November this national carrier began thrice-weekly direct flights from Manila, stopping in Vancouver on the return leg. Previously, more than 130,000 passengers annually had to make an intermediate stop in either the U.S. or Asia.
Ethiopian Airlines: In July this new carrier to the Canadian marketplace introduced our first African route – twice-weekly service to/from Addis Ababa via Rome. The airline also became the first at Toronto Pearson to operate regularly scheduled flights of the Boeing 787 Dreamliner.
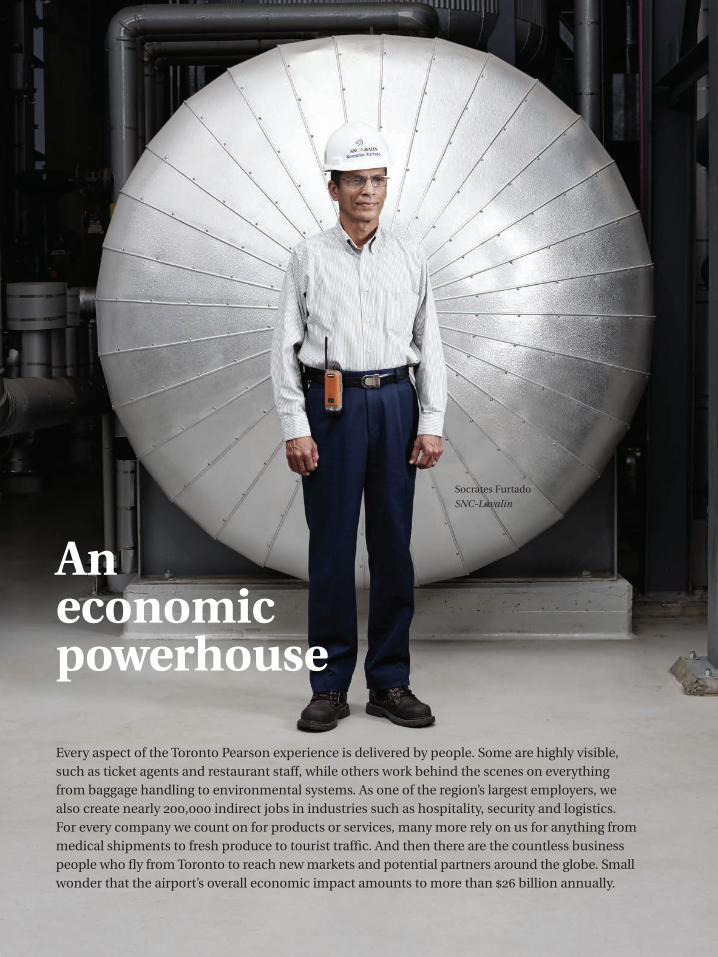
An economic powerhouse
Every aspect of the Toronto Pearson experience is delivered by people. Some are highly visible, such as ticket agents and restaurant staff, while others work behind the scenes on everything from baggage handling to environmental systems. As one of the region’s largest employers, we also create nearly 200,000 indirect jobs in industries such as hospitality, security and logistics. For every company we count on for products or services, many more rely on us for anything from medical shipments to fresh produce to tourist traffic. And then there are the countless business people who fly from Toronto to reach new markets and potential partners around the globe. Small wonder that the airport’s overall economic impact amounts to more than $26 billion annually.
Socrates Furtado
SNC-Lavalin
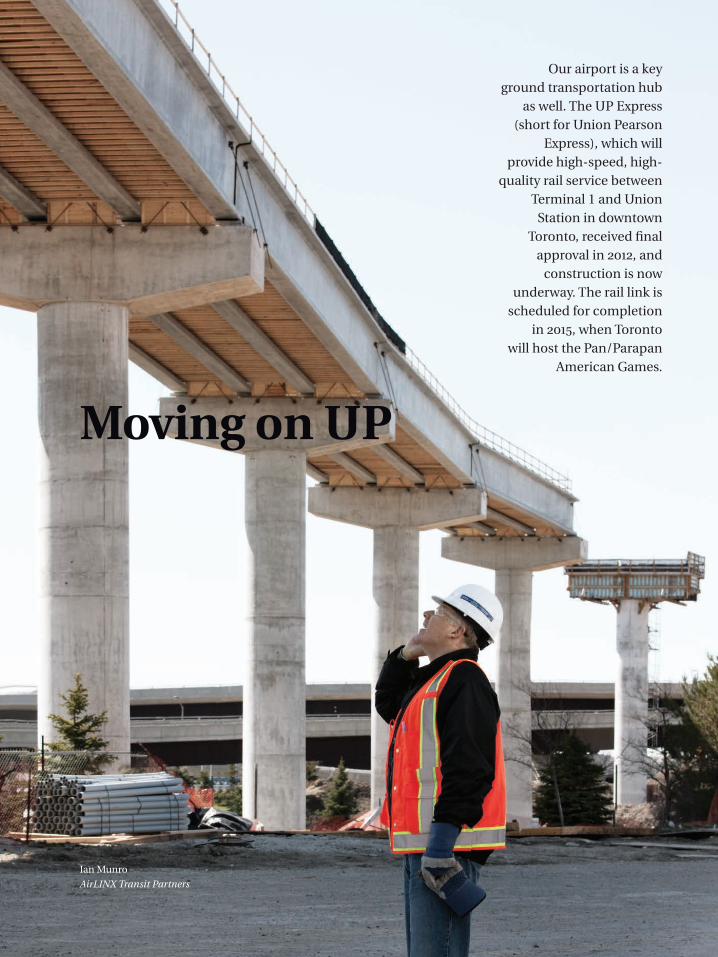
Moving on UP
Our airport is a key ground transportation hub
as well. The UP Express (short for Union Pearson
Express), which will provide high-speed, high-
quality rail service between Terminal 1 and Union
Station in downtown Toronto, received final
approval in 2012, and construction is now
underway. The rail link is scheduled for completion
in 2015, when Toronto will host the Pan/Parapan
American Games.
Ian Munro
AirLINX Transit Partners
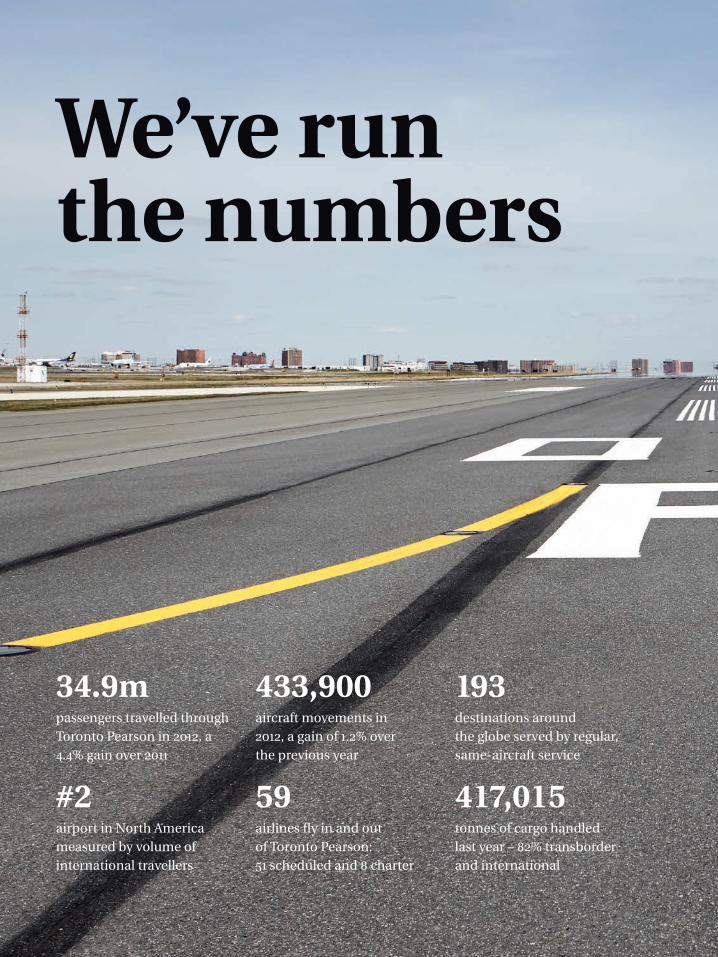
We’ve run the numbers
34.9m passengers travelled through Toronto Pearson in 2012, a 4.4% gain over 2011
#2 airport in North America measured by volume of international travellers
433,900 aircraft movements in 2012, a gain of 1.2% over the previous year
59 airlines fly in and out of Toronto Pearson: 51 scheduled and 8 charter
193 destinations around the globe served by regular, same-aircraft service
417,015 tonnes of cargo handled last year – 82% transborder and international
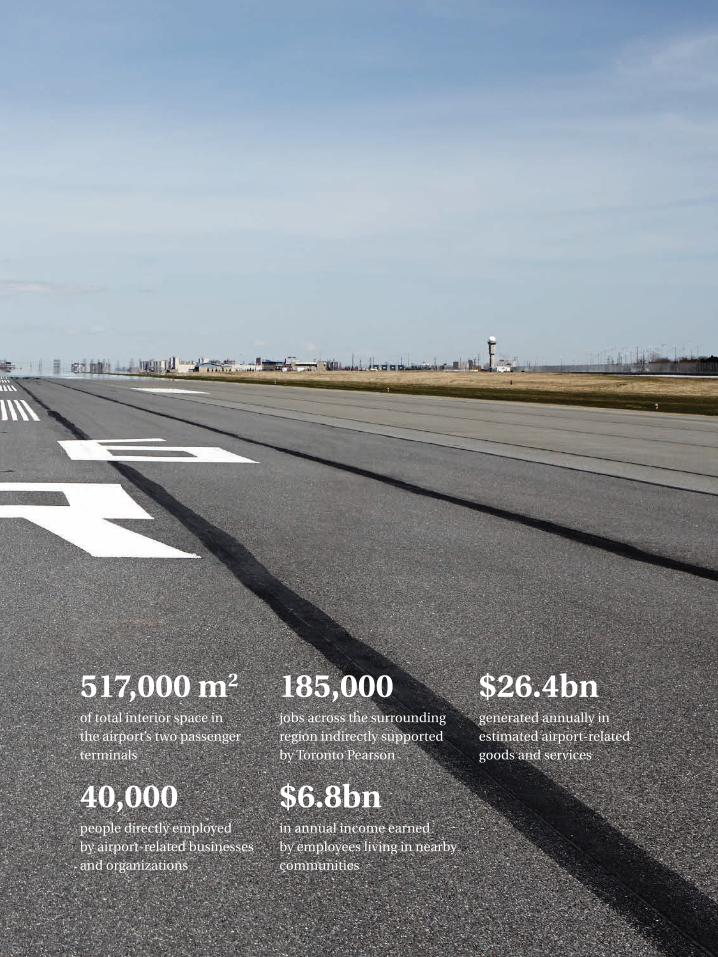
517,000 m2
of total interior space in the airport’s two passenger terminals
40,000 people directly employed by airport-related businesses and organizations
185,000 jobs across the surrounding region indirectly supported by Toronto Pearson
$6.8bn in annual income earned by employees living in nearby communities
$26.4bn
generated annually in estimated airport-related goods and services

For millions of travellers who arrive each year from around the globe, our airport is the gateway to Toronto, to Ontario and to all of Canada. We create the vital first impression of our vibrant multicultural city for anyone flying in from abroad, whether they’re visiting friends, reuniting with family or coming home after connecting with their roots overseas. Toronto Pearson is here to help local residents like Elizabeth Bunnah make her regular trips to Ghana to stay connected with family. And we welcome Elizabeth’s African relatives when they fly across the ocean to see her, along with daughter Summer and the new baby.
Getting from there
Elizabeth Bunnah and her daughter Summer

to here

Visible signs of support
Giving Families a Break
Enhancing the airport experience for people flying with children is another priority at Toronto Pearson. A case in point is our special focus on March Break, one of the busiest periods in the year for air travel. To help passengers feel welcome and comfortable, we invite them to create a customized online Family Trip Guide with shopping, dining and entertainment suggestions, plus security and check-in tips. On arriving at the airport, they’re greeted by volunteer employee ambassadors. And as they wait for their holiday flights, the kids can enjoy arts and crafts or let off steam in the play area in Lounge Q.
Olivia and Aleksandra Ritchie, Lounge Q patrons
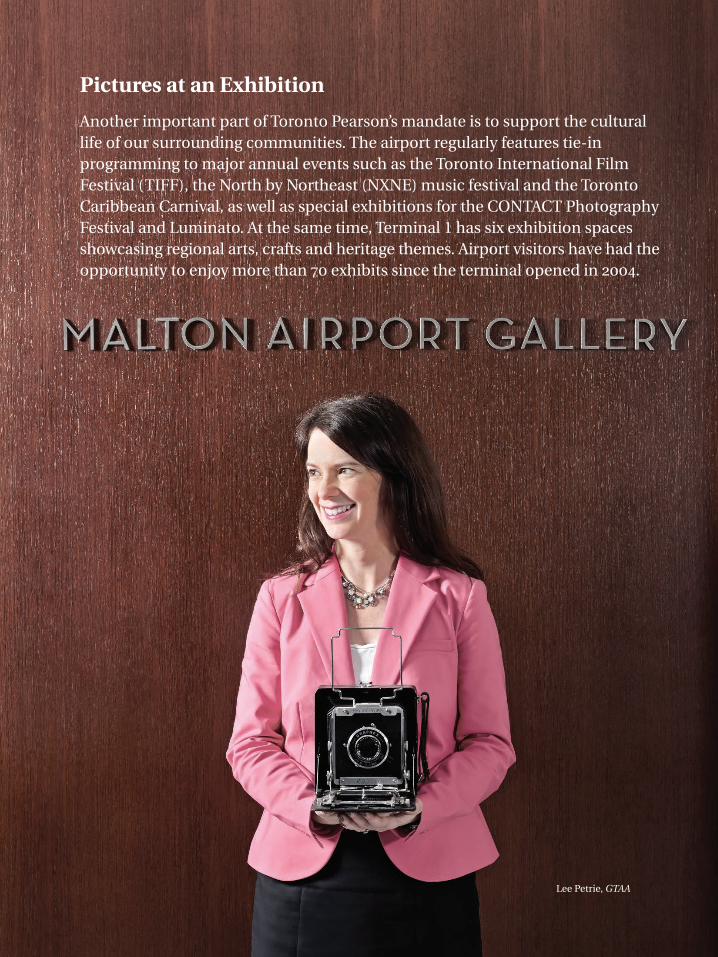
Pictures at an Exhibition
Another important part of Toronto Pearson’s mandate is to support the cultural life of our surrounding communities. The airport regularly features tie-in programming to major annual events such as the Toronto International Film Festival (TIFF), the North by Northeast (NXNE) music festival and the Toronto Caribbean Carnival, as well as special exhibitions for the CONTACT Photography Festival and Luminato. At the same time, Terminal 1 has six exhibition spaces showcasing regional arts, crafts and heritage themes. Airport visitors have had the opportunity to enjoy more than 70 exhibits since the terminal opened in 2004.
Lee Petrie, GTAA

Anticipating

…and ready to help in any way we can
every need
22 gtaa annual report 2012
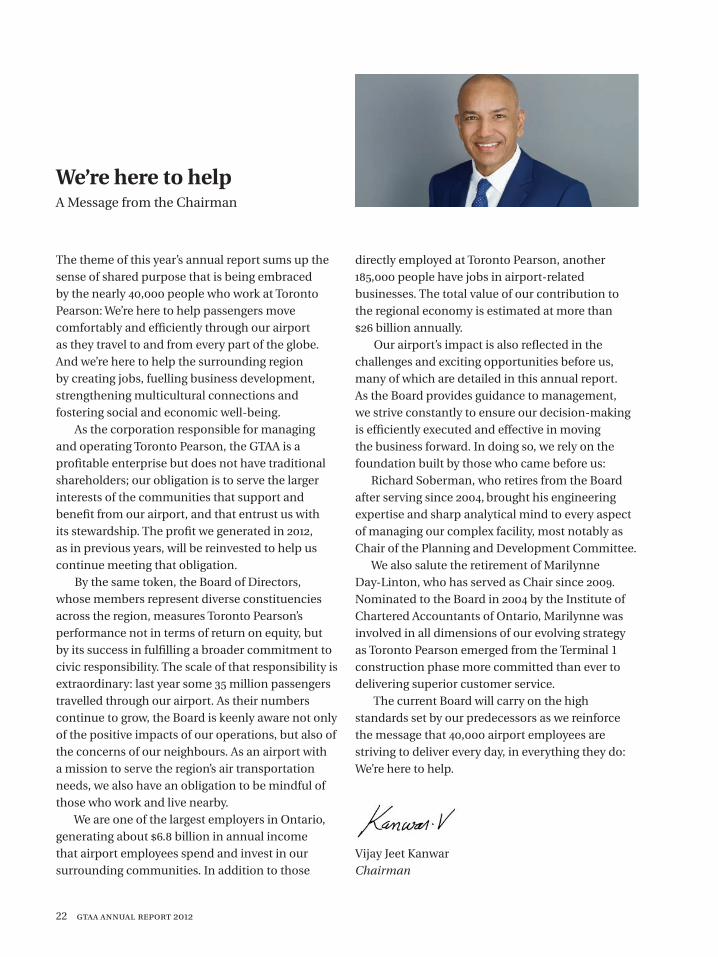
We’re here to helpA Message from the Chairman
The theme of this year’s annual report sums up the sense of shared purpose that is being embraced by the nearly 40,000 people who work at Toronto Pearson: We’re here to help passengers move comfortably and efficiently through our airport as they travel to and from every part of the globe. And we’re here to help the surrounding region by creating jobs, fuelling business development, strengthening multicultural connections and fostering social and economic well-being.
As the corporation responsible for managing and operating Toronto Pearson, the GTAA is a profitable enterprise but does not have traditional shareholders; our obligation is to serve the larger interests of the communities that support and benefit from our airport, and that entrust us with its stewardship. The profit we generated in 2012, as in previous years, will be reinvested to help us continue meeting that obligation.
By the same token, the Board of Directors, whose members represent diverse constituencies across the region, measures Toronto Pearson’s performance not in terms of return on equity, but by its success in fulfilling a broader commitment to civic responsibility. The scale of that responsibility is extraordinary: last year some 35 million passengers travelled through our airport. As their numbers continue to grow, the Board is keenly aware not only of the positive impacts of our operations, but also of the concerns of our neighbours. As an airport with a mission to serve the region’s air transportation needs, we also have an obligation to be mindful of those who work and live nearby.
We are one of the largest employers in Ontario, generating about $6.8 billion in annual income that airport employees spend and invest in our surrounding communities. In addition to those
directly employed at Toronto Pearson, another 185,000 people have jobs in airport-related businesses. The total value of our contribution to the regional economy is estimated at more than $26 billion annually.
Our airport’s impact is also reflected in the challenges and exciting opportunities before us, many of which are detailed in this annual report. As the Board provides guidance to management, we strive constantly to ensure our decision-making is efficiently executed and effective in moving the business forward. In doing so, we rely on the foundation built by those who came before us:
Richard Soberman, who retires from the Board after serving since 2004, brought his engineering expertise and sharp analytical mind to every aspect of managing our complex facility, most notably as Chair of the Planning and Development Committee.
We also salute the retirement of Marilynne Day-Linton, who has served as Chair since 2009. Nominated to the Board in 2004 by the Institute of Chartered Accountants of Ontario, Marilynne was involved in all dimensions of our evolving strategy as Toronto Pearson emerged from the Terminal 1 construction phase more committed than ever to delivering superior customer service.
The current Board will carry on the high standards set by our predecessors as we reinforce the message that 40,000 airport employees are striving to deliver every day, in everything they do: We’re here to help.
Vijay Jeet KanwarChairman
gtaa annual report 2012 23
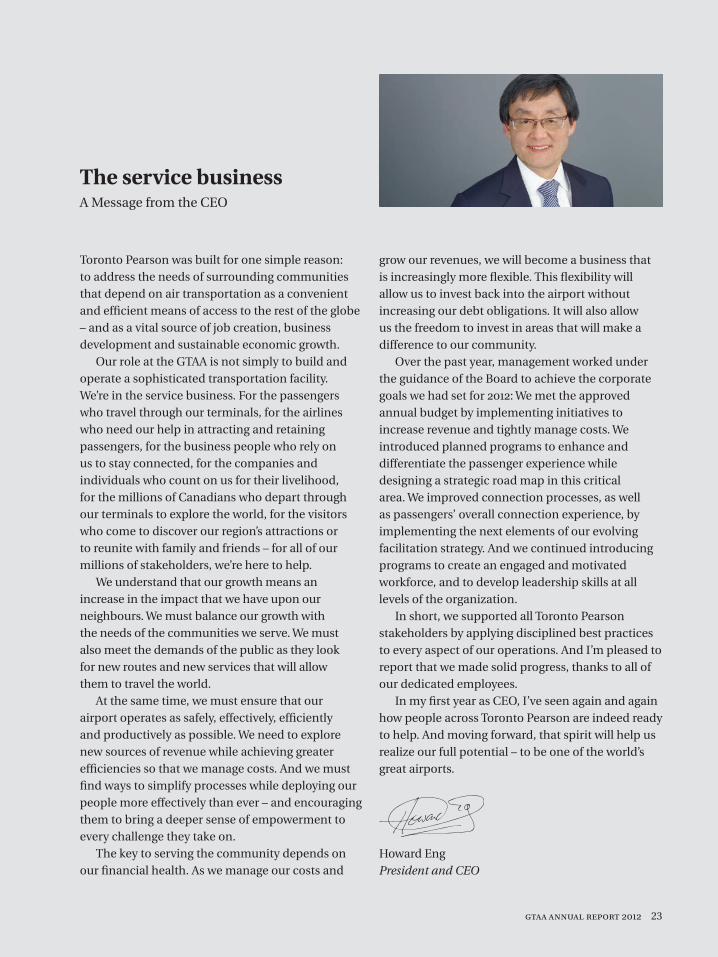
The service business A Message from the CEO
Toronto Pearson was built for one simple reason: to address the needs of surrounding communities that depend on air transportation as a convenient and efficient means of access to the rest of the globe – and as a vital source of job creation, business development and sustainable economic growth.
Our role at the GTAA is not simply to build and operate a sophisticated transportation facility. We’re in the service business. For the passengers who travel through our terminals, for the airlines who need our help in attracting and retaining passengers, for the business people who rely on us to stay connected, for the companies and individuals who count on us for their livelihood, for the millions of Canadians who depart through our terminals to explore the world, for the visitors who come to discover our region’s attractions or to reunite with family and friends – for all of our millions of stakeholders, we’re here to help.
We understand that our growth means an increase in the impact that we have upon our neighbours. We must balance our growth with the needs of the communities we serve. We must also meet the demands of the public as they look for new routes and new services that will allow them to travel the world.
At the same time, we must ensure that our airport operates as safely, effectively, efficiently and productively as possible. We need to explore new sources of revenue while achieving greater efficiencies so that we manage costs. And we must find ways to simplify processes while deploying our people more effectively than ever – and encouraging them to bring a deeper sense of empowerment to every challenge they take on.
The key to serving the community depends on our financial health. As we manage our costs and
grow our revenues, we will become a business that is increasingly more flexible. This flexibility will allow us to invest back into the airport without increasing our debt obligations. It will also allow us the freedom to invest in areas that will make a difference to our community.
Over the past year, management worked under the guidance of the Board to achieve the corporate goals we had set for 2012: We met the approved annual budget by implementing initiatives to increase revenue and tightly manage costs. We introduced planned programs to enhance and differentiate the passenger experience while designing a strategic road map in this critical area. We improved connection processes, as well as passengers’ overall connection experience, by implementing the next elements of our evolving facilitation strategy. And we continued introducing programs to create an engaged and motivated workforce, and to develop leadership skills at all levels of the organization.
In short, we supported all Toronto Pearson stakeholders by applying disciplined best practices to every aspect of our operations. And I’m pleased to report that we made solid progress, thanks to all of our dedicated employees.
In my first year as CEO, I’ve seen again and again how people across Toronto Pearson are indeed ready to help. And moving forward, that spirit will help us realize our full potential – to be one of the world’s great airports.
Howard EngPresident and CEO

24 gtaa annual report 2012
VIJAY JEET KANWARChairman (Jan. 1, 2013)
Vijay Kanwar is President and Chief Financial Officer of K.M.H. Cardiology and Diagnostic Centres Inc., North America’s largest provider of nuclear cardiology services.Appointed by the Province of Ontario
IAN L.T. CLARKEIan Clarke is Executive Vice President and Chief Financial Officer, Business Development, of Maple Leaf Sports and Entertainment Limited, Canada’s pre-eminent leader in delivering top-quality sports and entertainment experiences. Nominated by the Region of Durham
SCOTT R. COLEScott Cole, P.Eng., is Chairman and CEO of Cole Engineering Group Ltd., a civil engineering company.Nominated by the Regional
Municipality of York
DANIELLE M. WATERSDanielle Waters is the Managing Director of BCD Travel, a leading global travel management company, and the Principal of Water’s Edge Consulting, a private practice specializing in sales effectiveness, strategic planning and loyalty travel management.Community Member
NORMAN B. LOBERGNorman Loberg is a retired Enbridge Inc. senior executive. He is currently Chairman and Director of Enersource Inc. and is a director of several publicand private sector boards.Community Member
W. DOUGLAS ARMSTRONGDouglas Armstrong is a retired executive and served as a board member for a number of professional and community service committees.Appointed by the Government of Canada
POONAM PURIPoonam Puri is an AssociateDean, Research, GraduateStudies and InstitutionalRelations, at Osgoode HallLaw School, York University;Associate Director, HennickCentre for Business and Law;and Head of Research andPolicy, Capital Markets Institute,Rotman School of Management,University of Toronto.Community Member
MARILYNNE E. DAY-LINTONChair (Jan. 1/09–Dec. 31/12)
Marilynne Day-Linton is a chartered accountant with an extensive background in the travel industry. She also served as a director of several not-for-profit boards.Named Community Member
(LEFT TO RIGHT)
Board of Directors
gtaa annual report 2012 25
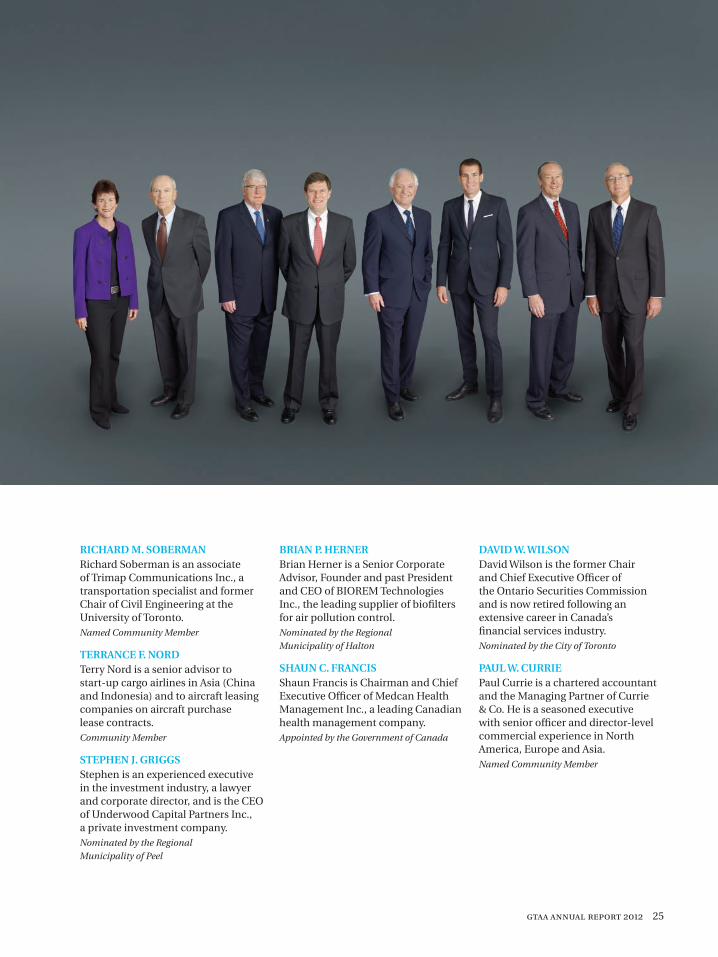
RICHARD M. SOBERMANRichard Soberman is an associate of Trimap Communications Inc., a transportation specialist and former Chair of Civil Engineering at the University of Toronto. Named Community Member
TERRANCE F. NORDTerry Nord is a senior advisor to start-up cargo airlines in Asia (China and Indonesia) and to aircraft leasing companies on aircraft purchase lease contracts.Community Member
STEPHEN J. GRIGGSStephen is an experienced executive in the investment industry, a lawyer and corporate director, and is the CEO of Underwood Capital Partners Inc., a private investment company.Nominated by the Regional
Municipality of Peel
BRIAN P. HERNERBrian Herner is a Senior Corporate Advisor, Founder and past President and CEO of BIOREM Technologies Inc., the leading supplier of biofilters for air pollution control.Nominated by the Regional
Municipality of Halton
SHAUN C. FRANCISShaun Francis is Chairman and Chief Executive Officer of Medcan Health Management Inc., a leading Canadian health management company.Appointed by the Government of Canada
DAVID W. WILSONDavid Wilson is the former Chair and Chief Executive Officer of the Ontario Securities Commission and is now retired following an extensive career in Canada’s financial services industry.Nominated by the City of Toronto
PAUL W. CURRIEPaul Currie is a chartered accountant and the Managing Partner of Currie & Co. He is a seasoned executive with senior officer and director-level commercial experience in North America, Europe and Asia.Named Community Member
26 gtaa annual report 2012
OUR VISIONToronto Pearson will be North America’s premier portal to a world of possibilities.
OUR MISSIONTogether, we will attract, serve and delight our customers by consistentlydelivering value through innovative products and services.
OUR VALUESIntegrity: Say what you mean; mean what you say.Accountability: Walk the talk.Pursuit of excellence: Reach higher.Collaboration/teamwork: Stronger together.Stewardship: Responsibility to others.
OUR BELIEFSWe believe our employees are our most valuable asset.We will succeed by consistently exceeding our customers’ expectations.We are responsible leaders of the community we serve.We make safety and security our top priorities.We are proud of our airport and passionate about aviation.
Executive Team

gtaa annual report 2012 27
HOWARD ENGPresident and Chief Executive OfficerAs of March 29, 2012
J. HOWARD BOHANVice President, Aviation Services
NICOLE DESLOGESVice President, People and Culture
BRIAN P. GABELVice President and Chief Financial Officer
PAMELA GRIFFITH-JONESVice President, Guest and Terminal Services
TOBY C. D. LENNOXVice President, Strategy Development and Stakeholder Relations
SELMA LUSSENBURGVice President, Governance and Legal, General Counsel and Corporate Secretary As of January 21, 2013
PATRICK C. NEVILLEVice President, Airport Planning and Technical Services
(not pictured)
DOUGLAS A. LOVEVice President, General Counsel and Secretary Retired as of January 16, 2013
LLOYD A. McCOOMBPresident and Chief Executive OfficerRetired as of April 30, 2012
(LEFT TO RIGHT)
28 gtaa annual report 2012
The GTAA was incorporated in 1993 as a nonshare capital corporation pursuant to Part II of the Canada Corporations Act. As a corporation without share capital, the organization has Members rather than shareholders or other equity holders.
The GTAA is governed by a 15-Member Board. These Directors serve a term of three years and are eligible to be reappointed subject to a maximum of nine years.
Five Directors are appointed from municipal candidates. Each of the Regional Municipalities of York, Halton, Peel and Durham and the City of Toronto is entitled to provide, on a rotating basis, the names of three candidates, and the Board appoints one of the three candidates for each available position as a Director.
In addition, in 2009 the GTAA amended its Bylaws such that seven Directors are appointed by the Board on a cyclical basis from a pool of eligible candidates generated by a search process which includes: the Law Society of Upper Canada, Professional Engineers Ontario, the Institute of Chartered Accountants of Ontario, the Toronto Board of Trade, the Board of Trade of the City of Mississauga and the Board of Trade of the City of Brampton.
Finally, the Government of Canada and the Province of Ontario are entitled to appoint two Directors and one Director, respectively. All members of the GTAA’s Board are independent, as that term is defined in the applicable securities legislation.
The GTAA’s Board meets on a regular basis and views its principal responsibility as overseeing the
conduct of the business of the GTAA and setting the strategic direction for the GTAA. The Board ensures that long-term goals and the strategies necessary to achieve them are established and are consistent with the GTAA’s vision.
The Board also ensures that the necessary systems are in place to manage the risks associated with the GTAA’s business and to monitor and measure management’s performance in carrying out the GTAA’s objectives.
In 2012 there were five standing committees of the Board: the Audit Committee; the Corporate Governance and Nominating Committee; the Environment, Safety, Security and Stakeholder Relations Committee; the Human Resources and Compensation Committee; and the Planning and Commercial Development Committee. The mandates of each Committee of the Board are as follows:
Audit Committee
The Audit Committee’s mandate is to fulfill the legal obligations that apply to audit committees and to assist the Board in fulfilling its oversight responsibilities with respect to financial reporting, accounting, auditing and internal controls. In so doing, the Committee reviews all aspects of the GTAA’s financial and accounting management procedures and oversees the integrity of the GTAA’s financial statements and financial reporting process. It also oversees the work of the GTAA’s external auditors engaged for the purpose of preparing or issuing an auditors’ report, overseeing the qualifications and independence of the external auditors and providing an open avenue of
Corporate Governance
The GTAA management team reports to a board of directors that is uniquely representative of The surrounding community. Directors are chosen for their ability to reflect their constituencies, as well as for the special skills they bring to overseeing a complex, industry-leading enterprise with significant social and economic impact.
gtaa annual report 2012 29
communication between the senior management of the GTAA, the external auditors, the internal auditors, and the members of the Board and Committees of the Board.
In addition, the Committee reviews the risk management and insurance programs to minimizerisk and exposure and ensure compliance with the insurance requirements under the Ground Lease and the Master Trust Indenture. Finally, the Committee monitors and assesses the performance of pension fund asset managers. A written copy of the Charter of the Audit Committee is attached to the GTAA’s Annual Information Form, which may be accessed at www.sedar.com.
Corporate Governance andNominating Committee
The Corporate Governance and Nominating Committee is charged with the development, recommendation to the Board, implementation and assessment of effective corporate governance principles. The Committee also is responsible for developing and reviewing the roles and responsibilities of the Board, the Chair of the Board and the President and Chief Executive Officer, overseeing the nomination process, recommending candidates for appointment as Directors, establishing an orientation program for new Directors, reviewing the terms of reference of Board Committees, reviewing management succession policies, assessing the effectiveness of the Board and the Committees of the Board, and ensuring compliance with corporate governance requirements.
Environment, Safety, Security andStakeholder Relations Committee
The Environment, Safety, Security and Stakeholder Relations Committee’s mandate includes providing leadership and oversight of matters pertaining to the GTAA’s relationships with government, the community and stakeholders, its strategic
communications program relating to such relationships, the environment, public safety, airport security, the GTAA’s internal security, airport operations, emergency preparedness, and corporate social responsibility practices and reporting.
Human Resources and Compensation CommitteeThe Human Resources and Compensation Committee’s mandate is to oversee matters related to the GTAA’s human resources strategy, including occupational health and safety, hiring, employee training and development, succession planning for key management positions, the GTAA’s compensation and benefit policies, recruitment and compensation matters relating to the President and Chief Executive Officer, officers and management, and matters relating to regulatory disclosure of compensation.
Planning and Commercial Development CommitteeThe Planning and Commercial Development Committee’s mandate includes oversight of the GTAA’s commercial development of the Airport, business and marketing strategy, planning, development and utilization of infrastructure and facilities to meet the needs of the GTAA’s customers and stakeholders including air carriers, passengers and cargo shippers. It also is responsible for ensuring that the GTAA has an appropriate, up-to-date and approved master plan, and that the GTAA has in place the management systems necessary to undertake such matters.
30 gtaa annual report 2012
Forward-Looking Information This Management’s Discussion and Analysis (“MD&A”) contains certain forward-looking information. This forward-looking information is based on a variety of assumptions and is subject to risks and uncertainties. Please refer to the section titled “Caution Regarding Forward-Looking Information” contained at the end of this MD&A for a discussion of such risks and uncertainties and the material factors and assumptions related to the forward-looking information.
This report discusses the financial and operating results of the Greater Toronto Airports Authority (“GTAA”) for the year ended December 31, 2012, and should be read in conjunction with the Financial Statements of the GTAA for the years ended December 31, 2012 and 2011, and the Annual Information Form for the year ended December 31, 2012. These documents provide additional information on certain matters that may or may not be discussed in this report. Additional information relating to the GTAA, including the Annual Information Form and the Financial Statements referred to above, is available on SEDAR at www.sedar.com. The GTAA’s Financial Statements and MD&A are also available on its website at www.torontopearson.com.
Management’s Discussion and Analysisfor the year ended december 31, 2012
Dated March 27, 2013
gtaa annual report 2012 31
CORPORATE PROFILE
The GTAA was incorporated in March 1993 as a corporation without share capital and recognized as a Canadian Airport Authority by the federal government in November 1994. The GTAA is authorized to operate airports within the south-central Ontario region, including the Greater Toronto Area (“GTA”), on a commercial basis, to set fees for their use and to develop and improve the facilities. In accordance with this mandate, the GTAA currently manages and operates Toronto Pearson International Airport (the “Airport” or “Toronto Pearson”).
The responsibilities of the GTAA for the operation, management and development of Toronto Pearson are set out in the ground lease with the federal government, which was executed in December 1996 (the “Ground Lease”). The Ground Lease has a term of 60 years, with one renewal term of 20 years. The Ground Lease is available on SEDAR at www.sedar.com and on the GTAA’s website at www.torontopearson.com. The GTAA’s priorities are to operate a safe, secure and efficient airport and to ensure that the facilities provide the necessary services, amenities and capacity for current and future air travel requirements for the region.
BUSINESS STRATEGY
The GTAA is focused on providing quality aviation facilities and services for air carriers, passengers and other users of Toronto Pearson. The Airport now has sufficient capacity to meet projected air travel demands for several years. Over this period additional investment will be related to repair and maintenance, operational and passenger processing improvements or to generate additional non-aeronautical revenues, all within existing facilities. As outlined in the GTAA’s Airport Master Plan covering the 2008 to 2030 period (available on the GTAA’s website at www.torontopearson.com), new capital expenditures and financing activities may be required by the GTAA over the term of the plan to increase the Airport’s overall capacity to meet the anticipated air travel needs of the region. This development will be undertaken only as appropriate in response to increases in air travel demand.
In 2011 the GTAA approved its latest five-year Strategic Plan. The GTAA’s vision statement – “Toronto Pearson will be North America’s premier portal to a world of possibilities” – and its mission statement – “Together, we will attract, serve and delight our customers by consistently delivering value through innovative products and services” – reflect the GTAA’s commitment to customer service and achieving its goal of becoming the premier North American gateway airport.
The principal areas of strategic focus by the GTAA are:• ensuring long-term sustainability;• achieving operational excellence;• empowering employees to deliver value to GTAA’s customers and other stakeholders;• growing through innovation and leveraging assets; and • developing an air and ground mobility hub.
This strategic focus, including an increased customer focus, together with the values of the GTAA and its employees, will guide the corporate activities, that the GTAA believes are required to meet its goals and the air travel needs of the region.
32 gtaa annual report 2012
RECENT EVENTS
Certain events transpired in 2012 that had an impact on the GTAA’s operations or financial results or that may have an impact on future results.
Effective January 1, 2012, the GTAA implemented its aeronautical fees for 2012. The combined impact of the aeronautical fee changes was an overall fee reduction of approximately 2.5 per cent in 2012 compared to the overall 2011 aeronautical fees. This fee decrease represented the fifth consecutive year that the GTAA has reduced or maintained aeronautical fees as part of its strategy to become more competitive on a cost basis.
On January 30, 2012, the $500 million Series 2002-1 Medium Term Notes (”MTNs”) matured and were repaid using cash on hand, which included proceeds from the December 2, 2011 issuance of $400 million Series 2011-2 MTNs and certain reserve funds.
Effective March 29, 2012, Mr. Howard Eng was appointed the GTAA’s President and Chief Executive Officer (“CEO”), succeeding Dr. Lloyd McCoomb who retired. Mr. Eng returned to Canada after having worked at Hong Kong International Airport since 1995, most recently as that airport’s Executive Director, Airport Operations. Prior to moving to Hong Kong, Mr. Eng worked as Vice President of Operations, at Edmonton International Airport, both with Transport Canada and the Edmonton Airport Authority.
On September 21, 2012, the GTAA issued $400 million of Series 2012-1 MTNs with a term of 10 years and a coupon rate of 3.04 per cent. Proceeds of the offering, together with certain reserve funds, were used to repay the $475 million Series 2002-2 MTNs which matured on December 13, 2012 and to fund capital expenditures and required reserve funds.
On November 26, 2012, the GTAA announced its aeronautical fees for 2013. The new fees became effective January 1, 2013 (February 1, 2013 in the case of the apron fee). The combined impact of the new aeronautical fees is a reduction of approximately 10 per cent in overall aeronautical fees compared to overall 2012 aeronautical fees, when measured as the average air carrier cost per enplaned passenger (the amount that air carriers pay to the GTAA expressed as a per-passenger rate). The continued growth in airline and passenger traffic, and GTAA’s continuing commitment to increase non-aeronautical revenues and manage operating expenses are reflected in the reduction in the average air carrier cost per enplaned passenger, which began in 2008 and is expected to continue throughout 2013.
Subsequent to December 31, 2012, during the month of March 2013, the GTAA purchased 12.7 hectares of land from Boeing Canada Operations Ltd. (“Boeing”) for approximately $9.5 million. The GTAA entered into an agreement with Boeing in 2001 to purchase, in stages, 45.7 hectares of land adjacent to the Airport property for a total of $30 million. This represents the third parcel of land transferred under this agreement. All lands purchased under this agreement by the GTAA have been transferred to the federal government, as required under the terms of the Ground Lease. Each parcel of land was subject to environmental remediation by Boeing prior to transfer to the federal government. Given the certainty of its occurrence, this land purchase and its subsequent transfer to the federal government have been recorded in intangibles and other assets on the statement of financial position as at December 31, 2012. There remains approximately 2.1 hectares of land to be purchased from Boeing at an estimated cost of $2 million.
MANAGEMENT’S DISCUSSION AND ANALYSIS
gtaa annual report 2012 33
OPERATING ACTIVITY
The GTAA monitors passenger activity levels and aircraft movements, including the type and size of aircraft, as both passenger and aircraft activity have a direct impact on its financial results. During 2012, air carriers serving Toronto Pearson increased service (on a net basis) on a total of 45 routes, representing either completely new service or an increased capacity on existing routes.
In January 2010, the GTAA introduced an air service incentive program offering rebates on landing fees to air carriers that provided new air service from Toronto Pearson to select unserved or underserved destinations, provided they achieved certain growth thresholds. Before this incentive program expired on December 31, 2011, certain qualifying air carriers took advantage of the incentives and launched new service on 10 of the most desirable unserved routes from Toronto Pearson. During 2012, the GTAA implemented two new air service incentive programs to attract new international air carriers to Toronto Pearson and to reward existing air carriers who increase their passenger volumes. In 2013, the GTAA’s air service incentive program targets the introduction of new international air carriers to Toronto Pearson. The GTAA believes that its air service incentive programs have been influential in air carriers’ decisions to add new routes or increase seat capacity on existing routes.
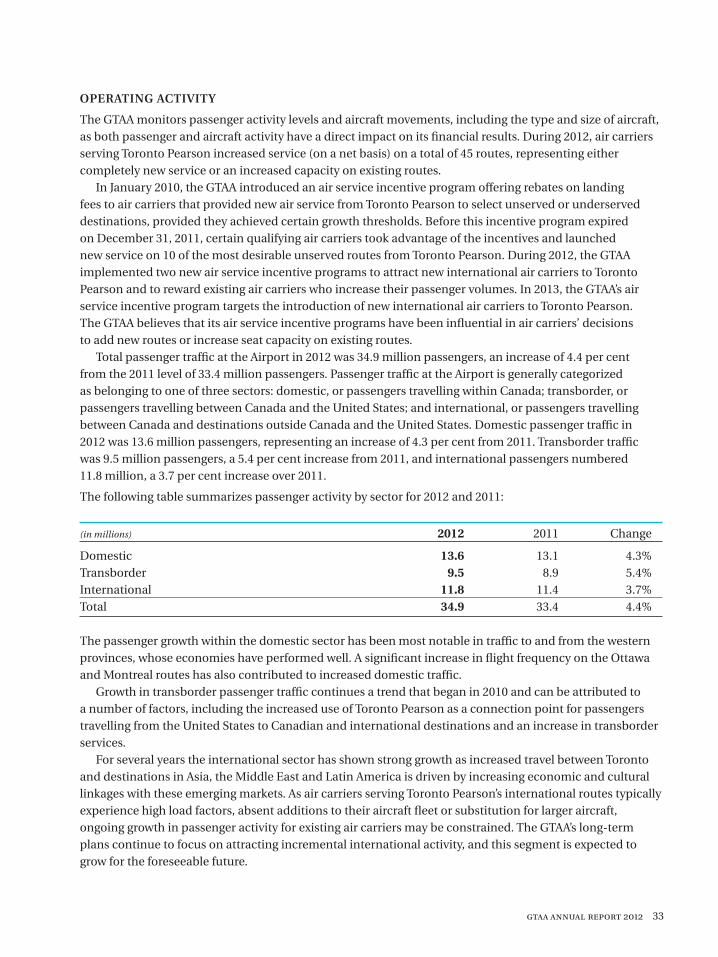
Total passenger traffic at the Airport in 2012 was 34.9 million passengers, an increase of 4.4 per cent from the 2011 level of 33.4 million passengers. Passenger traffic at the Airport is generally categorized as belonging to one of three sectors: domestic, or passengers travelling within Canada; transborder, or passengers travelling between Canada and the United States; and international, or passengers travelling between Canada and destinations outside Canada and the United States. Domestic passenger traffic in 2012 was 13.6 million passengers, representing an increase of 4.3 per cent from 2011. Transborder traffic was 9.5 million passengers, a 5.4 per cent increase from 2011, and international passengers numbered 11.8 million, a 3.7 per cent increase over 2011.
The following table summarizes passenger activity by sector for 2012 and 2011:
(in millions) 2012 2011 Change
Domestic 13.6 13.1 4.3%Transborder 9.5 8.9 5.4%International 11.8 11.4 3.7%Total 34.9 33.4 4.4%
The passenger growth within the domestic sector has been most notable in traffic to and from the western provinces, whose economies have performed well. A significant increase in flight frequency on the Ottawa and Montreal routes has also contributed to increased domestic traffic.
Growth in transborder passenger traffic continues a trend that began in 2010 and can be attributed to a number of factors, including the increased use of Toronto Pearson as a connection point for passengers travelling from the United States to Canadian and international destinations and an increase in transborder services.
For several years the international sector has shown strong growth as increased travel between Toronto and destinations in Asia, the Middle East and Latin America is driven by increasing economic and cultural linkages with these emerging markets. As air carriers serving Toronto Pearson’s international routes typically experience high load factors, absent additions to their aircraft fleet or substitution for larger aircraft, ongoing growth in passenger activity for existing air carriers may be constrained. The GTAA’s long-term plans continue to focus on attracting incremental international activity, and this segment is expected to grow for the foreseeable future.
34 gtaa annual report 2012
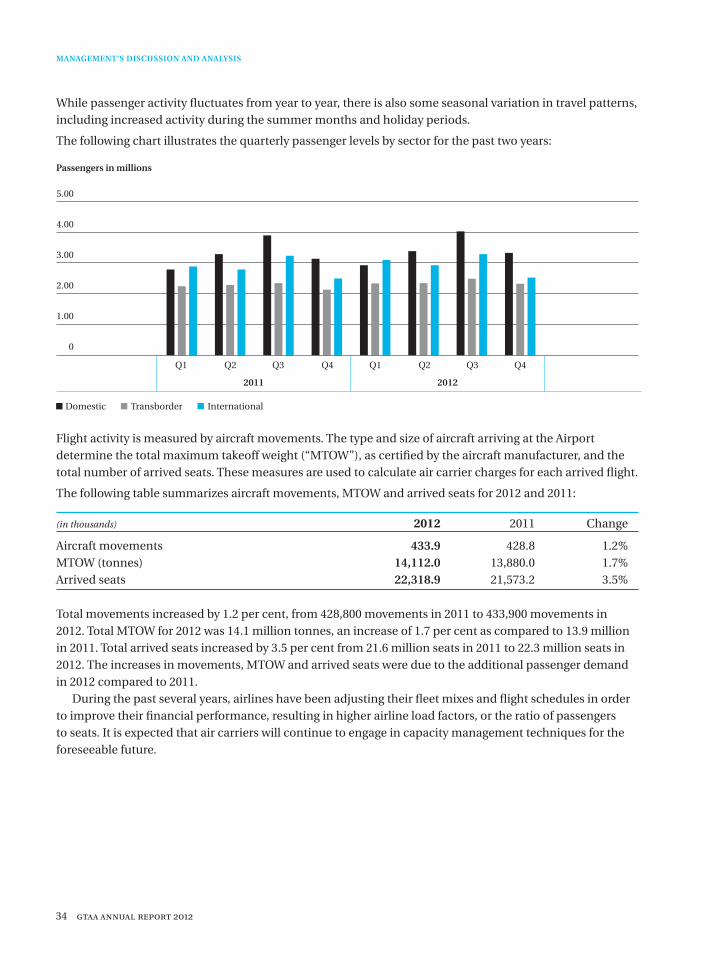
While passenger activity fluctuates from year to year, there is also some seasonal variation in travel patterns, including increased activity during the summer months and holiday periods.
The following chart illustrates the quarterly passenger levels by sector for the past two years:
Passengers in millions
Flight activity is measured by aircraft movements. The type and size of aircraft arriving at the Airport determine the total maximum takeoff weight (“MTOW”), as certified by the aircraft manufacturer, and the total number of arrived seats. These measures are used to calculate air carrier charges for each arrived flight.
The following table summarizes aircraft movements, MTOW and arrived seats for 2012 and 2011:
(in thousands) 2012 2011 Change
Aircraft movements 433.9 428.8 1.2%MTOW (tonnes) 14,112.0 13,880.0 1.7%Arrived seats 22,318.9 21,573.2 3.5%
Total movements increased by 1.2 per cent, from 428,800 movements in 2011 to 433,900 movements in 2012. Total MTOW for 2012 was 14.1 million tonnes, an increase of 1.7 per cent as compared to 13.9 million in 2011. Total arrived seats increased by 3.5 per cent from 21.6 million seats in 2011 to 22.3 million seats in 2012. The increases in movements, MTOW and arrived seats were due to the additional passenger demand in 2012 compared to 2011.
During the past several years, airlines have been adjusting their fleet mixes and flight schedules in order to improve their financial performance, resulting in higher airline load factors, or the ratio of passengers to seats. It is expected that air carriers will continue to engage in capacity management techniques for the foreseeable future.
MANAGEMENT’S DISCUSSION AND ANALYSIS
5.00
4.00
3.00
2.00
1.00
0
Domestic Transborder International
Q1 Q2 Q3 Q4 Q1 Q2 Q3 Q4
2011 2012
gtaa annual report 2012 35
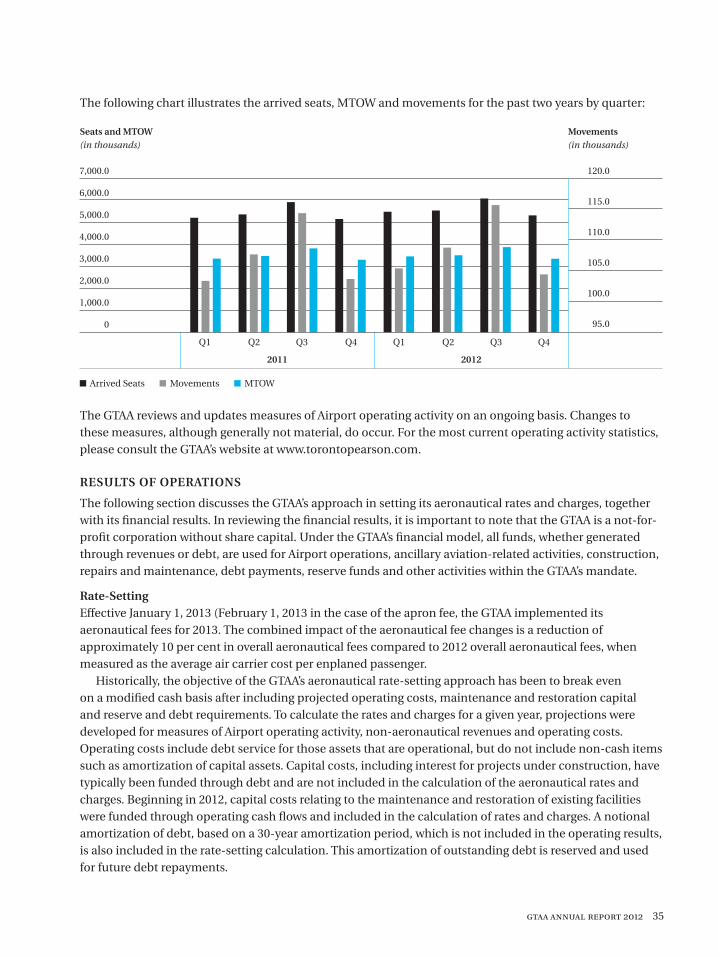
The following chart illustrates the arrived seats, MTOW and movements for the past two years by quarter:
Seats and MTOW Movements (in thousands) (in thousands)
The GTAA reviews and updates measures of Airport operating activity on an ongoing basis. Changes to these measures, although generally not material, do occur. For the most current operating activity statistics, please consult the GTAA’s website at www.torontopearson.com.
RESULTS OF OPERATIONS
The following section discusses the GTAA’s approach in setting its aeronautical rates and charges, together with its financial results. In reviewing the financial results, it is important to note that the GTAA is a not-for-profit corporation without share capital. Under the GTAA’s financial model, all funds, whether generated through revenues or debt, are used for Airport operations, ancillary aviation-related activities, construction, repairs and maintenance, debt payments, reserve funds and other activities within the GTAA’s mandate.
Rate-SettingEffective January 1, 2013 (February 1, 2013 in the case of the apron fee, the GTAA implemented its aeronautical fees for 2013. The combined impact of the aeronautical fee changes is a reduction of approximately 10 per cent in overall aeronautical fees compared to 2012 overall aeronautical fees, when measured as the average air carrier cost per enplaned passenger.
Historically, the objective of the GTAA’s aeronautical rate-setting approach has been to break even on a modified cash basis after including projected operating costs, maintenance and restoration capital and reserve and debt requirements. To calculate the rates and charges for a given year, projections were developed for measures of Airport operating activity, non-aeronautical revenues and operating costs. Operating costs include debt service for those assets that are operational, but do not include non-cash items such as amortization of capital assets. Capital costs, including interest for projects under construction, have typically been funded through debt and are not included in the calculation of the aeronautical rates and charges. Beginning in 2012, capital costs relating to the maintenance and restoration of existing facilities were funded through operating cash flows and included in the calculation of rates and charges. A notional amortization of debt, based on a 30-year amortization period, which is not included in the operating results, is also included in the rate-setting calculation. This amortization of outstanding debt is reserved and used for future debt repayments.
7,000.0
6,000.0
5,000.0
4,000.0
3,000.0
2,000.0
1,000.0
0
120.0
115.0
110.0
105.0
100.0
95.0
Arrived Seats Movements MTOW
Q1 Q2 Q3 Q4 Q1 Q2 Q3 Q4
2011 2012
36 gtaa annual report 2012
MANAGEMENT’S DISCUSSION AND ANALYSIS
Beginning in 2013, the GTAA has transitioned from the residual rate-setting methodology described above, to a rate-setting methodology that targets levels of cash flow sufficient not only to fund operating expenses and maintenance and restoration capital expenditures but also, in most years, to fund other capital investments and debt repayment.
In 2012 the GTAA’s aeronautical revenues comprised the following: the landing fee based on the aircraft’s MTOW, the general terminal charge based on the number of seats of an arriving aircraft, the turnaround fee charged for the use of terminal facilities to gate aircraft, and the counter fee charged for the use of check-in counters in the terminals. For financial statement presentation purposes, revenues from the turnaround and counter fees are classified as general terminal charges.
The GTAA has made significant changes in its aeronautical fee regime for 2013. The landing fee and general terminal charge remain in place, while effective February 1, 2013, the turnaround fee has been replaced by an apron fee. In addition, the method of calculating the landing fee and general terminal charge has changed.
These changes have arisen as a result of an extensive cost allocation exercise undertaken in 2012 to better match costs to specific assets and operations. This exercise has resulted in a decrease in the costs allocated to the airfield and an increase in the costs allocated to the terminals as debt service, ground rent, payments-in-lieu of real property taxes (“PILT”) and some operating costs were more appropriately allocated between the airfield and the terminals. The landing fee and general terminal charge are set at levels to recover costs allocated to the airfield and terminals respectively, based on projections of aviation activity. The reallocation of costs has, accordingly, resulted in a decrease in the 2013 landing fee and an increase in the 2013 general terminal charge when compared to the rates in effect in 2012.
On February 1, 2013 the turnaround fee was replaced by an apron fee. The turnaround fee recovered costs associated with certain portions of the terminal, as well as the aircraft gates and bridges and the apron area. The apron fee will recover only the costs associated with the apron and the aircraft gates and bridges. Like the turnaround fee, the apron fee is designed to encourage efficient use of apron and gate assets by the air carriers. For financial statement presentation purposes, revenues from the apron fee will be classified as landing fees.
In 2013, the GTAA intends to replace the counter fee with a commercially based check-in fee for the usage of check-in counters and self-service check-in kiosks located in the terminals. The existing counter fee is charged based on seasonal licences for eligible carriers or an hourly rate charged in 15-minute intervals. The new check-in fee will not provide licensing opportunities and will be charged in a manner to improve check-in facility utilization and customer service. While the counter fee was included in aeronautical revenue, the check-in fee revenue, when implemented, will be included in non-aeronautical revenue.
The GTAA’s cash flow projections take into account projections for activity, rates and charges and aeronautical and non-aeronautical revenues and expenses. Any excess cash flow is reinvested in the Airport for new initiatives to improve Airport operations and customer service, to fund capital projects or to repay existing debt. The GTAA expects to generate sufficient cash flow such that over the next five years, the cash flow will be used to fund most, if not all, capital expenditures. Large capital programs may, however, require debt funding.
gtaa annual report 2012 37
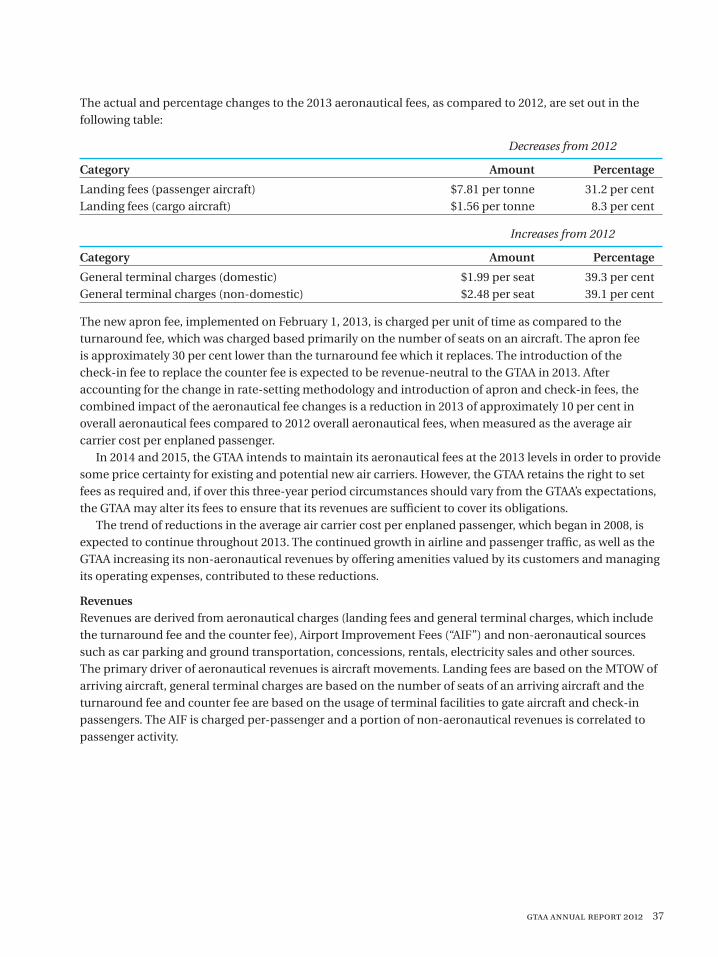
The actual and percentage changes to the 2013 aeronautical fees, as compared to 2012, are set out in the following table:
Decreases from 2012
Category Amount Percentage
Landing fees (passenger aircraft) $7.81 per tonne 31.2 per centLanding fees (cargo aircraft) $1.56 per tonne 8.3 per cent
Increases from 2012
Category Amount Percentage
General terminal charges (domestic) $1.99 per seat 39.3 per centGeneral terminal charges (non-domestic) $2.48 per seat 39.1 per cent
The new apron fee, implemented on February 1, 2013, is charged per unit of time as compared to the turnaround fee, which was charged based primarily on the number of seats on an aircraft. The apron fee is approximately 30 per cent lower than the turnaround fee which it replaces. The introduction of the check-in fee to replace the counter fee is expected to be revenue-neutral to the GTAA in 2013. After accounting for the change in rate-setting methodology and introduction of apron and check-in fees, the combined impact of the aeronautical fee changes is a reduction in 2013 of approximately 10 per cent in overall aeronautical fees compared to 2012 overall aeronautical fees, when measured as the average air carrier cost per enplaned passenger.
In 2014 and 2015, the GTAA intends to maintain its aeronautical fees at the 2013 levels in order to provide some price certainty for existing and potential new air carriers. However, the GTAA retains the right to set fees as required and, if over this three-year period circumstances should vary from the GTAA’s expectations, the GTAA may alter its fees to ensure that its revenues are sufficient to cover its obligations.
The trend of reductions in the average air carrier cost per enplaned passenger, which began in 2008, is expected to continue throughout 2013. The continued growth in airline and passenger traffic, as well as the GTAA increasing its non-aeronautical revenues by offering amenities valued by its customers and managing its operating expenses, contributed to these reductions.
RevenuesRevenues are derived from aeronautical charges (landing fees and general terminal charges, which include the turnaround fee and the counter fee), Airport Improvement Fees (“AIF”) and non-aeronautical sources such as car parking and ground transportation, concessions, rentals, electricity sales and other sources. The primary driver of aeronautical revenues is aircraft movements. Landing fees are based on the MTOW of arriving aircraft, general terminal charges are based on the number of seats of an arriving aircraft and the turnaround fee and counter fee are based on the usage of terminal facilities to gate aircraft and check-in passengers. The AIF is charged per-passenger and a portion of non-aeronautical revenues is correlated to passenger activity.
38 gtaa annual report 2012
MANAGEMENT’S DISCUSSION AND ANALYSIS
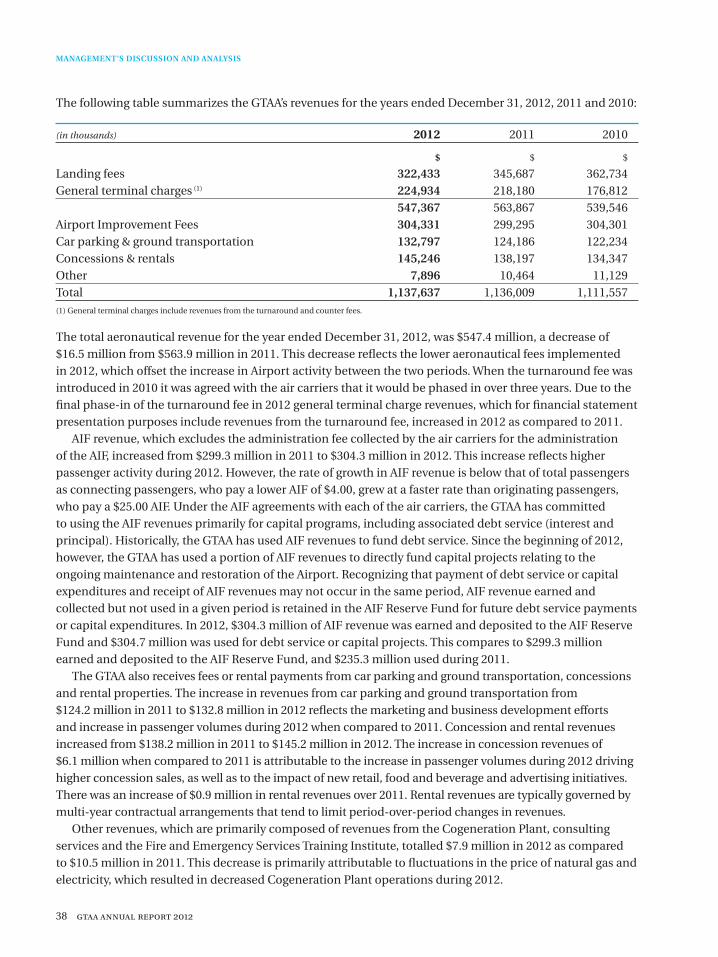
The following table summarizes the GTAA’s revenues for the years ended December 31, 2012, 2011 and 2010:
(in thousands) 2012 2011 2010
$ $ $
Landing fees 322,433 345,687 362,734General terminal charges (1) 224,934 218,180 176,812 547,367 563,867 539,546Airport Improvement Fees 304,331 299,295 304,301Car parking & ground transportation 132,797 124,186 122,234Concessions & rentals 145,246 138,197 134,347Other 7,896 10,464 11,129Total 1,137,637 1,136,009 1,111,557(1) General terminal charges include revenues from the turnaround and counter fees.
The total aeronautical revenue for the year ended December 31, 2012, was $547.4 million, a decrease of $16.5 million from $563.9 million in 2011. This decrease reflects the lower aeronautical fees implemented in 2012, which offset the increase in Airport activity between the two periods. When the turnaround fee was introduced in 2010 it was agreed with the air carriers that it would be phased in over three years. Due to the final phase-in of the turnaround fee in 2012 general terminal charge revenues, which for financial statement presentation purposes include revenues from the turnaround fee, increased in 2012 as compared to 2011.
AIF revenue, which excludes the administration fee collected by the air carriers for the administration of the AIF, increased from $299.3 million in 2011 to $304.3 million in 2012. This increase reflects higher passenger activity during 2012. However, the rate of growth in AIF revenue is below that of total passengers as connecting passengers, who pay a lower AIF of $4.00, grew at a faster rate than originating passengers, who pay a $25.00 AIF. Under the AIF agreements with each of the air carriers, the GTAA has committed to using the AIF revenues primarily for capital programs, including associated debt service (interest and principal). Historically, the GTAA has used AIF revenues to fund debt service. Since the beginning of 2012, however, the GTAA has used a portion of AIF revenues to directly fund capital projects relating to the ongoing maintenance and restoration of the Airport. Recognizing that payment of debt service or capital expenditures and receipt of AIF revenues may not occur in the same period, AIF revenue earned and collected but not used in a given period is retained in the AIF Reserve Fund for future debt service payments or capital expenditures. In 2012, $304.3 million of AIF revenue was earned and deposited to the AIF Reserve Fund and $304.7 million was used for debt service or capital projects. This compares to $299.3 million earned and deposited to the AIF Reserve Fund, and $235.3 million used during 2011.
The GTAA also receives fees or rental payments from car parking and ground transportation, concessions and rental properties. The increase in revenues from car parking and ground transportation from $124.2 million in 2011 to $132.8 million in 2012 reflects the marketing and business development efforts and increase in passenger volumes during 2012 when compared to 2011. Concession and rental revenues increased from $138.2 million in 2011 to $145.2 million in 2012. The increase in concession revenues of $6.1 million when compared to 2011 is attributable to the increase in passenger volumes during 2012 driving higher concession sales, as well as to the impact of new retail, food and beverage and advertising initiatives. There was an increase of $0.9 million in rental revenues over 2011. Rental revenues are typically governed by multi-year contractual arrangements that tend to limit period-over-period changes in revenues.
Other revenues, which are primarily composed of revenues from the Cogeneration Plant, consulting services and the Fire and Emergency Services Training Institute, totalled $7.9 million in 2012 as compared to $10.5 million in 2011. This decrease is primarily attributable to fluctuations in the price of natural gas and electricity, which resulted in decreased Cogeneration Plant operations during 2012.
gtaa annual report 2012 39
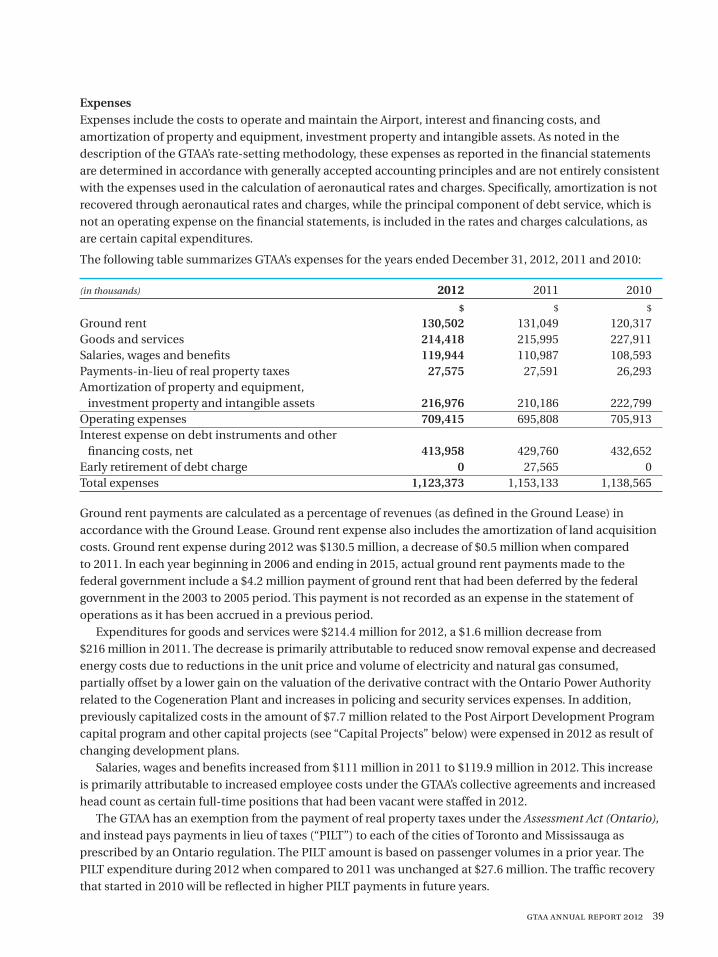
ExpensesExpenses include the costs to operate and maintain the Airport, interest and financing costs, and amortization of property and equipment, investment property and intangible assets. As noted in the description of the GTAA’s rate-setting methodology, these expenses as reported in the financial statements are determined in accordance with generally accepted accounting principles and are not entirely consistent with the expenses used in the calculation of aeronautical rates and charges. Specifically, amortization is not recovered through aeronautical rates and charges, while the principal component of debt service, which is not an operating expense on the financial statements, is included in the rates and charges calculations, as are certain capital expenditures.
The following table summarizes GTAA’s expenses for the years ended December 31, 2012, 2011 and 2010:
(in thousands) 2012 2011 2010
$ $ $
Ground rent 130,502 131,049 120,317Goods and services 214,418 215,995 227,911Salaries, wages and benefits 119,944 110,987 108,593Payments-in-lieu of real property taxes 27,575 27,591 26,293Amortization of property and equipment, investment property and intangible assets 216,976 210,186 222,799Operating expenses 709,415 695,808 705,913Interest expense on debt instruments and other financing costs, net 413,958 429,760 432,652Early retirement of debt charge 0 27,565 0Total expenses 1,123,373 1,153,133 1,138,565
Ground rent payments are calculated as a percentage of revenues (as defined in the Ground Lease) in accordance with the Ground Lease. Ground rent expense also includes the amortization of land acquisition costs. Ground rent expense during 2012 was $130.5 million, a decrease of $0.5 million when compared to 2011. In each year beginning in 2006 and ending in 2015, actual ground rent payments made to the federal government include a $4.2 million payment of ground rent that had been deferred by the federal government in the 2003 to 2005 period. This payment is not recorded as an expense in the statement of operations as it has been accrued in a previous period.
Expenditures for goods and services were $214.4 million for 2012, a $1.6 million decrease from $216 million in 2011. The decrease is primarily attributable to reduced snow removal expense and decreased energy costs due to reductions in the unit price and volume of electricity and natural gas consumed, partially offset by a lower gain on the valuation of the derivative contract with the Ontario Power Authority related to the Cogeneration Plant and increases in policing and security services expenses. In addition, previously capitalized costs in the amount of $7.7 million related to the Post Airport Development Program capital program and other capital projects (see “Capital Projects” below) were expensed in 2012 as result of changing development plans.
Salaries, wages and benefits increased from $111 million in 2011 to $119.9 million in 2012. This increase is primarily attributable to increased employee costs under the GTAA’s collective agreements and increased head count as certain full-time positions that had been vacant were staffed in 2012.
The GTAA has an exemption from the payment of real property taxes under the Assessment Act (Ontario), and instead pays payments in lieu of taxes (“PILT”) to each of the cities of Toronto and Mississauga as prescribed by an Ontario regulation. The PILT amount is based on passenger volumes in a prior year. The PILT expenditure during 2012 when compared to 2011 was unchanged at $27.6 million. The traffic recovery that started in 2010 will be reflected in higher PILT payments in future years.
40 gtaa annual report 2012
MANAGEMENT’S DISCUSSION AND ANALYSIS
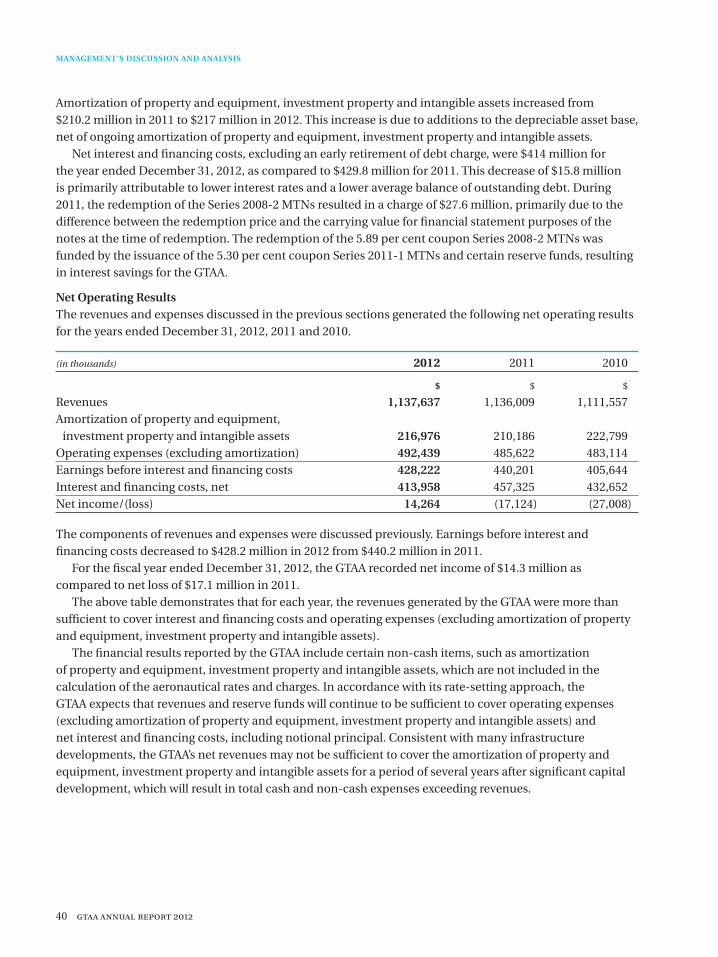
Amortization of property and equipment, investment property and intangible assets increased from $210.2 million in 2011 to $217 million in 2012. This increase is due to additions to the depreciable asset base, net of ongoing amortization of property and equipment, investment property and intangible assets.
Net interest and financing costs, excluding an early retirement of debt charge, were $414 million for the year ended December 31, 2012, as compared to $429.8 million for 2011. This decrease of $15.8 million is primarily attributable to lower interest rates and a lower average balance of outstanding debt. During 2011, the redemption of the Series 2008-2 MTNs resulted in a charge of $27.6 million, primarily due to the difference between the redemption price and the carrying value for financial statement purposes of the notes at the time of redemption. The redemption of the 5.89 per cent coupon Series 2008-2 MTNs was funded by the issuance of the 5.30 per cent coupon Series 2011-1 MTNs and certain reserve funds, resulting in interest savings for the GTAA.
Net Operating Results The revenues and expenses discussed in the previous sections generated the following net operating results for the years ended December 31, 2012, 2011 and 2010.
(in thousands) 2012 2011 2010
$ $ $
Revenues 1,137,637 1,136,009 1,111,557Amortization of property and equipment, investment property and intangible assets 216,976 210,186 222,799Operating expenses (excluding amortization) 492,439 485,622 483,114Earnings before interest and financing costs 428,222 440,201 405,644Interest and financing costs, net 413,958 457,325 432,652Net income/(loss) 14,264 (17,124) (27,008)
The components of revenues and expenses were discussed previously. Earnings before interest and financing costs decreased to $428.2 million in 2012 from $440.2 million in 2011.
For the fiscal year ended December 31, 2012, the GTAA recorded net income of $14.3 million as compared to net loss of $17.1 million in 2011.
The above table demonstrates that for each year, the revenues generated by the GTAA were more than sufficient to cover interest and financing costs and operating expenses (excluding amortization of property and equipment, investment property and intangible assets).
The financial results reported by the GTAA include certain non-cash items, such as amortization of property and equipment, investment property and intangible assets, which are not included in the calculation of the aeronautical rates and charges. In accordance with its rate-setting approach, the GTAA expects that revenues and reserve funds will continue to be sufficient to cover operating expenses (excluding amortization of property and equipment, investment property and intangible assets) and net interest and financing costs, including notional principal. Consistent with many infrastructure developments, the GTAA’s net revenues may not be sufficient to cover the amortization of property and equipment, investment property and intangible assets for a period of several years after significant capital development, which will result in total cash and non-cash expenses exceeding revenues.
gtaa annual report 2012 41
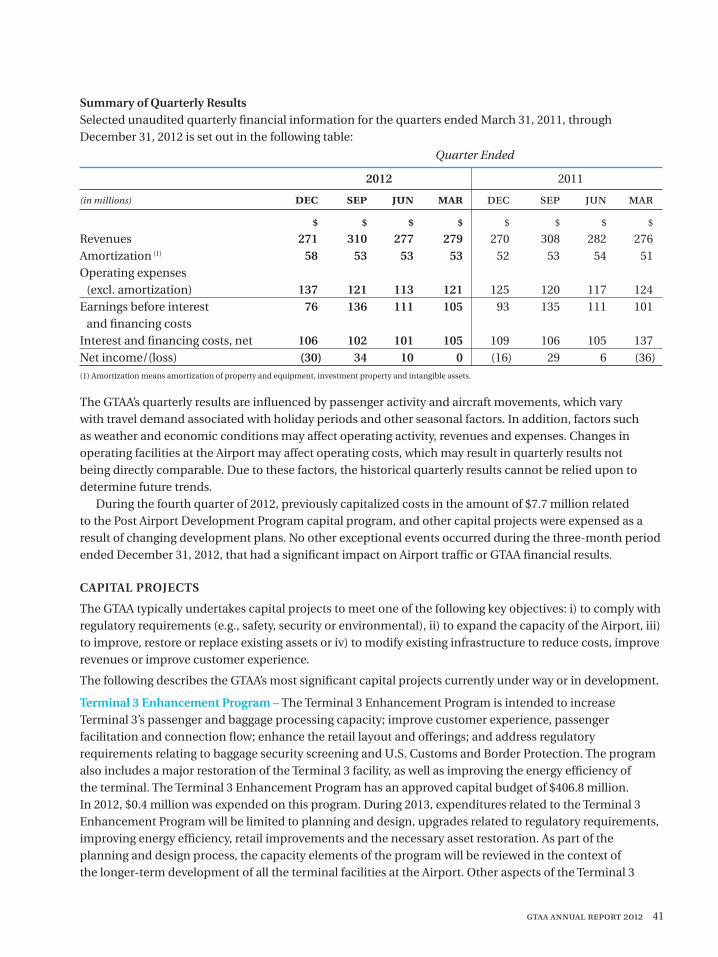
Summary of Quarterly ResultsSelected unaudited quarterly financial information for the quarters ended March 31, 2011, through December 31, 2012 is set out in the following table:
Quarter Ended
2012 2011
(in millions) dec sep jun mar dec sep jun mar
$ $ $ $ $ $ $ $
Revenues 271 310 277 279 270 308 282 276Amortization (1) 58 53 53 53 52 53 54 51Operating expenses (excl. amortization) 137 121 113 121 125 120 117 124Earnings before interest 76 136 111 105 93 135 111 101 and financing costs Interest and financing costs, net 106 102 101 105 109 106 105 137Net income/(loss) (30) 34 10 0 (16) 29 6 (36)(1) Amortization means amortization of property and equipment, investment property and intangible assets.
The GTAA’s quarterly results are influenced by passenger activity and aircraft movements, which vary with travel demand associated with holiday periods and other seasonal factors. In addition, factors such as weather and economic conditions may affect operating activity, revenues and expenses. Changes in operating facilities at the Airport may affect operating costs, which may result in quarterly results not being directly comparable. Due to these factors, the historical quarterly results cannot be relied upon to determine future trends.
During the fourth quarter of 2012, previously capitalized costs in the amount of $7.7 million related to the Post Airport Development Program capital program, and other capital projects were expensed as a result of changing development plans. No other exceptional events occurred during the three-month period ended December 31, 2012, that had a significant impact on Airport traffic or GTAA financial results.
CAPITAL PROJECTS
The GTAA typically undertakes capital projects to meet one of the following key objectives: i) to comply with regulatory requirements (e.g., safety, security or environmental), ii) to expand the capacity of the Airport, iii) to improve, restore or replace existing assets or iv) to modify existing infrastructure to reduce costs, improve revenues or improve customer experience.
The following describes the GTAA’s most significant capital projects currently under way or in development.
Terminal 3 Enhancement Program – The Terminal 3 Enhancement Program is intended to increase Terminal 3’s passenger and baggage processing capacity; improve customer experience, passenger facilitation and connection flow; enhance the retail layout and offerings; and address regulatory requirements relating to baggage security screening and U.S. Customs and Border Protection. The program also includes a major restoration of the Terminal 3 facility, as well as improving the energy efficiency of the terminal. The Terminal 3 Enhancement Program has an approved capital budget of $406.8 million. In 2012, $0.4 million was expended on this program. During 2013, expenditures related to the Terminal 3 Enhancement Program will be limited to planning and design, upgrades related to regulatory requirements, improving energy efficiency, retail improvements and the necessary asset restoration. As part of the planning and design process, the capacity elements of the program will be reviewed in the context of the longer-term development of all the terminal facilities at the Airport. Other aspects of the Terminal 3
42 gtaa annual report 2012
MANAGEMENT’S DISCUSSION AND ANALYSIS
Enhancement Program are under review by the GTAA and will likely be deferred and modified. The Terminal 3 Enhancement Program incorporates the previously approved Terminal 3 Master Plan, which had an approved budget of $85.1 million but was suspended due to the 2009 traffic downturn. There have been no material amounts expended in relation to the Terminal 3 Master Plan up to December 31, 2012.
Terminal 1 Enhancement Program – The full extent of the Terminal 1 Enhancement Program is still in development and has not yet been approved. This program is being reviewed in the context of planning initiatives to increase the capacity and utilization of existing terminal facilities at the Airport. The most recent estimated cost of the Terminal 1 Enhancement Program is $114 million and includes certain enhancements to Terminal 1 to increase its passenger and baggage processing capacity to address regulatory requirements relating to the U.S. Customs and Border Protection, and to improve customer experience. There were no material amounts expended on this project in 2012.
Runway End Safety Area (“RESA”) Project – During 2012, the GTAA deferred the implementation of its RESA project as it awaits the development and issuance of revised RESA standards by Transport Canada. This project will be re-evaluated once Transport Canada issues its revised RESA standards. The RESA project, as previously defined, had an original budget of $65 million and included an Engineered Material Arresting System. In 2012, $0.9 million was expended on this project.
Integrated Operations Control Centre Project – This project consolidated seven communication centres at the Airport into a single location. The Integrated Operations Control Centre (formerly referred to as the “Consolidated Communications Centre”) is intended to enhance customer service and improve operational efficiencies by streamlining and simplifying internal and external communication and coordination processes. The construction of the Integrated Operations Control Centre commenced in 2011 and was substantially completed in 2012. The estimated cost of this project is $22 million, of which $16.5 million was expended in 2012.
Post Airport Development Program (“ADP”) Program – The Post ADP Program was implemented in 2007 to address the enabling works for the future construction of Pier G at Terminal 1. As a result of planning initiatives to increase the capacity and utilization of existing facilities, the scheduled time to expand Terminal 1 in order to meet the increasing demand for air service is being postponed further into the future. As a result, the GTAA has cancelled the remaining elements of the Post ADP Program with the exception of work on an aviation fuel pipeline and the expansion of the capacity of the Automated People Mover. The estimated cost of these two projects is $28 million, of which $11.4 million was expended in 2012.
The original budget for the Post ADP Program was $439.7 million, of which $307.2 million has been spent. Should any other work previously contemplated under this program be undertaken, it will be subject to a separate review and approval by GTAA management and, if required, by its Board of Directors.
Maintenance and Restoration Capital Program – The GTAA undertakes an ongoing program to improve, restore or replace certain capital assets. During 2012, the GTAA expended approximately $68.2 million with respect to restoration capital primarily to upgrade, refurbish or replace existing facilities.
gtaa annual report 2012 43
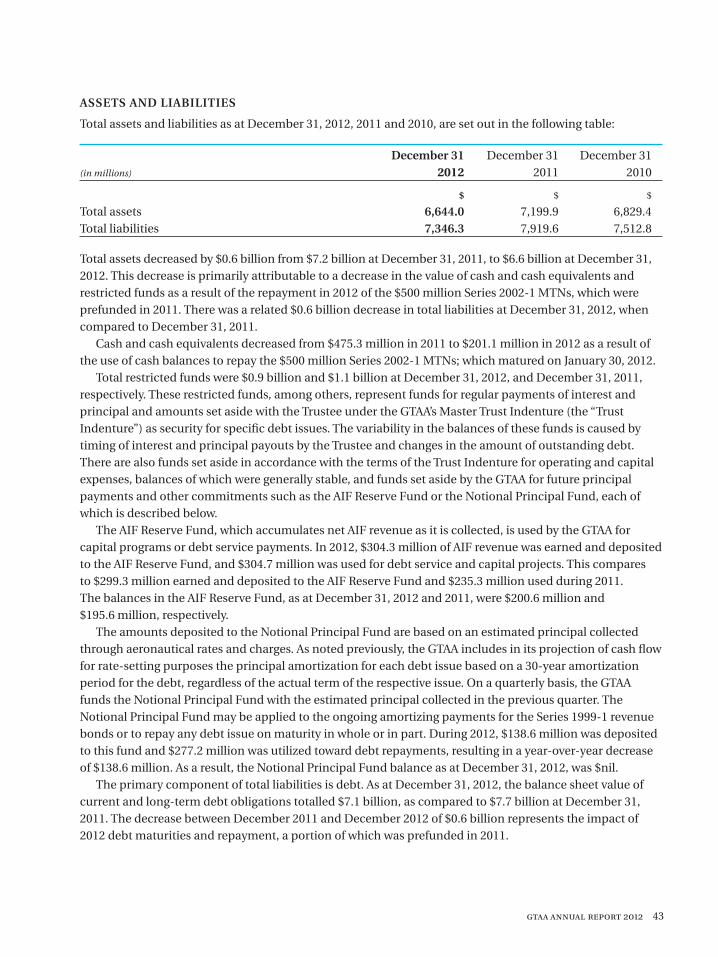
ASSETS AND LIABILITIES
Total assets and liabilities as at December 31, 2012, 2011 and 2010, are set out in the following table:
December 31 December 31 December 31 (in millions) 2012 2011 2010
$ $ $
Total assets 6,644.0 7,199.9 6,829.4 Total liabilities 7,346.3 7,919.6 7,512.8
Total assets decreased by $0.6 billion from $7.2 billion at December 31, 2011, to $6.6 billion at December 31, 2012. This decrease is primarily attributable to a decrease in the value of cash and cash equivalents and restricted funds as a result of the repayment in 2012 of the $500 million Series 2002-1 MTNs, which were prefunded in 2011. There was a related $0.6 billion decrease in total liabilities at December 31, 2012, when compared to December 31, 2011.
Cash and cash equivalents decreased from $475.3 million in 2011 to $201.1 million in 2012 as a result of the use of cash balances to repay the $500 million Series 2002-1 MTNs; which matured on January 30, 2012.
Total restricted funds were $0.9 billion and $1.1 billion at December 31, 2012, and December 31, 2011, respectively. These restricted funds, among others, represent funds for regular payments of interest and principal and amounts set aside with the Trustee under the GTAA’s Master Trust Indenture (the “Trust Indenture”) as security for specific debt issues. The variability in the balances of these funds is caused by timing of interest and principal payouts by the Trustee and changes in the amount of outstanding debt. There are also funds set aside in accordance with the terms of the Trust Indenture for operating and capital expenses, balances of which were generally stable, and funds set aside by the GTAA for future principal payments and other commitments such as the AIF Reserve Fund or the Notional Principal Fund, each of which is described below.
The AIF Reserve Fund, which accumulates net AIF revenue as it is collected, is used by the GTAA for capital programs or debt service payments. In 2012, $304.3 million of AIF revenue was earned and deposited to the AIF Reserve Fund, and $304.7 million was used for debt service and capital projects. This compares to $299.3 million earned and deposited to the AIF Reserve Fund and $235.3 million used during 2011. The balances in the AIF Reserve Fund, as at December 31, 2012 and 2011, were $200.6 million and $195.6 million, respectively.
The amounts deposited to the Notional Principal Fund are based on an estimated principal collected through aeronautical rates and charges. As noted previously, the GTAA includes in its projection of cash flow for rate-setting purposes the principal amortization for each debt issue based on a 30-year amortization period for the debt, regardless of the actual term of the respective issue. On a quarterly basis, the GTAA funds the Notional Principal Fund with the estimated principal collected in the previous quarter. The Notional Principal Fund may be applied to the ongoing amortizing payments for the Series 1999-1 revenue bonds or to repay any debt issue on maturity in whole or in part. During 2012, $138.6 million was deposited to this fund and $277.2 million was utilized toward debt repayments, resulting in a year-over-year decrease of $138.6 million. As a result, the Notional Principal Fund balance as at December 31, 2012, was $nil.
The primary component of total liabilities is debt. As at December 31, 2012, the balance sheet value of current and long-term debt obligations totalled $7.1 billion, as compared to $7.7 billion at December 31, 2011. The decrease between December 2011 and December 2012 of $0.6 billion represents the impact of 2012 debt maturities and repayment, a portion of which was prefunded in 2011.
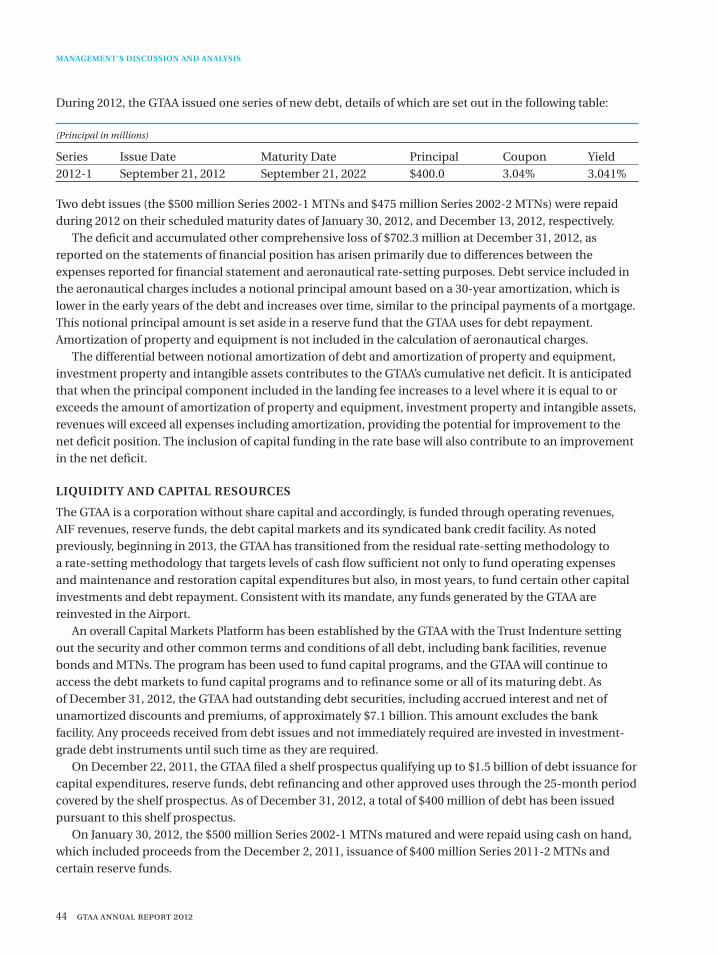
44 gtaa annual report 2012
MANAGEMENT’S DISCUSSION AND ANALYSIS
During 2012, the GTAA issued one series of new debt, details of which are set out in the following table:
(Principal in millions)
Series Issue Date Maturity Date Principal Coupon Yield2012-1 September 21, 2012 September 21, 2022 $400.0 3.04% 3.041%
Two debt issues (the $500 million Series 2002-1 MTNs and $475 million Series 2002-2 MTNs) were repaid during 2012 on their scheduled maturity dates of January 30, 2012, and December 13, 2012, respectively.
The deficit and accumulated other comprehensive loss of $702.3 million at December 31, 2012, as reported on the statements of financial position has arisen primarily due to differences between the expenses reported for financial statement and aeronautical rate-setting purposes. Debt service included in the aeronautical charges includes a notional principal amount based on a 30-year amortization, which is lower in the early years of the debt and increases over time, similar to the principal payments of a mortgage. This notional principal amount is set aside in a reserve fund that the GTAA uses for debt repayment. Amortization of property and equipment is not included in the calculation of aeronautical charges.
The differential between notional amortization of debt and amortization of property and equipment, investment property and intangible assets contributes to the GTAA’s cumulative net deficit. It is anticipated that when the principal component included in the landing fee increases to a level where it is equal to or exceeds the amount of amortization of property and equipment, investment property and intangible assets, revenues will exceed all expenses including amortization, providing the potential for improvement to the net deficit position. The inclusion of capital funding in the rate base will also contribute to an improvement in the net deficit.
LIQUIDITY AND CAPITAL RESOURCES
The GTAA is a corporation without share capital and accordingly, is funded through operating revenues, AIF revenues, reserve funds, the debt capital markets and its syndicated bank credit facility. As noted previously, beginning in 2013, the GTAA has transitioned from the residual rate-setting methodology to a rate-setting methodology that targets levels of cash flow sufficient not only to fund operating expenses and maintenance and restoration capital expenditures but also, in most years, to fund certain other capital investments and debt repayment. Consistent with its mandate, any funds generated by the GTAA are reinvested in the Airport.
An overall Capital Markets Platform has been established by the GTAA with the Trust Indenture setting out the security and other common terms and conditions of all debt, including bank facilities, revenue bonds and MTNs. The program has been used to fund capital programs, and the GTAA will continue to access the debt markets to fund capital programs and to refinance some or all of its maturing debt. As of December 31, 2012, the GTAA had outstanding debt securities, including accrued interest and net of unamortized discounts and premiums, of approximately $7.1 billion. This amount excludes the bank facility. Any proceeds received from debt issues and not immediately required are invested in investment-grade debt instruments until such time as they are required.
On December 22, 2011, the GTAA filed a shelf prospectus qualifying up to $1.5 billion of debt issuance for capital expenditures, reserve funds, debt refinancing and other approved uses through the 25-month period covered by the shelf prospectus. As of December 31, 2012, a total of $400 million of debt has been issued pursuant to this shelf prospectus.
On January 30, 2012, the $500 million Series 2002-1 MTNs matured and were repaid using cash on hand, which included proceeds from the December 2, 2011, issuance of $400 million Series 2011-2 MTNs and certain reserve funds.
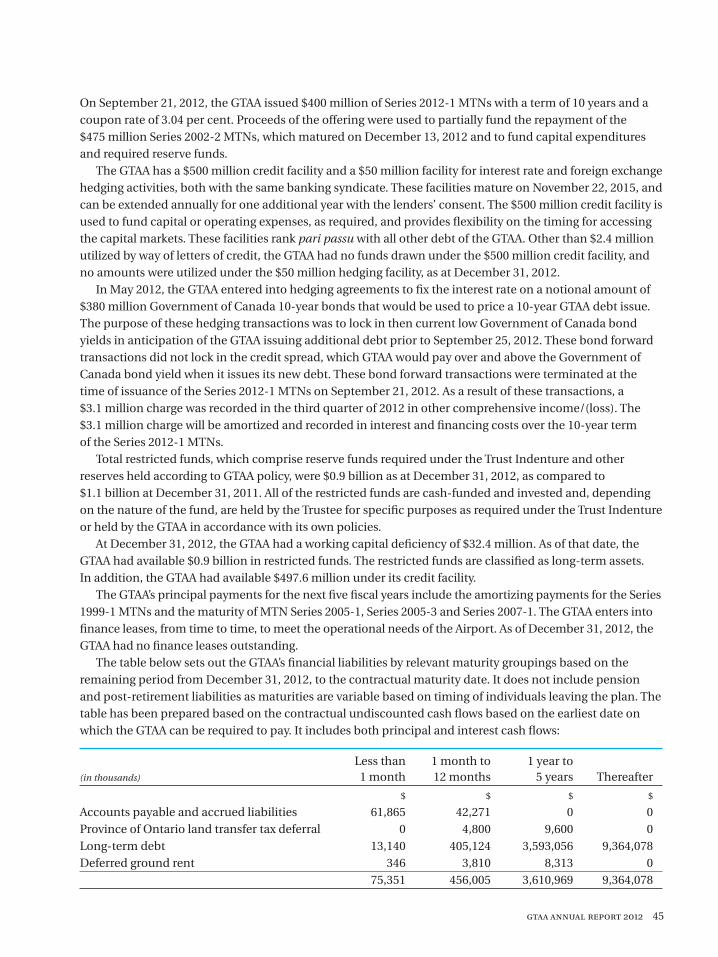
gtaa annual report 2012 45
On September 21, 2012, the GTAA issued $400 million of Series 2012-1 MTNs with a term of 10 years and a coupon rate of 3.04 per cent. Proceeds of the offering were used to partially fund the repayment of the $475 million Series 2002-2 MTNs, which matured on December 13, 2012 and to fund capital expenditures and required reserve funds.
The GTAA has a $500 million credit facility and a $50 million facility for interest rate and foreign exchange hedging activities, both with the same banking syndicate. These facilities mature on November 22, 2015, and can be extended annually for one additional year with the lenders’ consent. The $500 million credit facility is used to fund capital or operating expenses, as required, and provides flexibility on the timing for accessing the capital markets. These facilities rank pari passu with all other debt of the GTAA. Other than $2.4 million utilized by way of letters of credit, the GTAA had no funds drawn under the $500 million credit facility, and no amounts were utilized under the $50 million hedging facility, as at December 31, 2012.
In May 2012, the GTAA entered into hedging agreements to fix the interest rate on a notional amount of $380 million Government of Canada 10-year bonds that would be used to price a 10-year GTAA debt issue. The purpose of these hedging transactions was to lock in then current low Government of Canada bond yields in anticipation of the GTAA issuing additional debt prior to September 25, 2012. These bond forward transactions did not lock in the credit spread, which GTAA would pay over and above the Government of Canada bond yield when it issues its new debt. These bond forward transactions were terminated at the time of issuance of the Series 2012-1 MTNs on September 21, 2012. As a result of these transactions, a $3.1 million charge was recorded in the third quarter of 2012 in other comprehensive income/(loss). The $3.1 million charge will be amortized and recorded in interest and financing costs over the 10-year term of the Series 2012-1 MTNs.
Total restricted funds, which comprise reserve funds required under the Trust Indenture and other reserves held according to GTAA policy, were $0.9 billion as at December 31, 2012, as compared to $1.1 billion at December 31, 2011. All of the restricted funds are cash-funded and invested and, depending on the nature of the fund, are held by the Trustee for specific purposes as required under the Trust Indenture or held by the GTAA in accordance with its own policies.
At December 31, 2012, the GTAA had a working capital deficiency of $32.4 million. As of that date, the GTAA had available $0.9 billion in restricted funds. The restricted funds are classified as long-term assets. In addition, the GTAA had available $497.6 million under its credit facility.
The GTAA’s principal payments for the next five fiscal years include the amortizing payments for the Series 1999-1 MTNs and the maturity of MTN Series 2005-1, Series 2005-3 and Series 2007-1. The GTAA enters into finance leases, from time to time, to meet the operational needs of the Airport. As of December 31, 2012, the GTAA had no finance leases outstanding.
The table below sets out the GTAA’s financial liabilities by relevant maturity groupings based on the remaining period from December 31, 2012, to the contractual maturity date. It does not include pension and post-retirement liabilities as maturities are variable based on timing of individuals leaving the plan. The table has been prepared based on the contractual undiscounted cash flows based on the earliest date on which the GTAA can be required to pay. It includes both principal and interest cash flows:
Less than 1 month to 1 year to(in thousands) 1 month 12 months 5 years Thereafter
$ $ $ $
Accounts payable and accrued liabilities 61,865 42,271 0 0Province of Ontario land transfer tax deferral 0 4,800 9,600 0Long-term debt 13,140 405,124 3,593,056 9,364,078Deferred ground rent 346 3,810 8,313 0 75,351 456,005 3,610,969 9,364,078
46 gtaa annual report 2012
MANAGEMENT’S DISCUSSION AND ANALYSIS
Accounts payable and accrued liabilities and deferred ground rent will be funded through operations while the Province of Ontario land transfer tax deferral, of which $4.8 million, representing the second of five annual installments, was repaid in 2012, and long-term debt obligations are expected to be funded through a combination of restricted funds, cash flows generated from operations and debt.
In connection with the operation and development of the Airport, the GTAA had capital commitments outstanding at December 31, 2012, of approximately $173.6 million as compared to $80.7 million at December 31, 2011, primarily related to construction contracts. The GTAA expects to fund these commitments through its cash flow from operations, restricted funds or debt, as applicable.
The GTAA’s commitment with respect to annual ground lease airport rent, including ground rent deferral repayments, is estimated based on GTAA’s current five-year forecast of expected revenues to be approximately $132.4 million for the year ending December 31, 2013, and an estimated aggregate amount of $573.4 million over the four-year period of 2014 through 2017. The reader is cautioned that certain assumptions used in developing the five-year forecast may not materialize and unanticipated events and circumstances may occur subsequent to the date when it was prepared. Therefore, the actual results achieved during those periods may vary, and the variations may be material. A more complete discussion of the risks and uncertainties and caution regarding forward-looking statements is included below (see “Risks and Uncertainties” and “Caution Regarding Forward-Looking Information”).
The objective of the GTAA’s investment and cash management strategy is to ensure that the cash requirements for operations, capital programs and other demands are met and to maximize the flexibility in accessing capital markets as may be required. The GTAA monitors its cash flow requirements accordingly. Given its current cash balance, the current available credit facility, restricted funds, its ability to access the capital markets, and projected operating revenues and costs, the GTAA does not anticipate any funding shortfalls during 2013. However, there may be events outside of the control of the GTAA that could have a negative impact on its liquidity.
EARNINGS COVERAGE
For the 12-month period ended December 31, 2012, earnings before interest and financing costs for the GTAA were $428.2 million. Interest and financing costs for the same period, net of interest income, were $417.8 million, resulting in an earnings coverage ratio of 1.03:1.00.
The updated earnings coverage calculations have been provided to comply with disclosure requirements of the Canadian Securities Administrators. An alternate measure of the GTAA’s ability to service its indebtedness is its obligation to comply with certain covenants in the Trust Indenture. The Trust Indenture contains a covenant that requires the GTAA to establish and maintain rates, rentals, charges, fees and services so that, among other things, Net Revenues, together with any Transfer from the General Fund in each Fiscal Year will be at least equal to 125 per cent of the Annual Debt Service for each Fiscal Year (as such capitalized terms are defined in the Trust Indenture).
The GTAA sets its rates in such a manner as to meet the 125 per cent debt service covenant under the Trust Indenture. The debt service covenant test excludes amortization of property and equipment, investment property and intangible assets from expenses. However, it does include a notional amortization, over 30 years, of outstanding debt. Inclusion of debt amortization ensures that revenues are sufficient to retire debt over 30 years, which is considered appropriate for an infrastructure provider with significant, long-lived assets. This amortization of debt is reserved and used for future debt repayments. At this time, the notional amortization of debt is less than the amortization of property and equipment, investment property and intangible assets recorded in the GTAA’s financial statements. As a result, the GTAA continues to meet the 125 per cent debt service covenant under the Trust Indenture, even though the earnings coverage ratio as calculated in accordance with the disclosure requirements of the Canadian Securities Administrators may at certain times be less.
gtaa annual report 2012 47
SIGNIFICANT ACCOUNTING POLICIES AND ESTIMATES
The significant accounting policies of the GTAA and changes thereto are set out in Notes 3 and 4, respectively, of the Financial Statements as of December 31, 2012 and 2011. Other than the adoption of International Financial Reporting Standard (“IFRS”) 7, Financial Instruments: Disclosures, which became effective in the year, there were no changes to the accounting policies of the GTAA during 2012.
In applying the GTAA’s accounting policies, management is required to make certain estimates or assumptions that affect the reported amount of assets and liabilities and the disclosure of commitments and contingencies at the date of the financial statements and the reported amounts of revenues and expenses during the reporting period. The critical accounting judgments and key sources of estimation uncertainty are set out in Note 5 of the Financial Statements as of December 31, 2012 and 2011. Actual results could differ from estimates.
Property and equipment for the Airport include items such as improvements to leased land, runways, terminals and other buildings, and roadways. These assets are recorded at cost and amortized over the estimated useful life of the asset. Amortization of assets commences when the asset is available for use, and for certain assets, such as the terminal buildings, the asset may be brought into or removed from operations in stages.
The timing for revenue recognition depends on the nature of the revenue and the specific agreements in place. Landing fees, general terminal charges and car parking revenues are recognized, net of estimated incentive program payments earned by air carriers, as the airport facilities are utilized. Airport Improvement Fees are accrued upon the enplanement of the passenger. AIF revenue is remitted to the GTAA based on airlines self-assessing their passenger counts. An annual reconciliation is performed by the GTAA with air carriers. Concessions revenue is earned on a monthly basis and is recognized based on a percentage of sales or specified minimum rent guarantees. Ground transportation revenue is recognized based on a combination of the duration of the term of the licences and permits and utilization fees. Rentals revenue is recognized on a straight-line basis over the duration of the respective agreements. Revenue derived from the Cogeneration Plant, included in other revenue, is recognized as electricity is delivered to customers.
The GTAA maintains both defined benefit pension plans and defined contribution pension plans for its employees. The pension costs of the defined benefit plans are actuarially determined using the projected unit credit method and best estimate assumptions. The present value of the defined benefit obligation is determined by discounting the estimated future cash outflows using interest rates of high-quality corporate bonds that have the terms to maturity approximating the terms of the related pension liability. The costs of the defined benefit plans are recognized as the benefits are earned through employee service. The costs of the defined contribution pension plans are expensed as the GTAA becomes obligated to contribute to the defined contribution plans. The assumptions used to estimate the pension plan assets and liabilities are further discussed in note 13 of the Financial Statements of the GTAA for the years ended December 31, 2012 and 2011.
INTERNAL CONTROLS AND PROCEDURES
GTAA management is responsible for establishing and maintaining disclosure controls and procedures to ensure that information required to be disclosed to satisfy the GTAA’s continuous disclosure obligations is recorded, processed, summarized and reported as required by applicable Canadian securities legislation. Management has carried out an evaluation of the effectiveness as of December 31, 2012, of the design and operation of the disclosure controls and procedures, as defined in National Instrument 52–109, Certification of Disclosure in Issuers’ Annual and Interim Filings, under the supervision of, and with the participation of, the President and CEO, and the Vice President and Chief Financial Officer (“CFO”). Based on this evaluation, the CEO and CFO concluded that the disclosure controls and procedures are effective in recording,
48 gtaa annual report 2012
MANAGEMENT’S DISCUSSION AND ANALYSIS
processing, summarizing and reporting, on a timely basis, information required to be disclosed by the GTAA to satisfy its continuous disclosure obligations and are effective in ensuring that information required to be disclosed in the reports that the GTAA files is accumulated and communicated to management as appropriate to allow timely decisions regarding required disclosure. The Board of Directors has reviewed and approved the GTAA’s Policy Regarding Corporate Disclosure Controls and Procedures. Management has determined that as at December 31, 2012, the design and operation of the disclosure controls and procedures continues to be effective.
GTAA management is responsible for designing and implementing internal controls over financial reporting to provide reasonable assurance regarding the reliability of the GTAA’s reporting and the preparation of financial statements for external purposes in accordance with IFRS. As required under National Instrument 52–109, the GTAA, under the supervision and with the participation of the CEO and the CFO, has carried out an evaluation of the effectiveness as at December 31, 2012, of its internal controls over financial reporting. Based on this evaluation, the GTAA’s CEO and CFO concluded that the Corporation maintained effective internal controls over financial reporting as at December 31, 2012. While no material weaknesses with respect to internal controls over financial reporting have been identified as at December 31, 2012, any assessment may not detect all weaknesses nor prevent or detect all misstatements because of inherent limitations. Additionally, projections of any assessment of effectiveness to future periods are subject to the risk that controls may become inadequate due to changes in conditions or deterioration in the degree of compliance with the GTAA’s policies and procedures. No changes in the GTAA’s internal controls over financial reporting occurred during the year ended December 31, 2012, that have materially affected, or are reasonably likely to materially affect, its internal control over financial reporting.
ENVIRONMENTAL MATTERS
The GTAA is committed to ensuring that activities undertaken at the Airport are carried out in an environmentally responsible manner, in compliance with applicable environmental laws and regulations, with appropriate management practices and with sensitivity to community and public concerns.
Risk Oversight and ManagementThe mandate of the GTAA’s Board of Directors includes the responsibility to identify the principal risks associated with the GTAA’s business and to ensure that the appropriate systems are in place to effectively monitor and manage those risks. The Board of Directors has delegated to its Environment, Safety, Security and Stakeholder Relations (“ESSSR”) Committee the responsibility for the oversight of environmental risks and issues affecting the Airport. This committee monitors and evaluates management’s development and implementation of environmental policies, practices and activities, including its Environmental Management Program, to ensure that they are effective and meet or exceed legislative and regulatory requirements and best practices. The committee reviews regular management reports relating to environmental risks, opportunities and matters.
Environmental Policy and ISO Certification – In April 1999, the GTAA obtained ISO 14001 certification for its Environmental Management Program, the first airport in North America to earn this distinction. The GTAA has achieved recertification annually since 1999. Through the process of annual ISO certification renewals and regular internal audits, the GTAA’s Environmental Management Program is being continuously improved.
As a requirement of the ISO 14001 certification, the GTAA developed and implemented an Environmental Policy for the Airport that is reviewed annually. The purpose of the GTAA’s Environmental Policy is to reduce and control the risks of environmental contamination and to promote continuous improvement and regulatory compliance.
gtaa annual report 2012 49
The air carriers, concessionaires and other commercial businesses that operate at the Airport are required to comply with environmental laws and regulations and the environmental requirements contained in their leases or agreements with the GTAA. Through its Environmental Services division, the GTAA conducts scheduled inspections of tenants’, operators’ and contractors’ premises and operations to ensure compliance with environmental laws and contractual obligations, to identify potential environmental hazards and to make recommendations for the safe storage, handling and disposal of hazardous substances.
Environmental RisksIn 2010, the GTAA adopted an Enterprise Risk Management (“ERM”) program to provide a disciplined approach for identifying, mitigating and managing risks. Using the ERM and the Environmental Management Program, environmental risks at the Airport are identified and ranked by severity and likelihood. Mitigation plans are then developed, implemented, monitored and continuously improved. The GTAA’s Environmental Services division provides quarterly reports on environmental risks and mitigation plan monitoring to senior management and the ESSSR Committee.
Spills of Hazardous Substances – The principal environmental risks at the Airport are spills of jet fuel, glycol-based deicing fluid and other hazardous substances. Virtually all of these substances are owned and handled by third parties operating at the Airport. The distribution, storage and management of jet fuel are the responsibility of third-party fuel suppliers and the Pearson International Fuel Facilities Corporation, an airline consortium. The storage, spraying and recovery of glycol-based deicing fluid and the operation of the Central Deicing Facility (“CDF”) are the responsibility of Servisair, a third-party contractor. The management and disposal of glycol is the responsibility of Ontario Clean Water Agency, also a third-party contractor. Inland Technologies is contracted to process the high-concentrate spent glycol for resale. The storage, use and transportation of hazardous substances are the responsibility of the owners of the hazardous substances, contractors, warehouse tenants, air carriers and trucking firms. These parties are subject to applicable environmental laws and regulations and, where applicable, contractual obligations with the GTAA.
Trends and Uncertainties—Climate ChangeThe trend toward global warming is expected to result in a climate change that may manifest itself in more severe weather events. As part of its preparedness for more severe weather events, the GTAA is currently updating its stormwater-flood study to determine what improvements or changes to its operational practices could be considered to prevent Airport flooding during severe storms. Working with Engineers Canada, the GTAA will be developing an engineering protocol to assess infrastructure vulnerability to determine the resiliency or vulnerability of the Airport to more severe weather events.
In order to manage the release of greenhouse gases, which are related to global climate change, the GTAA implemented its Greenhouse Gas Management Policy in 2010. The policy provides that rather than purchasing carbon credits, the financial instruments representing emission offsets or allowances, the GTAA will spend the equivalent amount on greenhouse gas reduction initiatives. This policy requires the GTAA, by 2020, to reduce its greenhouse gas emissions (including those from purchased electricity) by 20 per cent below a 2006 baseline. During 2012, the GTAA continued to focus on energy use reduction, and projects that have been completed include substituting LEDs for inefficient incandescent and fluorescent lighting and improving ventilation. Approximately $1.4 million was spent in 2012 on energy-reduction studies and trials. Substantial greenhouse gas reduction programs are again targeted for 2013, which will continue the focus on energy-efficient lighting replacements and upgrades. Under current laws, the GTAA is not required to reduce its greenhouse gas emissions. The GTAA’s greenhouse gas emissions reduction program is a voluntary program that is consistent with the GTAA’s goal of achieving long-term sustainability. In addition to lessening the impact on the environment, another advantage of reducing greenhouse gas emissions is the reduction in electricity consumption and cost.
50 gtaa annual report 2012
MANAGEMENT’S DISCUSSION AND ANALYSIS
Other Environmental MattersOther environmental matters include the Noise Management Program, environmental protection and the Partners in Project Green initiative.
Noise Management Program – The GTAA’s Noise Management Program includes preferential runways, prescribed approach and departure flight procedures, and restrictions on the hours that certain types of aircraft may use the Airport. The GTAA maintains a Community Environment and Noise Advisory Committee comprising local residents, elected officials, representatives of the aviation industry and the GTAA. This committee meets regularly to discuss and review issues and complaints relating to noise and other environmental impacts of Airport operations. In addition, the GTAA has worked with the neighbouring municipalities to create an Airport Operating Area (“AOA”) surrounding the Airport. The AOA, which is based on noise contours, delineates an area within which land uses that are incompatible with Airport operations, including residential development and schools, are actively opposed by the GTAA. The AOA has been incorporated into the official plans of the cities of Toronto, Mississauga and Brampton and the Region of Peel.
Environmental Protection – The two principal environmental protection programs implemented by the GTAA are its stormwater management master plan and the glycol recovery program at the CDF.
The GTAA has adopted a stormwater management master plan for the Airport. This plan includes the construction of stormwater control facilities and related infrastructure to prevent runoff from runways and Airport lands from exceeding stormwater quality and quantity guidelines. The GTAA spent $53.4 million in connection with the stormwater management master plan in the 1996 to 2007 period. The stormwater management master plan will be expanded as needed when further airside facilities are developed. The operational impact of the stormwater management master plan is to ensure that the release of stormwater does not exceed environmental guidelines.
The second principal environmental protection measure implemented by the GTAA is the glycol recovery program at the CDF. This program includes a series of catch basins and underground tanks to collect glycol-based deicing fluid after being sprayed on aircraft. The captured deicing fluid is separated into low- and high-glycol concentrations for disposal. The low-glycol concentrations are piped to municipal sanitary waste water treatment plants. The high-concentration glycol is processed on-site for off-Airport resale. As a further environmental protection measure, a high-density polyethylene liner and perforated pipe system have been installed beneath the CDF to collect any deicing fluid that may leak underground. These environmental protection measures at the CDF were completed in 1999 at a capital cost of approximately $16 million.
During the 2011-2012 winter season, the CDF collected approximately 95 million litres of glycol-contaminated snow and rainwater. The operational impact of the glycol recovery program is to ensure that the release of glycol-based deicing fluid does not exceed environmental guidelines.
Partners in Project Green – The GTAA’s commitment to environmental responsibility extends beyond the boundaries of the Airport. Together with the Toronto and Region Conservation Authority, the GTAA initiated Partners in Project Green to develop and promote environmentally sustainable initiatives among the 12,500 companies located in the Pearson Eco-Business Zone, an area comprising over 12,000 hectares of industrial and commercial land surrounding the Airport. The GTAA leads by example and encourages businesses to adopt environmentally sustainable practices.
gtaa annual report 2012 51
RISKS AND UNCERTAINTIES
The GTAA’s Board of Directors is accountable for the oversight of the principal risks of the GTAA’s business and has delegated to the Audit Committee the oversight of the risk management process. The standing committees of the Board are responsible for ensuring that management has appropriate policies and procedures to identify and manage specific risks and to ensure that such policies and procedures are effective.
In 2010, the Board of Directors approved an ERM program to instill a behavioural awareness among employees and provide a disciplined process to identify, mitigate and manage risks. The ERM program is incorporated into the GTAA’s decision-making process. The GTAA continues to review and improve its ERM program, including building stronger links between strategy, risk and opportunity.
The GTAA, its operations and its financial results are subject to certain risks. At present, these include, without limitation, the risks set out below. Other risks are detailed from time to time in the GTAA’s publicly filed disclosure documents, including its Annual Information Form.
Funding Risk – As of December 31, 2012, the GTAA had outstanding debt securities, including accrued interest and net of unamortized discounts and premiums, of approximately $7.1 billion, the proceeds of which were used to fund the acquisition of Terminal 3, to rebuild and expand the Airport’s infrastructure, to fund the GTAA’s reserve funds and to refinance maturing debt. The GTAA, in its management of costs and revenues, has examined scenarios to determine the range of impact of variability in Toronto Pearson’s operating activity, costs and revenues on cash flows and funding requirements. The GTAA’s rate-setting methodology targets levels of cash flow sufficient not only to fund operating expenses and maintenance and restoration capital expenditures but also, in most years, to fund other capital investments and debt repayment. Depending on the timing of cash flows and actual operating activity levels, the GTAA may need to continue to access the capital markets to refinance maturing debt, finance future capital projects and fund reserve funds.
There is always risk when raising funds in the capital markets, including risks related to fluctuating interest rates and the availability of funds at any point in time. External factors, such as economic conditions, government policies, catastrophic events and the state of the financial markets, can have an impact on GTAA’s ability to access the capital markets. While the GTAA’s debt program has historically been well received by the capital markets in Canada, any dislocation in the domestic or global capital markets could affect the GTAA’s ability to meet its financing requirements. The GTAA monitors the overall debt markets and works with its financial advisers to select the timing, size and term of any debt issue so as to ensure continued access to the markets and to maximize opportunities. The GTAA also monitors its debt maturity profile to minimize refinancing risk in the future.
Regulatory Compliance Risk – Airport operations are governed by a number of foreign and domestic regulations and standards. The failure to meet regulatory requirements by the GTAA may have an impact on the GTAA’s ability to operate the Airport or achieve strategic goals and objectives.
Asset Integrity Risk – The provision of services at the Airport is dependent on the availability of physical infrastructure such as terminal buildings, parking structures, runways and taxiways. In addition, the GTAA is highly dependent on information technology assets and information. Should any of these assets become unavailable due to accident, incident or maintenance failures, the ability to provide services and earn revenues may be impaired. The GTAA maintains insurance to protect against damage to property and business interruption. While the GTAA operates a well-developed asset management system, including proactive inspections, repairs and maintenance, there always remains the risk of an asset failure that may have an impact on operations or financial results.
52 gtaa annual report 2012
Aviation Environment Risk – The GTAA’s ability to derive revenues from its operation of the Airport depends on a variety of factors, many of which are not within the control of the GTAA. The health of the air transportation industry and future airline traffic at the Airport will be affected by, among other things, growth of the population and the condition of the economy of the GTA; unemployment rates; national, U.S. and international economic conditions; regulatory actions and legislative changes; international air transportation agreements; enhanced security regulations; air carrier instability; the ability and willingness of airlines to provide air service; capital market conditions; air fare levels, including taxes and surcharges; labour disputes; the availability and cost of aviation fuel; carbon emissions charges, taxes and restrictions; insurance costs; environmental regulation; the operation of the air traffic control system; the use of telecommunications and ground transportation as alternatives to air travel; volcanic eruptions; health epidemics and related travel advisories; geopolitical risk; war; and the perceived threat of terrorist attacks and additional security measures put in place to guard against such attacks.
Specific recent events that illustrate this risk include the following:
• The terrorist attacks of September 11, 2001, and the attempted terrorist attacks on December 22, 2001, and December 25, 2009, had several impacts on Toronto Pearson. Passenger growth was slowed, and new security measures, such as the federal government’s Air Travellers’ Security Charge, increased the cost of air travel; and
• The 2008 economic slowdown in the United States that spread to Canada and the rest of the world. The airlines responded to the decrease in passenger volumes in a number of ways to reduce their aircraft and seat capacity. In some cases, less profitable routes were cancelled or reduced in frequency. Some air carriers allocated smaller aircraft to lower-volume North American routes, while some air carriers substituted larger aircraft on high-volume and long-haul international routes, and adjusted their frequencies to ensure reasonable load factors. Such changes in the fleet mix and air service patterns can have an impact on the GTAA’s planning of facilities and its projection of landing fees and general terminal charges. Passenger traffic at Toronto Pearson decreased by 6.1 per cent in 2009 compared to 2008 due to the economic downturn.
The GTAA manages its costs and revenues to generate sufficient cash flow to fund operations and capital projects and to reduce existing debt. Should an event occur that has a negative impact on the aviation industry, the result may be that GTAA expenses may be underestimated or aeronautical and non-aeronautical revenues overestimated, resulting in inadequate cash flows for the GTAA to meet its operating and capital requirements or meet its debt covenants within a period or periods, as applicable.
Partnership Risk – The GTAA works in partnership with a number of other parties at the Airport in delivering services to air carriers, passengers and others. These parties include government agencies, air carriers and third-party vendors. Should any of these parties fail to deliver services as required or in coordination with other partners, there may be impacts that impede the GTAA’s ability to deliver value to its customers and stakeholders. The GTAA has limited control over its partners in many instances. A failure to capitalize on an alliance or partnership opportunity may affect the GTAA’s ability to meet business objectives. In many instances, including, for example, government agencies, there is no alternative party with which the GTAA can work to deliver the required service.
MANAGEMENT’S DISCUSSION AND ANALYSIS
gtaa annual report 2012 53
In the case of aviation service, overdependence on a limited number of air carriers may materially affect the operations and financial condition of the GTAA should one of these “significant partners” greatly reduce or cease operations at Toronto Pearson or take actions that are harmful to the GTAA. If an airline serving the Airport were to cease operations or to reduce service at the Airport, some period of time could elapse before other airlines absorb its traffic. In addition, the GTAA is exposed to the risk of financial loss if any tenant or air carrier operating at the Airport files for creditor protection or declares bankruptcy. Since Air Canada, including its regional affiliate Air Georgian, together with Air Canada Express (formerly known as Jazz, with which Air Canada has a Capacity Management Agreement), carried 56 per cent of total Airport passengers in 2012, the GTAA has a particular exposure to this air carrier. If a domestic airline ceases operations, the absorption of its domestic traffic would depend on the willingness and ability of other domestic carriers to reallocate and/or acquire additional aircraft to do so, since under current laws an airline foreign to Canada is not eligible to carry Canadian domestic traffic. The absorption of transborder and international traffic would depend on the willingness and ability of foreign and domestic airlines to reallocate and/or acquire additional aircraft to do so. The GTAA has taken measures to protect itself from defaulting air carriers by strengthening its payment terms with the air carriers and obtaining security deposits, where appropriate.
The term “partnership” used here is not a legal partnership but colloquially describes the working relationship between the GTAA and others.
Security Risk – The Canadian government is responsible for passenger, baggage and cargo screening at the Airport. The GTAA is responsible for other aspects of security, including maintaining secure access to restricted areas of the Airport and policing. Both terrorist and criminal organizations have targeted airports in the past. The inability to maintain a secure environment for the GTAA’s employees and customers and its physical and IT assets may result in a loss of confidence by the travelling public or air carriers, leading to a reduction in aviation activity at the Airport. A security breach may also result in enhanced regulation affecting air carriers, passengers or tenants and in lost revenue or additional expense to the GTAA.
Major Incident Risk – Any airport, including Toronto Pearson, is subject to the risk of a loss of confidence by air travellers as a result of a major incident such as an airline crash or terrorist attack at the Airport or elsewhere, whether or not attributable directly or indirectly to the GTAA. A major incident could cause Toronto Pearson to cease operations for a period of time, thereby reducing its revenues. The GTAA could also be blamed for the faults of others, which could result in a loss of confidence and a reduction in Airport passenger volumes.
Political Relationship Risk – The GTAA is subject to policy, regulation and legislation enacted by various levels of government, including those governing airport safety, security and operational standards. The GTAA is also a tenant of the federal government under the Ground Lease. Unanticipated or adverse changes to such policies, regulations, legislation or the Ground Lease may adversely affect the operations of the Airport and the financial condition of the GTAA. The GTAA’s relationships with politicians or government bodies affect its ability to influence positive change and deliver efficient and effective operations and meet business objectives.
Culture Change Risk – The implementation of the GTAA’s Strategic Plan and strategic imperatives requires a continuing shift in the focus of the organization from airport builder to efficient business-minded operator and customer-focused service provider. This culture change to a customer-focused service provider must be made not only by the GTAA but also by the other businesses and governmental agencies operating at the Airport. A failure to fully implement these required culture changes may have an impact on the GTAA’s ability to realize its strategic goals.
54 gtaa annual report 2012
MANAGEMENT’S DISCUSSION AND ANALYSIS
Resource Management Risk – The GTAA has undertaken a number of initiatives to implement its Strategic Plan. Should appropriate resources (skilled human and financial) not be appropriately identified, secured, aligned and prioritized, the GTAA may not be successful in implementing these plans and realizing its Strategic Plan objectives.
Brand and Reputation Risk – Any action, inaction, perceived action or perceived inaction by the GTAA, its representatives or business partners may impair Toronto Pearson’s image publicly, resulting in the loss of public confidence, increased regulator intervention or harm to Toronto Pearson’s brand.
Strategic Planning and Execution Risk – As the GTAA updates and evolves its Strategic Plan over time, there exist risks that the GTAA’s corporate strategy may not be correct, that planning processes may overlook critical operating or design considerations or that incorrect strategic or investment choices are made, which may have an impact on the GTAA’s ability to meet its business objectives. A failure to adequately identify and understand customer needs, align services consistently with them or make the required changes in customer focus may result in the GTAA’s inability to meet its business objectives. Additionally, once the updated strategy has been identified, failures in planning, resourcing or other aspects of execution may have an impact on the GTAA’s ability to meet its business objectives.
Outsourcing Risk – The GTAA contracts third parties for a number of services, including certain IT services, baggage system operation and maintenance, and the repair and maintenance of certain other assets. These services affect Airport and air carrier operations and the travelling public. There may be risks to the GTAA’s operations, financial results and reputation should the GTAA fail to adequately select, provide standards for, measure, evaluate and monitor these outside service providers.
Labour Risk – The current collective agreement between the GTAA and Canadian Auto Workers (“CAW”) Local 2002, which represents the GTAA’s unionized workers other than its firefighters, expires on July 31, 2013. In the Spring of 2013, the GTAA and CAW will commence their negotiations to determine the terms of a new collective agreement. The current collective agreement between the GTAA and the Pearson Airport Professional Firefighters Association (“PAPFFA”) expires on December 31, 2014. In the event of a labour disruption involving the GTAA’s unionized employees, the GTAA will activate a contingency plan to maintain the safe and secure operation of the Airport.
There is a risk of a strike or lockout of the unionized employees of any air carrier, tenant or service provider operating at the Airport or their respective contractors. Such actions could result in delays in accessing the Airport due to picketing activity and a decrease in the GTAA’s revenues if the air carrier, tenant or service provider’s operations are materially affected. It is anticipated that each air carrier, tenant or service provider at the Airport would implement its contingency plans in the event of a strike or lockout of their employees or their contractor’s employees. The GTAA would also implement its contingency plans in the event of such labour disruptions to ensure the safe and secure operation of the Airport.
Litigation Risk – Due to the nature of its operations and the magnitude of its development projects, the GTAA is exposed to litigation risk from time to time in the normal course of business. The GTAA manages its litigation risk primarily through its Corporate Risk division, its Governance, Legal and Corporate Policy Department, its claims settlement processes and insurance.
Litigation where GTAA is a defendant falls into two categories: litigation that is covered by insurance and litigation that is not covered by insurance. Litigation that is covered by insurance includes personal injury and property damage claims, such as the lawsuits arising from the Air France accident of August 2, 2005, where the GTAA’s financial exposure is limited to its insurance deductible.
gtaa annual report 2012 55
Litigation that is not covered by insurance includes a matter with respect to payments-in-lieu of development charges. The GTAA is not required to pay development charges directly to the City of Mississauga, the Regional Municipality of Peel (“Peel Region”) or the City of Toronto with respect to development at the Airport but rather pays a payments-in-lieu of development charges (“PILDC”) in accordance with the Payments in Lieu of Taxes Act (Canada). The amount of PILDC is calculated by Public Works and Government Services Canada (“PWGSC”). With respect to development undertaken by the GTAA at the Airport between 1996 and 2004, PWGSC paid PILDC in the amount of $0.8 million to the City of Mississauga and $4.1 million to Peel Region. As required under the Ground Lease, the GTAA reimbursed Transport Canada for such amounts. In 2008, the City of Mississauga filed an application to increase the amount of the PILDC paid to $26.6 million, but in 2012, the City reduced its claim to $4.6 million. The outcome of this application is not determinable at this time.
The City of Mississauga also submitted to PWGSC an application for PILDC with respect to Airport developments occurring after 2004. This second application will be reviewed by PWGSC once the first application has been settled. The outcome of this second application is not determinable at this time. If the City of Mississauga is successful in these applications, the GTAA would be required to pay to Transport Canada the amount of PILDC paid to the municipality by PWGSC.
Competition/Substitution Risk – In some instances air carriers and passengers may have alternatives to travelling through Toronto Pearson, including using other airports or alternate modes of transportation. There is a risk of diversion of passengers from Toronto Pearson to other airports or other modes of transportation.
Approximately 30 per cent of passenger traffic at Toronto Pearson is connecting traffic. Air carriers serving North American hub and international gateway traffic may set up their networks to flow connecting passengers through alternate airports in Canada or the United States. Additionally, individual passengers may have options when choosing a connecting airport and may select one airport over another. In either case, this may have an impact on the number and the rate of growth of connecting passengers and associated air carrier activity at Toronto Pearson.
The remaining 70 per cent of passenger activity at Toronto Pearson is originating and destination traffic, where passengers initiate or terminate a direct trip at the Airport. Originating passengers have limited choice in selecting alternatives to the Airport. Airports such as Billy Bishop City Centre Airport in Toronto and airports in Hamilton, Waterloo and Buffalo offer limited service that may be used as an alternative to Toronto Pearson to access certain destinations. While each of these airports attract passengers from the Toronto Pearson catchment area, due to their facilities and operations, they are limited in the type and volume of aviation services they can offer. The GTAA views the activity at these airports as part of a wider regional air transportation system that is complementary to the service offered at Toronto Pearson.
For a limited number of destinations, alternative modes of transportation such as automobile, bus or train may provide alternatives to air travel. Factors such as relative price and convenience may influence the choice made by travellers between different modes of transportation.
56 gtaa annual report 2012
MANAGEMENT’S DISCUSSION AND ANALYSIS
CONCLUSION
The recovery in activity and the improving financial results of the GTAA that began in 2010 have continued through 2012. However, there continues to be some risk for the air travel industry due to the uneven global economic outlook and higher oil prices. The GTAA is cautiously optimistic about future growth in Airport activity and it anticipates moderate growth in 2013. The GTAA also remains focused on activities designed to continue to reduce costs, grow non–aeronautical revenues by offering products and services which passengers value and work with air carriers to expand capacity on existing routes and attract new air service.
The GTAA believes that continued prudent planning and strategy-setting will strengthen the GTAA and enable Toronto Pearson to capitalize on growth opportunities as the economy and air travel demand continue to grow.
The GTAA is at a stage in its development where the Airport has sufficient capacity to meet passenger demand for several years. The GTAA remains keenly focused on maximizing the utilization of existing assets before investing in additional capacity. As a result, the demand for new capital development funds is greatly reduced from the period when the ADP was being implemented. While the GTAA is placing increasing emphasis on utilizing internally generated cash flows to fund capital investments, the GTAA may access the capital markets to fund the redevelopment and new capital projects discussed earlier. The GTAA’s measured approach of matching Airport capacity to demand, together with the management focus expressed in its Strategic Plan, position the GTAA well to continue to meet the developing air travel needs of the south-central Ontario region in a responsible manner.
CAUTION REGARDING FORWARD-LOOKING INFORMATION
This MD&A contains certain forward-looking information about the GTAA. This forward-looking information is based on a variety of assumptions and is subject to risks and uncertainties. There is significant risk that predictions, forecasts, conclusions and projections, which constitute forward-looking information, will not prove to be accurate, that the assumptions may not be correct and that actual results may vary from the forward-looking information. The GTAA cautions readers of this MD&A not to place undue reliance on the forward-looking information as a number of factors could cause actual results, conditions, actions or events to differ materially from the targets, expectations, estimates or intentions expressed in the forward-looking information.
Words such as “believe”, “expect”, “plan”, “intend”, “estimate”, “anticipate” and similar expressions, as well as future or conditional verbs such as “will”, “should”, “would” and “could” often identify forward-looking information. Specific forward-looking information in this MD&A includes, among others, statements regarding the goal of developing the Airport as the premier North American gateway airport; the GTAA’s strategic imperatives; demand for air travel in the GTA; growth in activity at the Airport; increases in non-aeronautical revenues; managing operating expenses; reductions in average air carrier cost per enplaned passenger; budgets and expenditures relating to capital programs; terminal, airside, infield and other capital developments at the Airport and the funding of the developments; the coming into force of new requirements relating to aviation safety and security; the relationship between the GTAA’s revenues and reserve funds and its operating expenses and interest and financing costs; the GTAA’s compliance with covenants under the Trust Indenture; airline load factors and fleet mix; the commencement of operations of facilities currently under construction at the Airport; the GTAA’s capital borrowing requirements and program and its ability to access the capital markets; funding of outstanding capital commitments; passenger projections; the implementation of new aeronautical fees and maintaining or altering those fees in 2014 and 2015; the effect of the apron fee and check-in fee on increasing efficiency in the use of Airport facilities; the impact of air carrier incentive programs and reductions in aeronautical rates on activity
gtaa annual report 2012 57
at the Airport; the GTAA’s rate-setting methodology; cash flows, working capital and liquidity; the use of current cash and cash equivalent balances; the impact of the early redemption of certain debt securities on future interest costs; the impact of terrorism or the threat of terrorism and enhanced security screening on passenger activity; reductions in greenhouse gas emissions by 2020; the GTAA’s financial exposure to lawsuits; and the impact of a strike, lockout or other labour disruption at the Airport.
The forward-looking information is based on a variety of material factors and assumptions including, but not limited to, the following: long-term growth in population, employment and personal income will provide the basis for increased aviation demand in the GTA; the Canadian, U.S. and global economies will recover and grow at expected levels; air carrier capacity will meet the demand for air travel in the GTA; the growth and sustainability of air carriers will contribute to aviation demand in the GTA; the GTA will continue to attract domestic, transborder and international travellers; the commercial aviation industry will not be significantly affected by terrorism or the threat of terrorism; the cost of enhancing aviation security will not overly burden air carriers, passengers, shippers or the GTAA; no significant event will occur that has an impact on the ordinary course of business such as a natural disaster or other calamity; the GTAA will be able to access the capital markets at competitive terms and rates; and there are no significant cost overruns or delays relating to capital programs. These assumptions are based on information currently available to the GTAA, including information obtained by the GTAA from third-party experts and analysts.
Risk factors that could cause actual results to differ materially from the results expressed or implied by forward-looking information include, among other things, continuing volatility in the economic recovery and future economic activity; high rates of unemployment; levels of aviation activity; air carrier instability; the availability of aviation liability insurance; construction risk; geopolitical unrest; terrorist attacks and the threat of terrorist attacks; war; health epidemics; labour disputes; capital market conditions; changes in laws; adverse amendments to the Ground Lease; the use of telecommunications and ground transportation as alternatives to air travel; the availability and cost of jet fuel; carbon emission costs and restrictions; adverse regulatory developments or proceedings; environmental issues; lawsuits; and other risks detailed from time to time in the GTAA’s publicly filed disclosure documents.
The forward-looking information contained in this MD&A represents expectations as of the date of this report and is subject to change. Except as required by applicable law, the GTAA disclaims any intention or obligation to update or revise any forward-looking information whether as a result of new information or future events or for any other reason.
Management’s Responsibility for Financial Reporting
The financial statements of the Greater Toronto Airports Authority have been prepared by management and approved by the Board of Directors and the Members of the Greater Toronto Airports Authority. Management is responsible for the preparation and presentation of the information contained in these financial statements and other sections of this Annual Report. The Greater Toronto Airports Authority maintains appropriate systems of internal control, policies and procedures which provide management with reasonable assurance that assets are safeguarded and that financial records are reliable and form a proper basis for the preparation of financial statements.
The Greater Toronto Airports Authority’s independent auditor, PricewaterhouseCoopers LLP, have been appointed by the Members of the Corporation to express their professional opinion on the fairness of these financial statements.
The Board of Directors ensures that management fulfills their responsibilities for financial reporting and internal controls through an Audit Committee, which is composed of five directors. This Committee reviews the financial statements and reports to the Board of Directors. The auditor has full and direct access to the Audit Committee.
HOWARD ENGPresident and Chief Executive Officer
BRIAN P. GABELVice President and Chief Financial Officer
58 gtaa annual report 2012
gtaa annual report 2012 59
Independent Auditor’s Report
To the Board of Directors of the Greater Toronto Airports Authority
We have audited the accompanying financial statements of the Greater Toronto Airports Authority, which comprise the statements of financial position as at December 31, 2012 and December 31, 2011 and the statements of operations and comprehensive income (loss), changes in deficit and accumulated comprehensive income (loss) and cash flows for the years then ended, and the related notes, which comprise a summary of significant accounting policies and other explanatory information.
Management’s responsibility for the financial statementsManagement is responsible for the preparation and fair presentation of these financial statements in accordance with International Financial Reporting Standards, and for such internal control as management determines is necessary to enable the preparation of financial statements that are free from material misstatement, whether due to fraud or error.
Auditor’s responsibilityOur responsibility is to express an opinion on these financial statements based on our audits. We conducted our audits in accordance with Canadian generally accepted auditing standards. Those standards require that we comply with ethical requirements and plan and perform the audit to obtain reasonable assurance about whether the financial statements are free from material misstatement.
An audit involves performing procedures to obtain audit evidence about the amounts and disclosures in the financial statements. The procedures selected depend on the auditor’s judgment, including theassessment of the risks of material misstatement of the financial statements, whether due to fraud or error. In making those risk assessments, the auditor considers internal control relevant to the entity’s preparation and fair presentation of the financial statements in order to design audit procedures that are appropriate in the circumstances, but not for the purpose of expressing an opinion on the effectiveness of the entity’s internal control. An audit also includes evaluating the appropriateness of accounting policies used and the reasonableness of accounting estimates made by management, as well as evaluating the overall presentation of the financial statements.
We believe that the audit evidence we have obtained is sufficient and appropriate to provide a basis for our audit opinion.
OpinionIn our opinion, the financial statements present fairly, in all material respects, the financial position of theGreater Toronto Airports Authority as at December 31, 2012 and December 31, 2011 and its financialperformance and its cash flows for the years then ended in accordance with International FinancialReporting Standards.
Chartered Accountants, Licensed Public AccountantsToronto, CanadaMarch 27, 2013
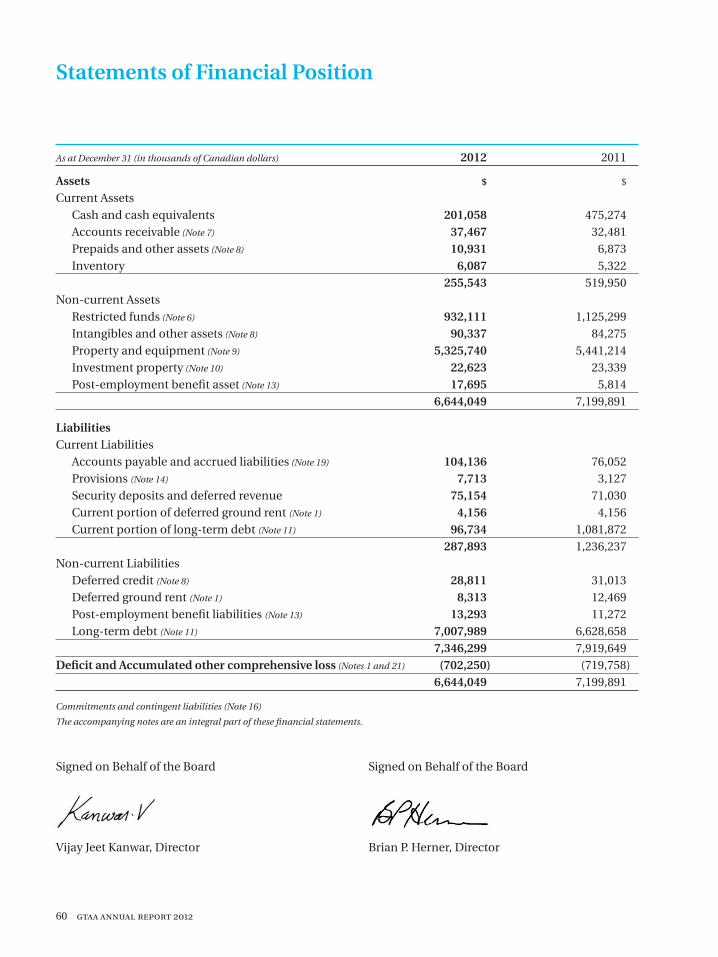
60 gtaa annual report 2012
Statements of Financial Position
As at December 31 (in thousands of Canadian dollars) 2012 2011
Assets $ $
Current Assets Cash and cash equivalents 201,058 475,274 Accounts receivable (Note 7) 37,467 32,481 Prepaids and other assets (Note 8) 10,931 6,873 Inventory 6,087 5,322 255,543 519,950 Non-current Assets Restricted funds (Note 6) 932,111 1,125,299 Intangibles and other assets (Note 8) 90,337 84,275 Property and equipment (Note 9) 5,325,740 5,441,214 Investment property (Note 10) 22,623 23,339 Post-employment benefit asset (Note 13) 17,695 5,814 6,644,049 7,199,891
Liabilities Current Liabilities Accounts payable and accrued liabilities (Note 19) 104,136 76,052 Provisions (Note 14) 7,713 3,127 Security deposits and deferred revenue 75,154 71,030 Current portion of deferred ground rent (Note 1) 4,156 4,156 Current portion of long-term debt (Note 11) 96,734 1,081,872 287,893 1,236,237 Non-current Liabilities Deferred credit (Note 8) 28,811 31,013 Deferred ground rent (Note 1) 8,313 12,469 Post-employment benefit liabilities (Note 13) 13,293 11,272 Long-term debt (Note 11) 7,007,989 6,628,658 7,346,299 7,919,649 Deficit and Accumulated other comprehensive loss (Notes 1 and 21) (702,250) (719,758) 6,644,049 7,199,891
Commitments and contingent liabilities (Note 16)
The accompanying notes are an integral part of these financial statements.
Signed on Behalf of the Board Signed on Behalf of the Board
Vijay Jeet Kanwar, Director Brian P. Herner, Director
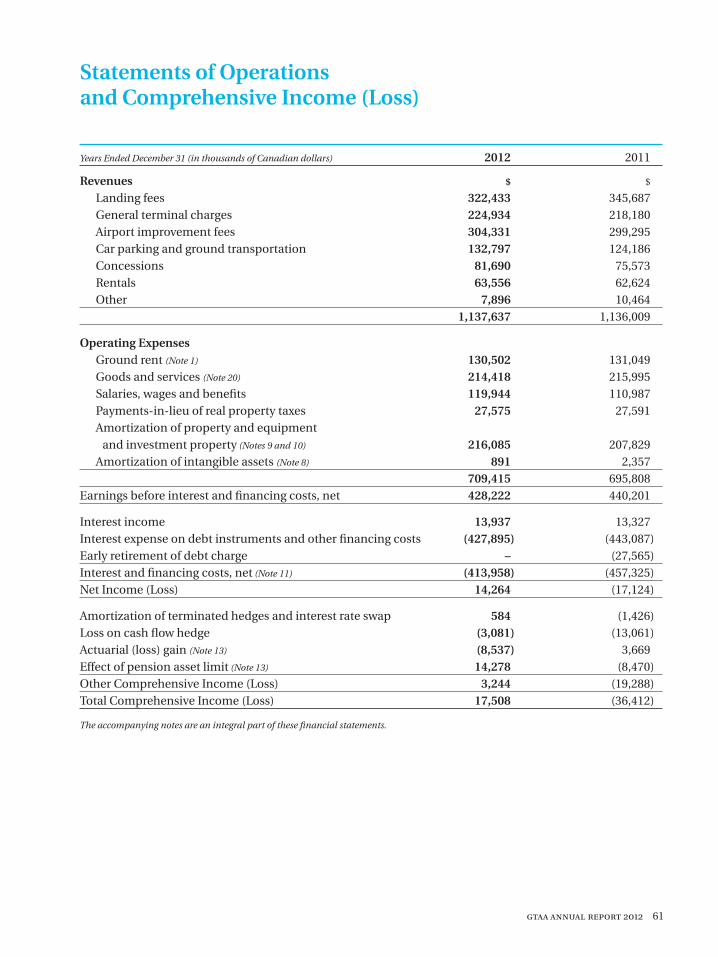
gtaa annual report 2012 61
Statements of Operations and Comprehensive Income (Loss)
Years Ended December 31 (in thousands of Canadian dollars) 2012 2011
Revenues $ $
Landing fees 322,433 345,687 General terminal charges 224,934 218,180 Airport improvement fees 304,331 299,295 Car parking and ground transportation 132,797 124,186 Concessions 81,690 75,573 Rentals 63,556 62,624 Other 7,896 10,464 1,137,637 1,136,009
Operating Expenses Ground rent (Note 1) 130,502 131,049 Goods and services (Note 20) 214,418 215,995 Salaries, wages and benefits 119,944 110,987 Payments-in-lieu of real property taxes 27,575 27,591 Amortization of property and equipment and investment property (Notes 9 and 10) 216,085 207,829 Amortization of intangible assets (Note 8) 891 2,357 709,415 695,808 Earnings before interest and financing costs, net 428,222 440,201
Interest income 13,937 13,327 Interest expense on debt instruments and other financing costs (427,895) (443,087)Early retirement of debt charge – (27,565)Interest and financing costs, net (Note 11) (413,958) (457,325)Net Income (Loss) 14,264 (17,124)
Amortization of terminated hedges and interest rate swap 584 (1,426)Loss on cash flow hedge (3,081) (13,061)Actuarial (loss) gain (Note 13) (8,537) 3,669Effect of pension asset limit (Note 13) 14,278 (8,470)Other Comprehensive Income (Loss) 3,244 (19,288)Total Comprehensive Income (Loss) 17,508 (36,412)
The accompanying notes are an integral part of these financial statements.
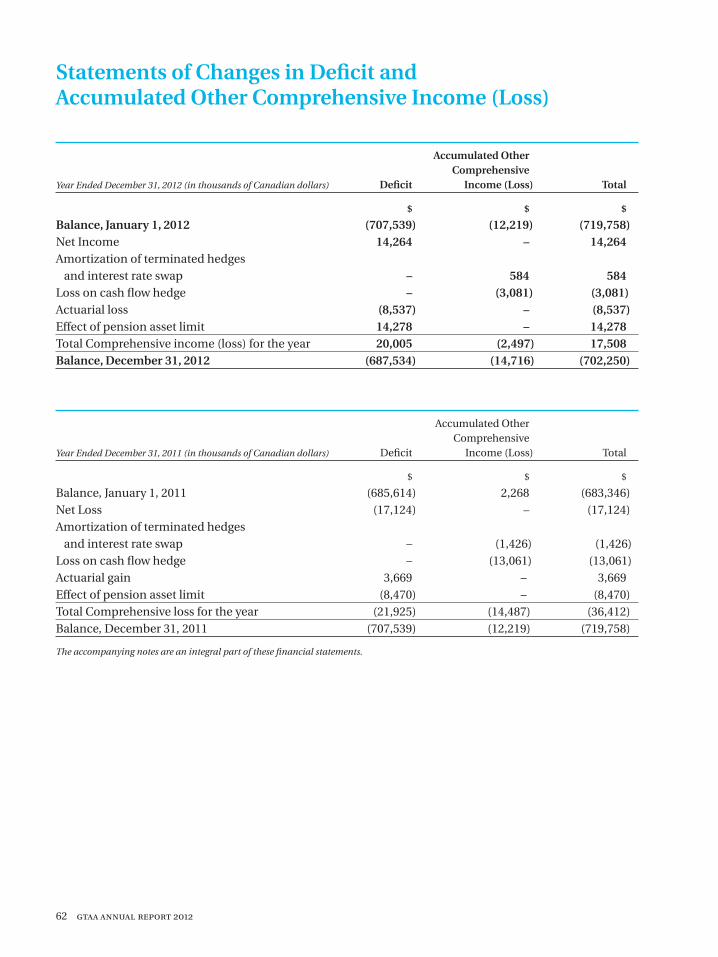
62 gtaa annual report 2012
Statements of Changes in Deficit and Accumulated Other Comprehensive Income (Loss)
Accumulated Other ComprehensiveYear Ended December 31, 2012 (in thousands of Canadian dollars) Deficit Income (Loss) Total
$ $ $
Balance, January 1, 2012 (707,539) (12,219) (719,758)Net Income 14,264 – 14,264Amortization of terminated hedges and interest rate swap – 584 584Loss on cash flow hedge – (3,081) (3,081) Actuarial loss (8,537) – (8,537)Effect of pension asset limit 14,278 – 14,278Total Comprehensive income (loss) for the year 20,005 (2,497) 17,508Balance, December 31, 2012 (687,534) (14,716) (702,250)
Accumulated Other ComprehensiveYear Ended December 31, 2011 (in thousands of Canadian dollars) Deficit Income (Loss) Total
$ $ $
Balance, January 1, 2011 (685,614) 2,268 (683,346)Net Loss (17,124) – (17,124)Amortization of terminated hedges and interest rate swap – (1,426) (1,426)Loss on cash flow hedge – (13,061) (13,061) Actuarial gain 3,669 – 3,669 Effect of pension asset limit (8,470) – (8,470)Total Comprehensive loss for the year (21,925) (14,487) (36,412)Balance, December 31, 2011 (707,539) (12,219) (719,758)
The accompanying notes are an integral part of these financial statements.
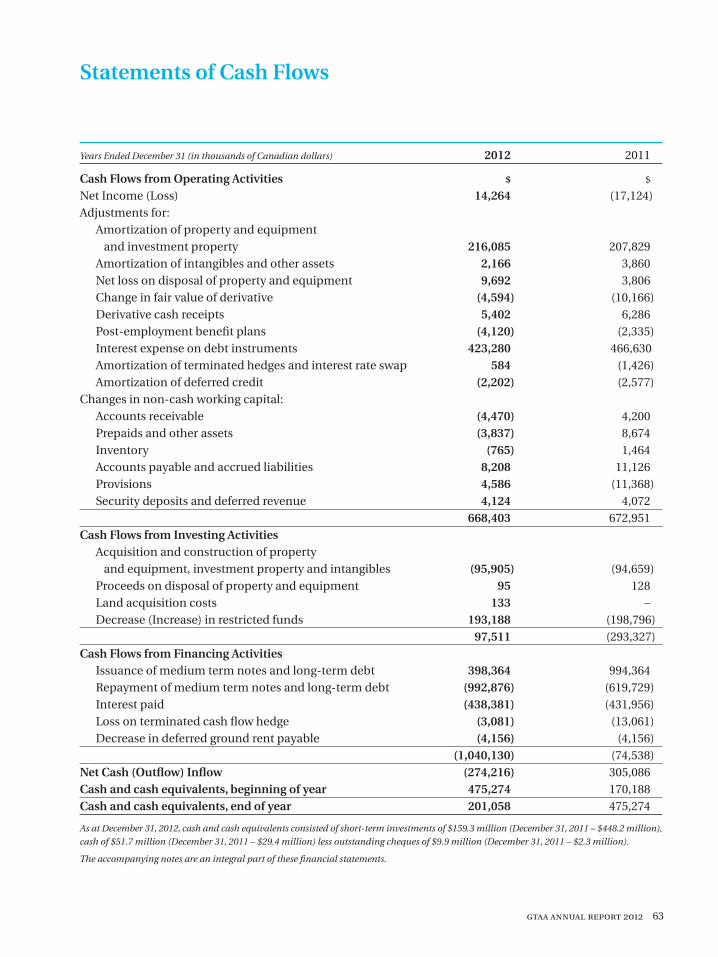
gtaa annual report 2012 63
Statements of Cash Flows
Years Ended December 31 (in thousands of Canadian dollars) 2012 2011
Cash Flows from Operating Activities $ $
Net Income (Loss) 14,264 (17,124)Adjustments for: Amortization of property and equipment and investment property 216,085 207,829 Amortization of intangibles and other assets 2,166 3,860 Net loss on disposal of property and equipment 9,692 3,806 Change in fair value of derivative (4,594) (10,166) Derivative cash receipts 5,402 6,286 Post-employment benefit plans (4,120) (2,335) Interest expense on debt instruments 423,280 466,630 Amortization of terminated hedges and interest rate swap 584 (1,426) Amortization of deferred credit (2,202) (2,577)Changes in non-cash working capital: Accounts receivable (4,470) 4,200 Prepaids and other assets (3,837) 8,674 Inventory (765) 1,464 Accounts payable and accrued liabilities 8,208 11,126 Provisions 4,586 (11,368) Security deposits and deferred revenue 4,124 4,072 668,403 672,951Cash Flows from Investing Activities Acquisition and construction of property and equipment, investment property and intangibles (95,905) (94,659) Proceeds on disposal of property and equipment 95 128 Land acquisition costs 133 – Decrease (Increase) in restricted funds 193,188 (198,796) 97,511 (293,327)Cash Flows from Financing Activities Issuance of medium term notes and long-term debt 398,364 994,364 Repayment of medium term notes and long-term debt (992,876) (619,729) Interest paid (438,381) (431,956) Loss on terminated cash flow hedge (3,081) (13,061) Decrease in deferred ground rent payable (4,156) (4,156) (1,040,130) (74,538)Net Cash (Outflow) Inflow (274,216) 305,086Cash and cash equivalents, beginning of year 475,274 170,188Cash and cash equivalents, end of year 201,058 475,274
As at December 31, 2012, cash and cash equivalents consisted of short-term investments of $159.3 million (December 31, 2011 – $448.2 million),
cash of $51.7 million (December 31, 2011 – $29.4 million) less outstanding cheques of $9.9 million (December 31, 2011 – $2.3 million).
The accompanying notes are an integral part of these financial statements.
64 gtaa annual report 2012
Notes to the Financial StatementsDecember 31, 2012 and 2011
(Unless otherwise stated, all amounts are in thousands of Canadian dollars)
1. GENERAL INFORMATION
National Airports Policy
In July 1994, the federal government announced its National Airports Policy whereby the management, operation and maintenance of 26 airports within the National Airport System was to be transferred through various ground lease arrangements to locally controlled Canadian Airport Authorities (“CAA”). The National Airports Policy also prescribed the fundamental principles for the creation and operation of CAAs, including the public accountability principles to be adopted by each CAA.
CAAs are free to operate airports on a commercial basis and have the authority to set all fees and charges. The federal government retains regulatory control over aeronautics and as such will set safety and security standards for airports, license airports and regulate the aviation industry as a whole.
Corporate Profile of the Greater Toronto Airports Authority
Greater Toronto Airports Authority (“GTAA”) was incorporated on March 3, 1993, under Part II of the Canada Corporations Act as a corporation without share capital. This corporate structure ensures that the excess of revenues over expenses is retained and reinvested in airports and airport operations under control of the GTAA. The GTAA is governed by a 15-member Board of Directors (the “Board”). Directors serve a term of three years and are eligible to be reappointed, subject to a maximum limit of nine years. Seven Directors are appointed by the Board on a cyclical basis from a pool of candidates identified in a search process, provided that at least three of these appointments are candidates who have been nominated by the Named Community Nominators composed of the Board of Trade of the City of Brampton, the Board of Trade of the City of Mississauga, the Toronto Region Board of Trade, The Law Society of Upper Canada, Professional Engineers Ontario and the Institute of Chartered Accountants of Ontario. The Board appoints five Directors from municipal candidates. Each of the regional municipalities of York, Halton, Peel and Durham and the City of Toronto is entitled to provide, on a rotating basis, the names of three candidates, and the Board appoints one of the three candidates for each available position as a Director. In addition, the Government of Canada and the Province of Ontario are entitled to appoint two Directors and one Director, respectively.
The GTAA is exempt from federal and provincial income tax, as well as real property tax under the Assessment Act (Ontario). However, the GTAA is required to pay each of the cities of Toronto and Mississauga an amount as calculated in accordance with regulations under the Assessment Act (Ontario) as a payment-in-lieu of real property taxes.
The GTAA is authorized to operate airports within the south-central Ontario region, including the Greater Toronto Area, on a commercial basis, to set fees for their use and to develop and improve the facilities. In accordance with this mandate, the GTAA manages and operates Toronto Pearson International Airport (the “Airport”). Under the terms of a ground lease, the Airport was transferred to the GTAA in 1996. The Airport operates on 1,897 hectares of land, which includes Terminals 1 and 3; airside assets, including five runways, taxiways and aprons; groundside assets, including bridges and parking lots; infield assets, including an aircraft deicing facility and cargo buildings; and ancillary structures. Excluded are any assets owned by Nav Canada, the operator of Canada’s civil air navigation system.
The GTAA is committed to the continuing development of the Airport. This includes continued redevelopment of the terminals, increasing airside capacity, increasing cargo and aircraft facilities and maintaining the roadway system.
The GTAA’s registered office and principal place of business is located at 3111 Convair Drive, Mississauga, Ontario, Canada.
gtaa annual report 2012 65
Airport Subject to Ground Lease
On December 2, 1996, the GTAA assumed the operation, management and control of the Airport for a period of 60 years, together with one renewal term of 20 years, by virtue of a ground lease (the “Ground Lease”) between the GTAA, as tenant, and Her Majesty the Queen in Right of Canada, represented by the Minister of Transport (“Transport Canada”), as landlord. The GTAA assumed the obligations of Transport Canada under all existing agreements at the Airport.
The Ground Lease is the principal document governing the relationship between the GTAA and Transport Canada at the Airport. It determines the rent to be paid and generally allocates risk and responsibilities between the GTAA and the federal government for all matters related to the operation of the Airport. Under the Ground Lease, all revenue and expenditure contracts in effect on December 1, 1996, were assigned to the GTAA. The GTAA did not assume any liability with respect to claims against the federal government incurred prior to December 2, 1996.
By virtue of its status as the tenant under the Ground Lease, the GTAA has the authority to set and collect airline rates and charges; negotiate and issue leases, licences and permits; and construct and develop the infrastructure of the Airport. The Ground Lease permits the GTAA to pledge its leasehold interest in the Airport as security.
Ground rent is calculated as a percentage of Airport Revenue, as defined by the Ground Lease and related documents, using escalating percentages with the following ranges: 0 per cent for Airport Revenue below $5.0 million, 1 per cent for Airport Revenue between $5.0 million and $10.0 million, 5 per cent for Airport Revenue between $10.0 million and $25.0 million, 8 per cent for Airport Revenue between $25.0 million and $100.0 million, 10 per cent for Airport Revenue between $100.0 million and $250.0 million, and 12 per cent for Airport Revenue in excess of $250.0 million. The calculation of Airport Revenue is subject to audit by Transport Canada.
In 2003, the Government of Canada announced a program to allow for a deferral in the ground rent for a two-year period commencing July 1, 2003, in the amount of $41.6 million. This amount is being repaid over a 10-year period, which commenced in 2006, through increased annual ground rent payments of approximately $4.2 million per year. The decrease in the liability for 2012 was approximately $4.2 million, bringing the total remaining liability at December 31, 2012, to $12.5 million.
2. BASIS OF PRESENTATION
These financial statements have been prepared in accordance with International Financial Reporting Standards (“IFRS”) as issued by the International Accounting Standards Board (“IASB”).
The policies applied in these financial statements are based on IFRS issued and outstanding as of March 27, 2013, the date the Board of Directors approved the financial statements.
The preparation of financial statements in conformity with IFRS requires the use of certain critical accounting estimates. It also requires management to exercise its judgment in the process of applying accounting policies. The areas involving a higher degree of judgment or complexity, or areas where assumptions and estimates are significant to the financial statements are disclosed in Note 5, Critical Accounting Judgments and Key Sources of Estimation Uncertainty.
3. SIGNIFICANT ACCOUNTING POLICIES
The significant accounting policies used in the preparation of these financial statements are described below.
Basis of Measurement
The financial statements have been prepared under the historical cost convention, except for the revaluation of certain financial assets and financial liabilities measured at fair value, including derivative instruments and available-for-sale investments.
66 gtaa annual report 2012
Segment Reporting
The GTAA consists of one reportable operating segment as defined under IFRS 8, Operating Segments.
Foreign Currency Translation
The financial statements are presented in Canadian dollars, which is the GTAA’s functional currency.Foreign currency transactions are translated into the functional currency using the exchange rates
prevailing at the dates of the transactions. Generally, foreign exchange gains and losses resulting from the settlement of foreign currency transactions and from the translation at year-end exchange rates of monetary assets and liabilities denominated in currencies other than the GTAA’s functional currency are recognized in the statement of operations and comprehensive income (loss).
Cash and Cash Equivalents
Cash and cash equivalents include cash on hand, deposits held with banks and other short-term, highly liquid investments with remaining terms to maturity of three months or less.
Inventory
Inventory consists of natural gas and parts and supplies held for use at the Airport. Inventory is stated at the lower of cost and net realizable value. Cost of natural gas is determined using the first-in, first-out method. Cost of parts and supplies is determined using the weighted average cost method. Net realizable value is the estimated replacement cost.
Financial Instruments
Financial assets and liabilities are recognized when the GTAA becomes a party to the contractual provisions of the instrument. Financial assets are derecognized when the rights to receive cash flows from the assets have expired or have been transferred and the GTAA has transferred substantially all risks and rewards of ownership.
Financial assets and liabilities are offset and the net amount reported in the statement of financial position when there is a legally enforceable right to offset the recognized amounts and there is an intention to settle on a net basis or realize the asset and settle the liability simultaneously.
At initial recognition, the GTAA classifies its financial instruments in the following categories, depending on the purpose for which the instruments were acquired:
(i) Financial assets and liabilities at fair value through profit or loss: A financial asset or liability is classified in this category if acquired principally for the purpose of selling or repurchasing in the short term. Derivatives are also included in this category unless they are designated as hedges. The derivative instrument held by the GTAA classified in this category is the Ontario Power Authority (“OPA”) derivative (see Note 8, Intangibles and Other Assets).
Financial instruments in this category are recognized initially and subsequently at fair value. Transaction costs are expensed in the statement of operations and comprehensive income (loss) when incurred. Gains and losses arising from changes in fair value are presented in the statement of operations and comprehensive income (loss) within goods and services expense in the period in which they arise. Financial assets and liabilities at fair value through profit or loss are classified as current except for the portion expected to be realized or paid beyond 12 months of the balance sheet date, which is classified as non-current.
(ii) Available-for-sale investments: Available-for-sale investments are non-derivatives that are either designated in this category or not classified in any of the other categories. The GTAA’s available-for-sale assets comprise investments in eligible short-term financial assets within restricted funds (see Note 6, Restricted Funds).
NOTES TO THE FINANCIAL STATEMENTS
gtaa annual report 2012 67
Available-for-sale investments are recognized initially at fair value plus transaction costs and are subsequently carried at fair value. Gains or losses arising from changes in fair value are recognized in other comprehensive income (loss).
Interest on available-for-sale investments, calculated using the effective interest method, is recognized in the statement of operations and comprehensive income (loss) as part of interest income. When an available-for-sale investment is sold or impaired, the accumulated gains or losses are moved from accumulated other comprehensive loss to the statement of operations and comprehensive income (loss) and included in interest and financing costs.
(iii) Loans and receivables: Loans and receivables are non-derivative financial assets with fixed or determinable payments that are not quoted in an active market. The GTAA’s loans and receivables are composed of accounts receivable and cash and cash equivalents and are included in current assets due to their short-term nature. Loans and receivables are initially recognized at the amount expected to be received less, when material, a discount to reduce the loans and receivables to fair value.
(iv) Financial liabilities at amortized cost: Financial liabilities at amortized cost include accounts payable and accrued liabilities, provisions, security deposits, deferred ground rent and long-term debt. These items are initially recognized at the amount required to be paid less, when material, a discount to reduce the payables to fair value. Subsequently, these items are measured at amortized cost using the effective interest method. Long-term debt is recognized initially at fair value, net of any transaction costs incurred and discount/premiums, and subsequently recorded at amortized cost using the effective interest method.
Financial liabilities are classified as current liabilities if payments are due within 12 months. Otherwise, they are presented as non-current liabilities on the statement of financial position.
(v) Derivative financial instruments: Derivatives are initially recognized at fair value on the date a derivative contract is entered into and are subsequently remeasured at fair value. The method of recognizing the resulting gain or loss depends on whether the derivative is designated as a hedging instrument and, if so, the nature of the items being hedged.
Derivative financial instruments, including interest rate swaps, bond forwards and foreign exchange hedges, may be used from time to time to reduce exposure to fluctuations in interest rates and foreign exchange rates. Payments and receipts under interest rate swap agreements will be recognized as adjustments to interest and financing costs on the statement of operations and comprehensive income (loss) where the underlying instrument is a GTAA debt issue and as adjustments to interest income where the underlying instrument is an investment. Derivative financial instruments that are not designated by the GTAA to be in an effective hedging relationship are carried at fair value with the changes in fair value, including any payments and receipts made or received, being recorded in interest and financing costs on the statement of operations and comprehensive income (loss).
Currently, the GTAA has no derivative instruments outstanding that have been designated as hedges. However, certain gains and losses relating to terminated hedging instruments are being amortized to the statement of operations and comprehensive income (loss) over the term to maturity of the previously hedged item.
Derivatives embedded in other financial instruments or contracts are separated from their host contracts and accounted for as derivatives when their economic characteristics and risks are not closely related to those of the host contract, when the terms of the embedded derivative are the same as those of a free-standing derivative, and when the combined instrument or contract is not measured at fair value, with changes in fair value recognized in interest and financing costs on the statement of operations and comprehensive income (loss).
As at December 31, 2012, the GTAA does not have any outstanding contracts or financial instruments with embedded derivatives that require bifurcation.
68 gtaa annual report 2012
Impairment of Financial Assets
At each reporting date, the GTAA assesses whether there is objective evidence that a financial asset is impaired. If such evidence exists, the GTAA recognizes an impairment loss as follows:
(i) Financial assets carried at amortized cost: The loss is the difference between the amortized cost of the loan or receivable and the present value of the estimated future cash flows, discounted using the instrument’s original effective interest rate. The carrying amount of the asset is reduced by this amount either directly or indirectly through the use of an allowance account.
(ii) Available-for-sale financial assets: The impairment loss is the difference between the original cost of the asset and its fair value at the measurement date, less any impairment losses previously recognized in the statement of operations and comprehensive income (loss). This amount represents the cumulative loss in accumulated other comprehensive loss that is reclassified to comprehensive income (loss) unless considered other than temporary.
Impairment losses on financial assets carried at amortized cost are reversed in subsequent periods if the amount of the loss decreases and the decrease can be related objectively to an event occurring after the impairment was recognized. Impairment losses on available-for-sale equity instruments are not reversed.
Impairment of Non-Financial Assets
Property and equipment and intangible assets are tested for impairment when events or changes in circumstances indicate that the carrying amount may not be recoverable. The recoverable amount is the higher of an asset’s fair value, less costs to sell, and value in use (being the present value of the expected future cash flows of the relevant asset or cash-generating unit). An impairment loss is recognized for the amount by which the asset’s carrying amount exceeds its recoverable amount.
The GTAA evaluates impairment by examining long-lived assets for impairment indicators and examines any prior-period impairment losses for potential reversals when events or circumstances warrant such consideration.
Leases
Leases are classified as finance leases whenever the terms of the lease transfer substantially all the risks and rewards of ownership to the lessee. All other leases are classified as operating leases.
Assets held under finance leases are initially recognized as assets at their fair value at the inception of the lease or, if lower, at the present value of the minimum lease payments.
The corresponding liability to the lessor is included on the statement of financial position as a finance lease obligation.
Finance lease payments are apportioned between interest and financing costs and a reduction of the lease obligation so as to achieve a constant rate of interest on the remaining balance of the liability. Interest and financing costs are recognized immediately in the statement of operations and comprehensive income (loss) unless they are directly attributable to qualifying assets, in which case they are capitalized.
Operating lease payments are recognized as an expense on a straight-line basis over the lease term except where another systematic basis is more representative of the time pattern in which economic benefits from the leased asset are consumed.
In the event that lease incentives are received to enter into operating leases, such incentives are recognized as a deferred liability. The aggregate benefit of incentives is recognized as a reduction of rental expense on a straight-line basis except where another systematic basis is more representative of the time pattern in which economic benefits from the leased asset are consumed.
The Ground Lease is accounted for as an operating lease (see Note 12, Leases).
NOTES TO THE FINANCIAL STATEMENTS
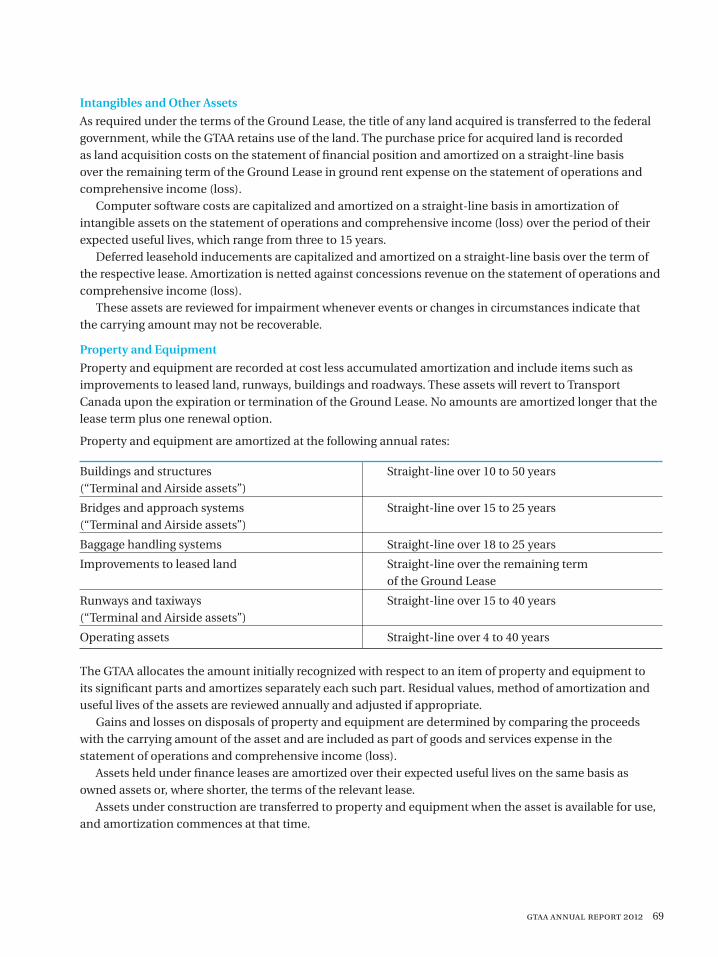
gtaa annual report 2012 69
Intangibles and Other Assets
As required under the terms of the Ground Lease, the title of any land acquired is transferred to the federal government, while the GTAA retains use of the land. The purchase price for acquired land is recorded as land acquisition costs on the statement of financial position and amortized on a straight-line basis over the remaining term of the Ground Lease in ground rent expense on the statement of operations and comprehensive income (loss).
Computer software costs are capitalized and amortized on a straight-line basis in amortization of intangible assets on the statement of operations and comprehensive income (loss) over the period of their expected useful lives, which range from three to 15 years.
Deferred leasehold inducements are capitalized and amortized on a straight-line basis over the term of the respective lease. Amortization is netted against concessions revenue on the statement of operations and comprehensive income (loss).
These assets are reviewed for impairment whenever events or changes in circumstances indicate that the carrying amount may not be recoverable.
Property and Equipment
Property and equipment are recorded at cost less accumulated amortization and include items such as improvements to leased land, runways, buildings and roadways. These assets will revert to Transport Canada upon the expiration or termination of the Ground Lease. No amounts are amortized longer that the lease term plus one renewal option.
Property and equipment are amortized at the following annual rates:
Buildings and structures Straight-line over 10 to 50 years (“Terminal and Airside assets”)
Bridges and approach systems Straight-line over 15 to 25 years (“Terminal and Airside assets”)
Baggage handling systems Straight-line over 18 to 25 years
Improvements to leased land Straight-line over the remaining term of the Ground Lease
Runways and taxiways Straight-line over 15 to 40 years (“Terminal and Airside assets”)
Operating assets Straight-line over 4 to 40 years
The GTAA allocates the amount initially recognized with respect to an item of property and equipment to its significant parts and amortizes separately each such part. Residual values, method of amortization and useful lives of the assets are reviewed annually and adjusted if appropriate.
Gains and losses on disposals of property and equipment are determined by comparing the proceeds with the carrying amount of the asset and are included as part of goods and services expense in the statement of operations and comprehensive income (loss).
Assets held under finance leases are amortized over their expected useful lives on the same basis as owned assets or, where shorter, the terms of the relevant lease.
Assets under construction are transferred to property and equipment when the asset is available for use, and amortization commences at that time.
70 gtaa annual report 2012
NOTES TO THE FINANCIAL STATEMENTS
Borrowing Costs
Borrowing costs directly attributable to the acquisition, construction or production of qualifying assets, which are assets that take a substantial period of time to get ready for their intended use, are added to the cost of those assets until such time as the assets are substantially ready for their intended use. All other borrowing costs are recognized in interest and financing costs on the statement of operations and comprehensive income (loss) in the period in which they are incurred.
Investment Property
Investment property is property held to earn rental income and is stated at historical cost less accumulated amortization and any recognized impairment loss. The fair value of investment property is estimated annually by using a discounted cash flow projection model.
Amortization on investment property assets is calculated using the straight-line method to allocate an asset’s cost over its estimated useful life. Amortization rates for each significant part range from 15 to 50 years.
Investment property is derecognized either when it has been disposed of or when the investment property is permanently withdrawn from use and no future economic benefit is expected from its disposal. The difference between the net disposal proceeds and the carrying amount of the asset is recognized in the statement of operations and comprehensive income (loss) in the period of derecognition. Transfers are made to or from the investment property category only when there is a change in use.
Revenue Recognition
Revenue is recognized when it is probable that the economic benefits will flow to the GTAA and delivery has occurred, when the sales price is fixed or determinable and when collectibility is reasonably assured.
Landing fees, general terminal charges and car parking revenues are recognized as airport facilities are utilized. Airport Improvement Fees (“AIF”) are accrued upon the enplanement of the passenger. AIF revenue is remitted to the GTAA based on airlines self-assessing their passenger counts. An annual reconciliation is performed by the GTAA with air carriers. Concessions revenue is earned on a monthly basis and is recognized based on a percentage of sales or specified minimum rent guarantees. Ground transportation revenue is recognized based on a combination of the duration of the term of the licences and permits and utilization fees. Rentals revenue is recognized straight-line over the duration of the respective agreements. Revenue derived from the Cogeneration Plant, included in other revenue, is recognized as electricity is delivered.
Post-employment Benefit Obligations
The GTAA maintains both defined benefit pension plans and defined contribution pension plans for its employees. The cost of defined contribution pension plans is charged to expense as they are earned by employees. The cost of defined benefit plans is determined using the projected unit credit method. The related pension asset/liability recognized in the statement of financial position is the present value of the defined benefit obligation at the balance sheet date less the fair value of plan assets. The present value of the defined benefit obligation is determined by discounting the estimated future cash outflows using interest rates of high-quality corporate bonds that have terms to maturity approximating the terms of the related pension liability. Actuarial valuations for defined benefit plans are carried out at each balance sheet date.
Actuarial gains and losses are recognized in full in the period in which they occur, in other comprehensive income (loss) without recycling to the statement of operations and comprehensive income (loss) in subsequent periods. Current service cost, the recognized element of any past service cost, the expected return on plan assets and the interest arising on the pension liability are included in salaries, wages and benefits on the statement of operations and comprehensive income (loss) as the related compensation cost.
Past service costs are recognized immediately to the extent the benefits are vested and otherwise are amortized on a straight-line basis over the average period until the benefits become vested.
gtaa annual report 2012 71
For funded plans, surpluses are recognized only to the extent that the surplus is considered recoverable. Recoverability is based primarily on the extent to which the GTAA can unilaterally reduce future contributions to the plan.
Provisions
Provisions are recognized when the GTAA has a present obligation (legal or constructive) as a result of a past event, when it is more likely than not that the GTAA will be required to settle the obligation and when a reliable estimate can be made of the amount of the obligation.
The amount recognized as a provision is management’s best estimate of the consideration required to settle the present obligation at the end of the reporting period, taking into account the risks and uncertainties surrounding the obligation. When the effect of the time value of money is material, provisions are measured at the present value of the expenditure expected to settle the GTAA’s present obligation.
The GTAA recognizes termination benefits when it is demonstrably committed to either terminating the employment of current employees according to a detailed formal plan without possibility of withdrawal or providing benefits as a result of an offer made to encourage voluntary termination. Benefits due more than 12 months after the end of the reporting period are discounted to their present value.
Provisions for litigation are recognized in cases where legal actions, proceedings and other claims are pending or may be instituted or asserted in the future against the GTAA that are a result of past events, where it is more likely than not that an outflow of resources embodying economic benefits will be required for the settlement and where a reliable estimate of the obligation’s amount can be made.
Onerous Contracts
Present obligations arising under onerous contracts are recognized and measured as provisions. An onerous contract is considered to exist where the GTAA has a contract under which the unavoidable costs of meeting the obligations under the contract exceed the economic benefits expected to be received under it. Currently, the GTAA has no contracts outstanding that have been designated as onerous contracts.
Deferred Financing Costs
Deferred financing costs (except for line of credit fees) and debt issuance premiums or discounts are included in debt balances and recognized as an adjustment to interest expense over the life of the debt. The GTAA uses the effective interest method to recognize bond interest expense.
4. CHANGES IN ACCOUNTING POLICY AND DISCLOSURES
In 2012, the GTAA adopted the amendments made to IFRS 7, Financial Instruments: Disclosures, which became effective in the period. The standard has been amended to include additional disclosure requirements in reporting of transfers of financial assets and the effect of risks on an entity’s financial position, as well as additional disclosure if a disproportionate amount of transfer transactions were undertaken around the end of the reporting period. There was no impact to the GTAA’s financial statements as a result of adopting the amendments to this standard.
Accounting Standards Issued But Not Yet Applied
a) Amendments to IAS 1, Presentation of Items of Other Comprehensive Income: The amendment provides guidance on the presentation of items contained in other comprehensive income (“OCI”) and their classification within OCI. The amendment is effective for periods beginning on or after July 1, 2012, with early adoption permitted. The GTAA has assessed the impact of the amended standard and has concluded that there is no significant impact to the financial statements as a result of adopting this amendment other than certain reclassifications within deficit.
72 gtaa annual report 2012
NOTES TO THE FINANCIAL STATEMENTS
b) Amendments to IAS 19, Employee Benefits: The amendment makes significant changes to the recognition and measurement of post- employment defined benefit expense and termination benefits and to the disclosures for all employee benefits. The amendment is effective for periods beginning on or after January 1, 2013, with early adoption permitted. The GTAA has assessed the impact of the amended standard and has concluded that there is no significant impact to the financial statements as a result of adopting this amendment.
c) Amendments to IFRS 7, Financial Instruments: Disclosure: The amendment enhances disclosure requirements related to offsetting of financial assets and financial liabilities. This standard is required to be applied for periods beginning on or after January 1, 2013. The standard was also amended to provide guidance on additional disclosures on transition from IAS 39, Financial Instruments: Recognition and Measurement (“IAS 39”) to IFRS 9, Financial Instruments (“IFRS 9”). These amendments are effective on adoption of IFRS 9 which is effective for years beginning on or after January 1, 2015. The GTAA does not expect any significant impact to the financial statements as a result of adopting the amendments to this standard.
d) IFRS 13, Fair Value Measurements: This standard defines fair value, provides guidance on its determination and introduces consistent requirements for disclosures on fair value measurements. This standard is required to be applied for periods beginning on or after January 1, 2013, with earlier adoption permitted. The GTAA has assessed the impact of the amended standard and has concluded that there is no significant impact to the financial statements as a result of adopting this amendment.
e) Amendment to IAS 32, Financial Instruments: Presentation: The amendment clarifies presentation requirements related to offsetting of financial assets and financial liabilities. This standard is required to be applied for periods beginning on or after January 1, 2014. The GTAA does not expect any significant impact to the financial statements as a result of adopting the amended standard.
f) IFRS 9, Financial Instruments:This standard replaces the current IAS 39. The standard introduces new requirements for classifying and measuring financial assets and liabilities. This standard is required to be applied for periods beginning on or after January 1, 2015, with earlier adoption permitted. The GTAA has not yet assessed the impact of the standard or determined whether it will adopt the standard early.
5. CRITICAL ACCOUNTING JUDGMENTS AND KEY SOURCES OF ESTIMATION UNCERTAINTY
In applying GTAA’s accounting policies, which are described in Note 3, Significant Accounting Policies, management is required to make judgments, estimates and assumptions about the carrying amount of assets and liabilities that are not readily apparent from other sources. The estimates and associated assumptions are based on historical experience and other factors that are considered to be relevant. Actual results may differ from these estimates.
Accounting estimates and underlying assumptions are reviewed on an ongoing basis. Revisions to accounting estimates are recognized in the period in which the estimate is revised if the revision affects only that period or in the period of the revision and future periods if the revision affects both current and future periods.
gtaa annual report 2012 73
Critical Judgments in Applying Accounting Policies
The following are the critical judgments that management has made in the process of applying the GTAA’s accounting policies and that have the most significant effect on the amounts recognized in the financial statements.
Accounts ReceivableThe allowance for doubtful accounts involves management judgment and review of individual receivables based on individual customer creditworthiness, current economic trends and analysis of historical bad debts.
Property and Equipment, Intangibles and Investment PropertyCritical judgments are utilized in determining amortization rates and useful lives of these assets and whether impairments are necessary in accordance with Note 3, Significant Accounting Policies.
The fair value of investment property is determined using a valuation technique that uses assumptions, including discount rates, market conditions, rental rates and other factors.
ProvisionsThe determination of a provision is based on best available accounting estimates. Such estimates are subject to change based on new information.
IFRIC 12, Service Concession ArrangementsManagement has concluded that it does not fall within the scope of International Financial Reporting Interpretations Committee (“IFRIC”) 12, Service Concession Arrangements, given the current structure of the GTAA’s arrangements with Transport Canada, whereby the GTAA is not controlled by a single government.
Key Sources of Estimation Uncertainty
The following are the key assumptions concerning the future, and other key sources of estimation uncertainty at the end of the reporting period, that have a significant risk of causing a material adjustment to the carrying amounts of assets and liabilities within the next fiscal year.
OPA DerivativeThe fair value of the GTAA’s derivative is determined using a valuation technique that uses assumptions, including discount rates, forward gas and electricity prices, plant utilization and other factors. These assumptions are subject to change depending on market and economic conditions and expected outcomes, including forward prices and volumes. Actual results may differ, resulting in adjustments to the fair value in the future. Additional information is disclosed in Note 18, Financial Instruments.
Post-employment Benefit ObligationsThe GTAA accounts for pension and other post-retirement benefits through the use of actuarial valuations. These valuations rely on statistical and other factors in order to anticipate future events. These factors include key actuarial assumptions, including discount rates, expected return on plan assets, expected salary increases and mortality rates. The most significant assumption used to calculate the post-employment benefit obligation is the discount rate. Actual results may differ from results that are estimated based on assumptions. Additional information is disclosed in Note 13, Post-employment Benefit Obligations.
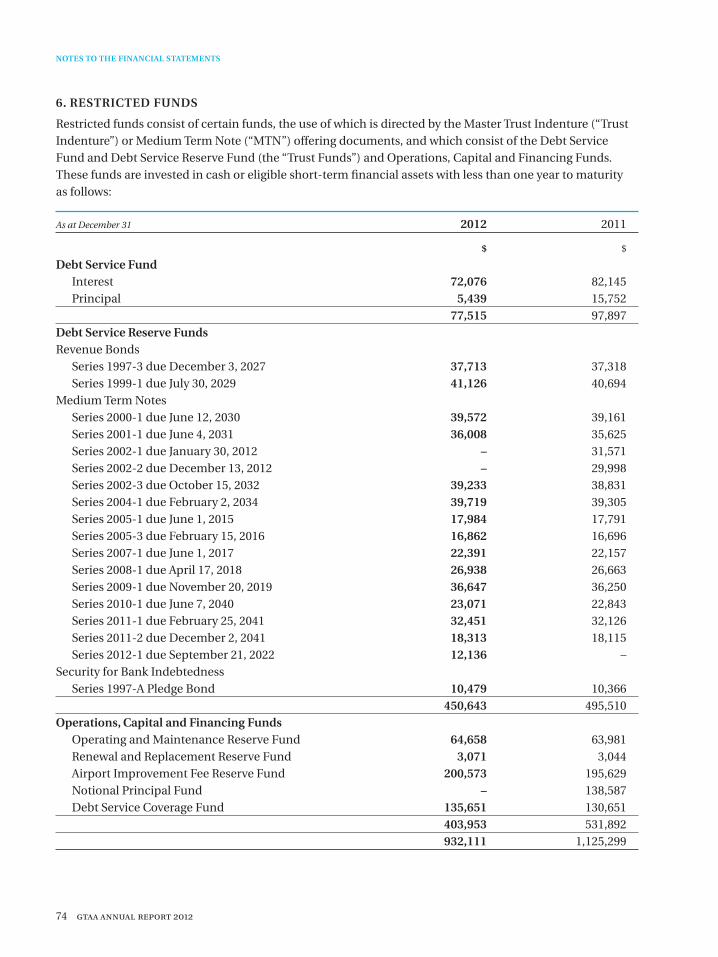
74 gtaa annual report 2012
NOTES TO THE FINANCIAL STATEMENTS
6. RESTRICTED FUNDS
Restricted funds consist of certain funds, the use of which is directed by the Master Trust Indenture (“Trust Indenture”) or Medium Term Note (“MTN”) offering documents, and which consist of the Debt Service Fund and Debt Service Reserve Fund (the “Trust Funds”) and Operations, Capital and Financing Funds. These funds are invested in cash or eligible short-term financial assets with less than one year to maturity as follows:
As at December 31 2012 2011
$ $
Debt Service Fund Interest 72,076 82,145 Principal 5,439 15,752 77,515 97,897Debt Service Reserve FundsRevenue Bonds Series 1997-3 due December 3, 2027 37,713 37,318 Series 1999-1 due July 30, 2029 41,126 40,694 Medium Term Notes Series 2000-1 due June 12, 2030 39,572 39,161 Series 2001-1 due June 4, 2031 36,008 35,625 Series 2002-1 due January 30, 2012 – 31,571 Series 2002-2 due December 13, 2012 – 29,998 Series 2002-3 due October 15, 2032 39,233 38,831 Series 2004-1 due February 2, 2034 39,719 39,305 Series 2005-1 due June 1, 2015 17,984 17,791 Series 2005-3 due February 15, 2016 16,862 16,696 Series 2007-1 due June 1, 2017 22,391 22,157 Series 2008-1 due April 17, 2018 26,938 26,663 Series 2009-1 due November 20, 2019 36,647 36,250 Series 2010-1 due June 7, 2040 23,071 22,843 Series 2011-1 due February 25, 2041 32,451 32,126 Series 2011-2 due December 2, 2041 18,313 18,115 Series 2012-1 due September 21, 2022 12,136 – Security for Bank Indebtedness Series 1997-A Pledge Bond 10,479 10,366 450,643 495,510 Operations, Capital and Financing Funds Operating and Maintenance Reserve Fund 64,658 63,981 Renewal and Replacement Reserve Fund 3,071 3,044 Airport Improvement Fee Reserve Fund 200,573 195,629 Notional Principal Fund – 138,587 Debt Service Coverage Fund 135,651 130,651 403,953 531,892 932,111 1,125,299
gtaa annual report 2012 75
Trust Funds
The GTAA is required to establish and maintain with the Trustee the Trust Funds in accordance with the terms of the Trust Indenture (see Note 11, Credit Facility and Long-Term Debt). The Trust Funds are held for the benefit of the bondholders and noteholders for use and application by the Trustee in accordance with the terms of the Trust Indenture.
(i) Debt Service Fund (Principal and Interest)Amounts in the Debt Service Fund are allocated to either a Principal Account or an Interest Account. On a monthly basis, the GTAA is required to deposit into the Principal Account an amount equal to one-twelfth of the total principal amount included in annual debt service, during the term, for any bonds or notes due in such year. The principal requirements of the Debt Service Fund were funded through cash flows from operations during the year ended December 31, 2012 and the fund balance as of December 31, 2012 was $5.4 million (December 31, 2011 – $15.8 million). Also, on a monthly basis, the GTAA is required to deposit into the Interest Account an amount equal to one-sixth of the semi-annual aggregate interest requirement due on all outstanding bonds and medium term notes. Amounts in the Debt Service Fund are held by the Trustee for the benefit of the bondholders or noteholders and are disbursed by the Trustee to pay interest and principal as they become due. During 2012, principal of $33.4 million (December 31, 2011 – $16.8 million) was paid from the Principal Account of the Debt Service Fund, and $23.0 million was deposited and/or allocated to the fund by the GTAA for the principal of the Series 1999-1, Series 2002-1 bonds and Series 2002-2 bonds and MTNs (December 31, 2011 – $23.4 million).
(ii) Debt Service Reserve FundsTo the extent provided in any supplemental indenture, the GTAA is required to set aside funds in the Debt Service Reserve Fund for each series of bond or medium term note. The required amount is established at the time of issue of each series of bond or medium term note and is funded from the proceeds of each issue. Amounts held in the Debt Service Reserve Fund are held by the Trustee for the benefit of the bondholders or noteholders for use and application in accordance with the terms of the Trust Indenture.
At the maturity of each series of bond or medium term note, funds not applied by the Trustee will be returned to the GTAA.
Included among these Trust Funds is a Debt Service Reserve Fund related to the $550.0 million pledge bond (Series 1997-A) securing the credit facility with the syndicate of six Canadian banks. The minimum required balance is adjusted annually based on the prevailing bankers’ acceptance rate plus applicable margin. At the maturity or cancellation of this series of bonds, funds not applied by the Trustee will be returned to the GTAA.
Operations, Capital and Financing Funds
The GTAA has established an Operating and Maintenance Reserve Fund and a Renewal and Replacement Reserve Fund pursuant to the Trust Indenture. The Operating and Maintenance Reserve Fund is calculated as one-sixth of the projected operating and maintenance expenses estimated for the following fiscal year. As at December 31, 2012, this fund had a balance of $64.7 million (December 31, 2011 – $64.0 million). This amount is to be used only for operating and maintenance expenses or other purposes as required for the safe, ongoing operation and maintenance of the Airport as set out in the Trust Indenture. The Renewal and Replacement Reserve Fund of $3.1 million (December 31, 2011 – $3.0 million) is to be used for unanticipated repairs to, or the replacement of, property and equipment as set out in the Trust Indenture.
In conjunction with the Airport Improvement Fee agreements with participating airlines, the GTAA has established an Airport Improvement Fee Reserve Fund for the deposit of fees collected and not yet utilized.
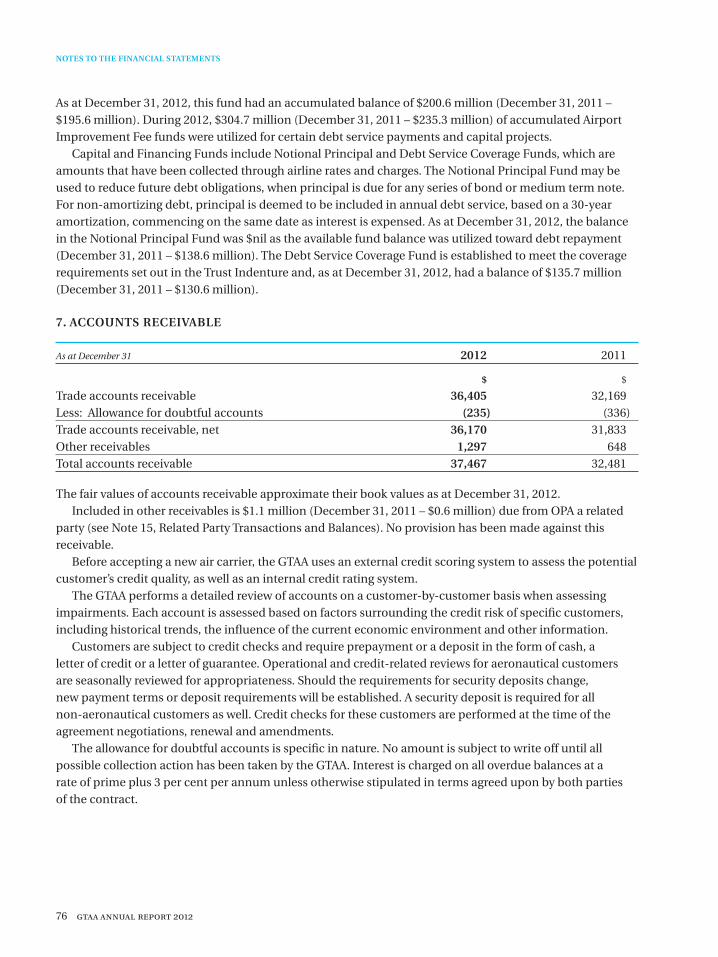
76 gtaa annual report 2012
NOTES TO THE FINANCIAL STATEMENTS
As at December 31, 2012, this fund had an accumulated balance of $200.6 million (December 31, 2011 – $195.6 million). During 2012, $304.7 million (December 31, 2011 – $235.3 million) of accumulated Airport Improvement Fee funds were utilized for certain debt service payments and capital projects.
Capital and Financing Funds include Notional Principal and Debt Service Coverage Funds, which are amounts that have been collected through airline rates and charges. The Notional Principal Fund may be used to reduce future debt obligations, when principal is due for any series of bond or medium term note. For non-amortizing debt, principal is deemed to be included in annual debt service, based on a 30-year amortization, commencing on the same date as interest is expensed. As at December 31, 2012, the balance in the Notional Principal Fund was $nil as the available fund balance was utilized toward debt repayment (December 31, 2011 – $138.6 million). The Debt Service Coverage Fund is established to meet the coverage requirements set out in the Trust Indenture and, as at December 31, 2012, had a balance of $135.7 million (December 31, 2011 – $130.6 million).
7. ACCOUNTS RECEIVABLE
As at December 31 2012 2011
$ $
Trade accounts receivable 36,405 32,169 Less: Allowance for doubtful accounts (235) (336)Trade accounts receivable, net 36,170 31,833 Other receivables 1,297 648 Total accounts receivable 37,467 32,481
The fair values of accounts receivable approximate their book values as at December 31, 2012.Included in other receivables is $1.1 million (December 31, 2011 – $0.6 million) due from OPA a related
party (see Note 15, Related Party Transactions and Balances). No provision has been made against this receivable.
Before accepting a new air carrier, the GTAA uses an external credit scoring system to assess the potential customer’s credit quality, as well as an internal credit rating system.
The GTAA performs a detailed review of accounts on a customer-by-customer basis when assessing impairments. Each account is assessed based on factors surrounding the credit risk of specific customers, including historical trends, the influence of the current economic environment and other information.
Customers are subject to credit checks and require prepayment or a deposit in the form of cash, a letter of credit or a letter of guarantee. Operational and credit-related reviews for aeronautical customers are seasonally reviewed for appropriateness. Should the requirements for security deposits change, new payment terms or deposit requirements will be established. A security deposit is required for all non-aeronautical customers as well. Credit checks for these customers are performed at the time of the agreement negotiations, renewal and amendments.
The allowance for doubtful accounts is specific in nature. No amount is subject to write off until all possible collection action has been taken by the GTAA. Interest is charged on all overdue balances at a rate of prime plus 3 per cent per annum unless otherwise stipulated in terms agreed upon by both parties of the contract.
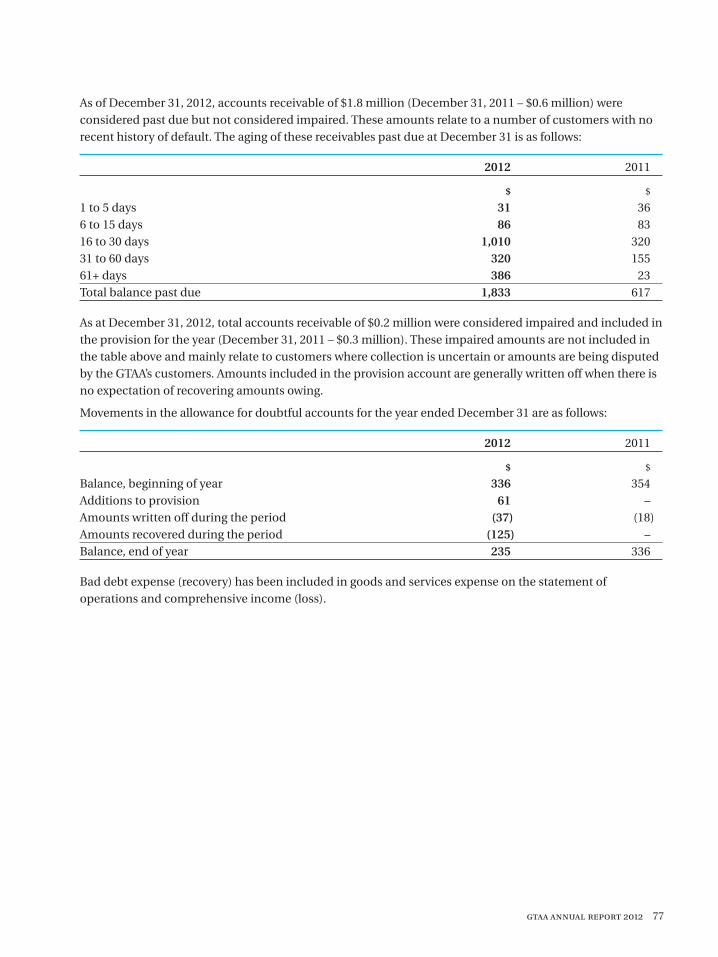
gtaa annual report 2012 77
As of December 31, 2012, accounts receivable of $1.8 million (December 31, 2011 – $0.6 million) were considered past due but not considered impaired. These amounts relate to a number of customers with no recent history of default. The aging of these receivables past due at December 31 is as follows:
2012 2011
$ $
1 to 5 days 31 36 6 to 15 days 86 83 16 to 30 days 1,010 320 31 to 60 days 320 155 61+ days 386 23 Total balance past due 1,833 617
As at December 31, 2012, total accounts receivable of $0.2 million were considered impaired and included in the provision for the year (December 31, 2011 – $0.3 million). These impaired amounts are not included in the table above and mainly relate to customers where collection is uncertain or amounts are being disputed by the GTAA’s customers. Amounts included in the provision account are generally written off when there is no expectation of recovering amounts owing.
Movements in the allowance for doubtful accounts for the year ended December 31 are as follows:
2012 2011
$ $
Balance, beginning of year 336 354Additions to provision 61 –Amounts written off during the period (37) (18)Amounts recovered during the period (125) – Balance, end of year 235 336
Bad debt expense (recovery) has been included in goods and services expense on the statement of operations and comprehensive income (loss).
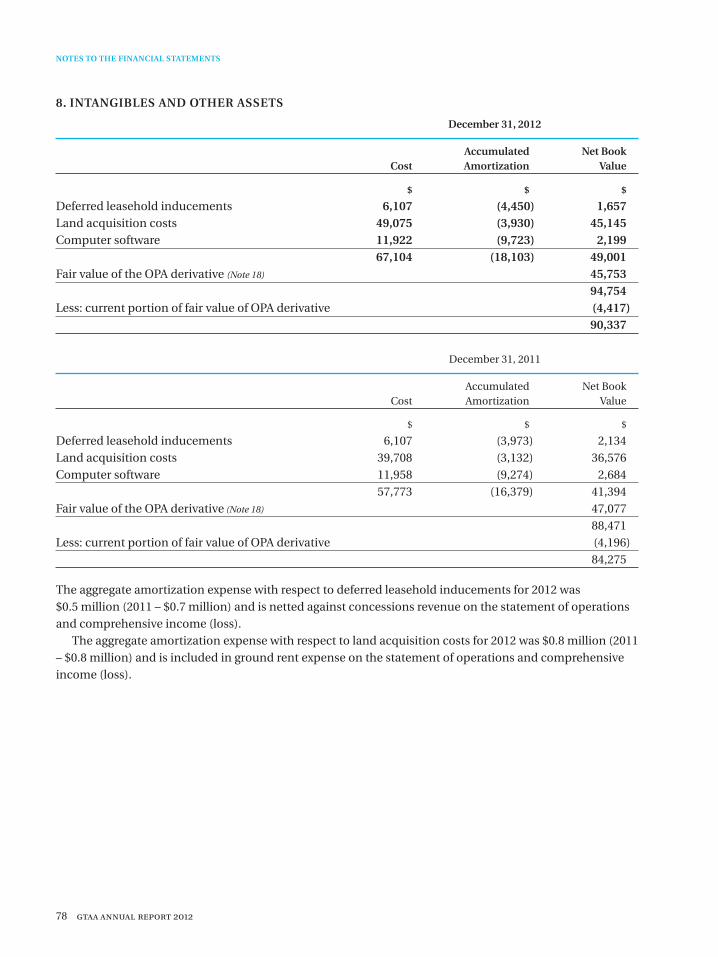
78 gtaa annual report 2012
NOTES TO THE FINANCIAL STATEMENTS
8. INTANGIBLES AND OTHER ASSETS
December 31, 2012
Accumulated Net Book Cost Amortization Value
$ $ $
Deferred leasehold inducements 6,107 (4,450) 1,657Land acquisition costs 49,075 (3,930) 45,145Computer software 11,922 (9,723) 2,199 67,104 (18,103) 49,001Fair value of the OPA derivative (Note 18) 45,753 94,754Less: current portion of fair value of OPA derivative (4,417) 90,337 December 31, 2011
Accumulated Net Book Cost Amortization Value
$ $ $
Deferred leasehold inducements 6,107 (3,973) 2,134Land acquisition costs 39,708 (3,132) 36,576Computer software 11,958 (9,274) 2,684 57,773 (16,379) 41,394Fair value of the OPA derivative (Note 18) 47,077 88,471Less: current portion of fair value of OPA derivative (4,196) 84,275
The aggregate amortization expense with respect to deferred leasehold inducements for 2012 was $0.5 million (2011 – $0.7 million) and is netted against concessions revenue on the statement of operations and comprehensive income (loss).
The aggregate amortization expense with respect to land acquisition costs for 2012 was $0.8 million (2011 – $0.8 million) and is included in ground rent expense on the statement of operations and comprehensive income (loss).
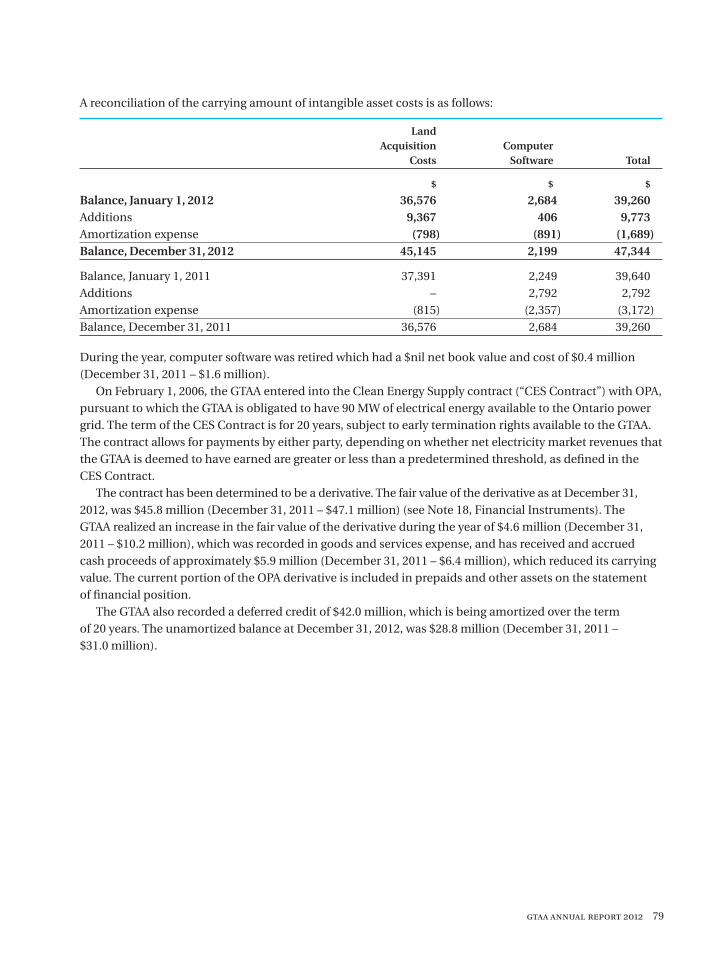
gtaa annual report 2012 79
A reconciliation of the carrying amount of intangible asset costs is as follows:
Land Acquisition Computer Costs Software Total
$ $ $
Balance, January 1, 2012 36,576 2,684 39,260 Additions 9,367 406 9,773 Amortization expense (798) (891) (1,689)Balance, December 31, 2012 45,145 2,199 47,344
Balance, January 1, 2011 37,391 2,249 39,640 Additions – 2,792 2,792 Amortization expense (815) (2,357) (3,172)Balance, December 31, 2011 36,576 2,684 39,260
During the year, computer software was retired which had a $nil net book value and cost of $0.4 million (December 31, 2011 – $1.6 million).
On February 1, 2006, the GTAA entered into the Clean Energy Supply contract (“CES Contract”) with OPA, pursuant to which the GTAA is obligated to have 90 MW of electrical energy available to the Ontario power grid. The term of the CES Contract is for 20 years, subject to early termination rights available to the GTAA. The contract allows for payments by either party, depending on whether net electricity market revenues that the GTAA is deemed to have earned are greater or less than a predetermined threshold, as defined in the CES Contract.
The contract has been determined to be a derivative. The fair value of the derivative as at December 31, 2012, was $45.8 million (December 31, 2011 – $47.1 million) (see Note 18, Financial Instruments). The GTAA realized an increase in the fair value of the derivative during the year of $4.6 million (December 31, 2011 – $10.2 million), which was recorded in goods and services expense, and has received and accrued cash proceeds of approximately $5.9 million (December 31, 2011 – $6.4 million), which reduced its carrying value. The current portion of the OPA derivative is included in prepaids and other assets on the statement of financial position.
The GTAA also recorded a deferred credit of $42.0 million, which is being amortized over the term of 20 years. The unamortized balance at December 31, 2012, was $28.8 million (December 31, 2011 – $31.0 million).
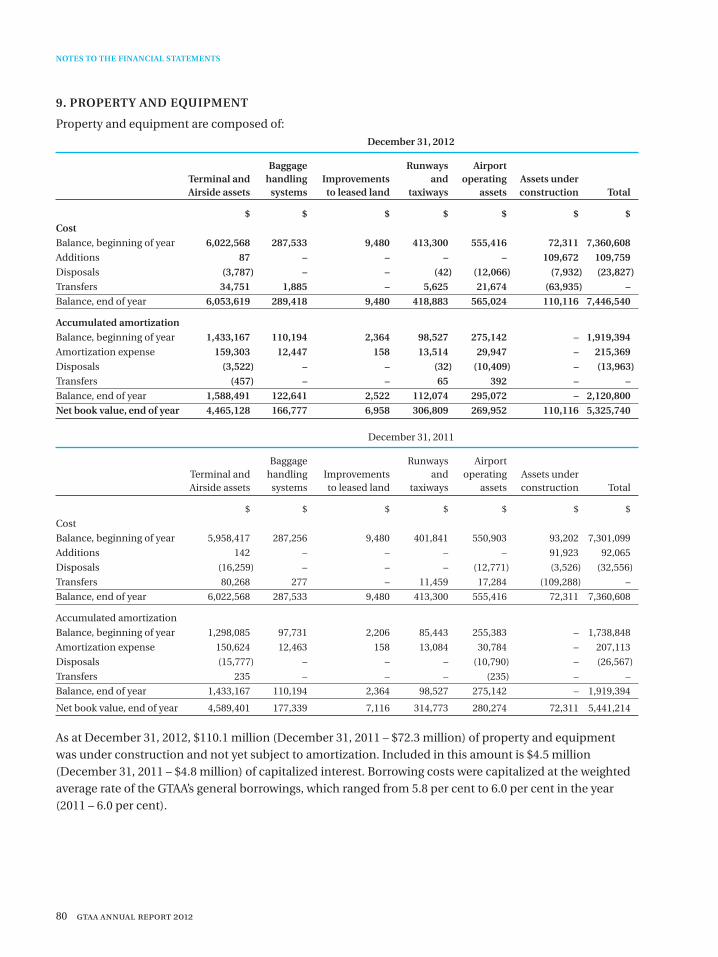
80 gtaa annual report 2012
NOTES TO THE FINANCIAL STATEMENTS
9. PROPERTY AND EQUIPMENT
Property and equipment are composed of:
December 31, 2012
Baggage Runways Airport Terminal and handling Improvements and operating Assets under Airside assets systems to leased land taxiways assets construction Total
$ $ $ $ $ $ $
Cost
Balance, beginning of year 6,022,568 287,533 9,480 413,300 555,416 72,311 7,360,608
Additions 87 – – – – 109,672 109,759
Disposals (3,787) – – (42) (12,066) (7,932) (23,827)
Transfers 34,751 1,885 – 5,625 21,674 (63,935) –
Balance, end of year 6,053,619 289,418 9,480 418,883 565,024 110,116 7,446,540
Accumulated amortization
Balance, beginning of year 1,433,167 110,194 2,364 98,527 275,142 – 1,919,394
Amortization expense 159,303 12,447 158 13,514 29,947 – 215,369
Disposals (3,522) – – (32) (10,409) – (13,963)
Transfers (457) – – 65 392 – –
Balance, end of year 1,588,491 122,641 2,522 112,074 295,072 – 2,120,800
Net book value, end of year 4,465,128 166,777 6,958 306,809 269,952 110,116 5,325,740
December 31, 2011
Baggage Runways Airport Terminal and handling Improvements and operating Assets under Airside assets systems to leased land taxiways assets construction Total
$ $ $ $ $ $ $
Cost
Balance, beginning of year 5,958,417 287,256 9,480 401,841 550,903 93,202 7,301,099
Additions 142 – – – – 91,923 92,065
Disposals (16,259) – – – (12,771) (3,526) (32,556)
Transfers 80,268 277 – 11,459 17,284 (109,288) –
Balance, end of year 6,022,568 287,533 9,480 413,300 555,416 72,311 7,360,608
Accumulated amortization
Balance, beginning of year 1,298,085 97,731 2,206 85,443 255,383 – 1,738,848
Amortization expense 150,624 12,463 158 13,084 30,784 – 207,113
Disposals (15,777) – – – (10,790) – (26,567)
Transfers 235 – – – (235) – –
Balance, end of year 1,433,167 110,194 2,364 98,527 275,142 – 1,919,394
Net book value, end of year 4,589,401 177,339 7,116 314,773 280,274 72,311 5,441,214
As at December 31, 2012, $110.1 million (December 31, 2011 – $72.3 million) of property and equipment was under construction and not yet subject to amortization. Included in this amount is $4.5 million (December 31, 2011 – $4.8 million) of capitalized interest. Borrowing costs were capitalized at the weighted average rate of the GTAA’s general borrowings, which ranged from 5.8 per cent to 6.0 per cent in the year (2011 – 6.0 per cent).
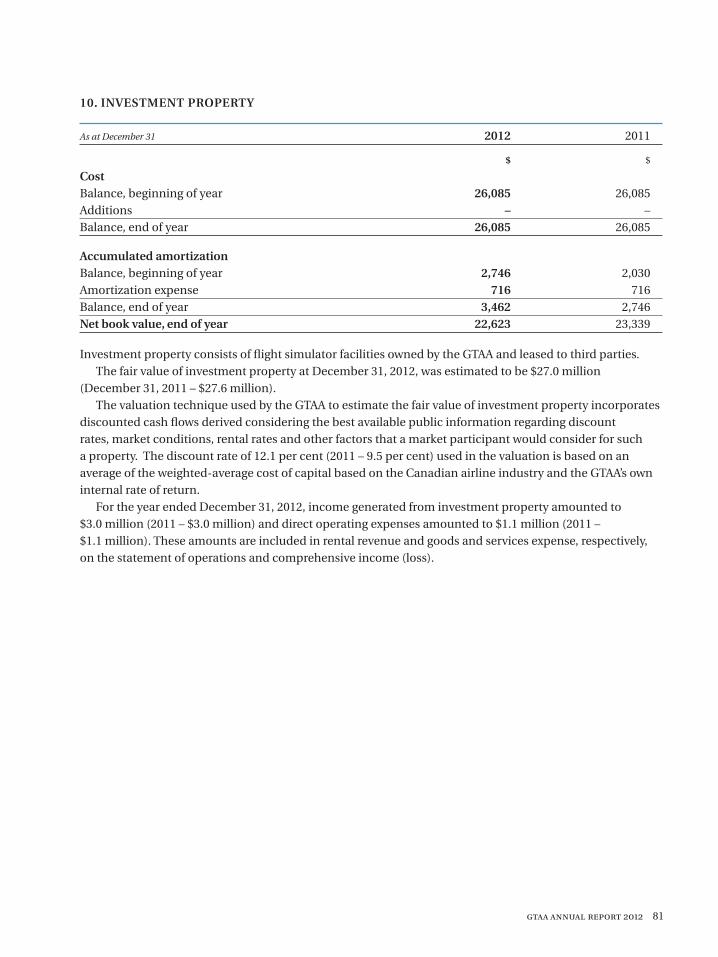
gtaa annual report 2012 81
10. INVESTMENT PROPERTY
As at December 31 2012 2011
$ $ CostBalance, beginning of year 26,085 26,085 Additions – – Balance, end of year 26,085 26,085
Accumulated amortization Balance, beginning of year 2,746 2,030 Amortization expense 716 716 Balance, end of year 3,462 2,746 Net book value, end of year 22,623 23,339
Investment property consists of flight simulator facilities owned by the GTAA and leased to third parties. The fair value of investment property at December 31, 2012, was estimated to be $27.0 million
(December 31, 2011 – $27.6 million). The valuation technique used by the GTAA to estimate the fair value of investment property incorporates
discounted cash flows derived considering the best available public information regarding discount rates, market conditions, rental rates and other factors that a market participant would consider for such a property. The discount rate of 12.1 per cent (2011 – 9.5 per cent) used in the valuation is based on an average of the weighted-average cost of capital based on the Canadian airline industry and the GTAA’s own internal rate of return.
For the year ended December 31, 2012, income generated from investment property amounted to $3.0 million (2011 – $3.0 million) and direct operating expenses amounted to $1.1 million (2011 – $1.1 million). These amounts are included in rental revenue and goods and services expense, respectively, on the statement of operations and comprehensive income (loss).
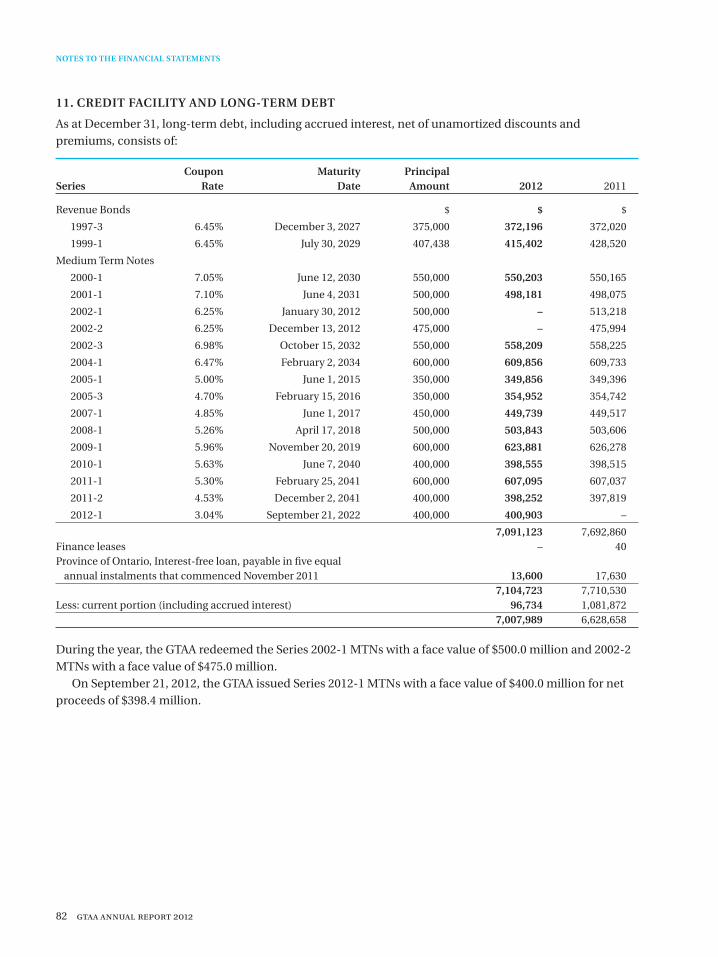
82 gtaa annual report 2012
NOTES TO THE FINANCIAL STATEMENTS
11. CREDIT FACILITY AND LONG-TERM DEBT
As at December 31, long-term debt, including accrued interest, net of unamortized discounts and premiums, consists of:
Coupon Maturity Principal Series Rate Date Amount 2012 2011
Revenue Bonds $ $ $
1997-3 6.45% December 3, 2027 375,000 372,196 372,020
1999-1 6.45% July 30, 2029 407,438 415,402 428,520
Medium Term Notes
2000-1 7.05% June 12, 2030 550,000 550,203 550,165
2001-1 7.10% June 4, 2031 500,000 498,181 498,075
2002-1 6.25% January 30, 2012 500,000 – 513,218
2002-2 6.25% December 13, 2012 475,000 – 475,994
2002-3 6.98% October 15, 2032 550,000 558,209 558,225
2004-1 6.47% February 2, 2034 600,000 609,856 609,733
2005-1 5.00% June 1, 2015 350,000 349,856 349,396
2005-3 4.70% February 15, 2016 350,000 354,952 354,742
2007-1 4.85% June 1, 2017 450,000 449,739 449,517
2008-1 5.26% April 17, 2018 500,000 503,843 503,606
2009-1 5.96% November 20, 2019 600,000 623,881 626,278
2010-1 5.63% June 7, 2040 400,000 398,555 398,515
2011-1 5.30% February 25, 2041 600,000 607,095 607,037
2011-2 4.53% December 2, 2041 400,000 398,252 397,819
2012-1 3.04% September 21, 2022 400,000 400,903 –
7,091,123 7,692,860Finance leases – 40Province of Ontario, Interest-free loan, payable in five equal annual instalments that commenced November 2011 13,600 17,630 7,104,723 7,710,530 Less: current portion (including accrued interest) 96,734 1,081,872 7,007,989 6,628,658
During the year, the GTAA redeemed the Series 2002-1 MTNs with a face value of $500.0 million and 2002-2 MTNs with a face value of $475.0 million.
On September 21, 2012, the GTAA issued Series 2012-1 MTNs with a face value of $400.0 million for net proceeds of $398.4 million.
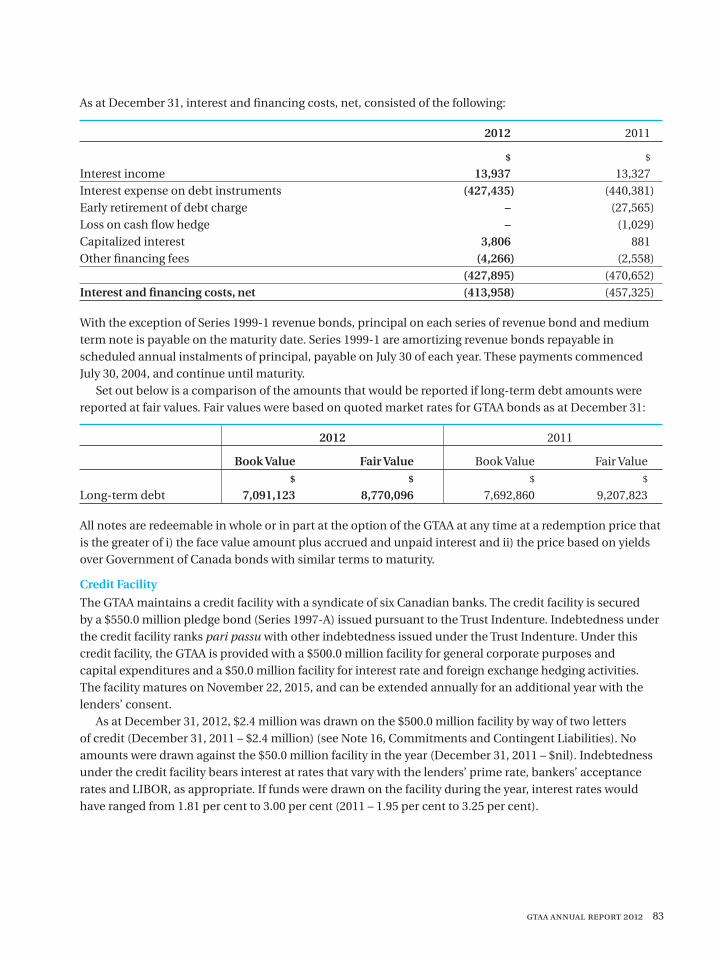
gtaa annual report 2012 83
As at December 31, interest and financing costs, net, consisted of the following:
2012 2011
$ $
Interest income 13,937 13,327 Interest expense on debt instruments (427,435) (440,381)Early retirement of debt charge – (27,565)Loss on cash flow hedge – (1,029)Capitalized interest 3,806 881 Other financing fees (4,266) (2,558) (427,895) (470,652)Interest and financing costs, net (413,958) (457,325)
With the exception of Series 1999-1 revenue bonds, principal on each series of revenue bond and medium term note is payable on the maturity date. Series 1999-1 are amortizing revenue bonds repayable in scheduled annual instalments of principal, payable on July 30 of each year. These payments commenced July 30, 2004, and continue until maturity.
Set out below is a comparison of the amounts that would be reported if long-term debt amounts were reported at fair values. Fair values were based on quoted market rates for GTAA bonds as at December 31:
2012 2011
Book Value Fair Value Book Value Fair Value $ $ $ $ Long-term debt 7,091,123 8,770,096 7,692,860 9,207,823
All notes are redeemable in whole or in part at the option of the GTAA at any time at a redemption price that is the greater of i) the face value amount plus accrued and unpaid interest and ii) the price based on yields over Government of Canada bonds with similar terms to maturity.
Credit Facility
The GTAA maintains a credit facility with a syndicate of six Canadian banks. The credit facility is secured by a $550.0 million pledge bond (Series 1997-A) issued pursuant to the Trust Indenture. Indebtedness under the credit facility ranks pari passu with other indebtedness issued under the Trust Indenture. Under this credit facility, the GTAA is provided with a $500.0 million facility for general corporate purposes and capital expenditures and a $50.0 million facility for interest rate and foreign exchange hedging activities. The facility matures on November 22, 2015, and can be extended annually for an additional year with the lenders’ consent.
As at December 31, 2012, $2.4 million was drawn on the $500.0 million facility by way of two letters of credit (December 31, 2011 – $2.4 million) (see Note 16, Commitments and Contingent Liabilities). No amounts were drawn against the $50.0 million facility in the year (December 31, 2011 – $nil). Indebtedness under the credit facility bears interest at rates that vary with the lenders’ prime rate, bankers’ acceptance rates and LIBOR, as appropriate. If funds were drawn on the facility during the year, interest rates would have ranged from 1.81 per cent to 3.00 per cent (2011 – 1.95 per cent to 3.25 per cent).
84 gtaa annual report 2012
12. LEASES
Ground Lease
The GTAA’s commitment with respect to annual ground lease airport rent is based on a percentage of GTAA’s revenues (see Airport Subject to Ground Lease in Note 1, General Information). Ground rent expense in 2012 was $130.5 million (2011 – $131.0 million). Estimated revenues are subject to change depending on economic conditions and, as a result, ground lease payments are subject to change. The lease continues until 2056.
Other Leases
The GTAA, as the lessor, leases under operating leases land and certain assets that are included in property and equipment. Many leases include renewal options, in which case they are subject to market price revision. The lessees do not have the possibility to acquire the leased assets at the end of the lease.
Contingent rents form part of certain lease agreements. Total contingent rent recognized in the state-ment of operations and comprehensive income (loss) for 2012 was $109.3 million (2011 – $101.8 million).
Future minimum lease receipts (excluding contingent rent payments) from non-cancellable leases are as follows:
Within 1 year 1 to 5 years After 5 years Total
$ $ $ $
December 31, 2012 49,166 141,922 216,093 407,181 December 31, 2011 51,387 157,462 206,409 415,258
13. POST-EMPLOYMENT BENEFIT OBLIGATIONS
Defined Benefit Pension Plans
The GTAA maintains two pension plans with defined benefit provisions. One of these plans is a registered pension plan for former Transport Canada employees who were eligible to elect to transfer their pension credits to the GTAA plan.
The GTAA measures its accrued benefit obligations and the fair value of plan assets for accounting purposes as at December 31 of each year. The most recent actuarial valuation of the pension plans for funding purposes was as of January 1, 2012, and the next required valuation will be as of January 1, 2013.
NOTES TO THE FINANCIAL STATEMENTS
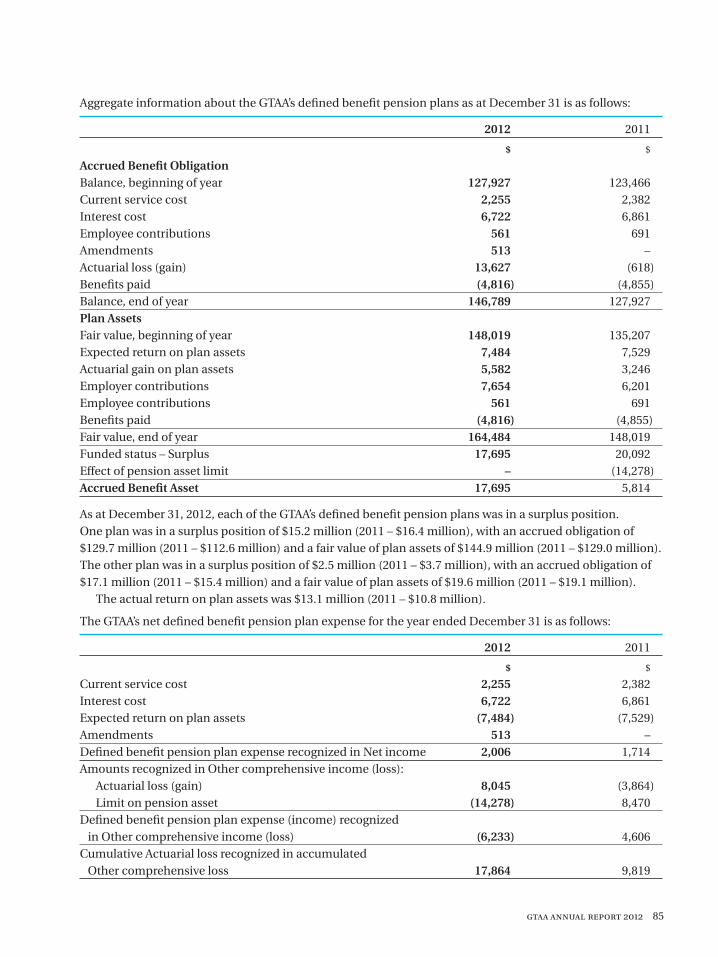
gtaa annual report 2012 85
Aggregate information about the GTAA’s defined benefit pension plans as at December 31 is as follows:
2012 2011
$ $
Accrued Benefit Obligation Balance, beginning of year 127,927 123,466 Current service cost 2,255 2,382 Interest cost 6,722 6,861 Employee contributions 561 691 Amendments 513 – Actuarial loss (gain) 13,627 (618)Benefits paid (4,816) (4,855)Balance, end of year 146,789 127,927 Plan Assets Fair value, beginning of year 148,019 135,207 Expected return on plan assets 7,484 7,529 Actuarial gain on plan assets 5,582 3,246 Employer contributions 7,654 6,201 Employee contributions 561 691 Benefits paid (4,816) (4,855)Fair value, end of year 164,484 148,019 Funded status – Surplus 17,695 20,092 Effect of pension asset limit – (14,278)Accrued Benefit Asset 17,695 5,814
As at December 31, 2012, each of the GTAA’s defined benefit pension plans was in a surplus position. One plan was in a surplus position of $15.2 million (2011 – $16.4 million), with an accrued obligation of $129.7 million (2011 – $112.6 million) and a fair value of plan assets of $144.9 million (2011 – $129.0 million). The other plan was in a surplus position of $2.5 million (2011 – $3.7 million), with an accrued obligation of $17.1 million (2011 – $15.4 million) and a fair value of plan assets of $19.6 million (2011 – $19.1 million).
The actual return on plan assets was $13.1 million (2011 – $10.8 million).
The GTAA’s net defined benefit pension plan expense for the year ended December 31 is as follows:
2012 2011
$ $
Current service cost 2,255 2,382Interest cost 6,722 6,861Expected return on plan assets (7,484) (7,529)Amendments 513 – Defined benefit pension plan expense recognized in Net income 2,006 1,714Amounts recognized in Other comprehensive income (loss): Actuarial loss (gain) 8,045 (3,864) Limit on pension asset (14,278) 8,470Defined benefit pension plan expense (income) recognized in Other comprehensive income (loss) (6,233) 4,606Cumulative Actuarial loss recognized in accumulated Other comprehensive loss 17,864 9,819
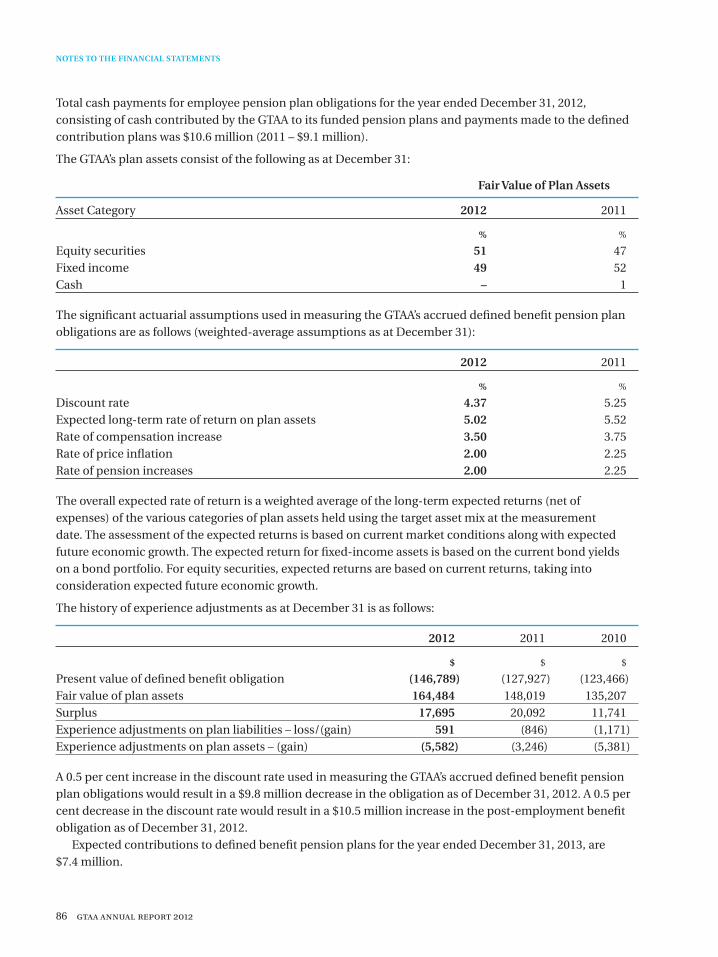
86 gtaa annual report 2012
NOTES TO THE FINANCIAL STATEMENTS
Total cash payments for employee pension plan obligations for the year ended December 31, 2012, consisting of cash contributed by the GTAA to its funded pension plans and payments made to the defined contribution plans was $10.6 million (2011 – $9.1 million).
The GTAA’s plan assets consist of the following as at December 31:
Fair Value of Plan Assets
Asset Category 2012 2011
% %
Equity securities 51 47 Fixed income 49 52 Cash – 1
The significant actuarial assumptions used in measuring the GTAA’s accrued defined benefit pension plan obligations are as follows (weighted-average assumptions as at December 31):
2012 2011
% % Discount rate 4.37 5.25 Expected long-term rate of return on plan assets 5.02 5.52 Rate of compensation increase 3.50 3.75 Rate of price inflation 2.00 2.25 Rate of pension increases 2.00 2.25
The overall expected rate of return is a weighted average of the long-term expected returns (net of expenses) of the various categories of plan assets held using the target asset mix at the measurement date. The assessment of the expected returns is based on current market conditions along with expected future economic growth. The expected return for fixed-income assets is based on the current bond yields on a bond portfolio. For equity securities, expected returns are based on current returns, taking into consideration expected future economic growth.
The history of experience adjustments as at December 31 is as follows:
2012 2011 2010
$ $ $
Present value of defined benefit obligation (146,789) (127,927) (123,466)Fair value of plan assets 164,484 148,019 135,207Surplus 17,695 20,092 11,741Experience adjustments on plan liabilities – loss/(gain) 591 (846) (1,171)Experience adjustments on plan assets – (gain) (5,582) (3,246) (5,381)
A 0.5 per cent increase in the discount rate used in measuring the GTAA’s accrued defined benefit pension plan obligations would result in a $9.8 million decrease in the obligation as of December 31, 2012. A 0.5 per cent decrease in the discount rate would result in a $10.5 million increase in the post-employment benefit obligation as of December 31, 2012.
Expected contributions to defined benefit pension plans for the year ended December 31, 2013, are $7.4 million.
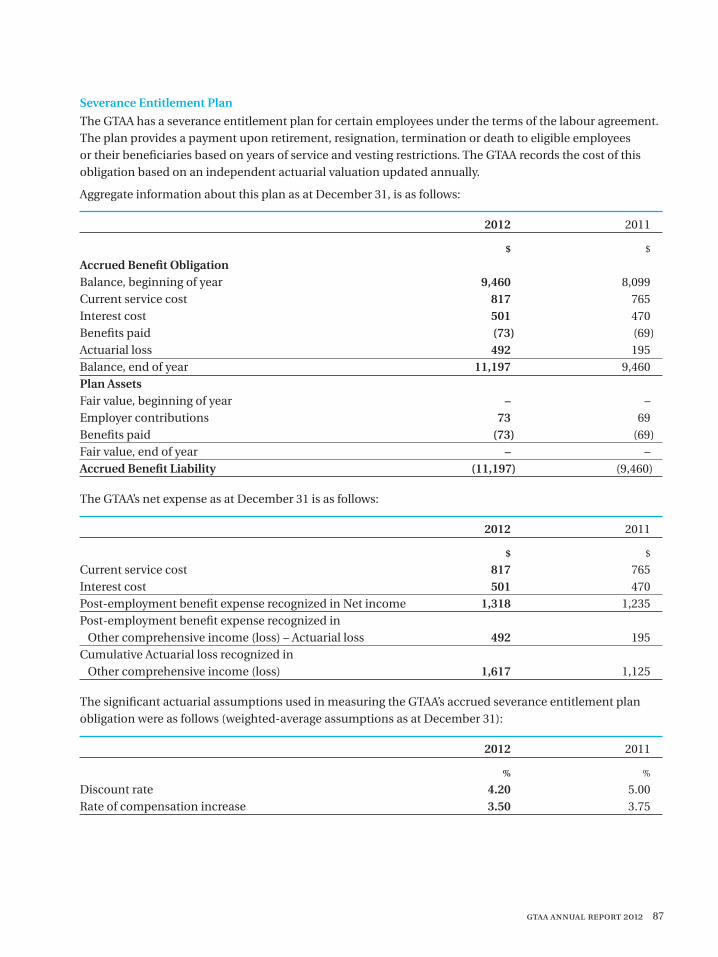
gtaa annual report 2012 87
Severance Entitlement Plan
The GTAA has a severance entitlement plan for certain employees under the terms of the labour agreement. The plan provides a payment upon retirement, resignation, termination or death to eligible employees or their beneficiaries based on years of service and vesting restrictions. The GTAA records the cost of this obligation based on an independent actuarial valuation updated annually.
Aggregate information about this plan as at December 31, is as follows:
2012 2011
$ $
Accrued Benefit ObligationBalance, beginning of year 9,460 8,099Current service cost 817 765Interest cost 501 470Benefits paid (73) (69)Actuarial loss 492 195Balance, end of year 11,197 9,460Plan Assets Fair value, beginning of year – – Employer contributions 73 69Benefits paid (73) (69)Fair value, end of year – – Accrued Benefit Liability (11,197) (9,460)
The GTAA’s net expense as at December 31 is as follows:
2012 2011
$ $
Current service cost 817 765 Interest cost 501 470 Post-employment benefit expense recognized in Net income 1,318 1,235 Post-employment benefit expense recognized in Other comprehensive income (loss) – Actuarial loss 492 195 Cumulative Actuarial loss recognized in Other comprehensive income (loss) 1,617 1,125
The significant actuarial assumptions used in measuring the GTAA’s accrued severance entitlement plan obligation were as follows (weighted-average assumptions as at December 31):
2012 2011
% % Discount rate 4.20 5.00 Rate of compensation increase 3.50 3.75
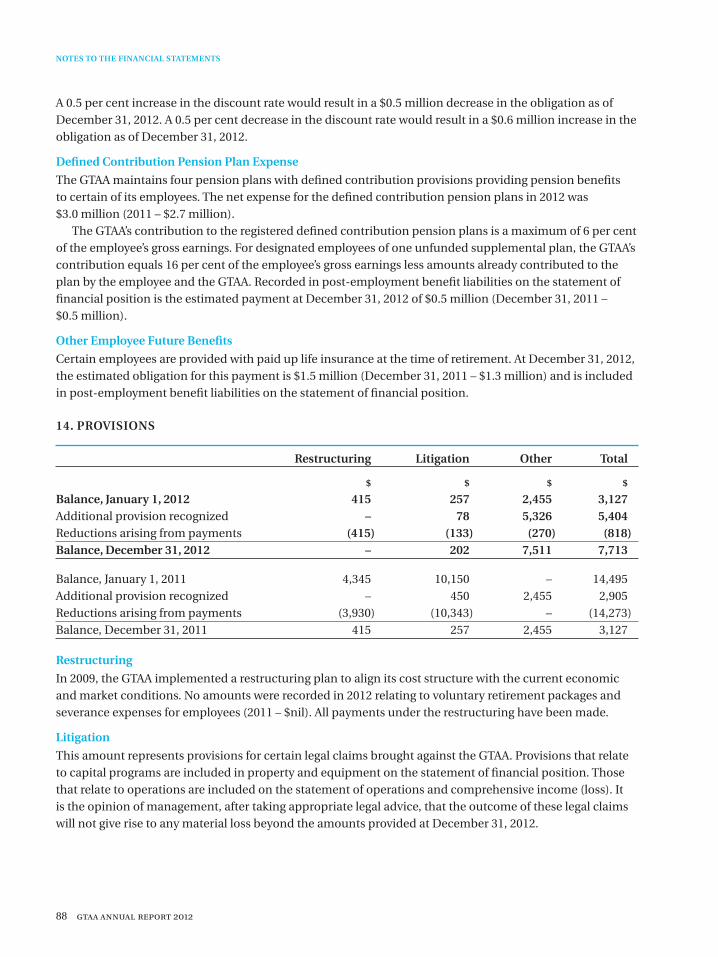
88 gtaa annual report 2012
NOTES TO THE FINANCIAL STATEMENTS
A 0.5 per cent increase in the discount rate would result in a $0.5 million decrease in the obligation as of December 31, 2012. A 0.5 per cent decrease in the discount rate would result in a $0.6 million increase in the obligation as of December 31, 2012.
Defined Contribution Pension Plan Expense
The GTAA maintains four pension plans with defined contribution provisions providing pension benefits to certain of its employees. The net expense for the defined contribution pension plans in 2012 was $3.0 million (2011 – $2.7 million).
The GTAA’s contribution to the registered defined contribution pension plans is a maximum of 6 per cent of the employee’s gross earnings. For designated employees of one unfunded supplemental plan, the GTAA’s contribution equals 16 per cent of the employee’s gross earnings less amounts already contributed to the plan by the employee and the GTAA. Recorded in post-employment benefit liabilities on the statement of financial position is the estimated payment at December 31, 2012 of $0.5 million (December 31, 2011 – $0.5 million).
Other Employee Future Benefits
Certain employees are provided with paid up life insurance at the time of retirement. At December 31, 2012, the estimated obligation for this payment is $1.5 million (December 31, 2011 – $1.3 million) and is included in post-employment benefit liabilities on the statement of financial position.
14. PROVISIONS
Restructuring Litigation Other Total
$ $ $ $
Balance, January 1, 2012 415 257 2,455 3,127 Additional provision recognized – 78 5,326 5,404 Reductions arising from payments (415) (133) (270) (818)Balance, December 31, 2012 – 202 7,511 7,713
Balance, January 1, 2011 4,345 10,150 – 14,495 Additional provision recognized – 450 2,455 2,905 Reductions arising from payments (3,930) (10,343) – (14,273)Balance, December 31, 2011 415 257 2,455 3,127
Restructuring
In 2009, the GTAA implemented a restructuring plan to align its cost structure with the current economic and market conditions. No amounts were recorded in 2012 relating to voluntary retirement packages and severance expenses for employees (2011 – $nil). All payments under the restructuring have been made.
Litigation
This amount represents provisions for certain legal claims brought against the GTAA. Provisions that relate to capital programs are included in property and equipment on the statement of financial position. Those that relate to operations are included on the statement of operations and comprehensive income (loss). It is the opinion of management, after taking appropriate legal advice, that the outcome of these legal claims will not give rise to any material loss beyond the amounts provided at December 31, 2012.
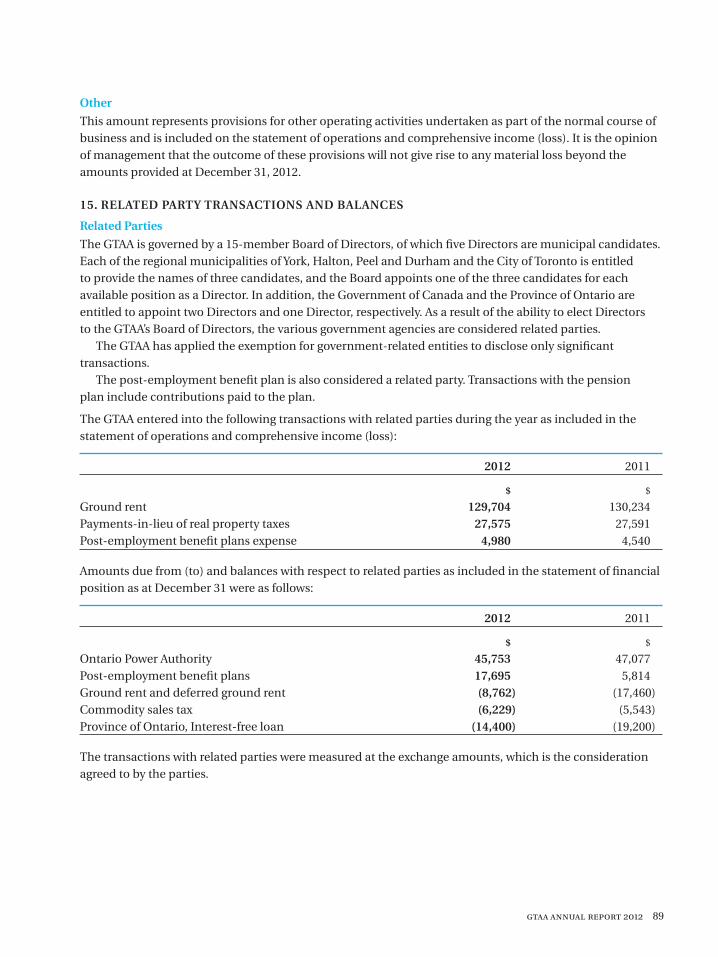
gtaa annual report 2012 89
Other
This amount represents provisions for other operating activities undertaken as part of the normal course of business and is included on the statement of operations and comprehensive income (loss). It is the opinion of management that the outcome of these provisions will not give rise to any material loss beyond the amounts provided at December 31, 2012.
15. RELATED PARTY TRANSACTIONS AND BALANCES
Related Parties
The GTAA is governed by a 15-member Board of Directors, of which five Directors are municipal candidates. Each of the regional municipalities of York, Halton, Peel and Durham and the City of Toronto is entitled to provide the names of three candidates, and the Board appoints one of the three candidates for each available position as a Director. In addition, the Government of Canada and the Province of Ontario are entitled to appoint two Directors and one Director, respectively. As a result of the ability to elect Directors to the GTAA’s Board of Directors, the various government agencies are considered related parties.
The GTAA has applied the exemption for government-related entities to disclose only significant transactions.
The post-employment benefit plan is also considered a related party. Transactions with the pension plan include contributions paid to the plan.
The GTAA entered into the following transactions with related parties during the year as included in the statement of operations and comprehensive income (loss):
2012 2011
$ $
Ground rent 129,704 130,234Payments-in-lieu of real property taxes 27,575 27,591Post-employment benefit plans expense 4,980 4,540
Amounts due from (to) and balances with respect to related parties as included in the statement of financial position as at December 31 were as follows:
2012 2011
$ $
Ontario Power Authority 45,753 47,077Post-employment benefit plans 17,695 5,814Ground rent and deferred ground rent (8,762) (17,460)Commodity sales tax (6,229) (5,543)Province of Ontario, Interest-free loan (14,400) (19,200)
The transactions with related parties were measured at the exchange amounts, which is the consideration agreed to by the parties.
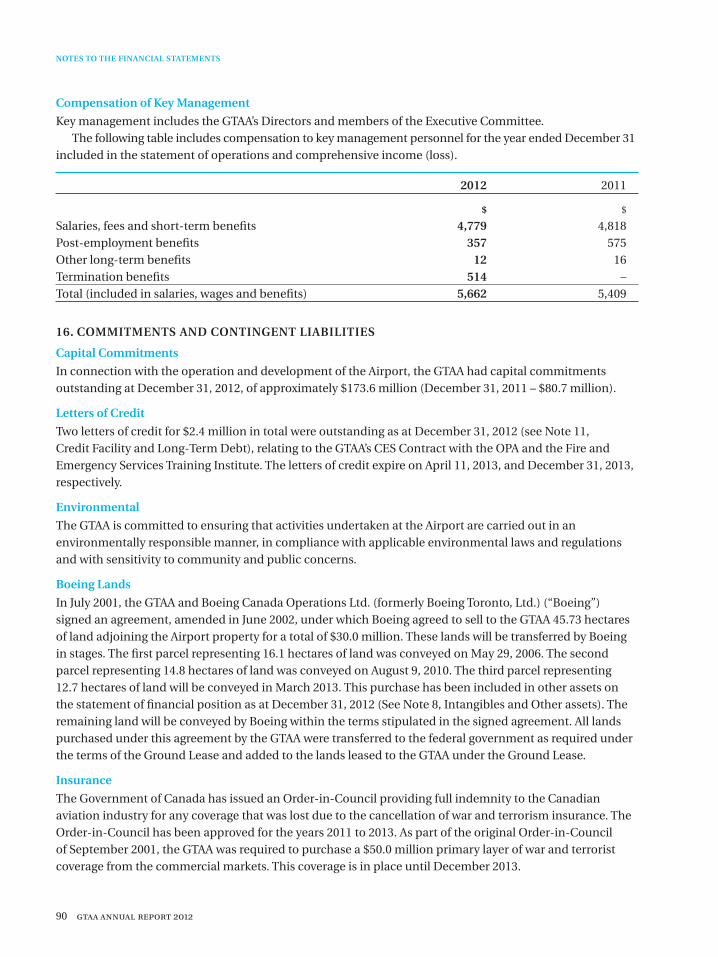
90 gtaa annual report 2012
NOTES TO THE FINANCIAL STATEMENTS
Compensation of Key Management
Key management includes the GTAA’s Directors and members of the Executive Committee.The following table includes compensation to key management personnel for the year ended December 31
included in the statement of operations and comprehensive income (loss).
2012 2011
$ $
Salaries, fees and short-term benefits 4,779 4,818Post-employment benefits 357 575Other long-term benefits 12 16 Termination benefits 514 –Total (included in salaries, wages and benefits) 5,662 5,409
16. COMMITMENTS AND CONTINGENT LIABILITIES
Capital Commitments
In connection with the operation and development of the Airport, the GTAA had capital commitments outstanding at December 31, 2012, of approximately $173.6 million (December 31, 2011 – $80.7 million).
Letters of Credit
Two letters of credit for $2.4 million in total were outstanding as at December 31, 2012 (see Note 11, Credit Facility and Long-Term Debt), relating to the GTAA’s CES Contract with the OPA and the Fire and Emergency Services Training Institute. The letters of credit expire on April 11, 2013, and December 31, 2013, respectively.
Environmental
The GTAA is committed to ensuring that activities undertaken at the Airport are carried out in an environmentally responsible manner, in compliance with applicable environmental laws and regulations and with sensitivity to community and public concerns.
Boeing Lands
In July 2001, the GTAA and Boeing Canada Operations Ltd. (formerly Boeing Toronto, Ltd.) (“Boeing”) signed an agreement, amended in June 2002, under which Boeing agreed to sell to the GTAA 45.73 hectares of land adjoining the Airport property for a total of $30.0 million. These lands will be transferred by Boeing in stages. The first parcel representing 16.1 hectares of land was conveyed on May 29, 2006. The second parcel representing 14.8 hectares of land was conveyed on August 9, 2010. The third parcel representing 12.7 hectares of land will be conveyed in March 2013. This purchase has been included in other assets on the statement of financial position as at December 31, 2012 (See Note 8, Intangibles and Other assets). The remaining land will be conveyed by Boeing within the terms stipulated in the signed agreement. All lands purchased under this agreement by the GTAA were transferred to the federal government as required under the terms of the Ground Lease and added to the lands leased to the GTAA under the Ground Lease.
Insurance
The Government of Canada has issued an Order-in-Council providing full indemnity to the Canadian aviation industry for any coverage that was lost due to the cancellation of war and terrorism insurance. The Order-in-Council has been approved for the years 2011 to 2013. As part of the original Order-in-Council of September 2001, the GTAA was required to purchase a $50.0 million primary layer of war and terrorist coverage from the commercial markets. This coverage is in place until December 2013.
gtaa annual report 2012 91
Cogeneration Plant
The GTAA has entered into certain contracts in order to secure the supply and delivery of natural gas necessary for anticipated future operations of the Cogeneration Plant. Under these contracts, the GTAA will be required to make payments relating to both the delivery of natural gas based on standard rate agreements and the cost of natural gas as determined by market rates. The GTAA has also entered into a delivery contract that establishes a maximum volume of natural gas inventory that the GTAA is permitted to maintain, as of November 30 of each year. The GTAA has the option to dispose of natural gas in excess of this maximum volume either through consumption or through the sale of natural gas to third parties.
Contingent Liabilities
The GTAA is subject to legal proceedings and claims from time to time that arise in the normal course of business. Where appropriate, the GTAA has recorded provisions while actively pursuing its position (see Note 14, Provisions). Where it is the opinion of management that the ultimate outcome of these matters will not have a material effect upon the GTAA’s financial position, results of operations or cash flows, no provisions have been recorded.
Air France
As a result of the Air France incident on August 2, 2005, the GTAA together with a number of other parties were named as defendants in several lawsuits, including a class action lawsuit involving most passengers and their family members. In 2010, the class action lawsuit against the GTAA was settled. The settlement did not involve any admission of liability by the GTAA. The GTAA’s insurers are responsible for paying the GTAA’s share of the settlement amount to the class action plaintiffs. In 2012, two lawsuits were settled by Air France without any payment by the GTAA or the GTAA’s insurers. The GTAA’s insurers continue to defend the GTAA in the two remaining lawsuits. It is the opinion of management that the GTAA’s financial exposure is limited to its insurance deductible.
Payments-in-Lieu of Development Charges
The GTAA is not required to pay development charges to the City of Mississauga, the Regional Municipality of Peel (“Peel Region”) or the City of Toronto with respect to development at the Airport, but rather pays a payments-in-lieu of development charges (“PILDC”) in accordance with the Payments in Lieu of Taxes Act (Canada). The amount of PILDC is calculated by Public Works and Government Services Canada (“PWGSC”).
With respect to development undertaken by the GTAA at the Airport between 1996 and 2004, PWGSC paid PILDC in the amount of $0.8 million to the City of Mississauga and $4.1 million to Peel Region. As required by the Ground Lease, the GTAA reimbursed Transport Canada for such amounts. The City of Mississauga filed an application to increase the amount of the PILDC paid to $26.6 million but in 2012 reduced the amount being claimed to $4.6 million. This matter is in its early stages, and no amounts have been accrued as at December 31, 2012, with respect to this claim as the obligation relating to this application is not probable at this time.
With respect to any further applications to PWGSC for PILDC with respect to Airport developments occurring after 2004, if these applications are successful, the GTAA would be required to pay to Transport Canada the amount of PILDC paid to the municipality by PWGSC.
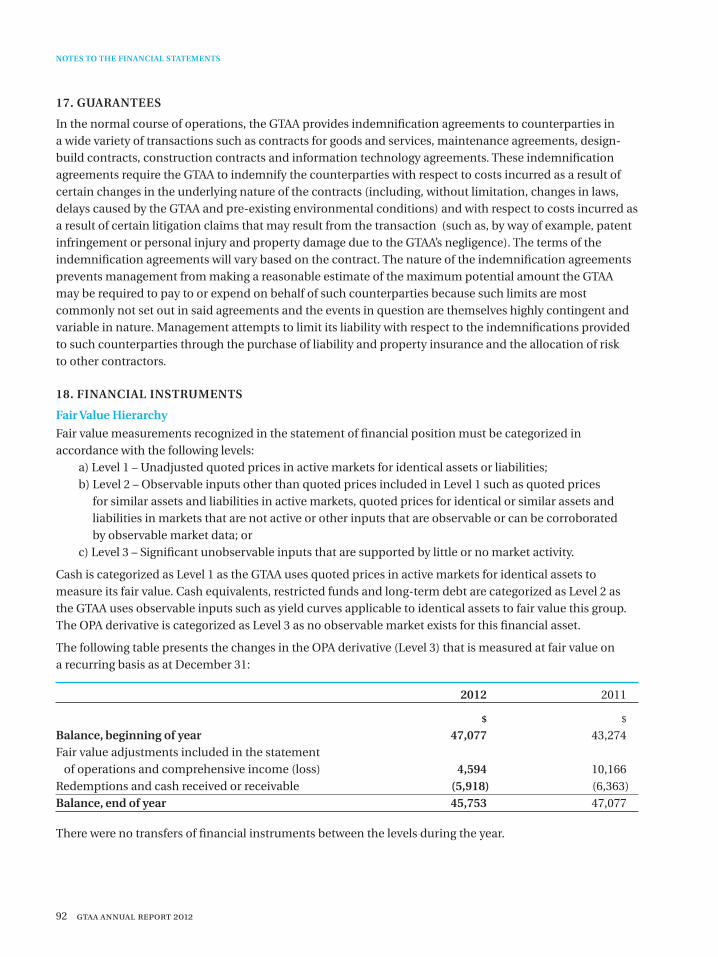
92 gtaa annual report 2012
NOTES TO THE FINANCIAL STATEMENTS
17. GUARANTEES
In the normal course of operations, the GTAA provides indemnification agreements to counterparties in a wide variety of transactions such as contracts for goods and services, maintenance agreements, design-build contracts, construction contracts and information technology agreements. These indemnification agreements require the GTAA to indemnify the counterparties with respect to costs incurred as a result of certain changes in the underlying nature of the contracts (including, without limitation, changes in laws, delays caused by the GTAA and pre-existing environmental conditions) and with respect to costs incurred as a result of certain litigation claims that may result from the transaction (such as, by way of example, patent infringement or personal injury and property damage due to the GTAA’s negligence). The terms of the indemnification agreements will vary based on the contract. The nature of the indemnification agreements prevents management from making a reasonable estimate of the maximum potential amount the GTAA may be required to pay to or expend on behalf of such counterparties because such limits are most commonly not set out in said agreements and the events in question are themselves highly contingent and variable in nature. Management attempts to limit its liability with respect to the indemnifications provided to such counterparties through the purchase of liability and property insurance and the allocation of risk to other contractors.
18. FINANCIAL INSTRUMENTS
Fair Value Hierarchy
Fair value measurements recognized in the statement of financial position must be categorized in accordance with the following levels:
a) Level 1 – Unadjusted quoted prices in active markets for identical assets or liabilities;b) Level 2 – Observable inputs other than quoted prices included in Level 1 such as quoted prices
for similar assets and liabilities in active markets, quoted prices for identical or similar assets and liabilities in markets that are not active or other inputs that are observable or can be corroborated by observable market data; or
c) Level 3 – Significant unobservable inputs that are supported by little or no market activity.
Cash is categorized as Level 1 as the GTAA uses quoted prices in active markets for identical assets to measure its fair value. Cash equivalents, restricted funds and long-term debt are categorized as Level 2 as the GTAA uses observable inputs such as yield curves applicable to identical assets to fair value this group. The OPA derivative is categorized as Level 3 as no observable market exists for this financial asset.
The following table presents the changes in the OPA derivative (Level 3) that is measured at fair value on a recurring basis as at December 31:
2012 2011
$ $ Balance, beginning of year 47,077 43,274 Fair value adjustments included in the statement of operations and comprehensive income (loss) 4,594 10,166 Redemptions and cash received or receivable (5,918) (6,363) Balance, end of year 45,753 47,077
There were no transfers of financial instruments between the levels during the year.
gtaa annual report 2012 93
Risk Management
In the normal course of business, the GTAA is exposed to a number of financial risks that can affect its operating performance. The GTAA’s overall risk management program seeks to minimize potential adverse effects on the GTAA’s financial performance.
The GTAA’s treasury function is responsible for the procurement of the GTAA’s capital resources and for the management of financial risk. All treasury operations are conducted within policies and guidelines approved by the Board of Directors and are within the requirements set out in the Trust Indenture dated December 2, 1997, as supplemented or amended from time to time. Compliance with these policies is monitored by the regular reporting of treasury activities to the Audit Committee of the Board.
The GTAA’s operating activities result in financial risks that may arise from changes in market risk, credit risk and liquidity risk.
Market Risk
a) Interest Rate RiskThe GTAA’s exposure to interest rate risk relates to its medium term notes bank indebtedness as described in Note 11, Credit Facility and Long-Term Debt. As at December 31, 2012, all of the GTAA’s debt is fixed-rate debt, and therefore changes in interest rates do not have an impact on interest payments but may have an impact on the fair value of this debt.
The GTAA also has exposure to interest rate risk through its short-term investments in restricted funds (see Note 6, Restricted Funds). As at December 31, 2012, all of the GTAA’s short-term investment holdings carried a fixed rate during their term and therefore changes in the interest rate did not have an impact on interest income for the period.
The GTAA also has exposure to interest rate risk through its CES Contract with the OPA (see Note 8, Intangibles and Other Assets). The impact of a 1 per cent increase/decrease in the discount rate used to derive the fair value of the OPA derivative would result in a $2.6 million decrease/increase in the fair value of the derivative as at December 31, 2012.
The Debt Service Reserve Fund securing bank indebtedness is adjusted annually on December 2, based on the prevailing bankers’ acceptance rate.
During the year the GTAA entered into cash flow hedges to lock in the interest rate on a notional debt amount of $380.0 million using the Government of Canada 10-year bond maturing in the year 2022 as its reference bond. In conjunction with the issuance of the 2012-1 MTNs, the GTAA terminated the derivatives, resulting in the GTAA making a cash payment of $3.1 million. The amount paid at the time of termination is included in other comprehensive income (loss) and will be amortized over the term of the hedged debt (10 years). In 2011, the GTAA entered into two bond forwards with major Canadian financial institutions. The GTAA terminated both derivatives, resulting in the GTAA making a cash payment of $14.1 million. A portion of the bond forward was not designated as a cash flow hedge for accounting purposes, and therefore $1.0 million was recorded in interest and financing costs, net, on the statement of operations and comprehensive loss. The remaining $13.1 million relating to designated hedge transactions was included in other comprehensive loss and is being amortized over the term of the hedged debt (30 years).
b) Commodity Price RiskThe GTAA’s exposure to commodity price risk primarily relates to its CES Contract with the OPA. The impact of a 1 per cent increase/decrease in the 2012 average price of electricity, holding natural gas prices constant, would result in a $1.3 million decrease/increase in the fair value of the OPA derivative as at December 31, 2012. The impact of a 1 per cent increase/decrease in the 2012 average price of natural gas, holding the price of electricity constant would result in a $0.9 million increase/decrease in the fair value of the OPA derivative as at December 31, 2012.
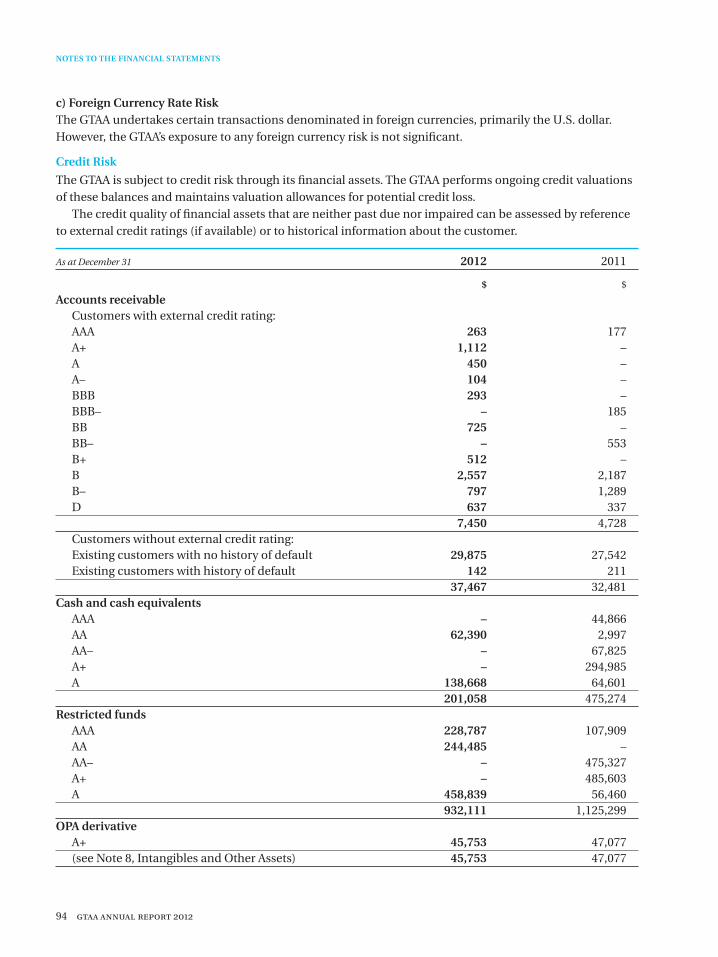
94 gtaa annual report 2012
c) Foreign Currency Rate RiskThe GTAA undertakes certain transactions denominated in foreign currencies, primarily the U.S. dollar. However, the GTAA’s exposure to any foreign currency risk is not significant.
Credit Risk
The GTAA is subject to credit risk through its financial assets. The GTAA performs ongoing credit valuations of these balances and maintains valuation allowances for potential credit loss.
The credit quality of financial assets that are neither past due nor impaired can be assessed by reference to external credit ratings (if available) or to historical information about the customer.
As at December 31 2012 2011
$ $
Accounts receivable Customers with external credit rating: AAA 263 177 A+ 1,112 – A 450 – A– 104 – BBB 293 – BBB– – 185 BB 725 – BB– – 553 B+ 512 – B 2,557 2,187 B– 797 1,289 D 637 337 7,450 4,728 Customers without external credit rating: Existing customers with no history of default 29,875 27,542 Existing customers with history of default 142 211 37,467 32,481Cash and cash equivalents AAA – 44,866 AA 62,390 2,997 AA– – 67,825 A+ – 294,985 A 138,668 64,601 201,058 475,274Restricted funds AAA 228,787 107,909 AA 244,485 – AA– – 475,327 A+ – 485,603 A 458,839 56,460 932,111 1,125,299OPA derivative A+ 45,753 47,077 (see Note 8, Intangibles and Other Assets) 45,753 47,077
NOTES TO THE FINANCIAL STATEMENTS
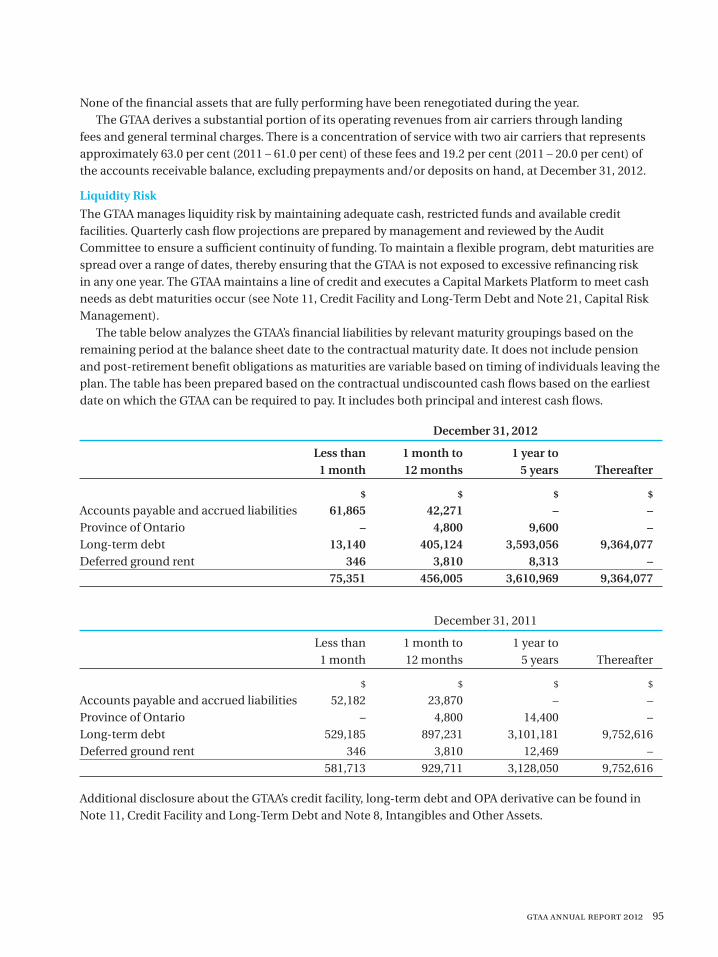
gtaa annual report 2012 95
None of the financial assets that are fully performing have been renegotiated during the year.The GTAA derives a substantial portion of its operating revenues from air carriers through landing
fees and general terminal charges. There is a concentration of service with two air carriers that represents approximately 63.0 per cent (2011 – 61.0 per cent) of these fees and 19.2 per cent (2011 – 20.0 per cent) of the accounts receivable balance, excluding prepayments and/or deposits on hand, at December 31, 2012.
Liquidity Risk
The GTAA manages liquidity risk by maintaining adequate cash, restricted funds and available credit facilities. Quarterly cash flow projections are prepared by management and reviewed by the Audit Committee to ensure a sufficient continuity of funding. To maintain a flexible program, debt maturities are spread over a range of dates, thereby ensuring that the GTAA is not exposed to excessive refinancing risk in any one year. The GTAA maintains a line of credit and executes a Capital Markets Platform to meet cash needs as debt maturities occur (see Note 11, Credit Facility and Long-Term Debt and Note 21, Capital Risk Management).
The table below analyzes the GTAA’s financial liabilities by relevant maturity groupings based on the remaining period at the balance sheet date to the contractual maturity date. It does not include pension and post-retirement benefit obligations as maturities are variable based on timing of individuals leaving the plan. The table has been prepared based on the contractual undiscounted cash flows based on the earliest date on which the GTAA can be required to pay. It includes both principal and interest cash flows.
December 31, 2012
Less than 1 month to 1 year to 1 month 12 months 5 years Thereafter
$ $ $ $
Accounts payable and accrued liabilities 61,865 42,271 – –Province of Ontario – 4,800 9,600 –Long-term debt 13,140 405,124 3,593,056 9,364,077Deferred ground rent 346 3,810 8,313 – 75,351 456,005 3,610,969 9,364,077
December 31, 2011
Less than 1 month to 1 year to 1 month 12 months 5 years Thereafter
$ $ $ $
Accounts payable and accrued liabilities 52,182 23,870 – –Province of Ontario – 4,800 14,400 – Long-term debt 529,185 897,231 3,101,181 9,752,616 Deferred ground rent 346 3,810 12,469 –
581,713 929,711 3,128,050 9,752,616
Additional disclosure about the GTAA’s credit facility, long-term debt and OPA derivative can be found in Note 11, Credit Facility and Long-Term Debt and Note 8, Intangibles and Other Assets.
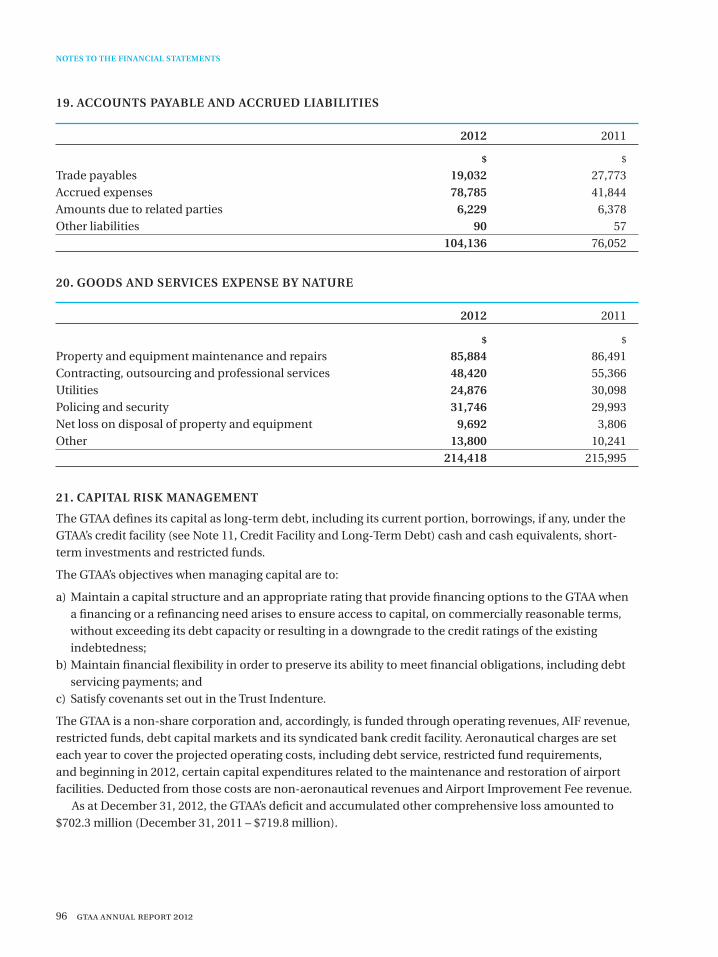
96 gtaa annual report 2012
NOTES TO THE FINANCIAL STATEMENTS
19. ACCOUNTS PAYABLE AND ACCRUED LIABILITIES
2012 2011
$ $
Trade payables 19,032 27,773Accrued expenses 78,785 41,844Amounts due to related parties 6,229 6,378Other liabilities 90 57 104,136 76,052
20. GOODS AND SERVICES EXPENSE BY NATURE
2012 2011
$ $
Property and equipment maintenance and repairs 85,884 86,491 Contracting, outsourcing and professional services 48,420 55,366 Utilities 24,876 30,098 Policing and security 31,746 29,993 Net loss on disposal of property and equipment 9,692 3,806 Other 13,800 10,241 214,418 215,995
21. CAPITAL RISK MANAGEMENT
The GTAA defines its capital as long-term debt, including its current portion, borrowings, if any, under the GTAA’s credit facility (see Note 11, Credit Facility and Long-Term Debt) cash and cash equivalents, short-term investments and restricted funds.
The GTAA’s objectives when managing capital are to:
a) Maintain a capital structure and an appropriate rating that provide financing options to the GTAA when a financing or a refinancing need arises to ensure access to capital, on commercially reasonable terms, without exceeding its debt capacity or resulting in a downgrade to the credit ratings of the existing indebtedness;
b) Maintain financial flexibility in order to preserve its ability to meet financial obligations, including debt servicing payments; and
c) Satisfy covenants set out in the Trust Indenture.
The GTAA is a non-share corporation and, accordingly, is funded through operating revenues, AIF revenue, restricted funds, debt capital markets and its syndicated bank credit facility. Aeronautical charges are set each year to cover the projected operating costs, including debt service, restricted fund requirements, and beginning in 2012, certain capital expenditures related to the maintenance and restoration of airport facilities. Deducted from those costs are non-aeronautical revenues and Airport Improvement Fee revenue.
As at December 31, 2012, the GTAA’s deficit and accumulated other comprehensive loss amounted to $702.3 million (December 31, 2011 – $719.8 million).
gtaa annual report 2012 97
Capital Markets Platform
As a corporation without share capital, the GTAA’s ongoing capital requirements are financed through the issuances of debt. The GTAA developed a financing program referred to as the Capital Markets Platform, capable of accommodating a variety of corporate debt instruments. All indebtedness incurred under the Capital Markets Platform is secured under the Trust Indenture dated December 2, 1997, as supplemented or amended from time to time, which establishes common security and a set of common covenants by the GTAA for the benefit of its lenders. The security comprises an assignment of the revenues of the GTAA, a specific charge on certain funds, restricted funds and accounts, an unregistered first leasehold mortgage of the GTAA’s leasehold interest in the Airport, and a guarantee and related collateral security of subsidiaries, if any, as designated from time to time.
The Debt Service Reserve Funds are funded from the net proceeds of each bond or medium term note issuance (see Note 6, Restricted Funds). The covenants that the GTAA must meet include two specific coverage tests for operating expenses and debt payments. The operating covenant states that the total revenue must at least cover all operating expenses, including interest and financing costs and excluding amortization. The debt service covenant states that the net revenues, which may include available credit, must be at least 1.25 times the total interest and financing costs, including notional principal. At December 31, 2012, the GTAA was in compliance with the above covenants and was not in default under the Trust Indenture as defined therein.
22. COMPARATIVE FIGURES
Certain comparative figures have been reclassified to conform with the current period’s presentation.
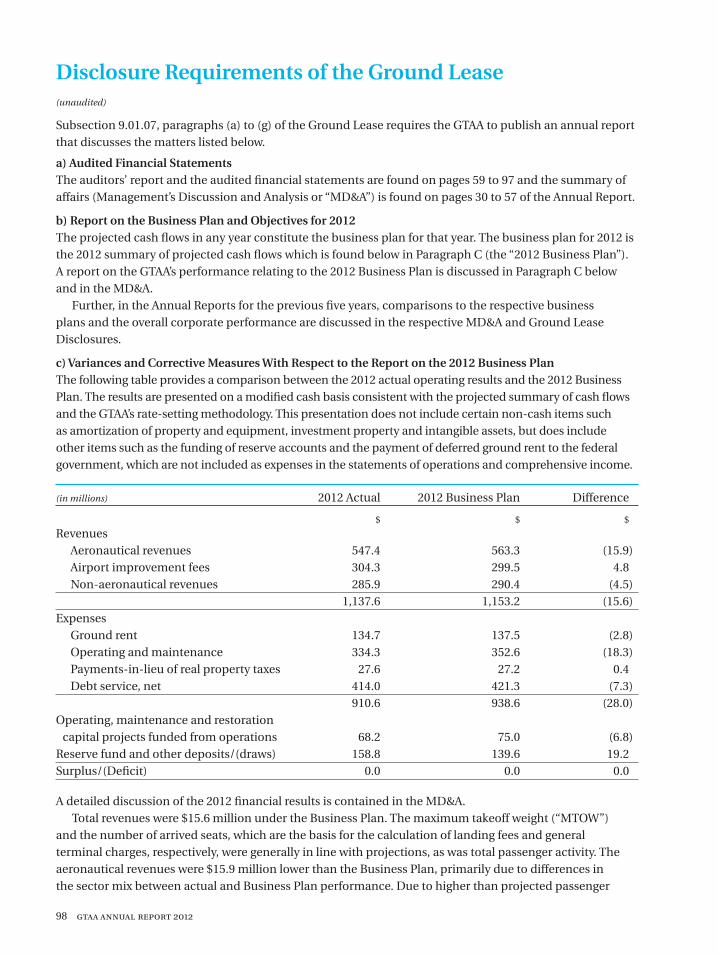
98 gtaa annual report 2012
Disclosure Requirements of the Ground Lease(unaudited)
Subsection 9.01.07, paragraphs (a) to (g) of the Ground Lease requires the GTAA to publish an annual report that discusses the matters listed below.
a) Audited Financial Statements The auditors’ report and the audited financial statements are found on pages 59 to 97 and the summary of affairs (Management’s Discussion and Analysis or “MD&A”) is found on pages 30 to 57 of the Annual Report.
b) Report on the Business Plan and Objectives for 2012The projected cash flows in any year constitute the business plan for that year. The business plan for 2012 is the 2012 summary of projected cash flows which is found below in Paragraph C (the “2012 Business Plan”). A report on the GTAA’s performance relating to the 2012 Business Plan is discussed in Paragraph C below and in the MD&A.
Further, in the Annual Reports for the previous five years, comparisons to the respective business plans and the overall corporate performance are discussed in the respective MD&A and Ground Lease Disclosures.
c) Variances and Corrective Measures With Respect to the Report on the 2012 Business PlanThe following table provides a comparison between the 2012 actual operating results and the 2012 Business Plan. The results are presented on a modified cash basis consistent with the projected summary of cash flows and the GTAA’s rate-setting methodology. This presentation does not include certain non-cash items such as amortization of property and equipment, investment property and intangible assets, but does include other items such as the funding of reserve accounts and the payment of deferred ground rent to the federal government, which are not included as expenses in the statements of operations and comprehensive income.
(in millions) 2012 Actual 2012 Business Plan Difference
$ $ $
Revenues Aeronautical revenues 547.4 563.3 (15.9) Airport improvement fees 304.3 299.5 4.8 Non-aeronautical revenues 285.9 290.4 (4.5) 1,137.6 1,153.2 (15.6)Expenses Ground rent 134.7 137.5 (2.8) Operating and maintenance 334.3 352.6 (18.3) Payments-in-lieu of real property taxes 27.6 27.2 0.4 Debt service, net 414.0 421.3 (7.3) 910.6 938.6 (28.0)Operating, maintenance and restoration capital projects funded from operations 68.2 75.0 (6.8)Reserve fund and other deposits/(draws) 158.8 139.6 19.2Surplus/(Deficit) 0.0 0.0 0.0
A detailed discussion of the 2012 financial results is contained in the MD&A. Total revenues were $15.6 million under the Business Plan. The maximum takeoff weight (“MTOW”)
and the number of arrived seats, which are the basis for the calculation of landing fees and general terminal charges, respectively, were generally in line with projections, as was total passenger activity. The aeronautical revenues were $15.9 million lower than the Business Plan, primarily due to differences in the sector mix between actual and Business Plan performance. Due to higher than projected passenger
gtaa annual report 2012 99
activity, Airport Improvement Fee (“AIF”) revenue was $4.8 million higher than the Business Plan. The non-aeronautical revenues were $4.5 million lower than the 2012 Business Plan due to the reduction in other revenues component of non-aeronautical revenues. Other revenues are primarily composed of revenues from the Cogeneration Plant, consulting services and natural gas sales. The reduction in other revenues is due to fluctuations in the price of natural gas and electricity, which resulted in reduced Cogeneration Plant operations during 2012, when compared to the assumptions in the Business Plan. The revenues from car parking and ground transportation, concessions and rentals were generally in line with the 2012 Business Plan.
Total expenses, which include net interest and financing costs, were $28 million below expectations. Ground rent expense is calculated as a percentage of total revenues. As such, ground rent was lower by $2.8 million than the 2012 Business Plan due to lower than planned revenues. The operating and maintenance expenses, which comprise goods and services and salaries, wages and benefits, were lower than the Business Plan by $18.3 million principally due to a gain on the valuation of a derivative contract with the Ontario Power Authority related to the Cogeneration Plant in 2012 and lower utilities-related expenditures due to lower rates and consumption in addition to lower snow removal expense, partially offset by previously capitalized costs in the amount of $7.7 million related to the Post Airport Development Program capital program and other capital projects being expensed in 2012 as a result of changing development plans. The net interest and financing costs were lower than projected by $7.3 million, which was primarily attributable to lower than projected interest rates.
The deposits to the Notional Principal, Debt Service Coverage and the Operations and Maintenance Funds were largely as projected.
None of the variances to the 2012 Business Plan discussed above were of a nature that caused the GTAA to take specific corrective actions.
d) Summary of the Five-Year Business PlanThe five-year Business Plan (2013 to 2017) is based on assumptions underlying the GTAA’s assessment of various external factors. During 2013, the GTAA will continue to focus on managing expenses, growing non-aeronautical revenues and encouraging new aeronautical activity. This will include a careful review of operating expenses, continued focus on maximizing non-aeronautical revenue opportunities by offering amenities valued by our customers and incentives for new airline activity. Capital projects will continue to be reviewed in light of passenger demand and undertaken only where warranted.
The key assumptions used to develop the 2013 Business Plan include:• 36 million total passengers;• Landed MTOW (> 19 tonnes) of 14.2 million tonnes; and• Landed seats of 23 million.
Over the forecast horizon, the primary driver for the GTAA’s Business Plan is the long-term growth in Airport activity. Specific revenue or cost-containment initiatives carried out over this period may also have an impact on revenues and expenses. The projected average annual passenger growth rate from 2012 to 2017 is 3.7 per cent. During the same period, landed MTOW is expected to grow at an average rate of 3.8 per cent while landed seats are expected to grow by an average of 3.4 per cent.
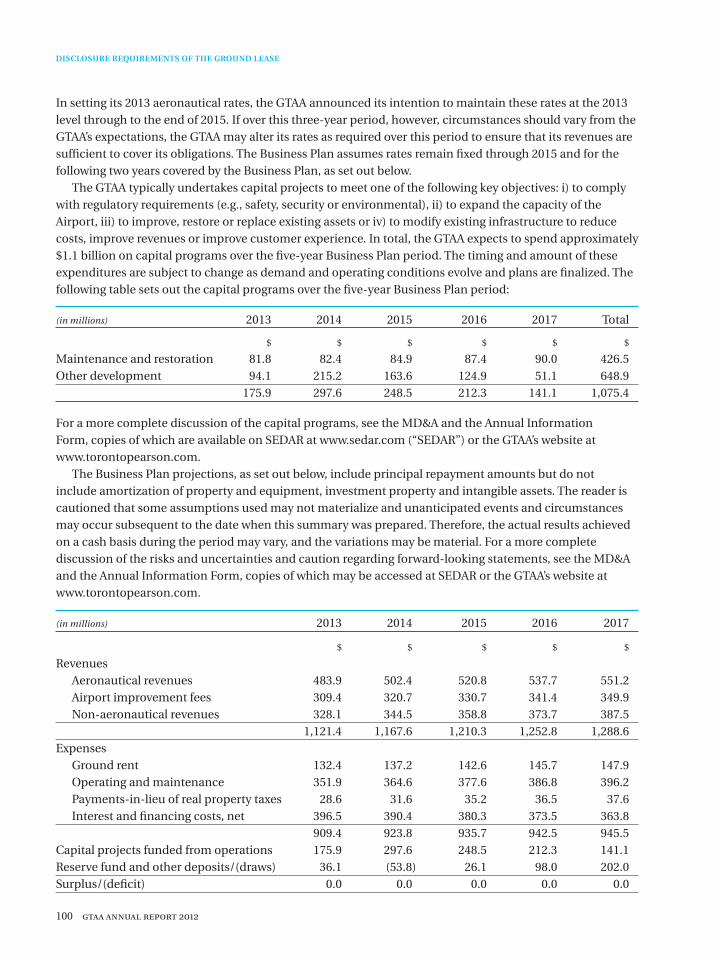
100 gtaa annual report 2012
DISCLOSURE REQUIREMENTS OF THE GROUND LEASE
In setting its 2013 aeronautical rates, the GTAA announced its intention to maintain these rates at the 2013 level through to the end of 2015. If over this three-year period, however, circumstances should vary from the GTAA’s expectations, the GTAA may alter its rates as required over this period to ensure that its revenues are sufficient to cover its obligations. The Business Plan assumes rates remain fixed through 2015 and for the following two years covered by the Business Plan, as set out below.
The GTAA typically undertakes capital projects to meet one of the following key objectives: i) to comply with regulatory requirements (e.g., safety, security or environmental), ii) to expand the capacity of the Airport, iii) to improve, restore or replace existing assets or iv) to modify existing infrastructure to reduce costs, improve revenues or improve customer experience. In total, the GTAA expects to spend approximately $1.1 billion on capital programs over the five-year Business Plan period. The timing and amount of these expenditures are subject to change as demand and operating conditions evolve and plans are finalized. The following table sets out the capital programs over the five-year Business Plan period:
(in millions) 2013 2014 2015 2016 2017 Total
$ $ $ $ $ $
Maintenance and restoration 81.8 82.4 84.9 87.4 90.0 426.5Other development 94.1 215.2 163.6 124.9 51.1 648.9 175.9 297.6 248.5 212.3 141.1 1,075.4
For a more complete discussion of the capital programs, see the MD&A and the Annual Information Form, copies of which are available on SEDAR at www.sedar.com (“SEDAR”) or the GTAA’s website at www.torontopearson.com.
The Business Plan projections, as set out below, include principal repayment amounts but do not include amortization of property and equipment, investment property and intangible assets. The reader is cautioned that some assumptions used may not materialize and unanticipated events and circumstances may occur subsequent to the date when this summary was prepared. Therefore, the actual results achieved on a cash basis during the period may vary, and the variations may be material. For a more complete discussion of the risks and uncertainties and caution regarding forward-looking statements, see the MD&A and the Annual Information Form, copies of which may be accessed at SEDAR or the GTAA’s website at www.torontopearson.com.
(in millions) 2013 2014 2015 2016 2017
$ $ $ $ $
Revenues Aeronautical revenues 483.9 502.4 520.8 537.7 551.2 Airport improvement fees 309.4 320.7 330.7 341.4 349.9 Non-aeronautical revenues 328.1 344.5 358.8 373.7 387.5 1,121.4 1,167.6 1,210.3 1,252.8 1,288.6Expenses Ground rent 132.4 137.2 142.6 145.7 147.9 Operating and maintenance 351.9 364.6 377.6 386.8 396.2 Payments-in-lieu of real property taxes 28.6 31.6 35.2 36.5 37.6 Interest and financing costs, net 396.5 390.4 380.3 373.5 363.8 909.4 923.8 935.7 942.5 945.5Capital projects funded from operations 175.9 297.6 248.5 212.3 141.1Reserve fund and other deposits/(draws) 36.1 (53.8) 26.1 98.0 202.0Surplus/(deficit) 0.0 0.0 0.0 0.0 0.0
gtaa annual report 2012 101
Amounts designated for reserve funds and other deposits over the Business Plan horizon may be used for other purposes, including, but not limited to, reducing aeronautical fees, reducing AIF or funding capital expenditures or debt repayments. The Board will determine the appropriate use of these funds based on the industry, GTAA conditions and outlook at the time.
e) Remuneration to Board and Salary of Senior OfficersFor 2012, the Chair of the Board of Directors received remuneration in the amount of $150,000, while the other Directors earned remuneration ranging from $24,870 to $72,500. For 2012, salaries for the Corporation’s senior officers ranged from $175,719 to $365,538. Senior officers are also eligible for a performance-based bonus.
Additional information regarding the remuneration paid to the Directors and the Senior Officers is available in the Annual Information Form, which may be accessed at SEDAR.
f) Ethical Business Conduct The GTAA developed a “Code of Business Conduct and Ethics” (the “Code”), which was approved by the GTAA’s Board of Directors. The Code complies with the requirements of the Canadian Securities Administrators’ National Policy 58-201 and represents a comprehensive approach to addressing, among other matters, conflicts of interest and promoting fair, honest and ethical behaviour by all GTAA Directors, officers, employees and contracted staff. A copy of the Code may be accessed at SEDAR.
The Board monitors compliance with the Code and requires that each Director and officer sign an Annual Declaration advising that the Director or officer has read the Code and either declares that the Director or officer is in compliance or not in compliance with the Code and to declare the reasons for the non-compliance. In addition, the Board has implemented Confidential Anonymous Reporting for Employees (“C.A.R.E.”), that permits the anonymous reporting of an employee, officer or Director’s unethical behaviour. C.A.R.E. also extends to business partners contracted by the GTAA.
All Directors and officers indicated that they were in compliance with the Code.
g) Report on Contracts over $100,000 Not TenderedThe bylaws of the GTAA, the Public Accountability Principles for Canadian Airport Authorities and the Ground Lease provide that all contracts in excess of $100,000 (as adjusted annually by CPI) must be awarded through a public tendering process, except as may be otherwise determined by the Board of Directors having regard for what may be efficient and practicable. The contracts that are not awarded through a public tendering process must be described in the GTAA’s Annual Report.
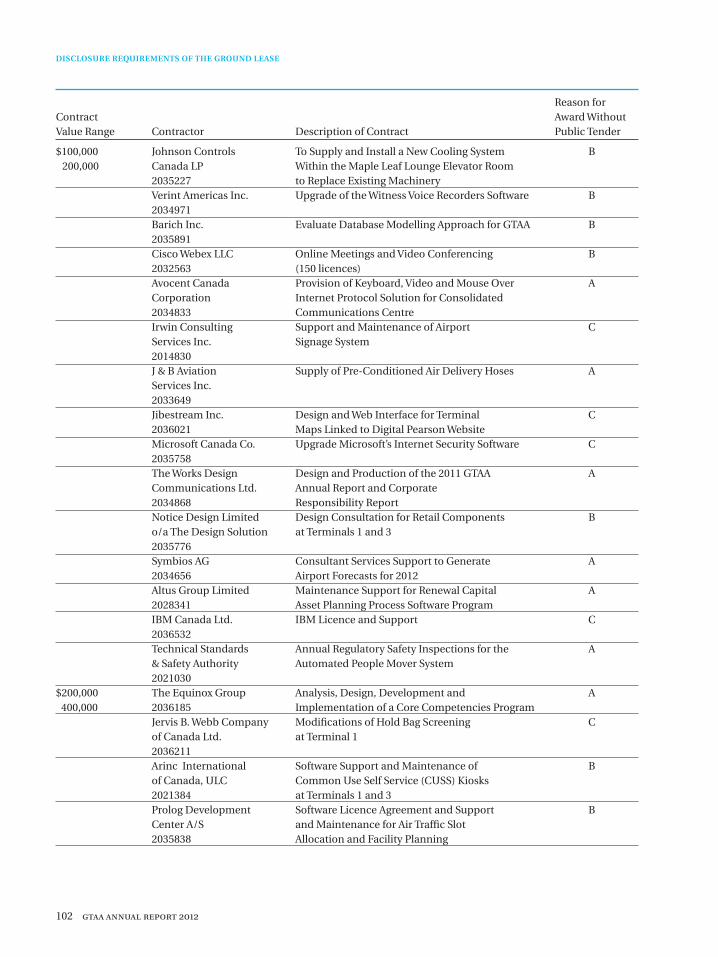
102 gtaa annual report 2012
DISCLOSURE REQUIREMENTS OF THE GROUND LEASE
Reason forContract Award Without Value Range Contractor Description of Contract Public Tender
$100,000 Johnson Controls To Supply and Install a New Cooling System B 200,000 Canada LP Within the Maple Leaf Lounge Elevator Room 2035227 to Replace Existing Machinery Verint Americas Inc. Upgrade of the Witness Voice Recorders Software B 2034971 Barich Inc. Evaluate Database Modelling Approach for GTAA B 2035891 Cisco Webex LLC Online Meetings and Video Conferencing B 2032563 (150 licences) Avocent Canada Provision of Keyboard, Video and Mouse Over A Corporation Internet Protocol Solution for Consolidated 2034833 Communications Centre Irwin Consulting Support and Maintenance of Airport C Services Inc. Signage System 2014830 J & B Aviation Supply of Pre-Conditioned Air Delivery Hoses A Services Inc. 2033649 Jibestream Inc. Design and Web Interface for Terminal C 2036021 Maps Linked to Digital Pearson Website Microsoft Canada Co. Upgrade Microsoft’s Internet Security Software C 2035758 The Works Design Design and Production of the 2011 GTAA A Communications Ltd. Annual Report and Corporate 2034868 Responsibility Report Notice Design Limited Design Consultation for Retail Components B o/a The Design Solution at Terminals 1 and 3 2035776 Symbios AG Consultant Services Support to Generate A 2034656 Airport Forecasts for 2012 Altus Group Limited Maintenance Support for Renewal Capital A 2028341 Asset Planning Process Software Program IBM Canada Ltd. IBM Licence and Support C 2036532 Technical Standards Annual Regulatory Safety Inspections for the A & Safety Authority Automated People Mover System 2021030$200,000 The Equinox Group Analysis, Design, Development and A 400,000 2036185 Implementation of a Core Competencies Program Jervis B. Webb Company Modifications of Hold Bag Screening C of Canada Ltd. at Terminal 1 2036211 Arinc International Software Support and Maintenance of B of Canada, ULC Common Use Self Service (CUSS) Kiosks 2021384 at Terminals 1 and 3 Prolog Development Software Licence Agreement and Support B Center A/S and Maintenance for Air Traffic Slot 2035838 Allocation and Facility Planning
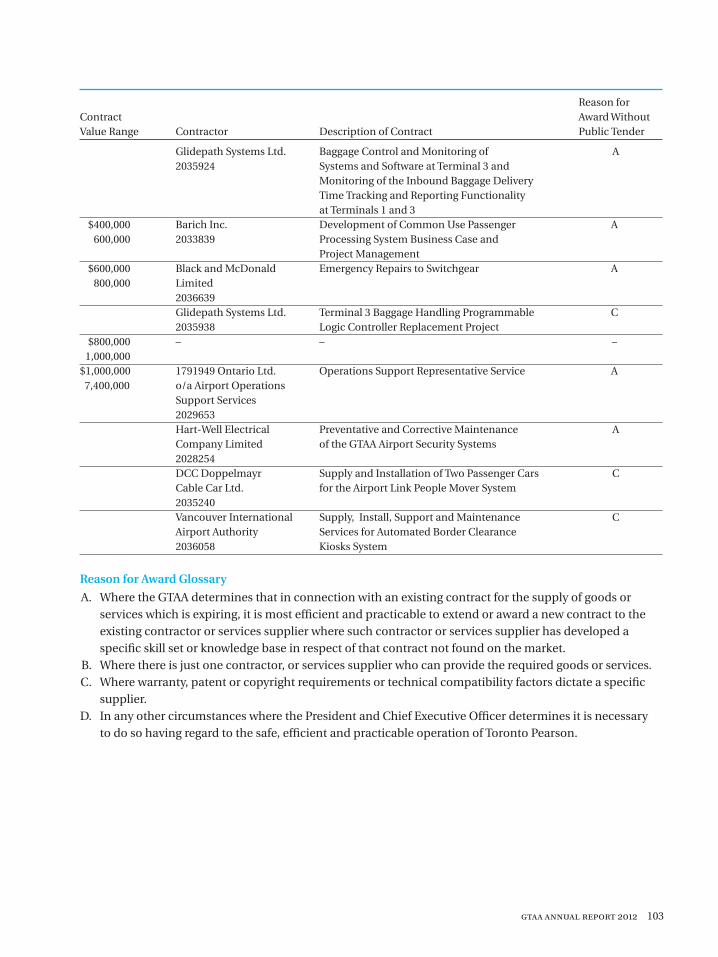
gtaa annual report 2012 103
Reason forContract Award Without Value Range Contractor Description of Contract Public Tender
Glidepath Systems Ltd. Baggage Control and Monitoring of A 2035924 Systems and Software at Terminal 3 and Monitoring of the Inbound Baggage Delivery Time Tracking and Reporting Functionality at Terminals 1 and 3 $400,000 Barich Inc. Development of Common Use Passenger A 600,000 2033839 Processing System Business Case and Project Management $600,000 Black and McDonald Emergency Repairs to Switchgear A 800,000 Limited 2036639 Glidepath Systems Ltd. Terminal 3 Baggage Handling Programmable C 2035938 Logic Controller Replacement Project $800,000 – – – 1,000,000 $1,000,000 1791949 Ontario Ltd. Operations Support Representative Service A 7,400,000 o/a Airport Operations Support Services 2029653 Hart-Well Electrical Preventative and Corrective Maintenance A Company Limited of the GTAA Airport Security Systems 2028254 DCC Doppelmayr Supply and Installation of Two Passenger Cars C Cable Car Ltd. for the Airport Link People Mover System 2035240 Vancouver International Supply, Install, Support and Maintenance C Airport Authority Services for Automated Border Clearance 2036058 Kiosks System
Reason for Award Glossary
A. Where the GTAA determines that in connection with an existing contract for the supply of goods or services which is expiring, it is most efficient and practicable to extend or award a new contract to the existing contractor or services supplier where such contractor or services supplier has developed a specific skill set or knowledge base in respect of that contract not found on the market.
B. Where there is just one contractor, or services supplier who can provide the required goods or services. C. Where warranty, patent or copyright requirements or technical compatibility factors dictate a specific
supplier. D. In any other circumstances where the President and Chief Executive Officer determines it is necessary
to do so having regard to the safe, efficient and practicable operation of Toronto Pearson.
104 gtaa annual report 2012
Corporate Information
Head Office Address
GREATER TORONTO AIRPORTS AUTHORITY
3111 Convair Drive, P.O. Box 6031
Toronto AMF, Ontario, Canada l5p 1b2
T: 416-776-3000
F: 416-776-3555
TorontoPearson.com
Executive Team
LLOYD A. McCOOMB
President and Chief Executive OfficerRetired as of April 30, 2012
HOWARD ENG
President and Chief Executive OfficerAs of March 29, 2012
J. HOWARD BOHAN
Vice President, Aviation Services
NICOLE DESLOGES
Vice President, People and Culture
BRIAN P. GABEL
Vice President and Chief Financial Officer
PAMELA GRIFFITH-JONES
Vice President, Guest and Terminal Services
TOBY C. D. LENNOX
Vice President, Strategy Development and Stakeholder Relations
DOUGLAS A. LOVE
Vice President, General Counsel and Secretary
Retired as of January 16, 2013
SELMA LUSSENBURG
Vice President, Governance and Legal, General Counsel and Corporate Secretary As of January 21, 2013
PATRICK C. NEVILLE
Vice President, Airport Planning and Technical Services
Annual Public Meeting
The GTAA’s Annual Public Meeting will be held on May 8, 2013, at 1:30 p.m. near Door F on the Arrivals level of Terminal 1.
Public Information
Requests for general information should be directed to:Customer ServiceT: 416-776-9892
Email: [email protected]
Auditors
PricewaterhouseCoopers LLPToronto, Ontario
Lead Bank
Canadian Imperial Bank of CommerceToronto, Ontario
Principal Legal Counsel
Osler, Hoskin & Harcourt LLPToronto, Ontario
Publications Available
The GTAA offers publications on a variety of topics. Please visitwww.torontopearson.com/en/gtaa/publicationsto view the complete list or email yourrequest to [email protected].

THE GREATER TORONTO AIRPORTS
AUTHORITY (GTAA) WAS INCORPORATED
IN 1993 AND MANAGES TORONTO PEARSON
INTERNATIONAL AIRPORT UNDER TERMS SET
OUT IN OUR DECEMBER 1996 LEASE WITH
THE CANADIAN FEDERAL GOVERNMENT.
Contents
A Message from the Chairman /22
A Message from the CEO /23
Board of Directors /24
Executive Team /26
Corporate Governance /28
Management’s Discussion and Analysis /30
Financial Statements /58
Corporate Information /104
Cover photo: Tashnee Solomon, Air Canada
Opposite page: Vernon Coté, Eurest Services
DESIGN & DIRECTION
jimryce.com
THEMATIC SECTION WRITING
Doug Dolan
PRINTING
Somerset Graphics Co. Ltd.
PRINCIPAL PHOTOGRAPHY
Chris Thomaidis
BOARD AND EXECUTIVE PHOTOGRAPHY
Lorella Zanetti

Greater Toronto Airports AuthorityToronto Pearson International Airport
P.O. Box 6031, 3111 Convair Drive
Toronto AMF, Ontario, Canada l5p 1b2
TorontoPearson.com
We’re here to helpgtaa annual report 2012
We’re h
ere to h
elp g
taa
an
nu
al r
ep
or
t 20
12