Embed Size (px)
Citation preview
We’re Not All The Same!Exploring the DIVERSITY in Millennials
Jason Dunkel
647-259-2811
@jdunkel_ea
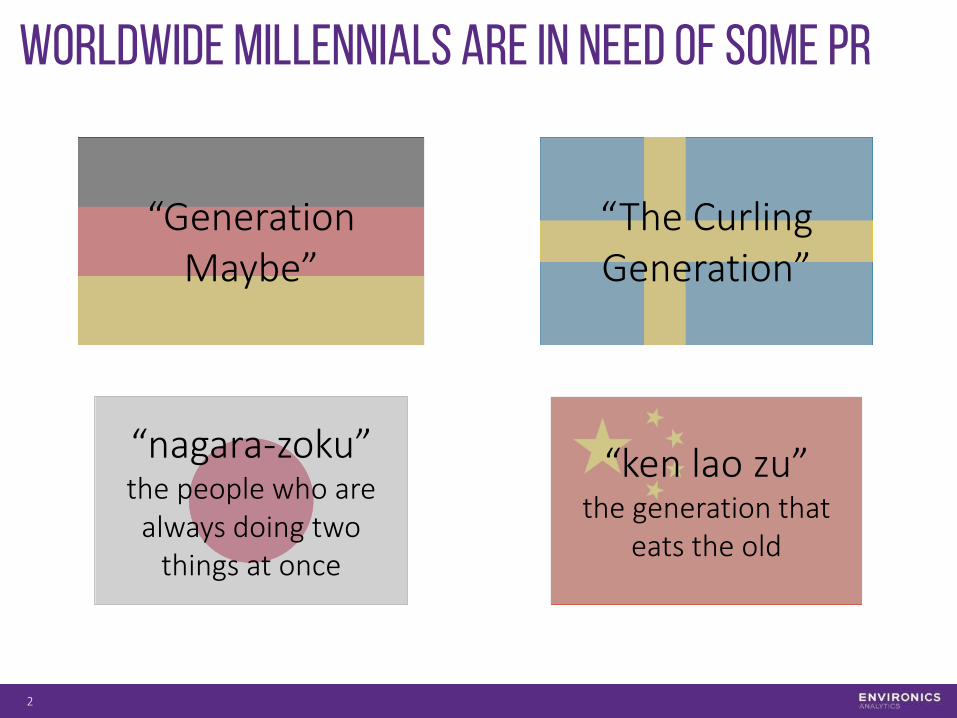
Worldwide Millennials are In need of Some PR
2
“Generation Maybe”
“The Curling Generation”
“nagara-zoku”the people who are
always doing two things at once
“ken lao zu”the generation that
eats the old
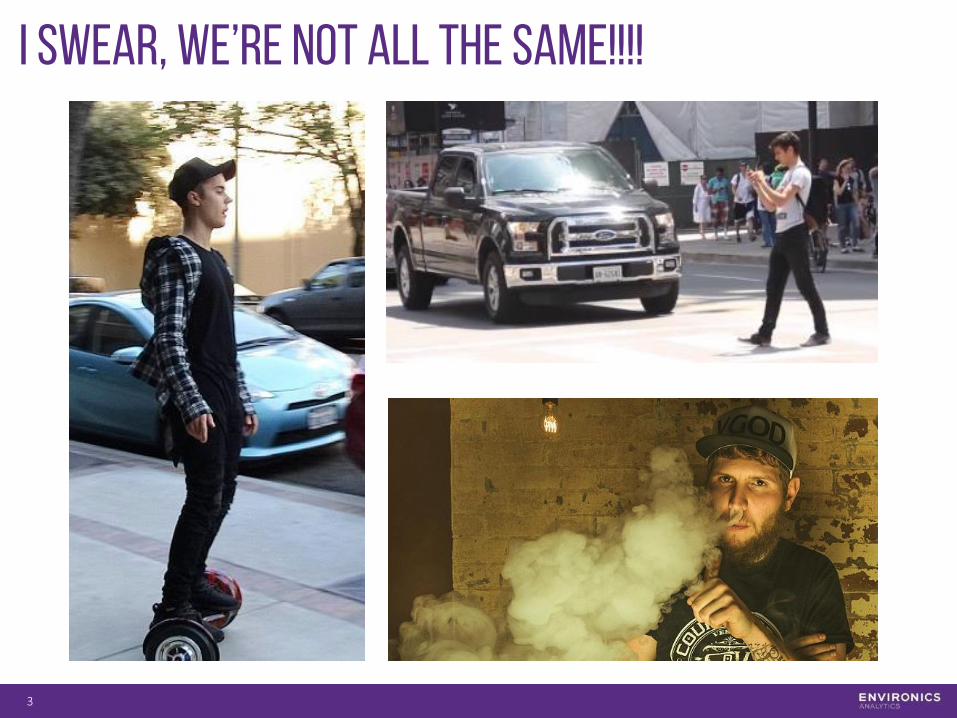
I Swear, We’re Not All The Same!!!!
3
Agenda• Introduction
• Demographic Trends
• Millennials – What Makes Them Different?
• Millennials – Thriving vs. Striving
4

Who am I?
• Started at Environics Analytics in 2008
• Spent 4 years in product management and software development
• Began specializing as consultant in Travel and Tourism in 2012
• TTRA Canada President, board member since 2013
Jason Dunkel
5

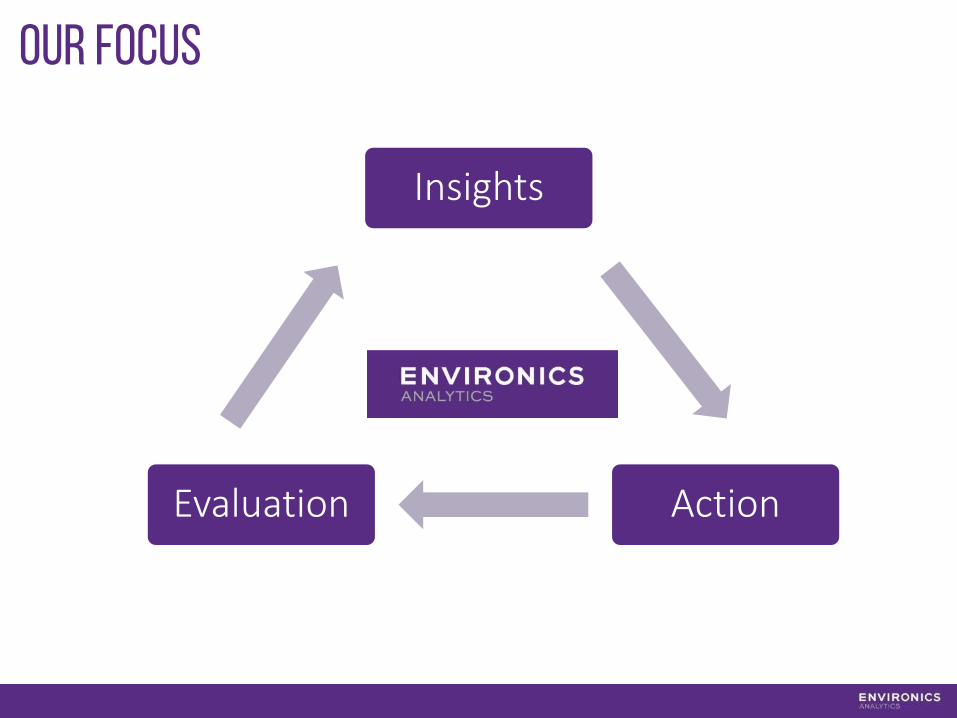
Our Focus
Insights
ActionEvaluation
Demographic Trends
8
A GROWING POPULATION
Demographic Trends
9
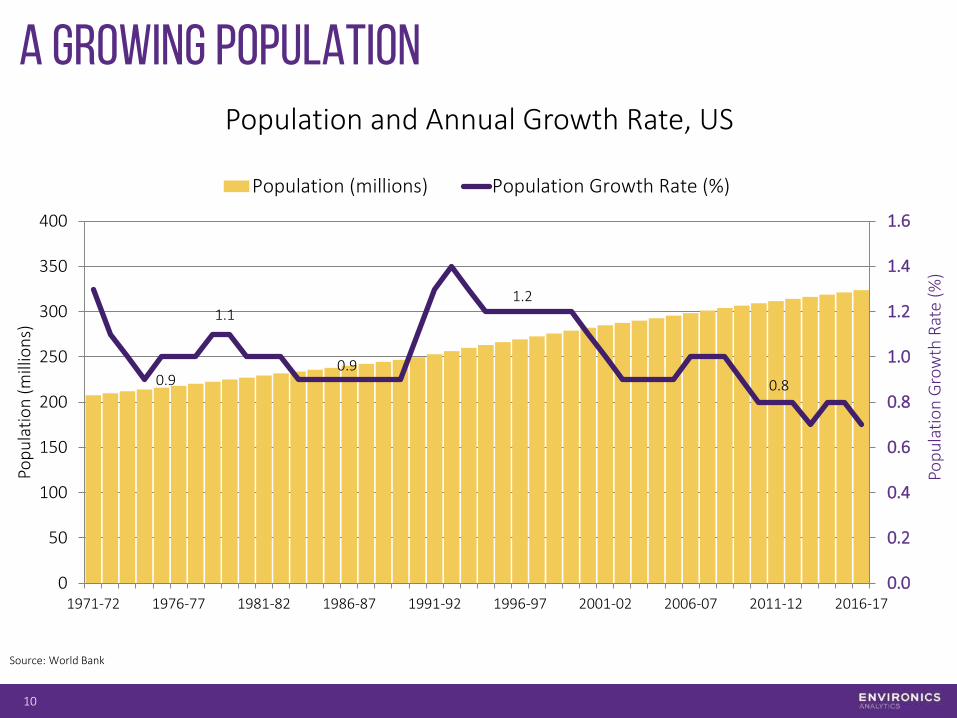
A Growing Population
10
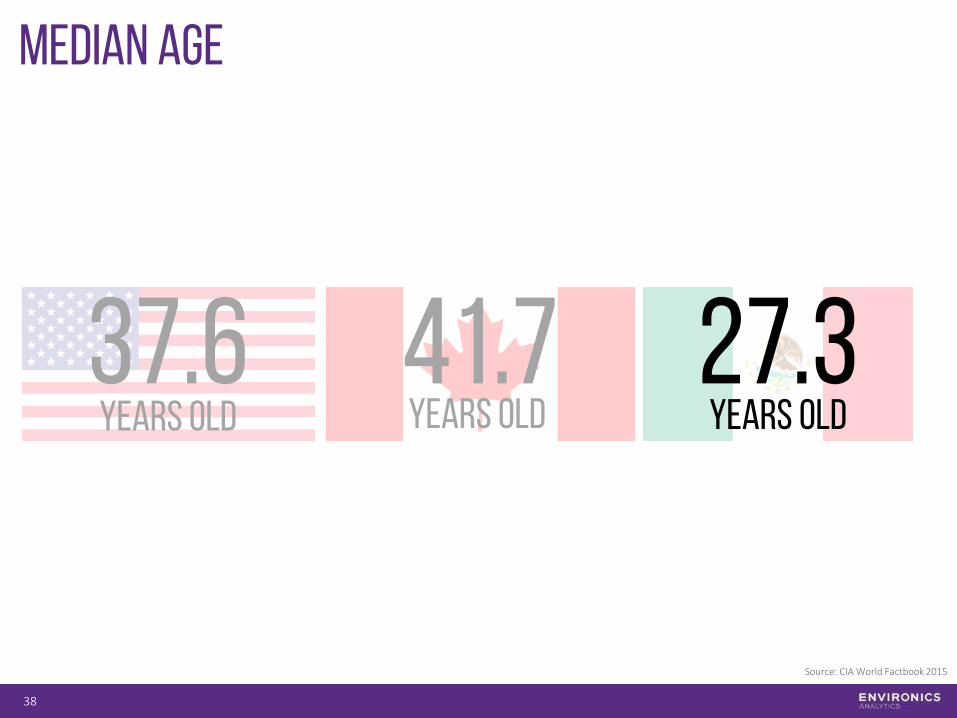
0.9
1.1
0.9
1.2
0.8
0.0
0.2
0.4
0.6
0.8
1.0
1.2
1.4
1.6
0
50
100
150
200
250
300
350
400
1971-72 1976-77 1981-82 1986-87 1991-92 1996-97 2001-02 2006-07 2011-12 2016-17
Pop
ula
tio
n G
row
th R
ate
(%)
Pop
ula
tio
n (
mill
ion
s)
Population (millions) Population Growth Rate (%)
Source: World Bank
Population and Annual Growth Rate, US
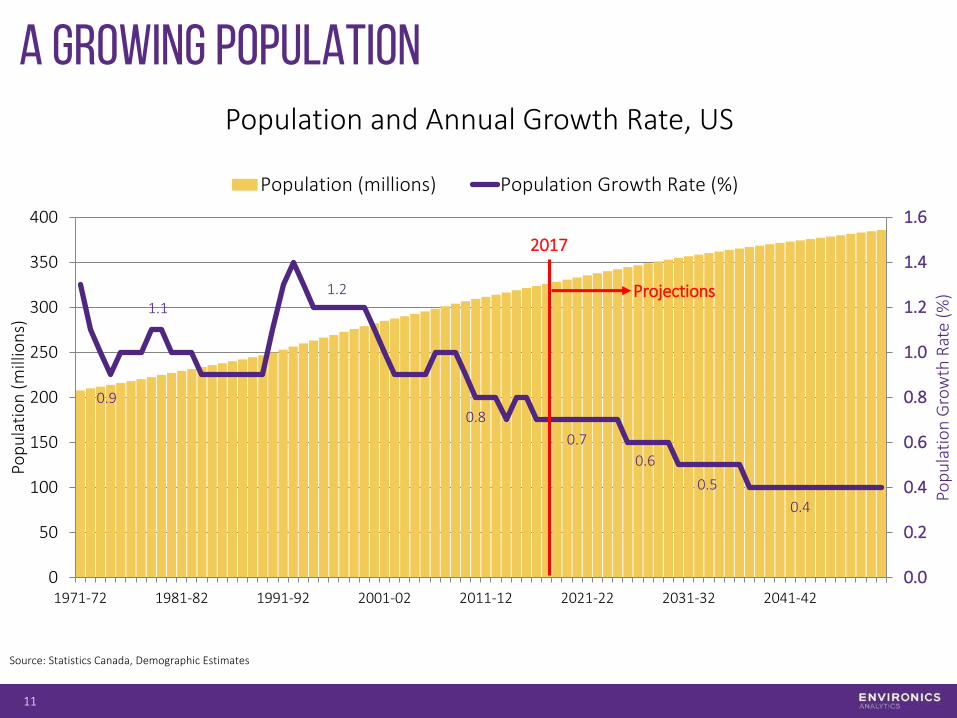
A Growing Population
11
Source: Statistics Canada, Demographic Estimates
0.9
1.11.2
0.8
0.7
0.6
0.5
0.4
0.0
0.2
0.4
0.6
0.8
1.0
1.2
1.4
1.6
0
50
100
150
200
250
300
350
400
1971-72 1981-82 1991-92 2001-02 2011-12 2021-22 2031-32 2041-42
Pop
ula
tio
n G
row
th R
ate
(%)
Pop
ula
tio
n (
mill
ion
s)
Population (millions) Population Growth Rate (%)
2017
Projections
Population and Annual Growth Rate, US

12
INCREASING DIVERSITY
Demographic Trends
13
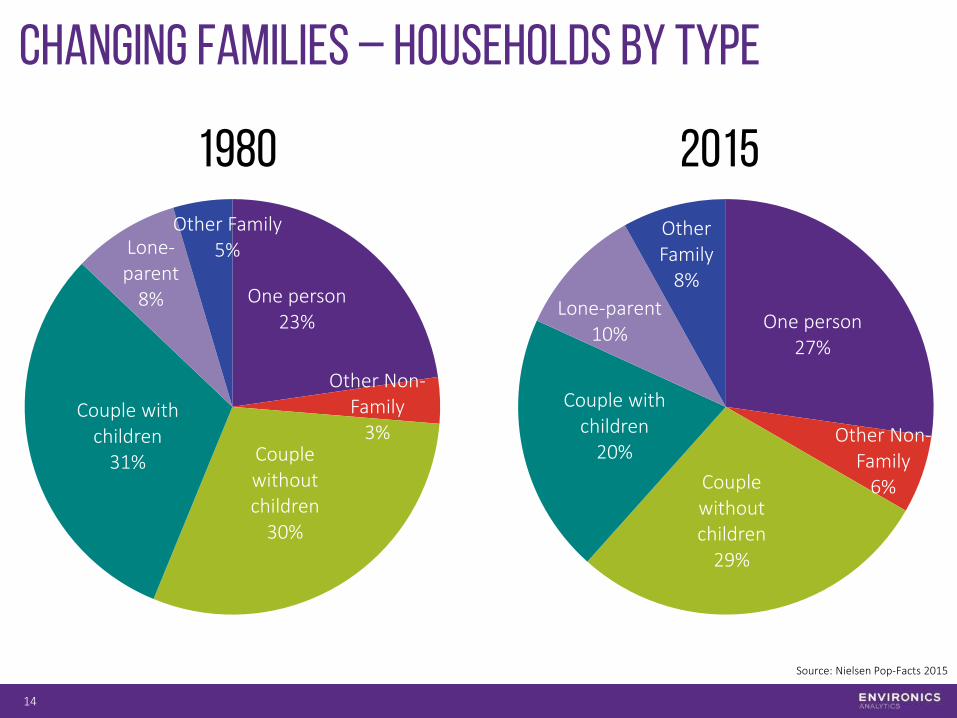
Changing Families – Households by Type
14
One person27%
Other Non-Family
6%Couple without children
29%
Couple with children
20%
Lone-parent10%
Other Family
8%
Source: Nielsen Pop-Facts 2015
2015
One person23%
Other Non-Family
3%Couple without children
30%
Couple with children
31%
Lone-parent
8%
Other Family5%
1980
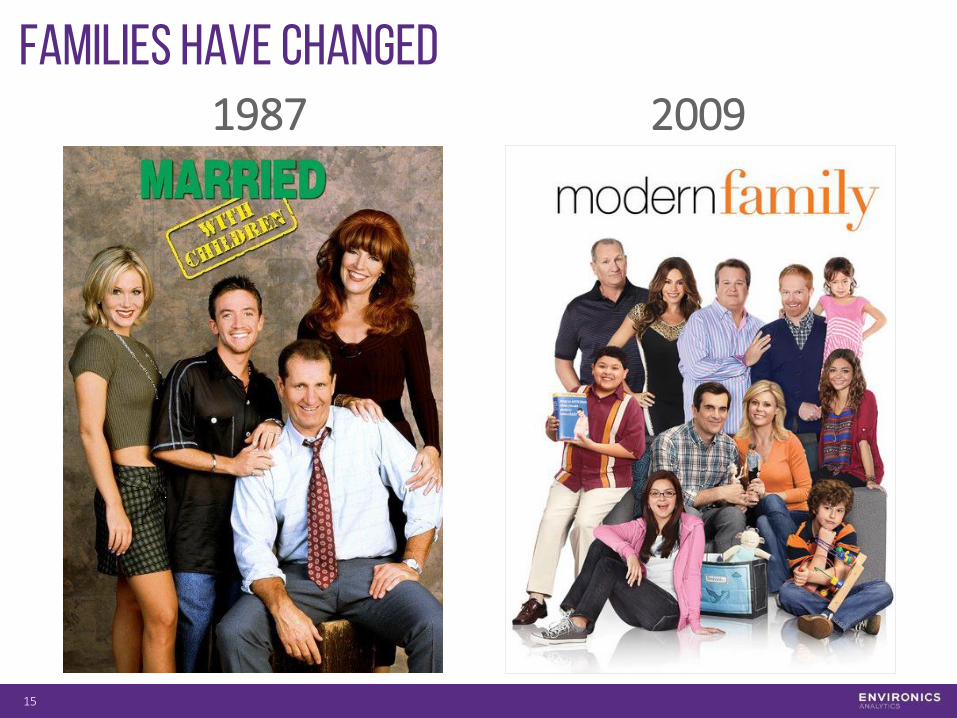
1987 2009
15
Families Have changed
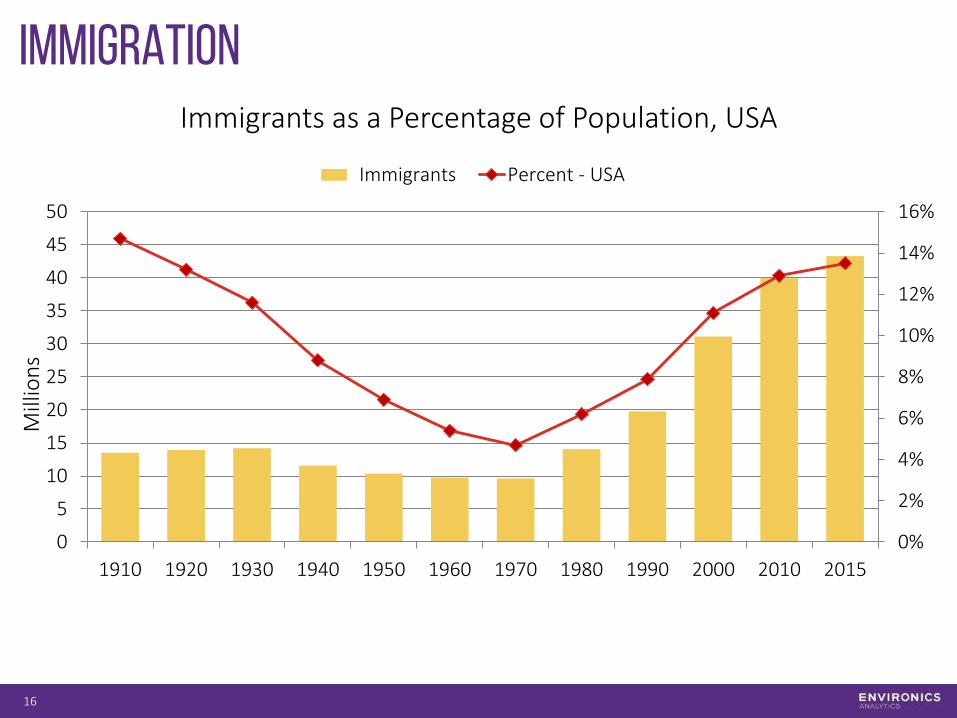
Immigration
16
0%
2%
4%
6%
8%
10%
12%
14%
16%
0
5
10
15
20
25
30
35
40
45
50
1910 1920 1930 1940 1950 1960 1970 1980 1990 2000 2010 2015
Mill
ion
s
Immigrants Percent - USA
Immigrants as a Percentage of Population, USA
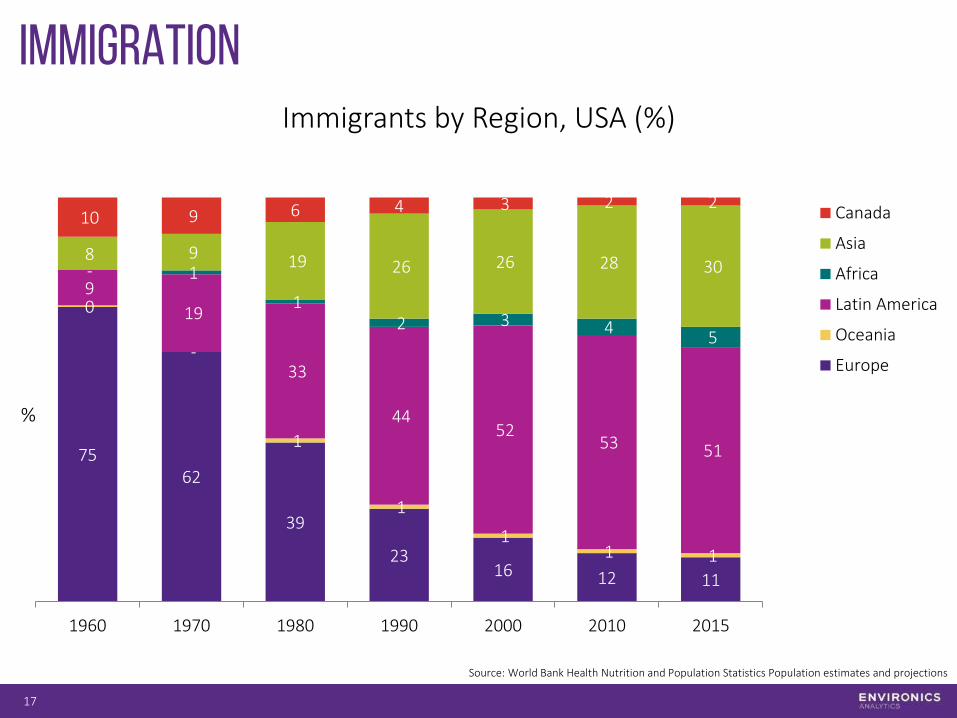
Immigration
17
7562
39
2316 12 11
0
-
1
1
1 1 1
9
19
33
44 52
53 51
- 1
1 2 3 4
5
8 9 19 26 26 28 30
10 9 6 4 3 2 2
1960 1970 1980 1990 2000 2010 2015
Canada
Asia
Africa
Latin America
Oceania
Europe
Source: World Bank Health Nutrition and Population Statistics Population estimates and projections
%
Immigrants by Region, USA (%)
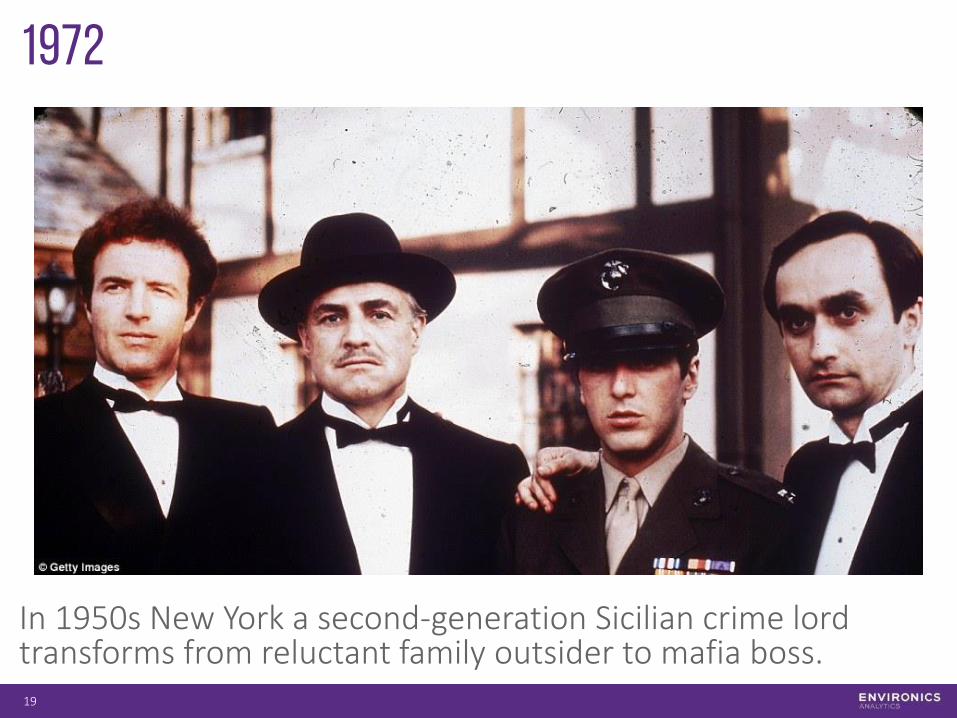
1972
19
In 1950s New York a second-generation Sicilian crime lord transforms from reluctant family outsider to mafia boss.
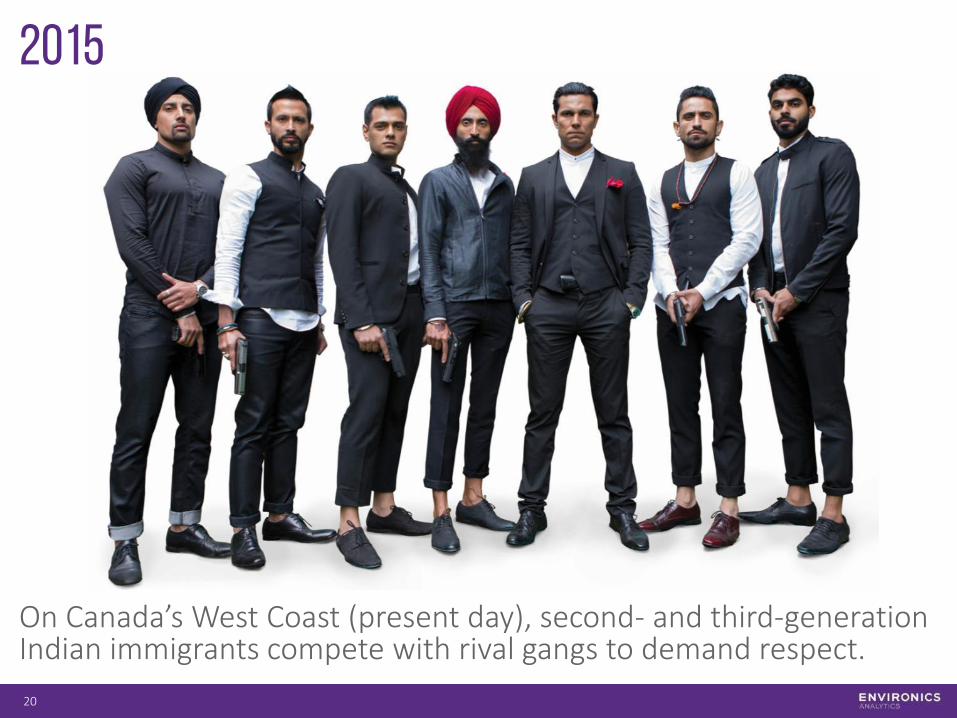
2015
On Canada’s West Coast (present day), second- and third-generation Indian immigrants compete with rival gangs to demand respect.
20

21
Canada’s National Pastime…
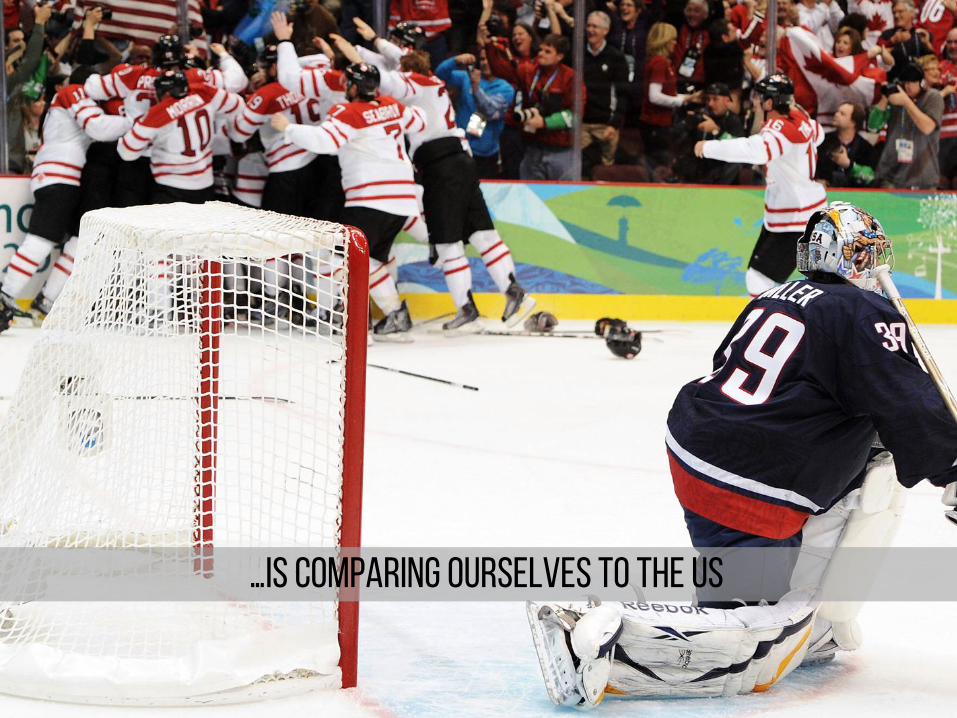
22
…IS Comparing Ourselves to The US
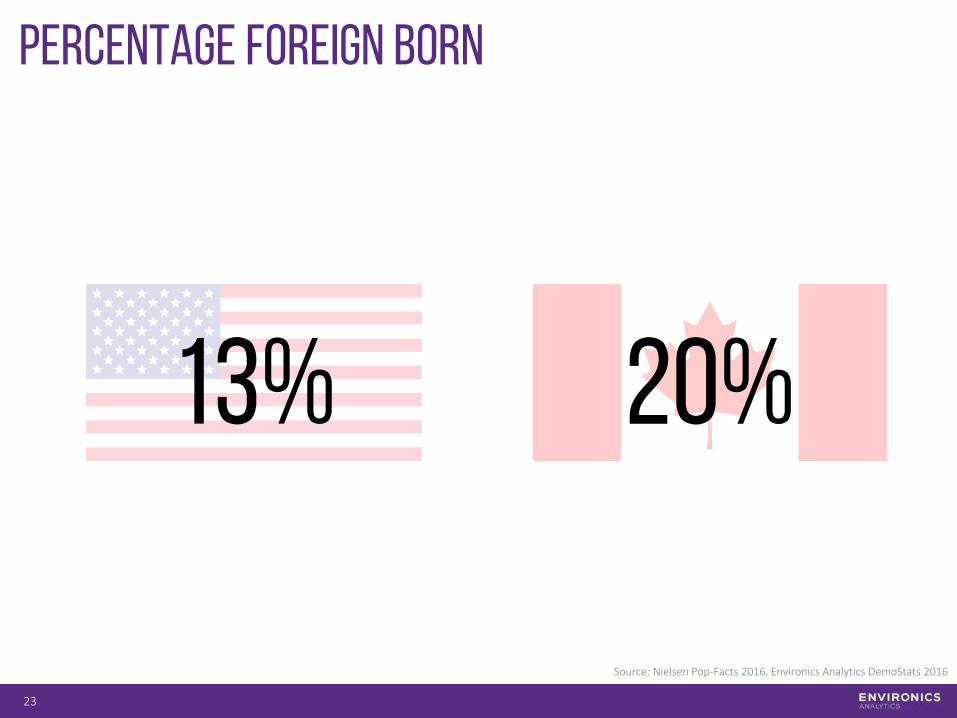
Percentage Foreign Born
23
20%13%
Source: Nielsen Pop-Facts 2016, Environics Analytics DemoStats 2016
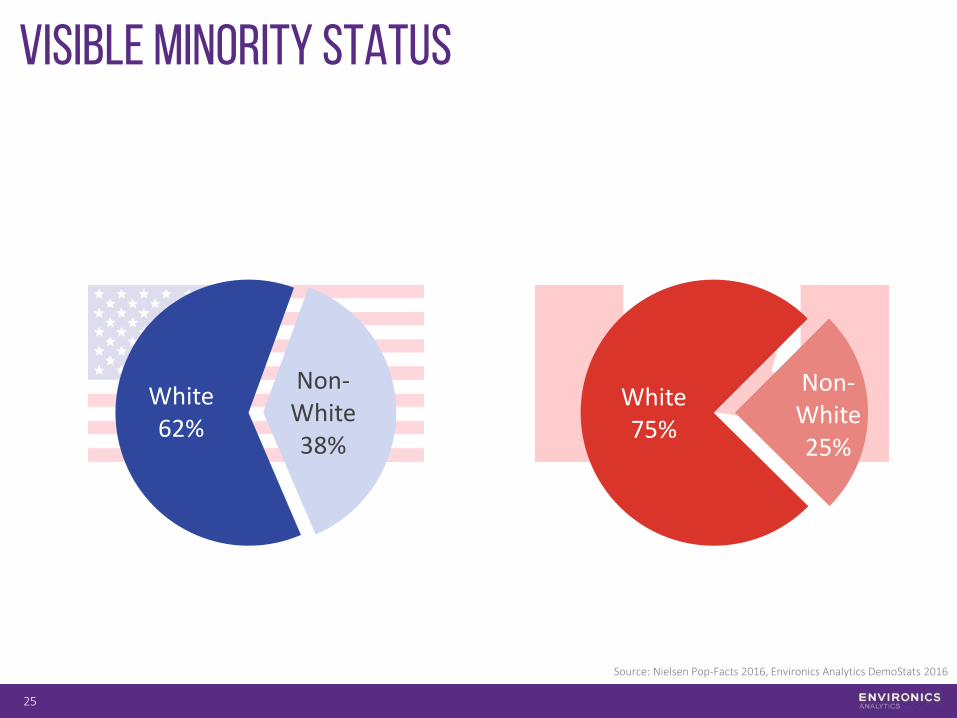
Visible Minority Status
25
Non-White 25%
White 75%
Non-White 38%
White 62%
Source: Nielsen Pop-Facts 2016, Environics Analytics DemoStats 2016
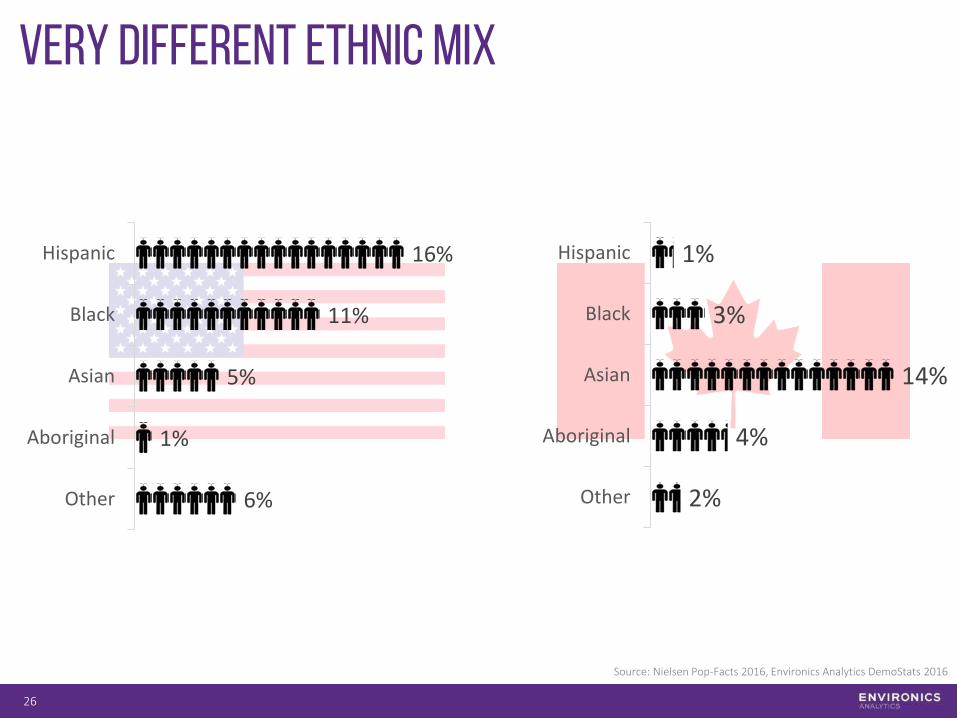
Very Different Ethnic Mix
26
2%
4%
14%
3%
1%
Other
Aboriginal
Asian
Black
Hispanic
6%
1%
5%
11%
16%
Other
Aboriginal
Asian
Black
Hispanic
Source: Nielsen Pop-Facts 2016, Environics Analytics DemoStats 2016

27
INCOME DISTRIBUTION
Demographic Trends
28
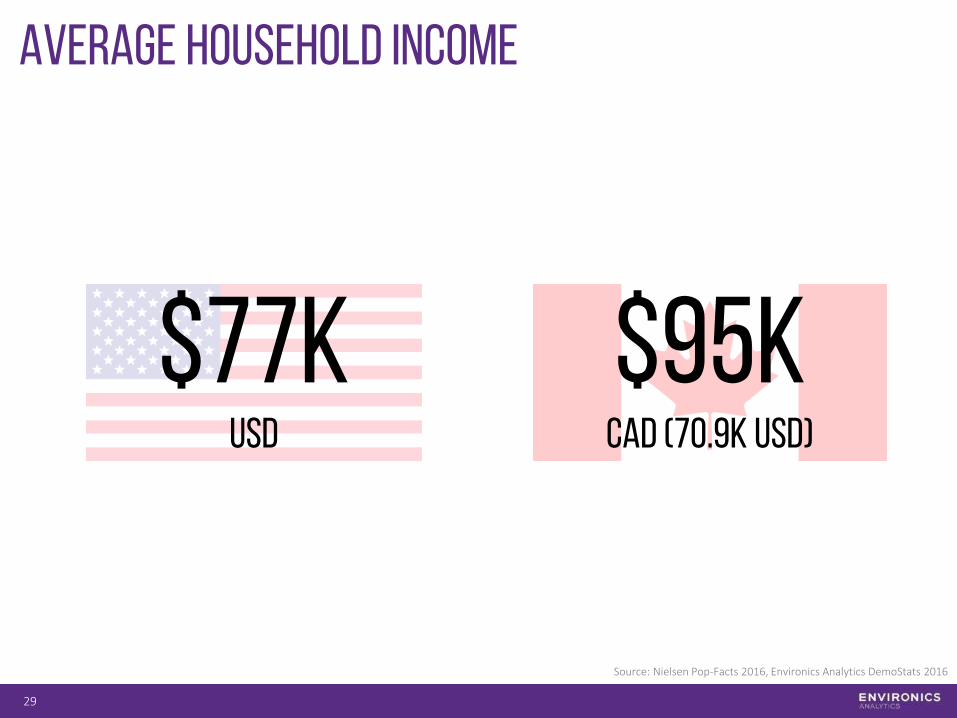
Average Household INcome
29
$77KUSD
$95KCAD (70.9K USD)
Source: Nielsen Pop-Facts 2016, Environics Analytics DemoStats 2016
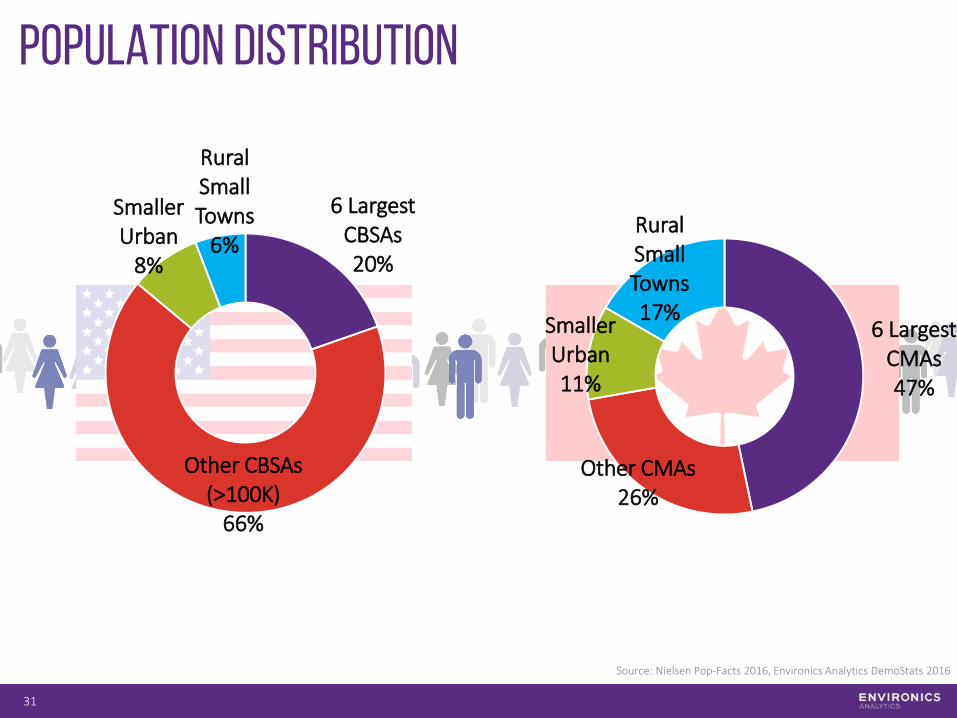
Population Distribution
31
6 Largest CMAs47%
Other CMAs26%
Smaller Urban11%
Rural Small Towns17%
6 Largest CBSAs20%
Other CBSAs (>100K)
66%
Smaller Urban
8%
Rural Small Towns
6%
Source: Nielsen Pop-Facts 2016, Environics Analytics DemoStats 2016
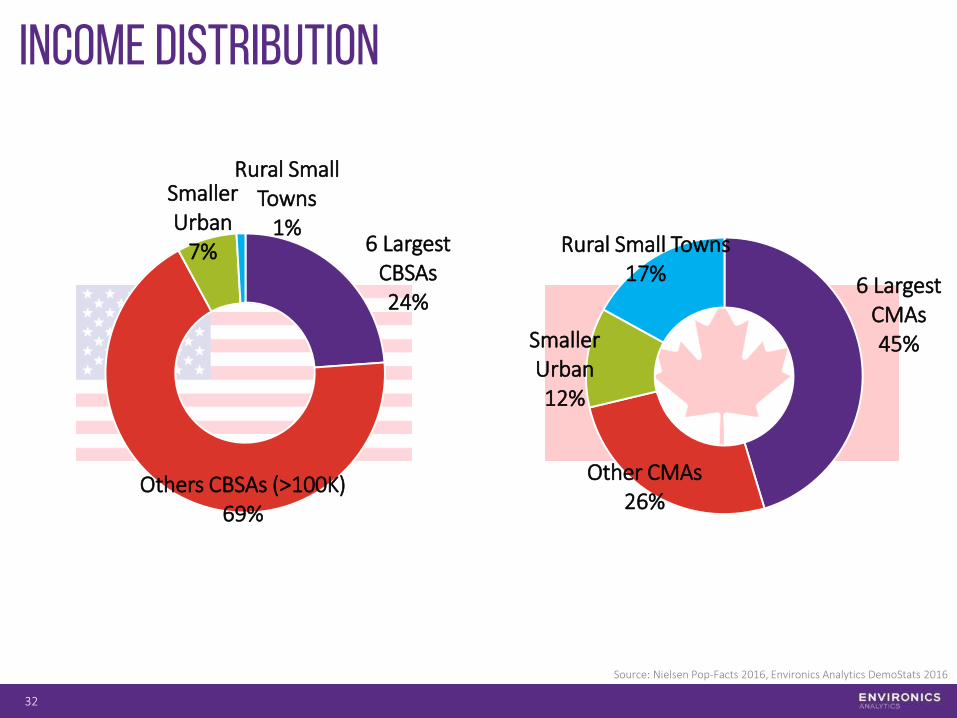
Income Distribution
32
6 Largest CMAs45%
Other CMAs26%
Smaller Urban12%
Rural Small Towns17%
6 Largest CBSAs24%
Others CBSAs (>100K)69%
Smaller Urban
7%
Rural Small Towns
1%
Source: Nielsen Pop-Facts 2016, Environics Analytics DemoStats 2016
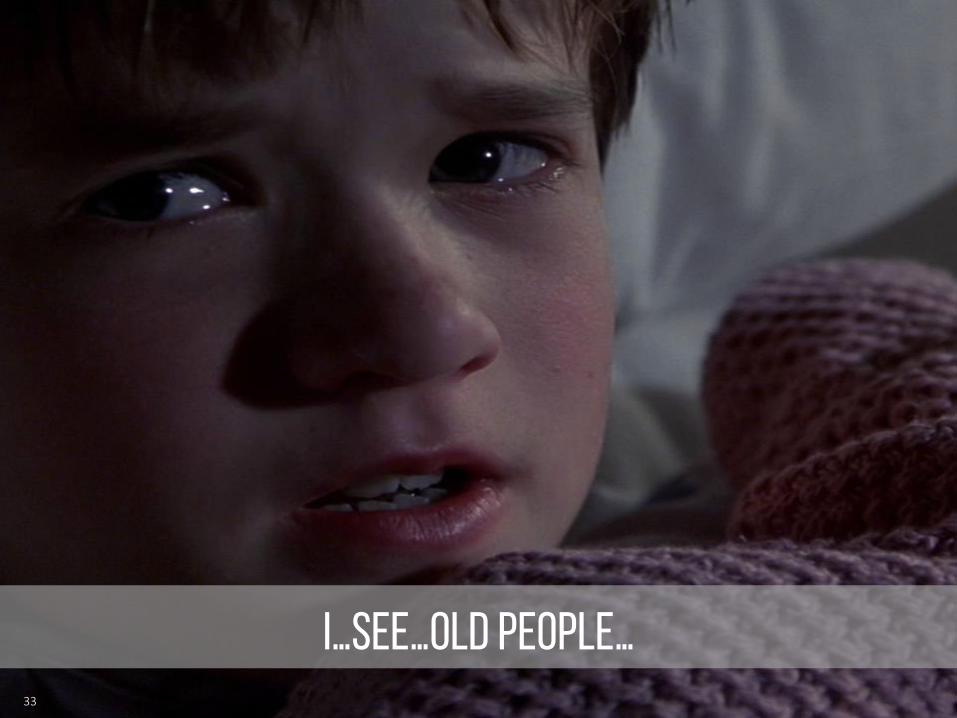
I…SEE…OLD PEOPLE…33
AGING POPULATION
Demographic Trends
34
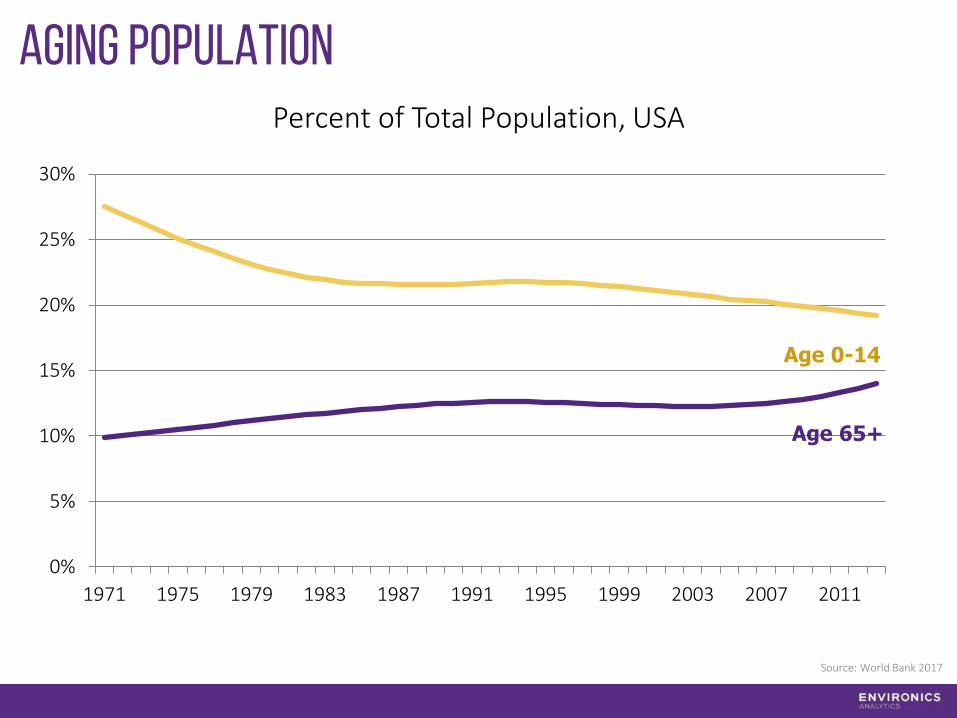
AGING Population
0%
5%
10%
15%
20%
25%
30%
1971 1975 1979 1983 1987 1991 1995 1999 2003 2007 2011
Age 65+
Age 0-14
Percent of Total Population, USA
Source: World Bank 2017
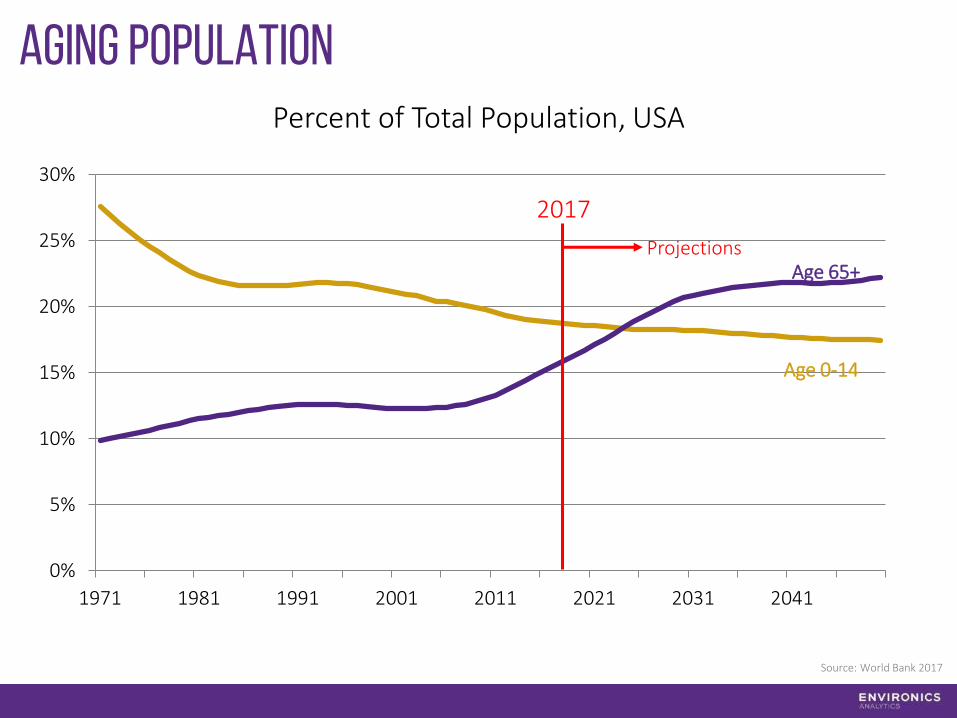
0%
5%
10%
15%
20%
25%
30%
1971 1981 1991 2001 2011 2021 2031 2041
Aging Population
ProjectionsAge 65+
Age 0-14
2017
Percent of Total Population, USA
Source: World Bank 2017
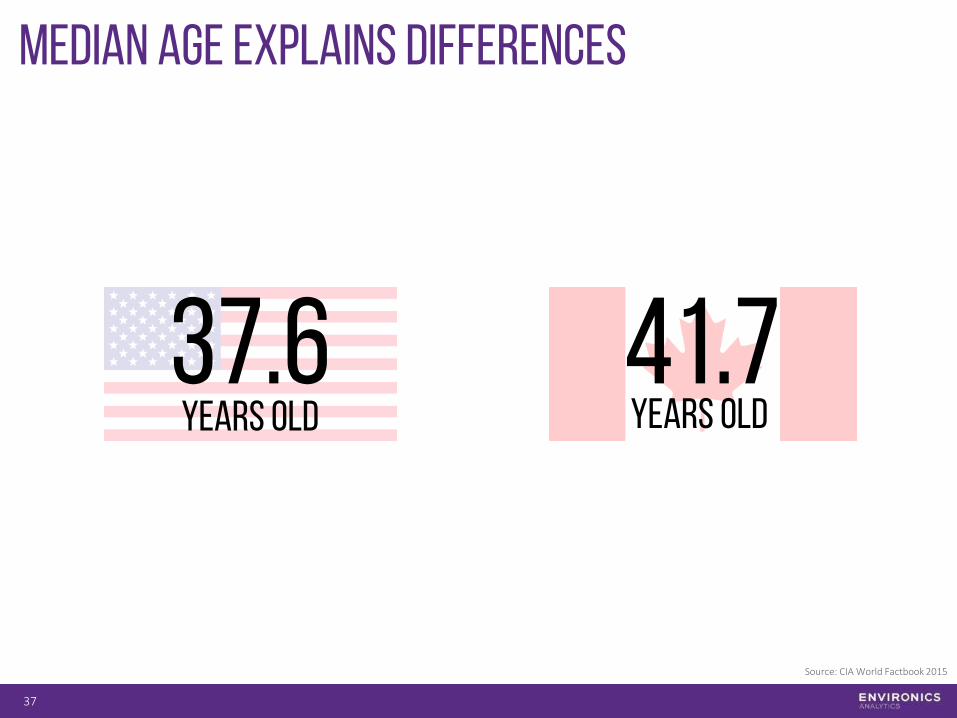
Median Age Explains Differences
Source: CIA World Factbook 2015
37
41.737.6Years OLD Years OLD
Median Age
Source: CIA World Factbook 2015
38
41.737.6 27.3Years OLD Years OLD Years OLD
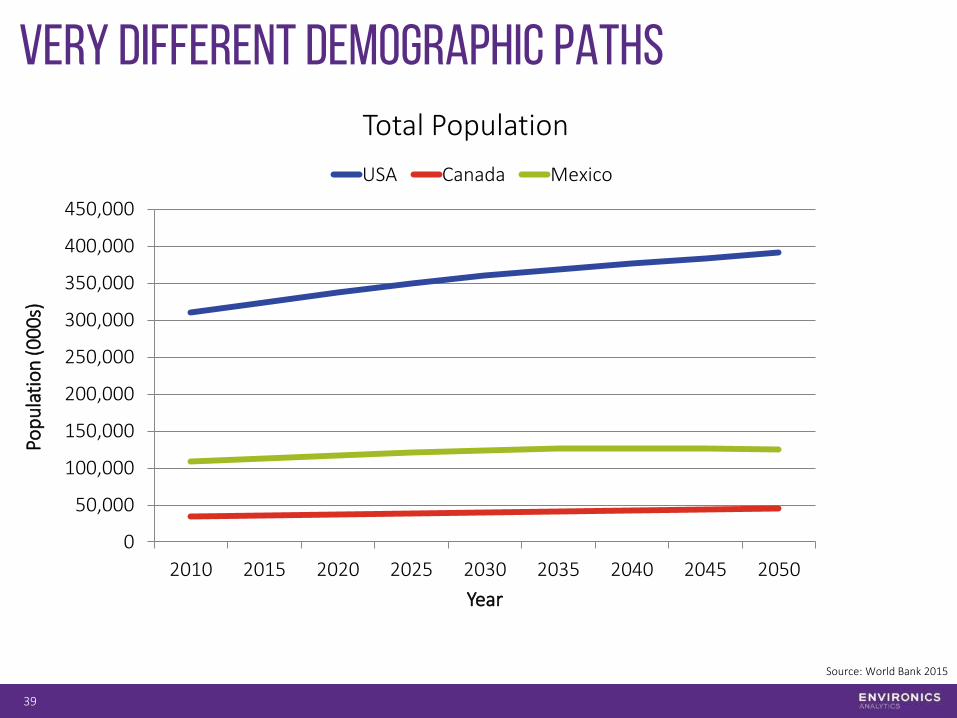
Very Different Demographic Paths
39
0
50,000
100,000
150,000
200,000
250,000
300,000
350,000
400,000
450,000
2010 2015 2020 2025 2030 2035 2040 2045 2050
Pop
ula
tio
n (
00
0s)
Year
USA Canada Mexico
Total Population
Source: World Bank 2015
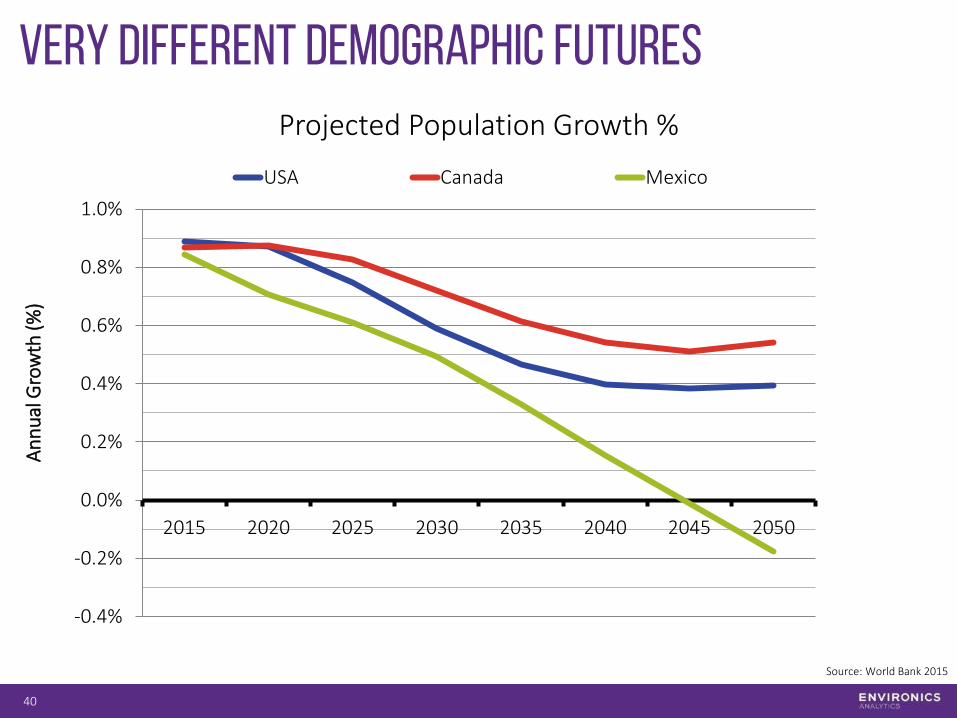
Very Different Demographic FUTURES
40
-0.4%
-0.2%
0.0%
0.2%
0.4%
0.6%
0.8%
1.0%
2015 2020 2025 2030 2035 2040 2045 2050
An
nu
al G
row
th (
%)
USA Canada Mexico
Projected Population Growth %
Source: World Bank 2015
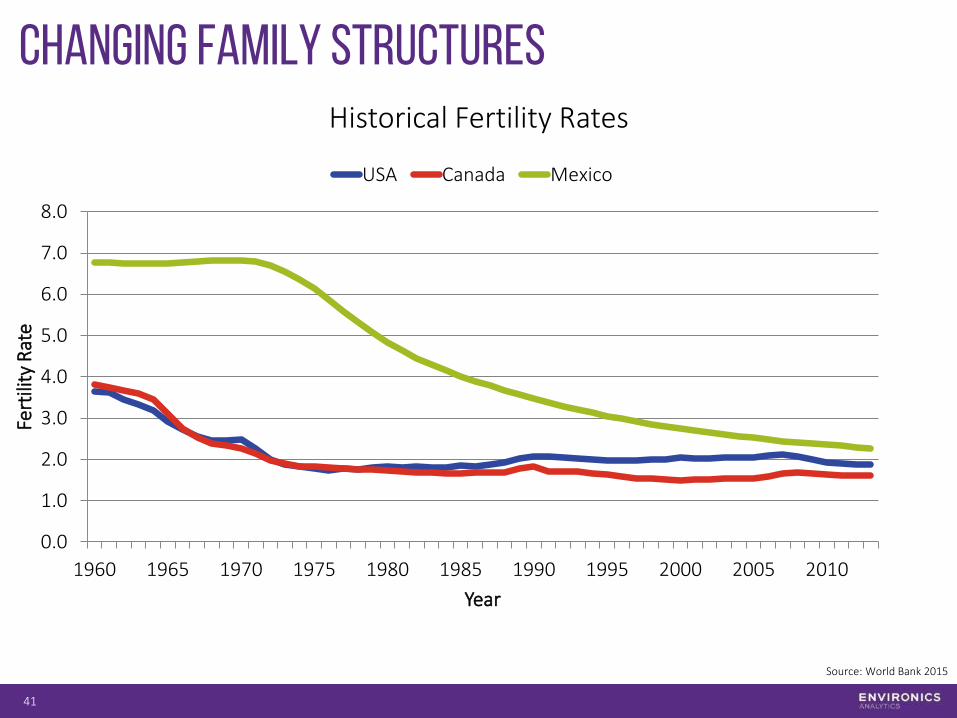
Changing Family Structures
41
0.0
1.0
2.0
3.0
4.0
5.0
6.0
7.0
8.0
1960 1965 1970 1975 1980 1985 1990 1995 2000 2005 2010
Fert
ility
Rat
e
Year
USA Canada Mexico
Historical Fertility Rates
Source: World Bank 2015
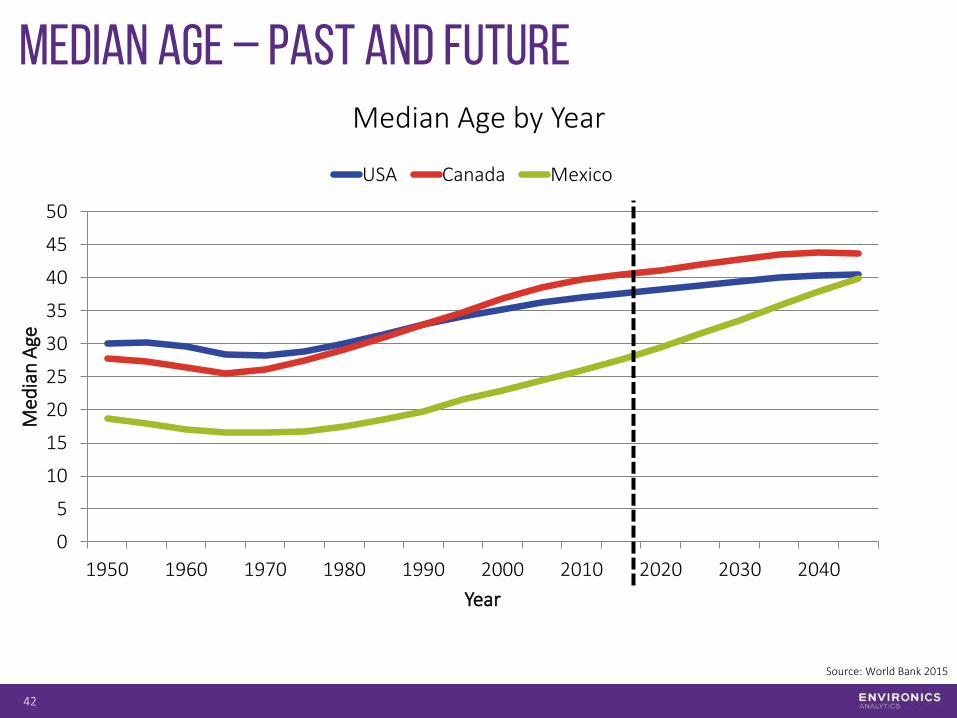
Median Age – Past and Future
42
0
5
10
15
20
25
30
35
40
45
50
1950 1960 1970 1980 1990 2000 2010 2020 2030 2040
Med
ian
Age
Year
USA Canada Mexico
Source: World Bank 2015
Median Age by Year
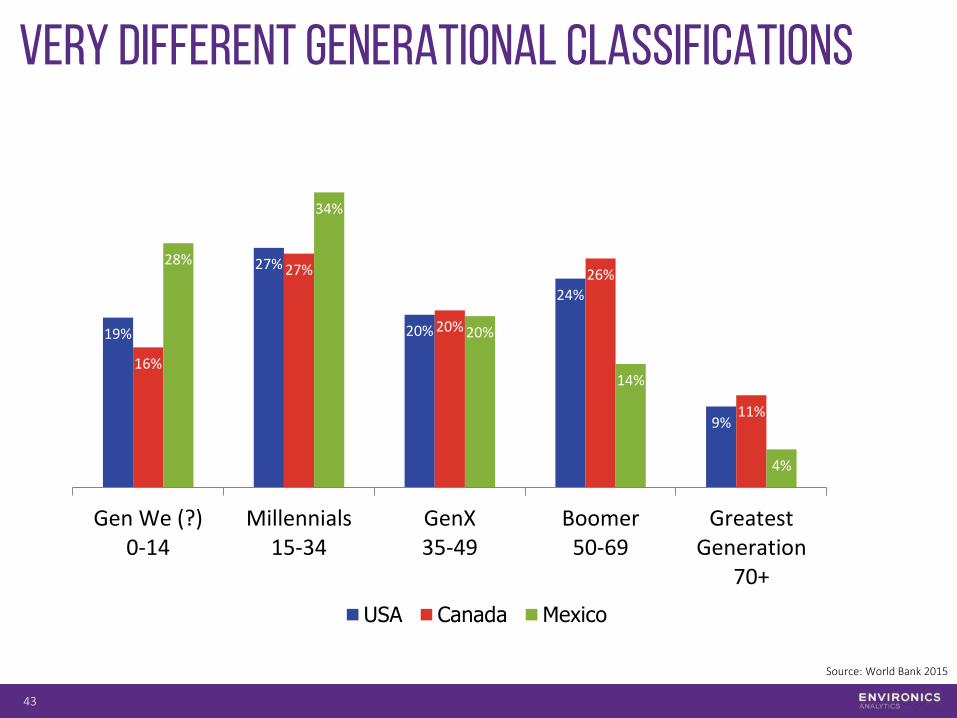
Very Different Generational Classifications
43
19%
27%
20%
24%
9%
16%
27%
20%
26%
11%
28%
34%
20%
14%
4%
Gen We (?)0-14
Millennials15-34
GenX35-49
Boomer50-69
GreatestGeneration
70+
USA Canada Mexico
Source: World Bank 2015
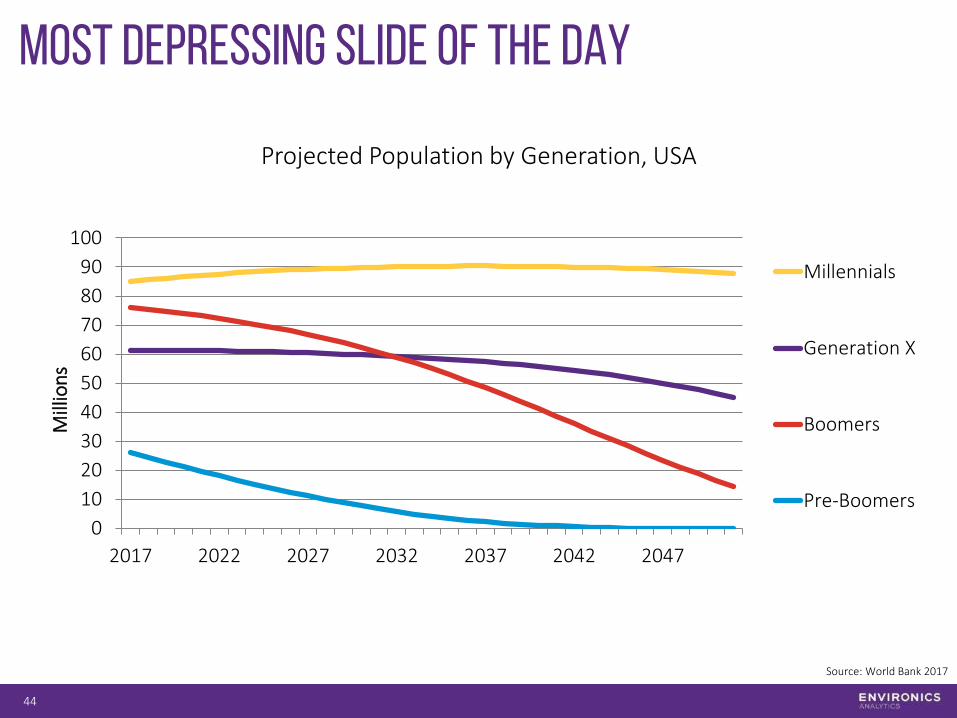
Most Depressing Slide of The Day
44
Projected Population by Generation, USA
0
10
20
30
40
50
60
70
80
90
100
2017 2022 2027 2032 2037 2042 2047
Mill
ion
s
Millennials
Generation X
Boomers
Pre-Boomers
Source: World Bank 2017
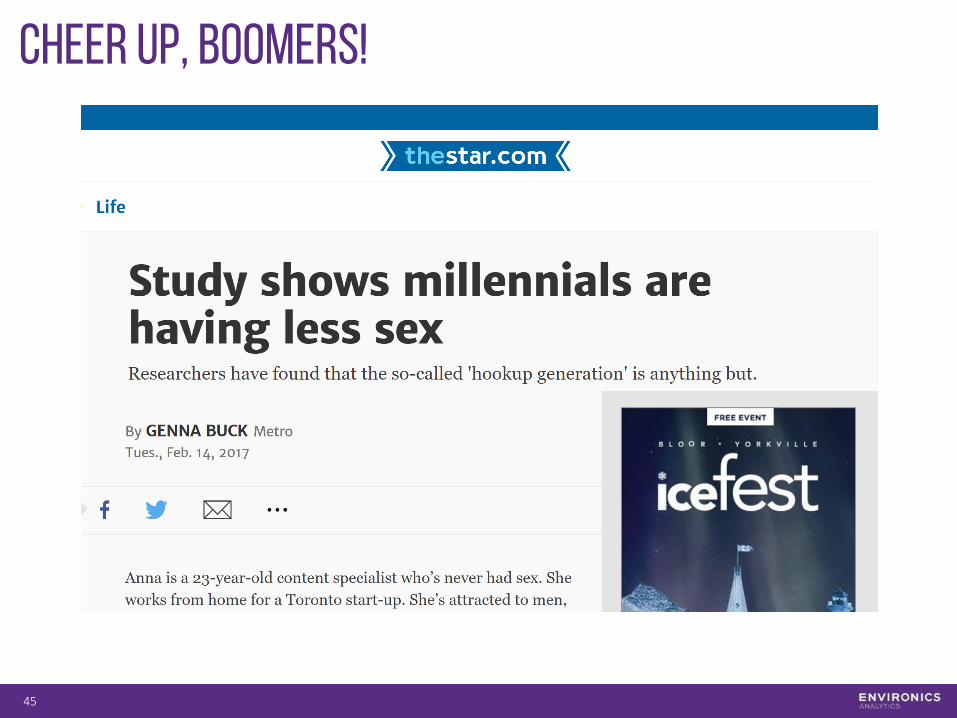
Cheer Up, Boomers!
45
Millennials: What Makes Them Different?
46
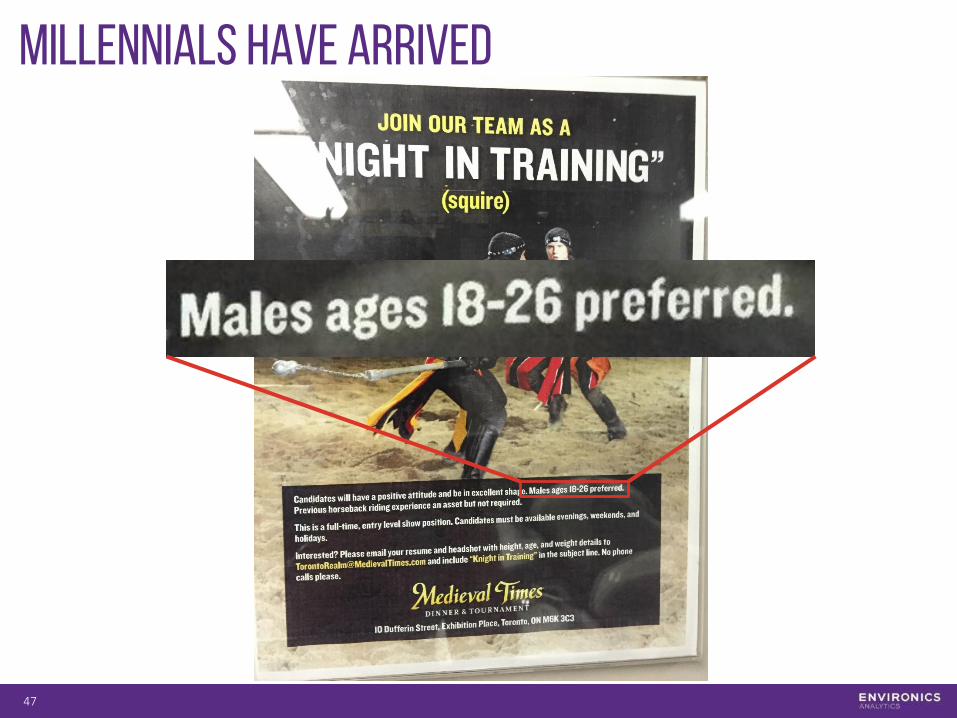
Millennials have arrived
47
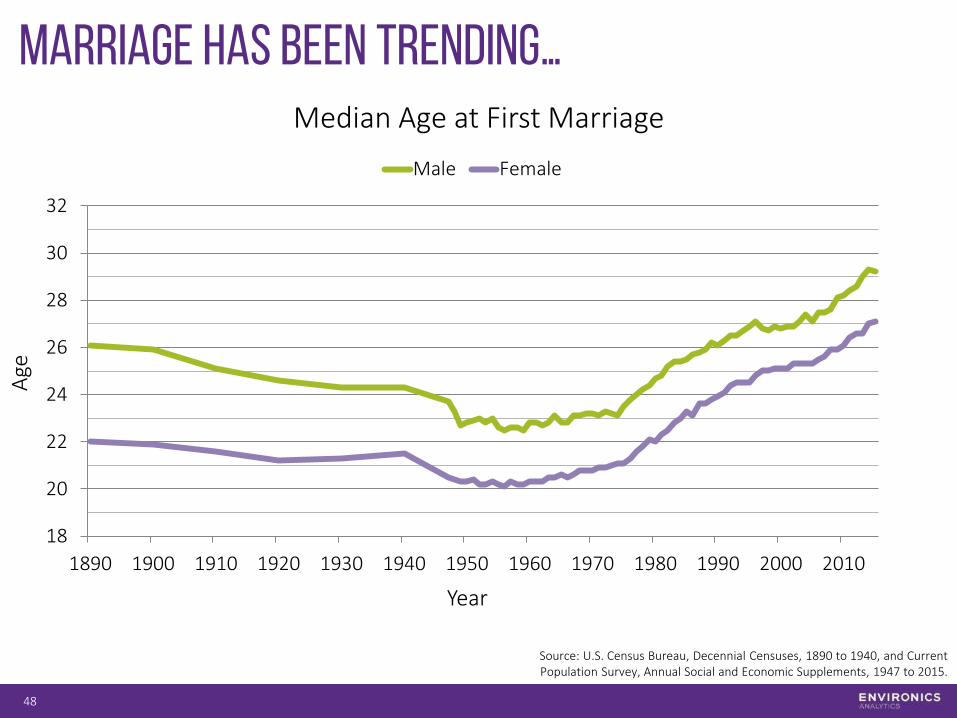
Marriage Has Been Trending…
48
18
20
22
24
26
28
30
32
1890 1900 1910 1920 1930 1940 1950 1960 1970 1980 1990 2000 2010
Male Female
Source: U.S. Census Bureau, Decennial Censuses, 1890 to 1940, and Current Population Survey, Annual Social and Economic Supplements, 1947 to 2015.
Age
Year
Median Age at First Marriage
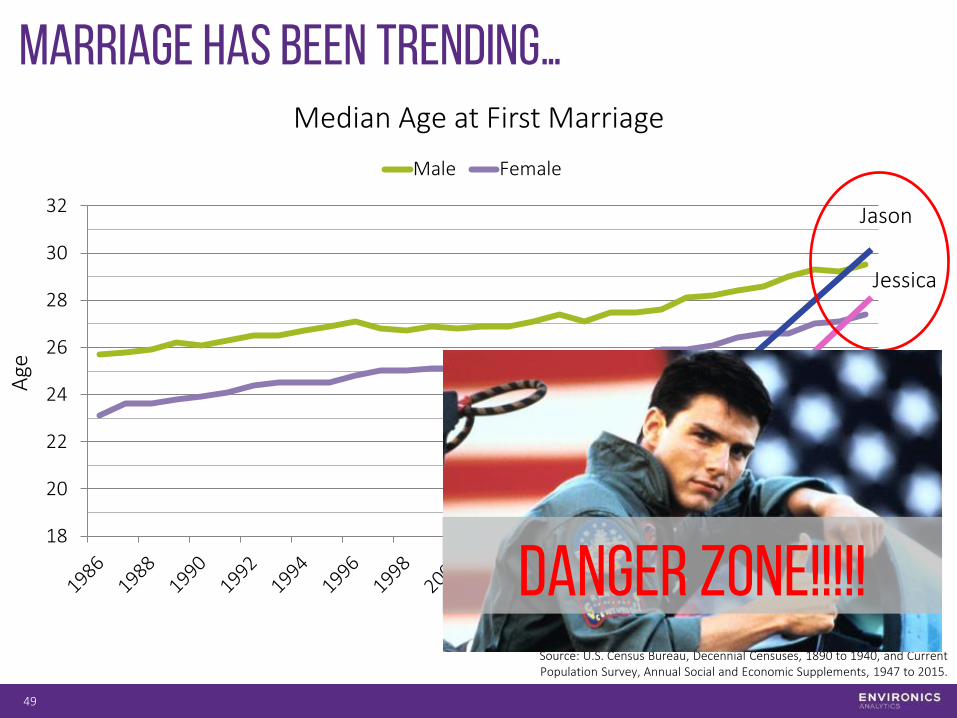
Marriage Has Been Trending…
49
18
20
22
24
26
28
30
32
Male Female
Source: U.S. Census Bureau, Decennial Censuses, 1890 to 1940, and Current Population Survey, Annual Social and Economic Supplements, 1947 to 2015.
Age
Year
Median Age at First Marriage
Jason
Jessica
DANGER ZONE!!!!!
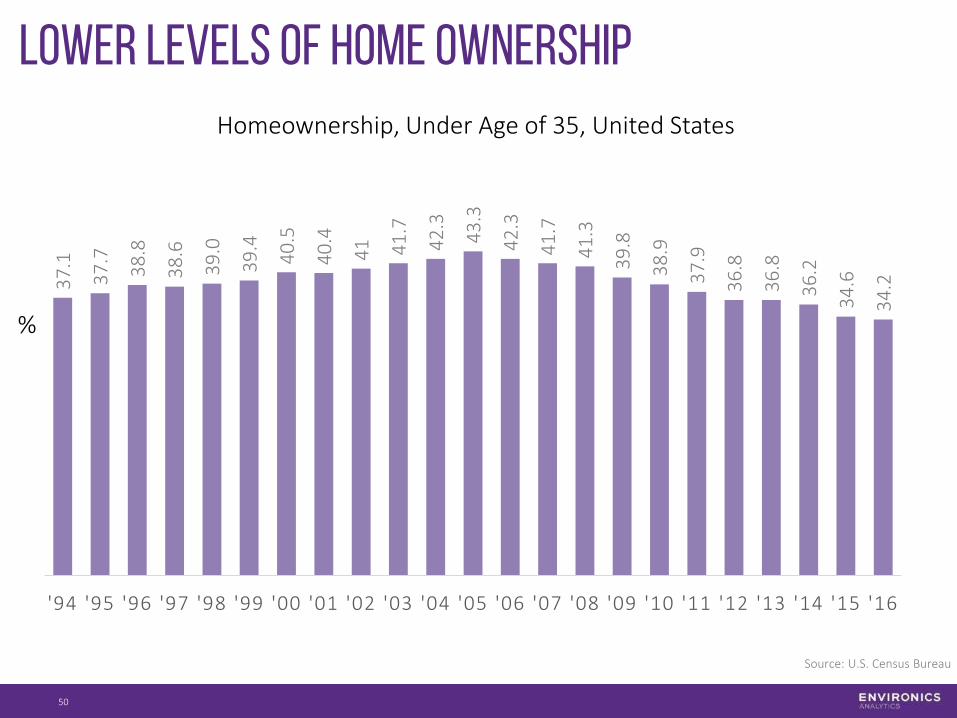
50
Homeownership, Under Age of 35, United States
Lower Levels of Home Ownership
Source: U.S. Census Bureau
%
37
.1
37
.7
38
.8
38
.6
39
.0
39
.4
40
.5
40
.4
41 41
.7
42
.3
43
.3
42
.3
41
.7
41
.3
39
.8
38
.9
37
.9
36
.8
36
.8
36
.2
34
.6
34
.2
'94 '95 '96 '97 '98 '99 '00 '01 '02 '03 '04 '05 '06 '07 '08 '09 '10 '11 '12 '13 '14 '15 '16
8% 10% 8% 10%7% 9%
20%
25%
19%
21%
18% 17%
6%
9%
7%
9%
8% 9%
2%
2%
2%
2%
3% 1%
1%
1%
1%
1%
2% 1%36%
46%
37%
44%
37% 37%
Male Female Male Female Male Female
Doctorate Degree
Professional Degree >Bachelor's
Master's Degree
Bachelor's Degree
Associate's Degree
FEMALES Continue TO LEAD THE WAY
Source: US Census Bureau American Community Survey, 2014
Educational Attainment – USA
Millennials Gen X Boomers
FEMALES Continue TO LEAD THE WAY
52
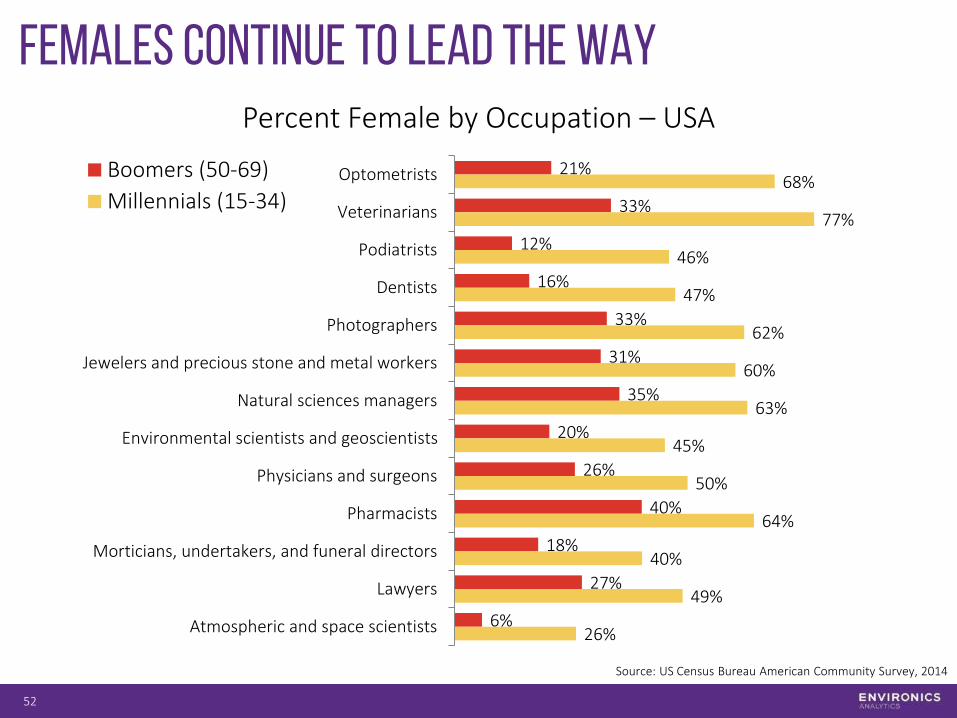
21%
33%
12%
16%
33%
31%
35%
20%
26%
40%
18%
27%
6%
68%
77%
46%
47%
62%
60%
63%
45%
50%
64%
40%
49%
26%
Optometrists
Veterinarians
Podiatrists
Dentists
Photographers
Jewelers and precious stone and metal workers
Natural sciences managers
Environmental scientists and geoscientists
Physicians and surgeons
Pharmacists
Morticians, undertakers, and funeral directors
Lawyers
Atmospheric and space scientists
Boomers (50-69)
Millennials (15-34)
Percent Female by Occupation – USA
Source: US Census Bureau American Community Survey, 2014

FEMALES Continue to lead The Way
53
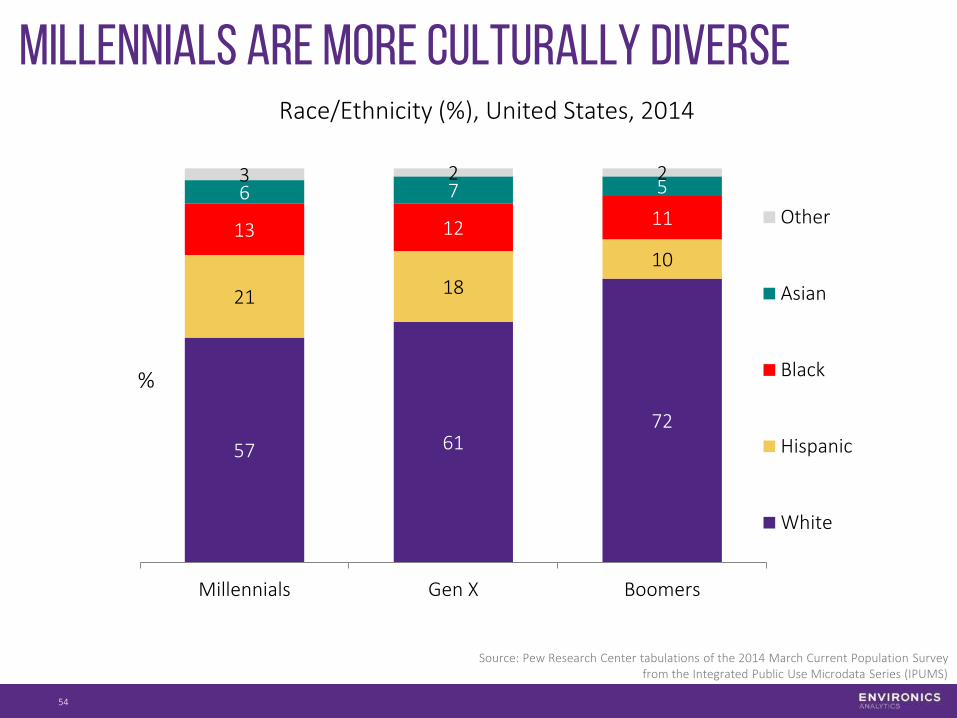
57 6172
21 18
10
13 12 116 7 53 2 2
Millennials Gen X Boomers
Other
Asian
Black
Hispanic
White
54
Race/Ethnicity (%), United States, 2014
Millennials are more culturally diverse
Source: Pew Research Center tabulations of the 2014 March Current Population Survey from the Integrated Public Use Microdata Series (IPUMS)
%
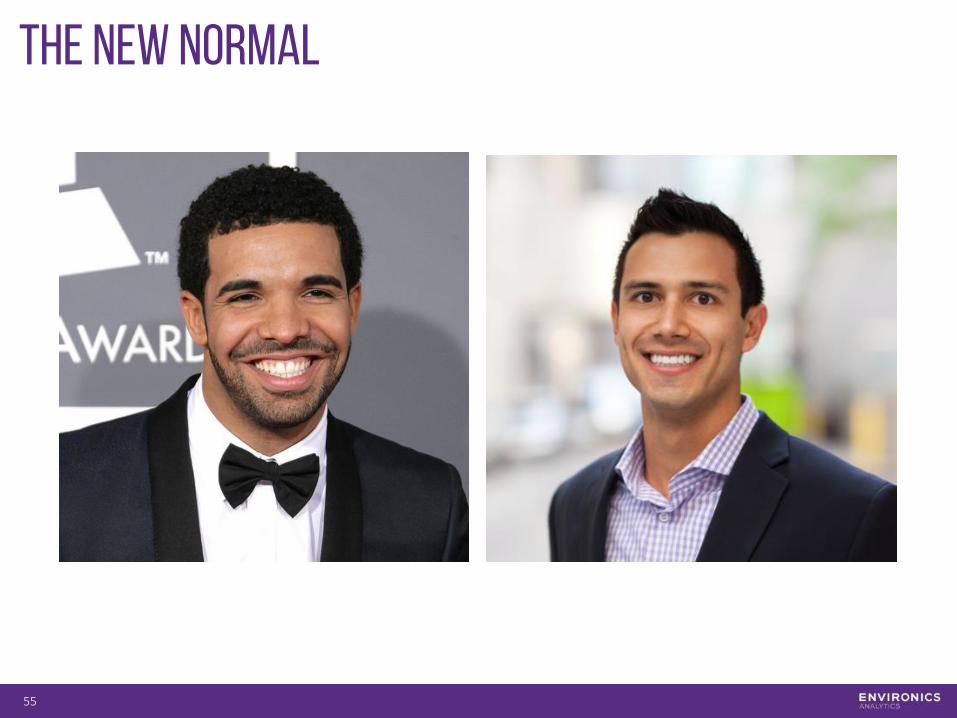
The New Normal
55
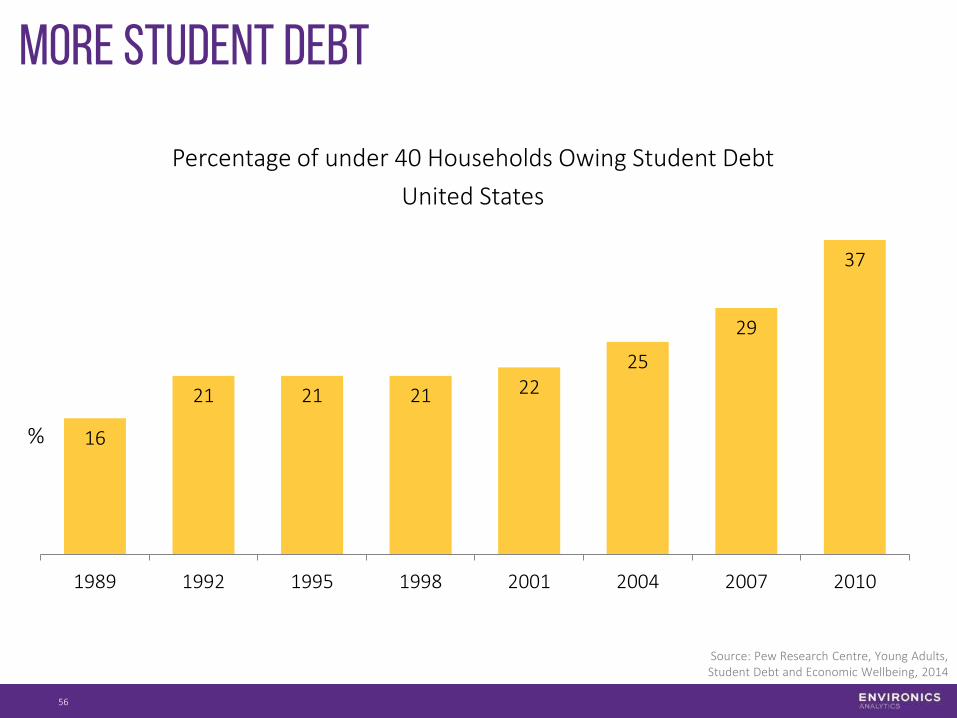
16
21 21 21 2225
29
37
1989 1992 1995 1998 2001 2004 2007 2010
56
Percentage of under 40 Households Owing Student Debt
United States
More student debt
Source: Pew Research Centre, Young Adults, Student Debt and Economic Wellbeing, 2014
%
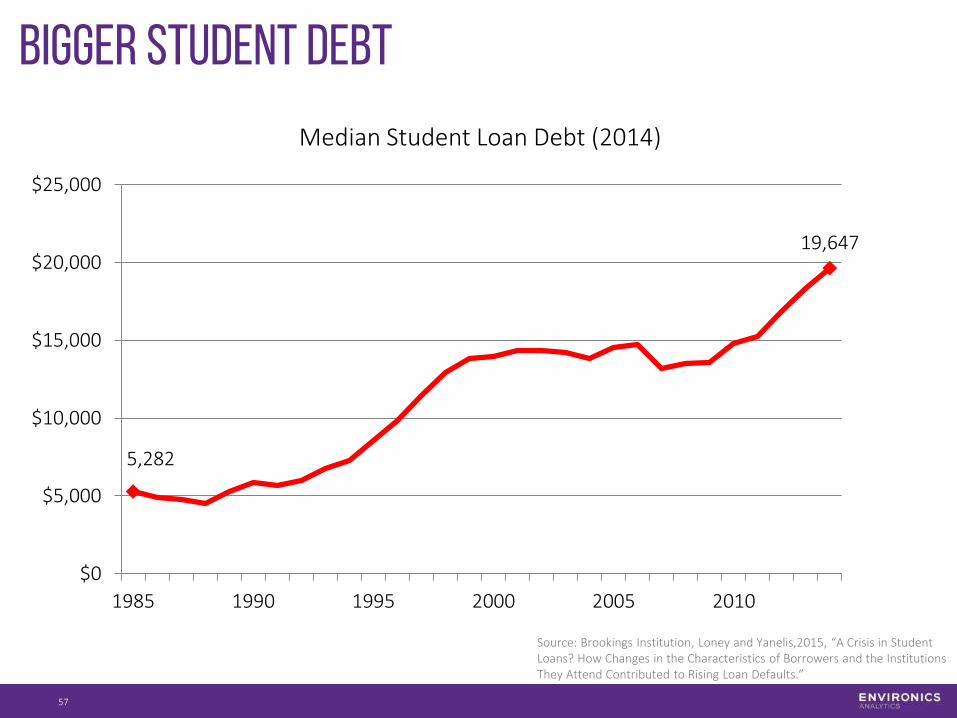
Median Student Loan Debt (2014)
Bigger Student Debt
Source: Brookings Institution, Loney and Yanelis,2015, “A Crisis in Student Loans? How Changes in the Characteristics of Borrowers and the Institutions They Attend Contributed to Rising Loan Defaults.”
5,282
19,647
$0
$5,000
$10,000
$15,000
$20,000
$25,000
1985 1990 1995 2000 2005 2010
57

NOT A GOOD TIME TO BE A MALE MILLENNIAL…
Millennials: Thriving Vs. Striving
59
BACKGROUND - GEODEMOGRAPHY
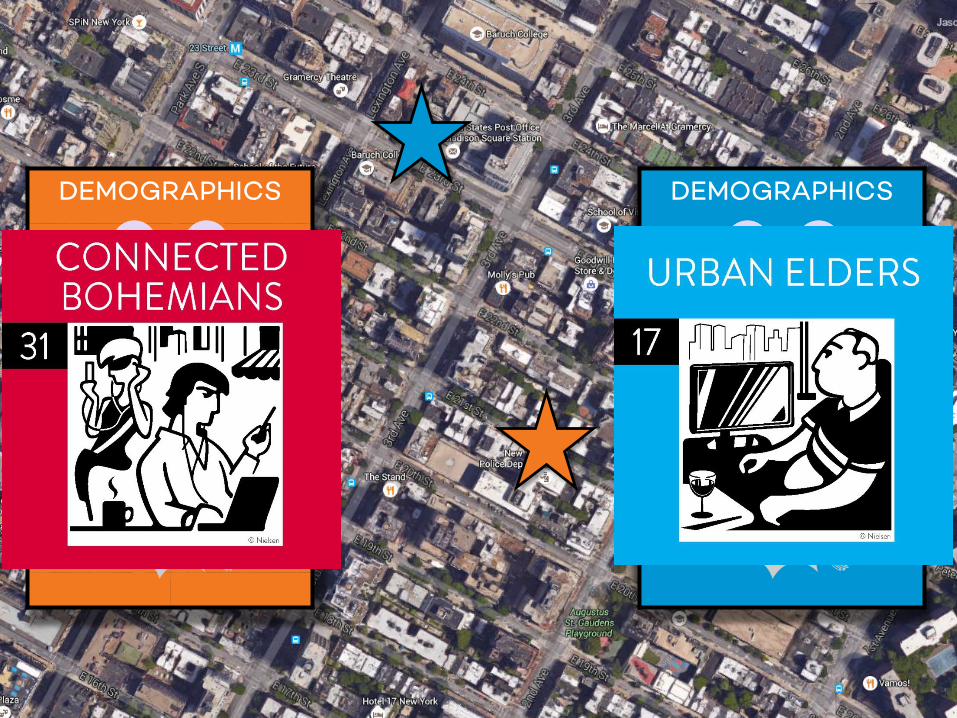
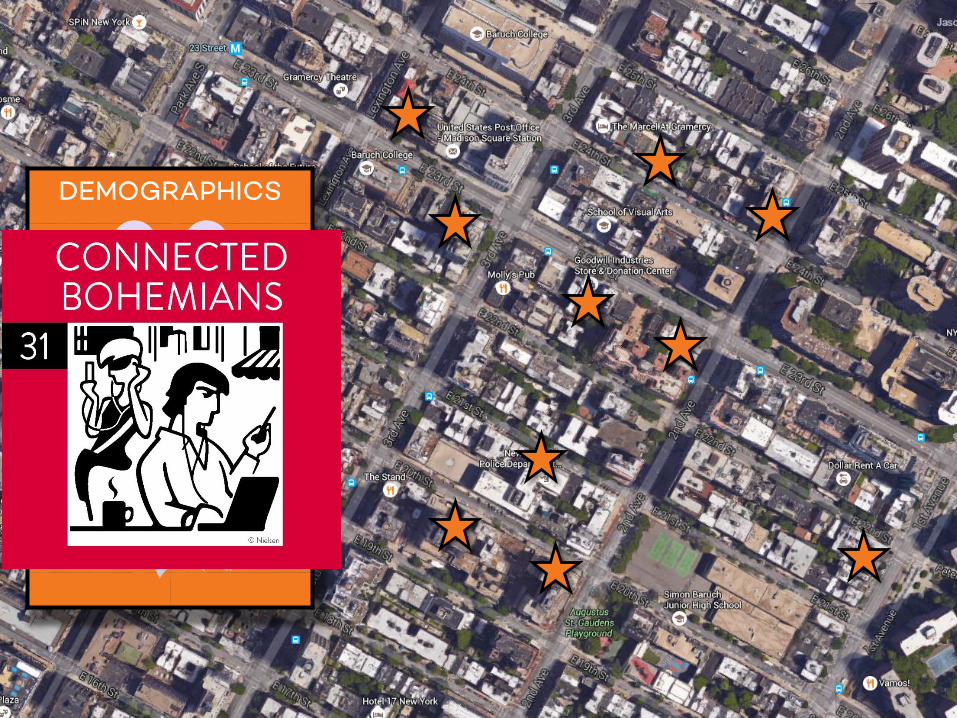
Millennials – Thriving Vs. Striving
60

61
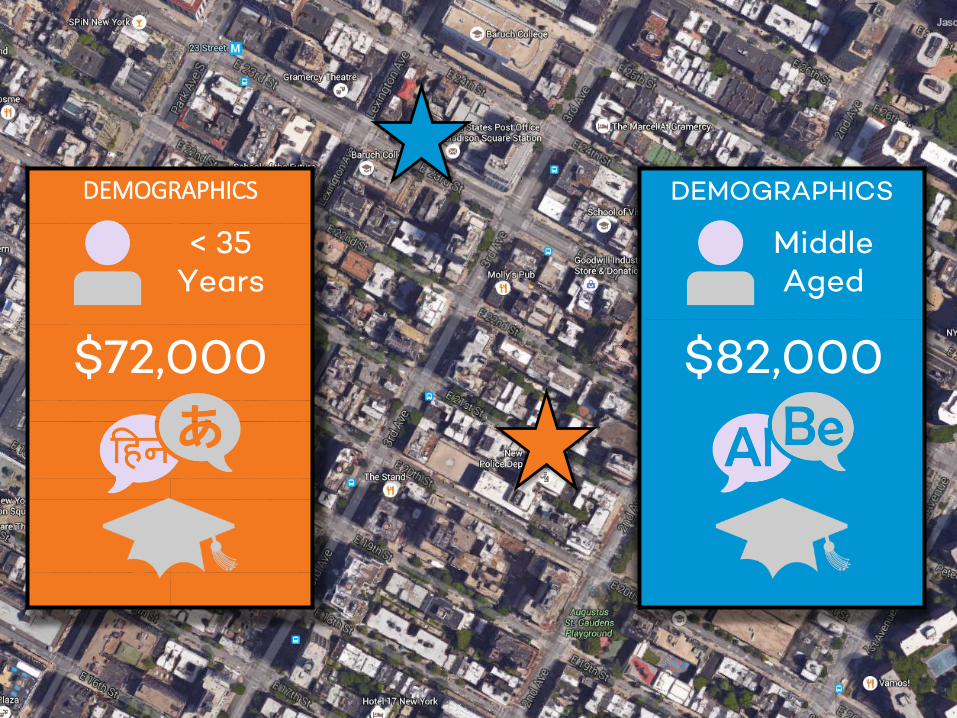
Birds of a Feather Flock Together
And That’s the Goosepel Truth
YEEEAAAAAAAHHH!!!!
62

63
64
DEMOGRAPHICS
$72,000
DEMOGRAPHICS
$82,000
< 35Years
Middle Aged
65
66
DEMOGRAPHICS
$175,000
DEMOGRAPHICS
$82,000
67
DEMOGRAPHICS
$175,000

Let’s Take a Closer Look
68
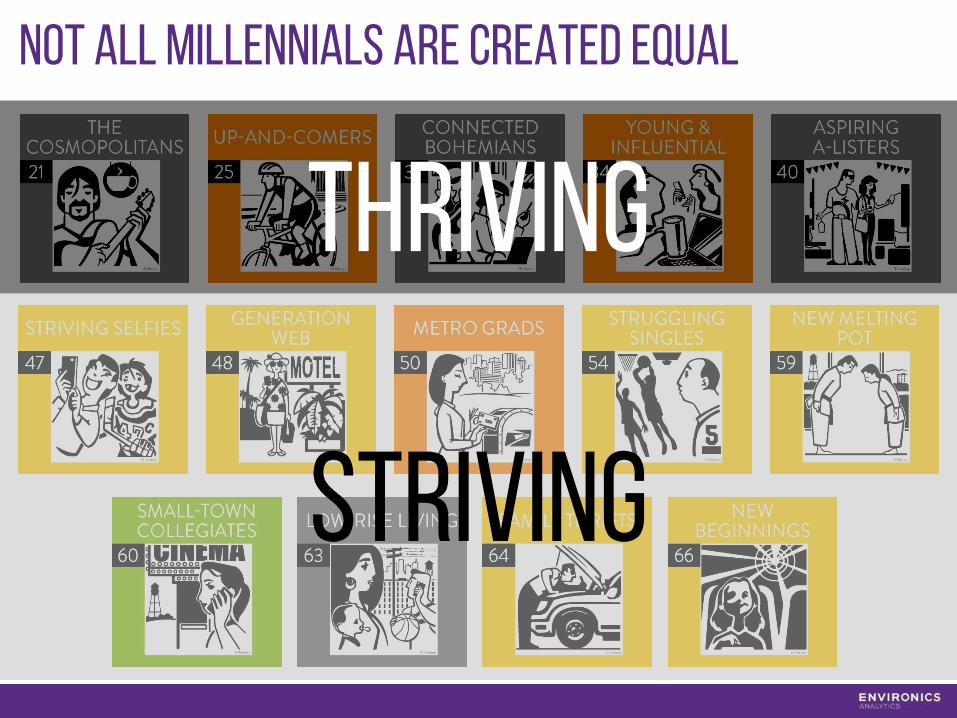
Not All Millennials Are Created Equal
THRIVING
STRIVING
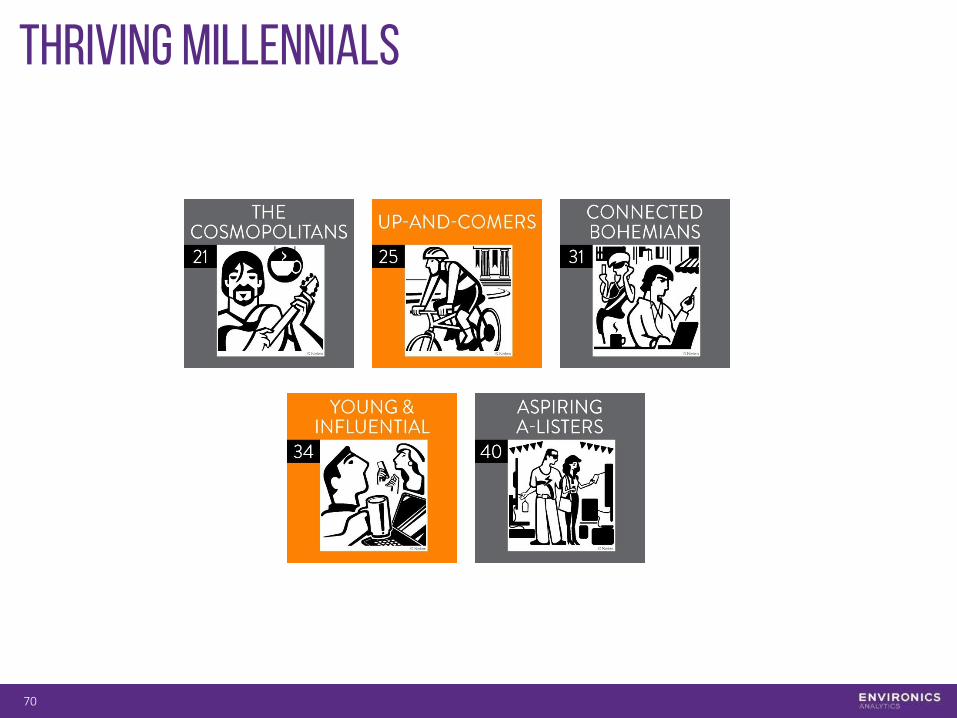
Thriving Millennials
70
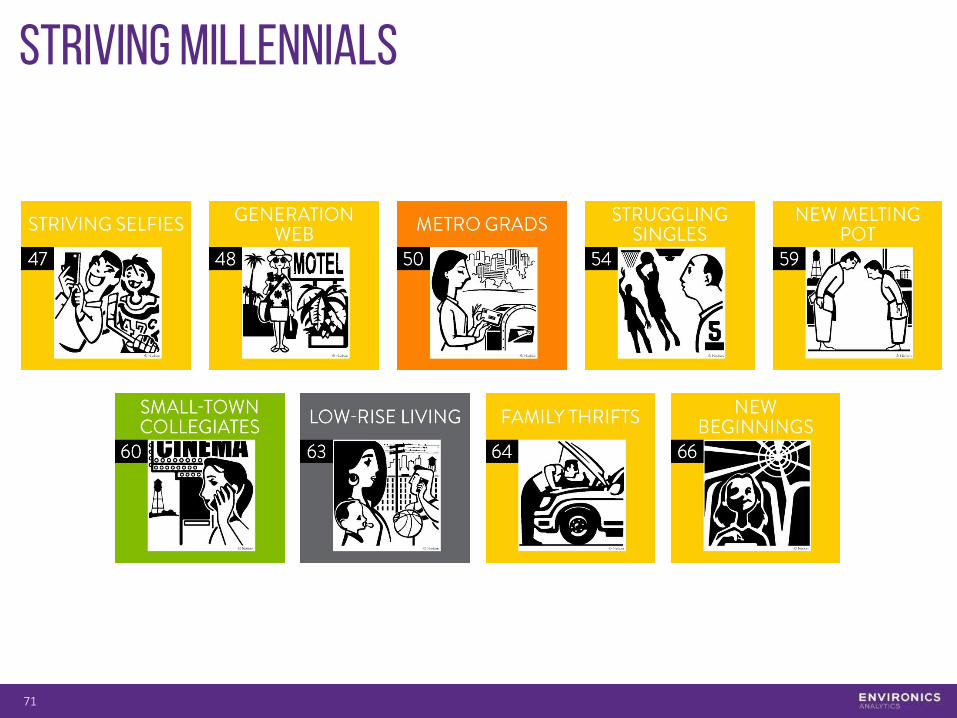
Striving Millennials
71
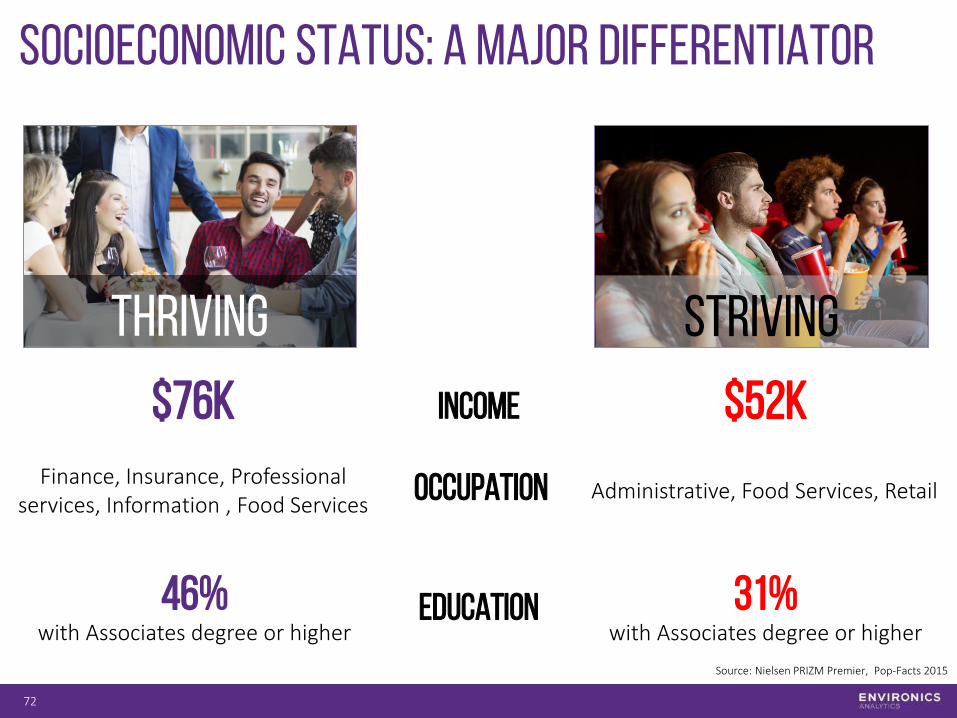
Socioeconomic status: A major differentiator
72
Income $52K
THRIVING STRIVING
Administrative, Food Services, Retail
31%with Associates degree or higher
46%with Associates degree or higher
Finance, Insurance, Professional services, Information , Food Services
$76K
Education
Occupation
Source: Nielsen PRIZM Premier, Pop-Facts 2015
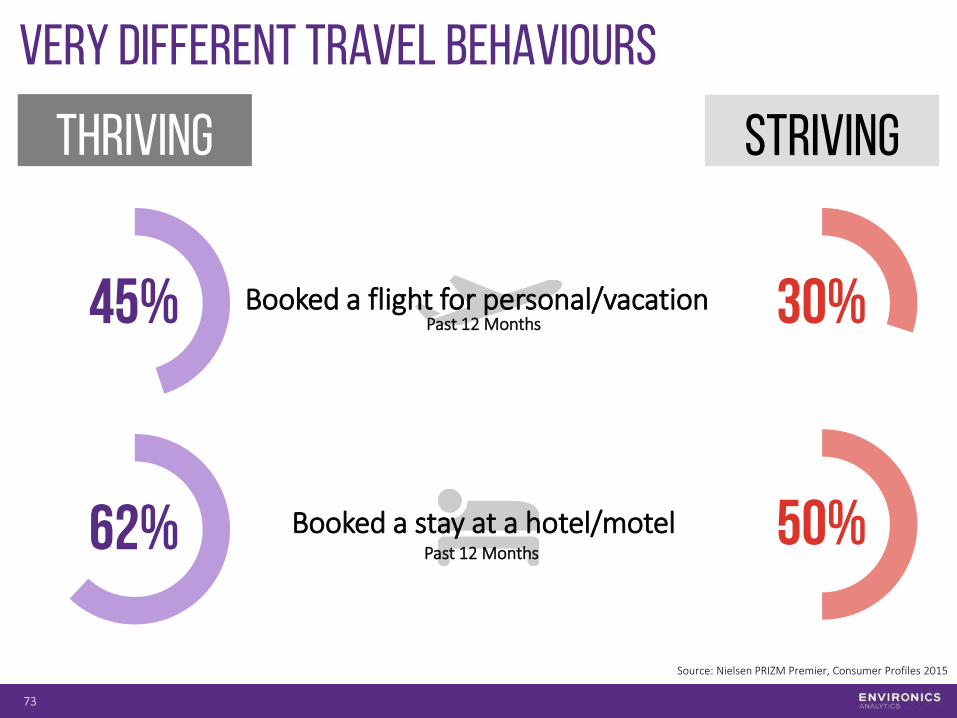
Very Different travel Behaviours
73
Booked a flight for personal/vacationPast 12 Months
Booked a stay at a hotel/motelPast 12 Months
62%
THRIVING STRIVING
45%
50%
30%
Source: Nielsen PRIZM Premier, Consumer Profiles 2015
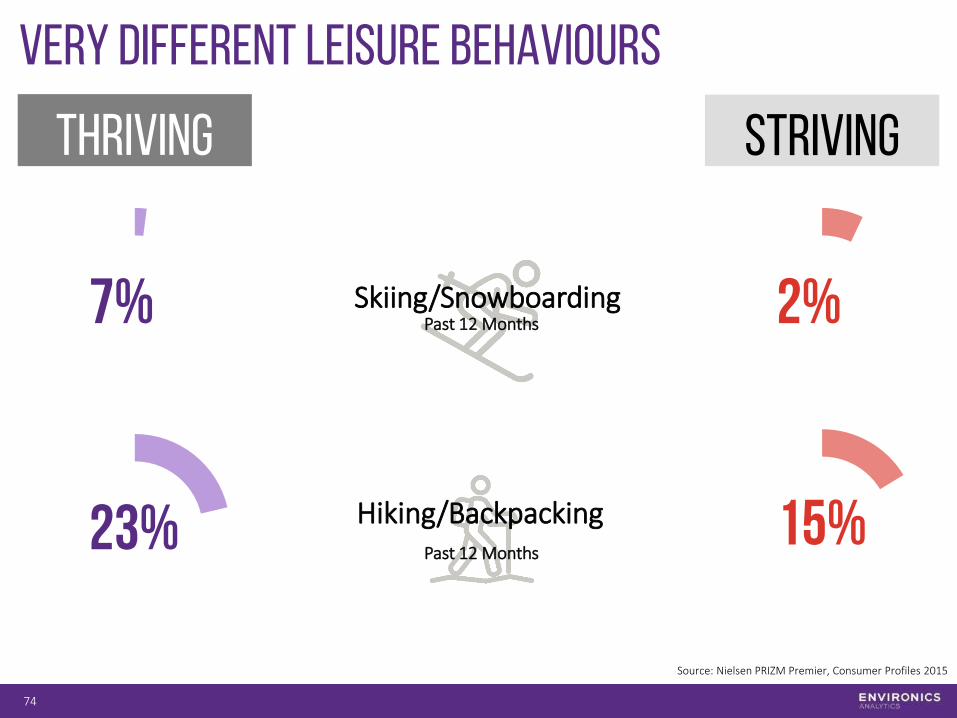
Very Different Leisure Behaviours
74
Skiing/SnowboardingPast 12 Months
Hiking/BackpackingPast 12 Months
23%
THRIVING STRIVING
7%
15%
2%
Source: Nielsen PRIZM Premier, Consumer Profiles 2015
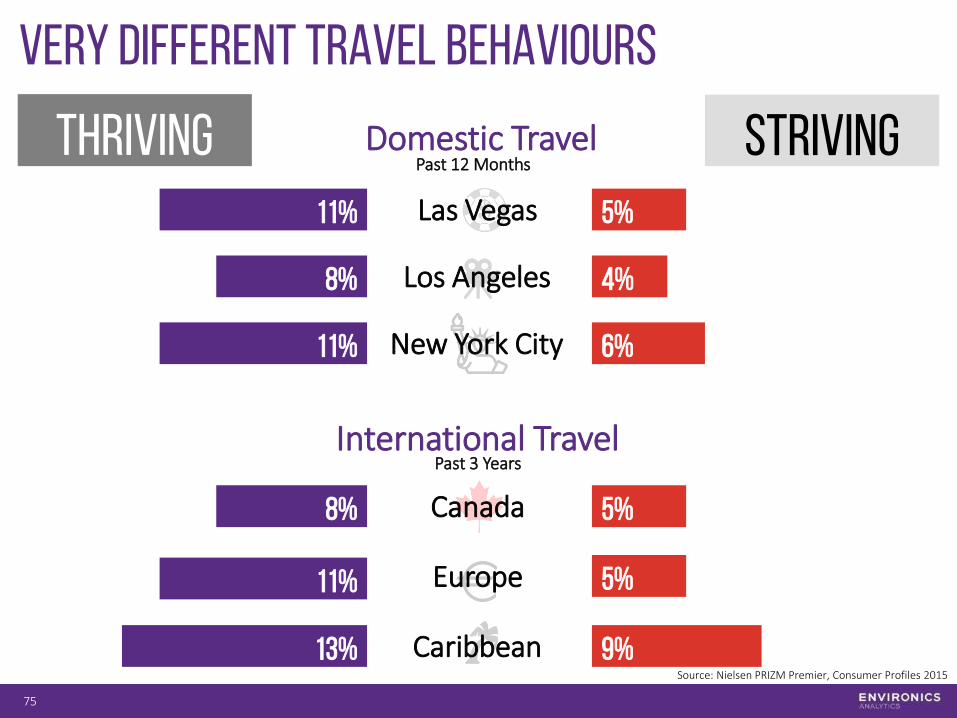
Very Different travel Behaviours
75
Domestic TravelPast 12 Months
Los Angeles
New York City
Las Vegas 5%
4%
6%
11%
8%
11%
International TravelPast 3 Years
Canada
Europe
Caribbean
5%
5%
9%
8%
11%
13%
THRIVING STRIVING
Source: Nielsen PRIZM Premier, Consumer Profiles 2015
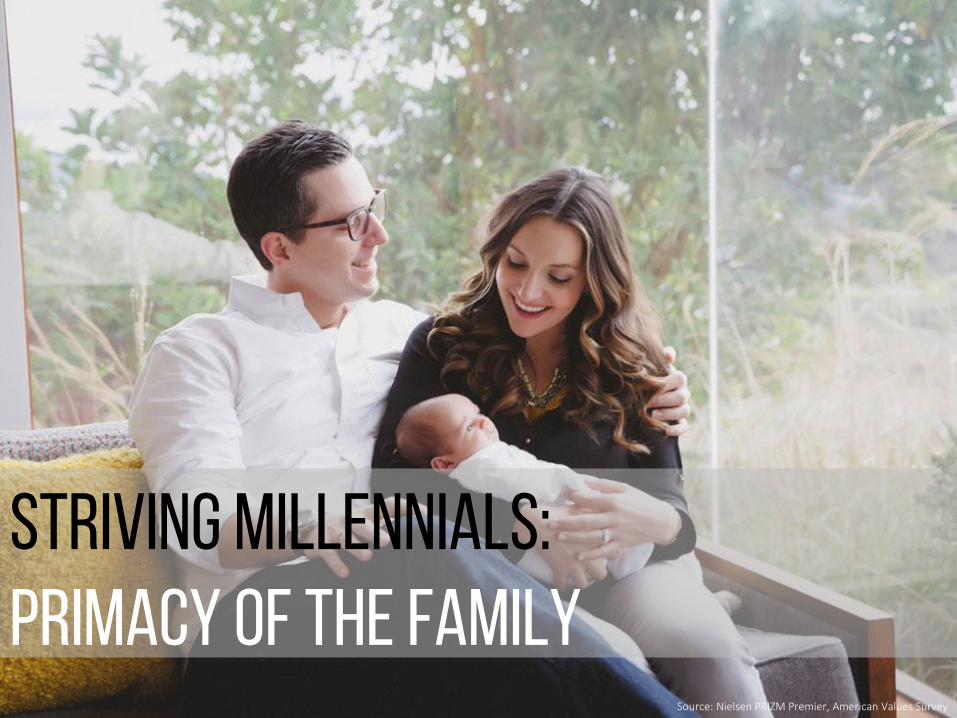
STRIVING Millennials:PRIMACY OF THE FAMILY
Source: Nielsen PRIZM Premier, American Values Survey
77
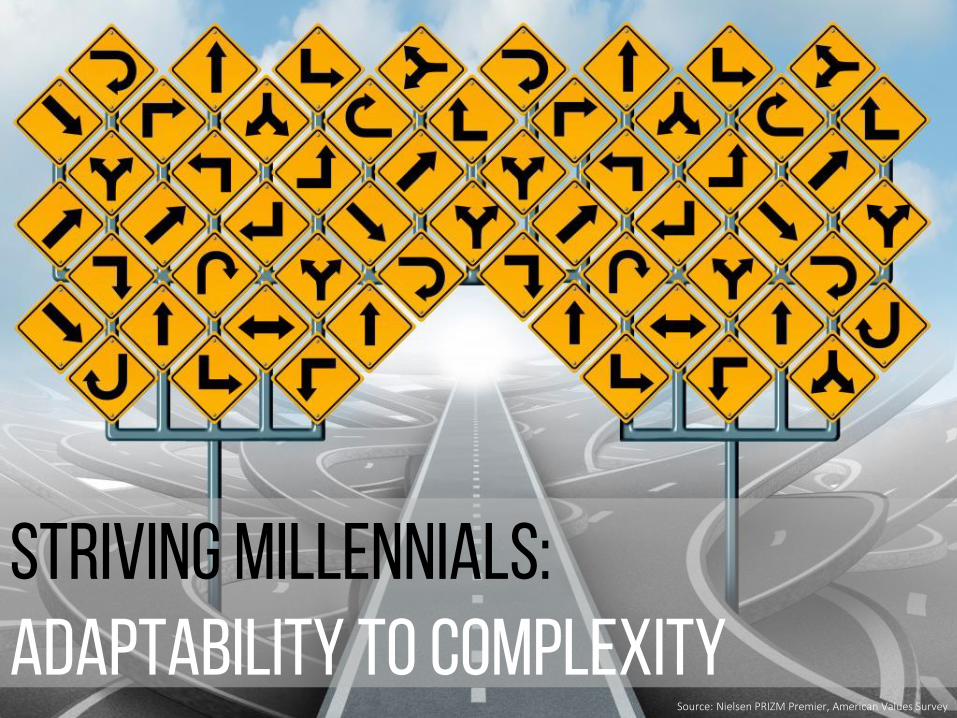
STriving Millennials:Adaptability to Complexity
Source: Nielsen PRIZM Premier, American Values Survey
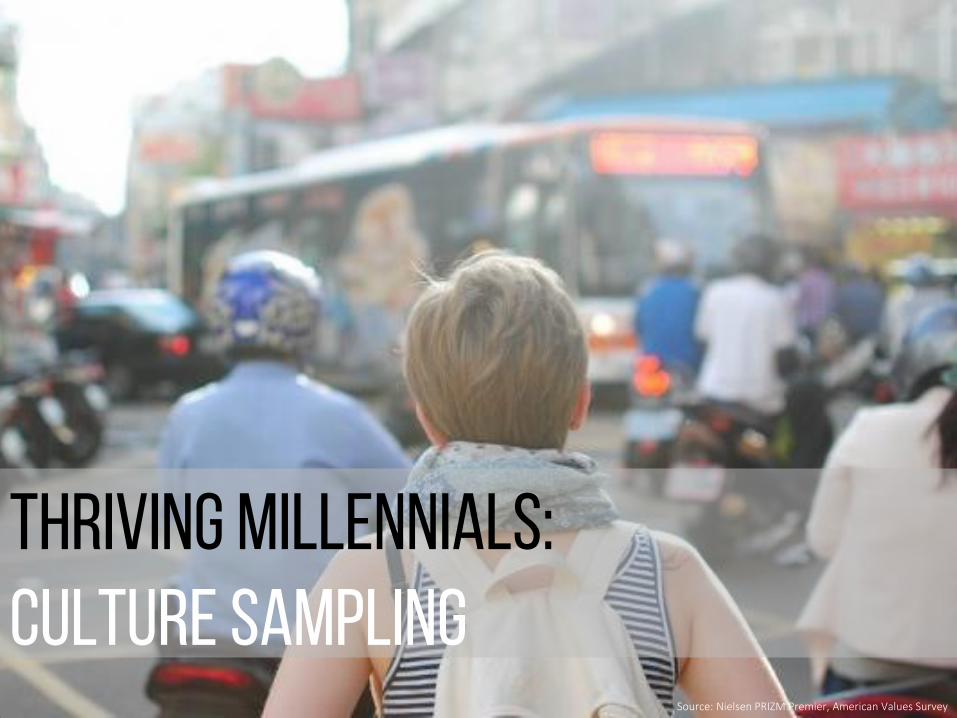
THRIVING Millennials:CULTURE SAMPLING
Source: Nielsen PRIZM Premier, American Values Survey

THRIVING Millennials:Effort Towards Health
Source: Nielsen PRIZM Premier, American Values Survey
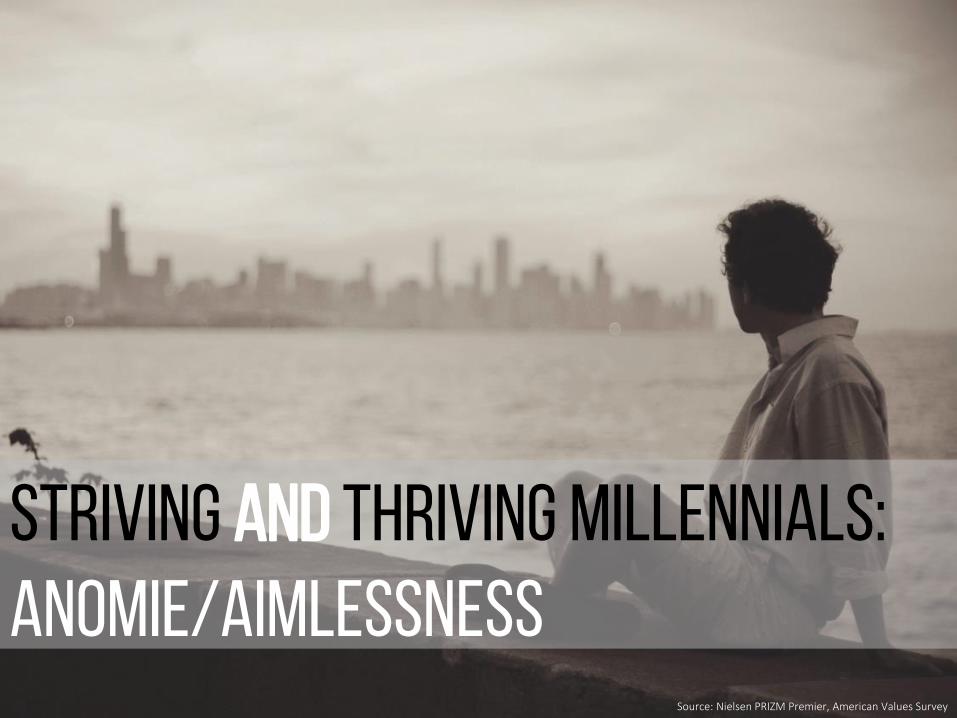
Both millenial groups feel A void in their lives
80
STRIVING AND THRIVING Millennials:Anomie/Aimlessness
Source: Nielsen PRIZM Premier, American Values Survey
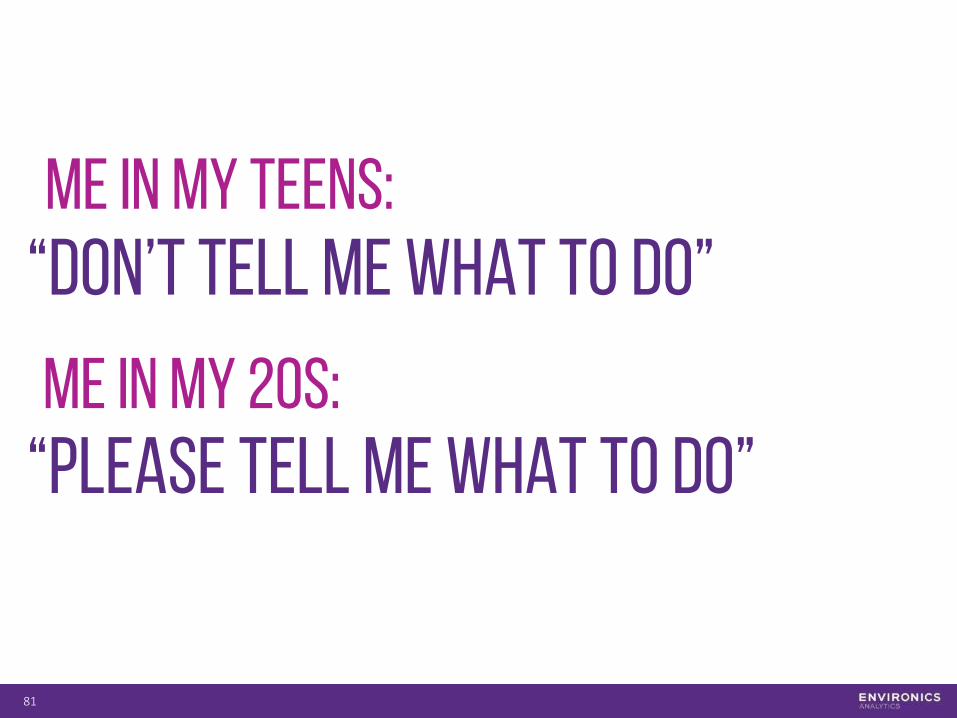
Me in My Teens:
81
“Don’t Tell Me What To Do”
“Please Tell Me What To Do”Me in My 20s:
So, IN SUMMARY• Both the US and Canada are changing – more
diversity, urbanization, different families
• Millennials are growing up in a world that is different than we’ve ever seen before
• We’re not all the same!!!
82