Embed Size (px)
Citation preview

West Downtown ActivationStrategy Presentation
April, 2017

The National Resource Network; HR&A Advisors, Inc. NRN Dearborn Final Presentation | March 16, 2017 | 1
Agenda
• Project Purpose
• Lessons From Case Studies of Peer Cities
• The Need for Greater Density in West Downtown
• Market Assessment: Potential for new Multifamily Product
• Urban Design Framework: Connections to Activity Centers
• West Downtown Key Site Analysis
• Recommendations

The National Resource Network; HR&A Advisors, Inc. NRN Dearborn Final Presentation | March 16, 2017 | 2
The National Resource Network
• The National Resource Network is a key component of the White House’s Strong Cities Strong Communities (SC2) Initiative. Launched in 2011, the SC2 Initiative facilitates partnerships between the federal government and local communities that have faced long-term economic challenges.
• HR&A Advisors, Inc. (HR&A), a core member of the Network and a national real estate advisory and economic development consulting firm with offices in New York, Washington, D.C, Los Angeles, Dallas, and Raleigh.
• SmithGroupJJR is an integrated architecture, engineering, and planning firm with 10 locations in the U.S. and China, including Ann Arbor, and 1000-employees.

The National Resource Network; HR&A Advisors, Inc. NRN Dearborn Final Presentation | March 16, 2017 | 3
PURPOSE OF NRN ENGAGEMENT
Assist the City of Dearborn activate West Downtown into a vibrantregional destination
• Strengthening the urban framework through enhanced walkability andconnectivity to surrounding anchors and activity centers.
• Leveraging City owned property to attract new development to the WestDowntown area, with a focus on increasing residential density to drive retaildemand.
KEY SITE ANALYSIS
- Strategies to support
new development
CASE STUDY
ANALYSIS
- Lessons from
successful peers
MARKET
ASSESSMENT
- Potential for new
development
URBAN DESIGN
FRAMEWORK
- Attractive
environment

Lessons From Case Studies of Peer Cities
Challenge: Need for Greater Density
Market Assessment: Potential for Multifamily
Urban Design Framework: Connections to Activity Centers
West Downtown Key Site Analysis
Recommendations

The National Resource Network; HR&A Advisors, Inc. NRN Dearborn Final Presentation | March 16, 2017 | 5
Comparable cities that transformed small downtowns adjacent to universities demonstrate key lessons for attracting new development
Normal, IL
• Place-making investments such as streetscapes can
generate demand to support new construction as well-designed public spaces can change the perception of aneighborhood and the level of pedestrian activity.
• Public surface parking lots are attractive targets for
redevelopment.
• Cities often need to create incentives for development in
markets that have not experienced growth in many
years in order to demonstrate the strength of the marketand catalyze additional development.
Key Lessons
Chapel Hill, NC

The National Resource Network; HR&A Advisors, Inc. NRN Dearborn Final Presentation | March 16, 2017 | 6
Initial planning followed by a public-private development of a public parking lot has spurred creation of 550 new units in Chapel Hill
Redevelopment of public parkingDevelopment on private landRemaining public parkingNew open space
Rosemary Village, 2003 140 West Franklin, 2013 Shortbread Lofts, 2014 The Graduate, 2016
Carolina Square, 2017
Amity Station, (in planning)
2000 City adopts Downtown Small Area Plan
2010 City updates Downtown Chapel Hill Small Area Plan
2013 140 West Franklin completed
2014 Shortbread Lofts completed

The National Resource Network; HR&A Advisors, Inc. NRN Dearborn Final Presentation | March 16, 2017 | 7
Substantial public involvement and support for development has transformed Downtown Normal with 175 new residential units
2000 City adopts Downtown Redevelopment Master Plan
Heartland Bank, 2006 Marriot Hotel &
Conference Center, 2009Children’s Discovery Museum, 2005
College Place Uptown, 2010
One Uptown Circle, Phase I, 2015
Uptown North, 2013
Uptown Station, 2012
2003 Downtown TIF district established
2005 Children’s Museum
2009 Marriott Hotel & Conference Center
2015 One Uptown Circle
Redevelopment of public parkingDevelopment on private landRemaining public parkingNew open space

Lessons From Case Studies of Peer Cities
Challenge: Need for Greater Density
Market Assessment: Potential for Multifamily
Urban Design Framework: Connections to Activity Centers
West Downtown Key Site Analysis
Recommendations

The National Resource Network; HR&A Advisors, Inc. NRN Dearborn Final Presentation | March 16, 2017 | 9
Employment and population density in West Downtown trails comparable peer cities with active and attractive downtowns
0
10,000
20,000
30,000
40,000
50,000
60,000
WestDowntown
Dearborn WayneCounty
DowntownChapel Hill
UptownNormal
DowntownAnn Arbor
DowntownBirmingham
DowntownFerndale
Jobs
and
Res
iden
ts p
er S
q M
ile
Population and Employment Density, 2015
Employment
Population

The National Resource Network; HR&A Advisors, Inc. NRN Dearborn Final Presentation | March 16, 2017 | 10
The density of buildings in Ann Arbor and Birmingham is notably greater than in West Downtown, contributing to their more active downtowns
West Downtown
Ann Arbor
Ferndale
Birmingham

The National Resource Network; HR&A Advisors, Inc. NRN Dearborn Final Presentation | March 16, 2017 | 11
In contrast to Birmingham, much of the land in West Downtown is devoted to surface parking for vehicles
Surface parking
Parking Structure
West Downtown Birmingham

Lessons From Case Studies of Peer Cities
Challenge: Need for Greater Density
Market Assessment: Potential for Multifamily
Urban Design Framework: Connections to Activity Centers
West Downtown Key Site Analysis
Recommendations

The National Resource Network; HR&A Advisors, Inc. NRN Dearborn Final Presentation | March 16, 2017 | 13
Despite challenging regional macroeconomic conditions, the population of West Downtown and of Dearborn is stable
-0.6% -0.1%
-5.9%
-15.0%
-18%
-16%
-14%
-12%
-10%
-8%
-6%
-4%
-2%
0%
West Downtown Dearborn Wayne County, excludingDetroit
Wayne County
Percent Change, Population 2000-2015

The National Resource Network; HR&A Advisors, Inc. NRN Dearborn Final Presentation | March 16, 2017 | 14
West Downtown has a limited supply of multifamily product
624 S Brady St
Units: 80 units
Studios: 80
Rent: $1.04 PSF
21800 Morley Ave
Units: 200 units
Built: 1974
Senior housing
851 Oakwood Blvd
Units: 30 units
Built: 1928
Rent: $1.50 PSF
22230 Michigan Ave
Units: 24 units
Built: 2006
Rent: $1.20 – $1.40 PSF
Source: CoStar
West Village condominiums
Units: 76 units
Built: 1997
Condominium
The National Resource Network; HR&A Advisors, Inc. NRN Dearborn Final Presentation | March 16, 2017 | 15
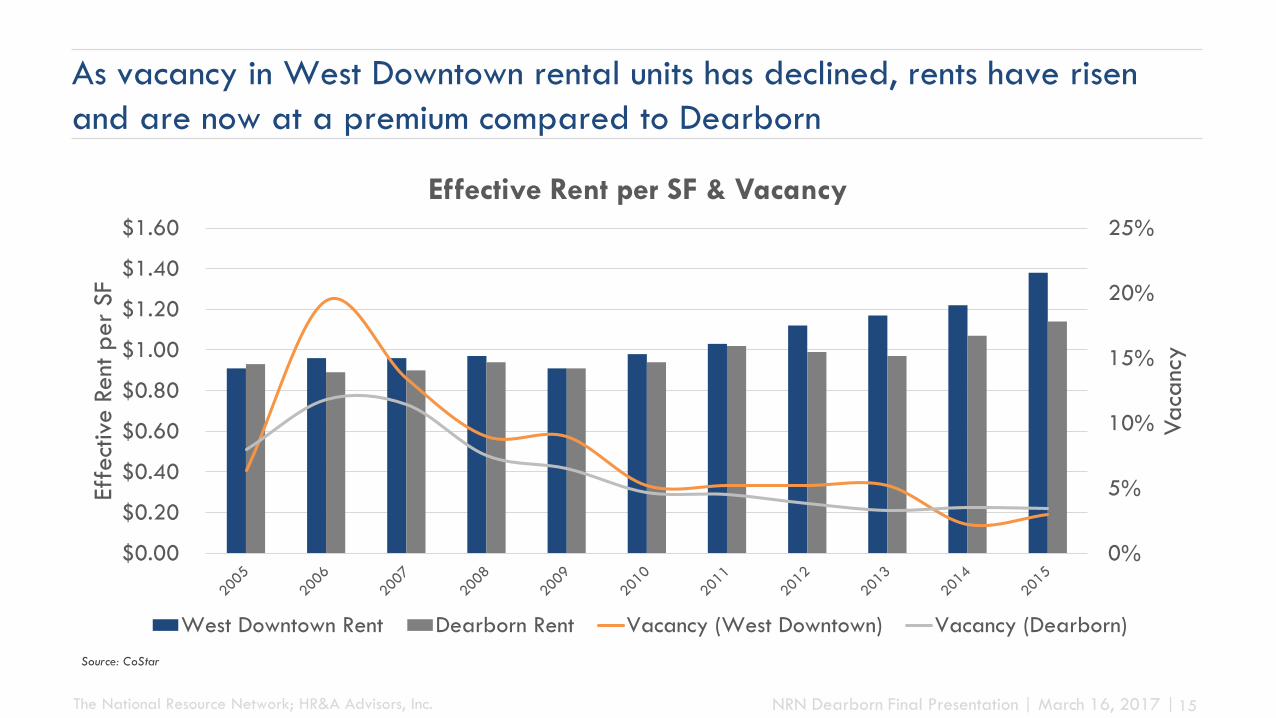
As vacancy in West Downtown rental units has declined, rents have risen and are now at a premium compared to Dearborn
0%
5%
10%
15%
20%
25%
$0.00
$0.20
$0.40
$0.60
$0.80
$1.00
$1.20
$1.40
$1.60
Va
canc
y
Effe
ctiv
e R
ent
per
SF
Effective Rent per SF & Vacancy
West Downtown Rent Dearborn Rent Vacancy (West Downtown) Vacancy (Dearborn)
Source: CoStar

The National Resource Network; HR&A Advisors, Inc. NRN Dearborn Final Presentation | March 16, 2017 | 16
Despite indicators of unmet demand, the lack of new units since 2006 may require a pilot “test” project in West Downtown to demonstrate profitability
0%
5%
10%
15%
20%
25%
30%
35%
-5
0
5
10
15
20
25
30
2005 2006 2007 2008 2009 2010 2011 2012 2013 2014 2015
Va
canc
y
Uni
ts
West Downtown Multifamily Deliveries, Absorption & Vacancy
Delivered Units Net Absorption VacancySource: CoStar

The National Resource Network; HR&A Advisors, Inc. NRN Dearborn Final Presentation | March 16, 2017 | 17
Developers are skeptical of the need for more office in West Downtown due to the high vacancy levels
Source: CoStar
% Vacant
36%
72%
39%
28% 25%
West Downtown Dearborn
Office Inventory by Class, 2015
Class A Class B Class C
28%
7% 3%
10%
1%
The National Resource Network; HR&A Advisors, Inc. NRN Dearborn Final Presentation | March 16, 2017 | 18
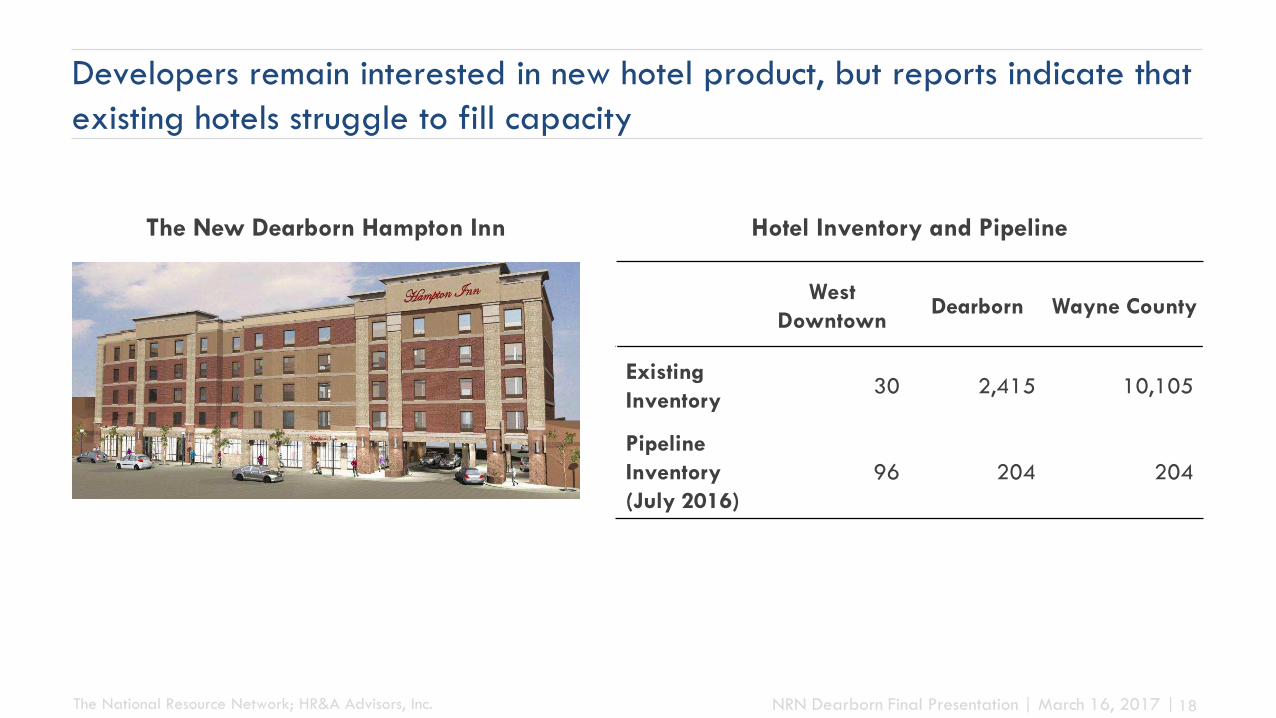
Developers remain interested in new hotel product, but reports indicate that existing hotels struggle to fill capacity
The New Dearborn Hampton Inn
West
DowntownDearborn Wayne County
Existing
Inventory30 2,415 10,105
Pipeline
Inventory
(July 2016)
96 204 204
Hotel Inventory and Pipeline

Lessons From Case Studies of Peer Cities
Challenge: Need for Greater Density
Market Assessment: Potential for Multifamily
Urban Design Framework: Connections to Activity Centers
West Downtown Key Site Analysis
Recommendations
The National Resource Network; HR&A Advisors, Inc. NRN Dearborn Final Presentation | March 16, 2017 | 20
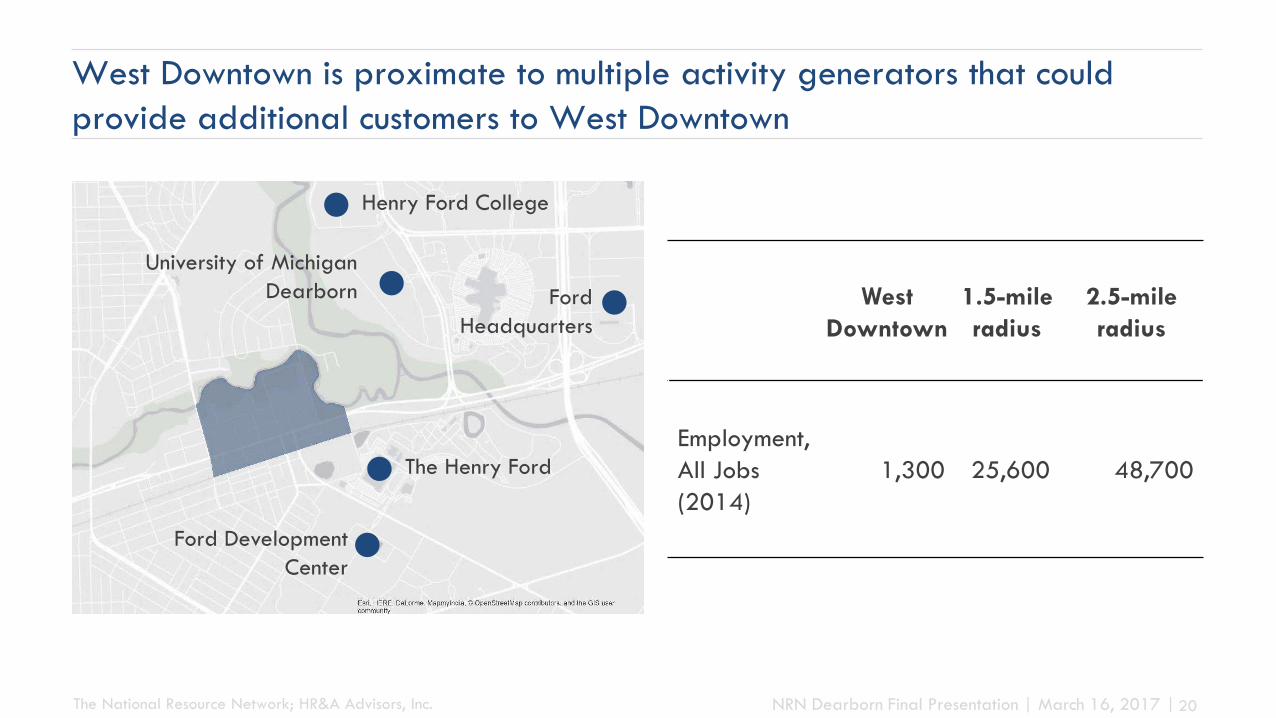
West Downtown is proximate to multiple activity generators that could provide additional customers to West Downtown
Henry Ford College
University of Michigan Dearborn
The Henry Ford
Ford Development Center
Ford Headquarters
West
Downtown
1.5-mile
radius
2.5-mile
radius
Employment, All Jobs (2014)
1,300 25,600 48,700

The National Resource Network; HR&A Advisors, Inc. NRN Dearborn Final Presentation | March 16, 2017 | 21
The road and rail network are focused on getting people through West Downtown rather than getting them into downtown
Large roadways are a barrier to non-motorized
transportation
High traffic volumes & speeds on Michigan
Avenue

The National Resource Network; HR&A Advisors, Inc. NRN Dearborn Final Presentation | March 16, 2017 | 22
Additionally, poor non-motorized connections and physical barriers limit the access of potential customers to West Downtown
Physical barriers surround West Downtown Planned bicycle routes are incomplete

The National Resource Network; HR&A Advisors, Inc. NRN Dearborn Final Presentation | March 16, 2017 | 23
Within West Downtown, streetscapes are not inviting for pedestrians, hindering the appeal as a regional destination
Multiple businesses have closed their front doors to Michigan Avenue
Vehicular oriented commercial development along segments of Michigan Avenue deter pedestrian foot-traffic
Poor pedestrian connection at Oakwood underpass
Narrow sidewalk and limited pedestrian amenities adjacent to high speed traffic

The National Resource Network; HR&A Advisors, Inc. NRN Dearborn Final Presentation | March 16, 2017 | 24
However, West Downtown contains attractive assets to build on, notably its intact building stock and walkable urban grid
West Downtown Assets Map
Business Office District
Community Business District
General Business District
Tech and Research
Single-family Residential
multifamily Residential
Flood Plain
Michigan Avenue
Existing Open Space
Existing Pedestrian Connection
Pedestrian Connection Opportunity
Parking Structure
Surface Parking Lot
Assets
▪ Consistent building stock with few gaps
▪ Ample public parking
▪ Unique and historic buildings, such as the Wagner hotel
▪ Gridded streets, creating numerous connection points around downtown and a walkable form

The National Resource Network; HR&A Advisors, Inc. NRN Dearborn Final Presentation | March 16, 2017 | 25
Near-term recommendations to improve the West Downtown urban design
1) Evaluate the opportunity for a shared circulator shuttle
3) Develop vehicular scaledsignage to mark the entry to West Downtown as a destination
2) Continue to create pedestrian and bike connections between West Downtown and surrounding open spaces
4) Create a form-based code, and policies prioritizing mixed-use
5) Use street repaving efforts as an opportunity to add pedestrian and traffic-calming features

The National Resource Network; HR&A Advisors, Inc. NRN Dearborn Final Presentation | March 16, 2017 | 26
Shared Circulator Recommendation: Work with Dearborn’s institutions to explore the potential for a shared circulator connected to the downtowns
Shuttle Route
Shuttle Stop
Legend
Source: Media.ford.com
Future Potential: Ford Go Ride
• Experimental pilot dynamic shuttle service. Currently only available to Ford employees; not open to the public.
• Work with Ford to explore commercially piloting the
Go Ride in Dearborn to connect with West Downtown
The National Resource Network; HR&A Advisors, Inc. NRN Dearborn Final Presentation | March 16, 2017 | 27
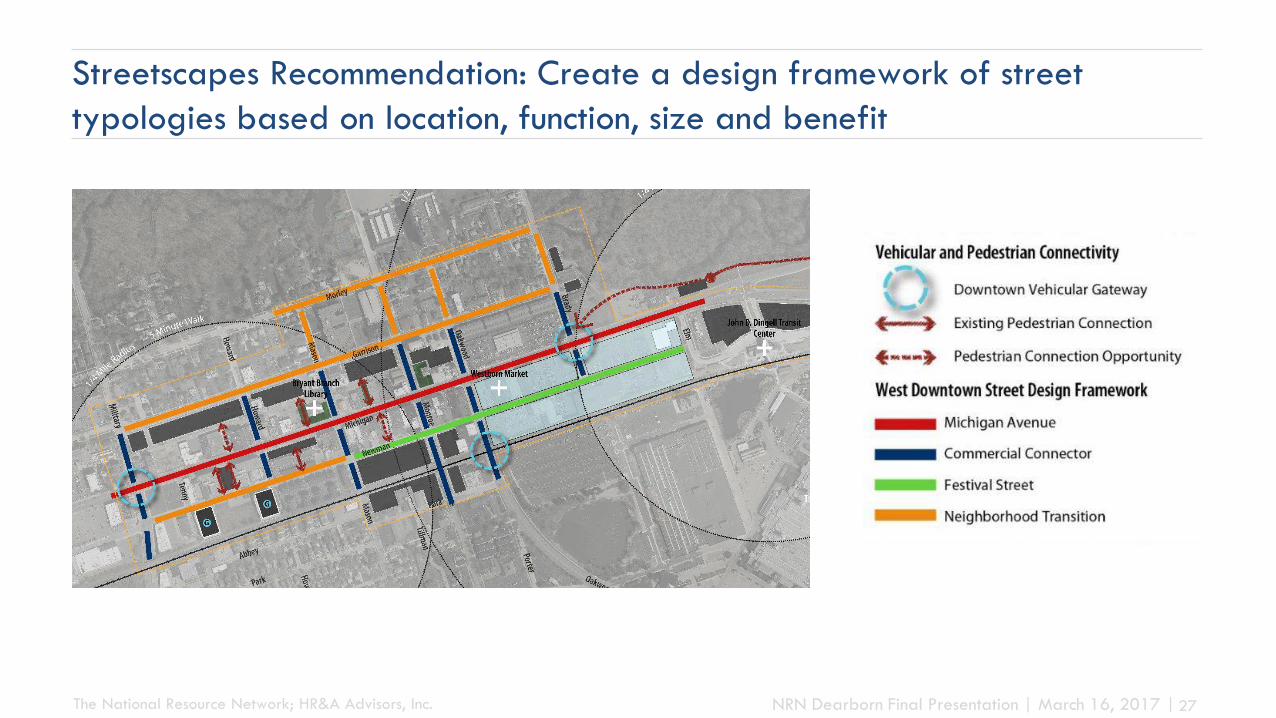
Streetscapes Recommendation: Create a design framework of street typologies based on location, function, size and benefit

The National Resource Network; HR&A Advisors, Inc. NRN Dearborn Final Presentation | March 16, 2017 | 28
Streetscapes Recommendation: Create a design framework of street typologies based on location, function, size and benefit
Michigan Avenue Commercial Connector Neighborhood Transition
Festival Street – Normal Operation Festival Street – Event Operation

Lessons From Case Studies of Peer Cities
Challenge: Need for Greater Density
Market Assessment: Potential for Multifamily
Urban Design Framework: Connections to Activity Centers
West Downtown Key Site Analysis
Recommendations

The National Resource Network; HR&A Advisors, Inc. NRN Dearborn Final Presentation | March 16, 2017 | 30
To demonstrate the potential for new development the NRN evaluated four key sites in West Downtown
200 meters
4
1
2
3
Site # Approximate
Size
Current Use Proposed Use
Site 1 1.2 acres Vacant Lot EntertainmentVenue, multifamily Housing
Site 2 1.1 acres Open Lawn Student Housing &Retail
Site 3 2.2 acres Free Public Parking
multifamily Housing
Site 4 0.85 acres Free Public Parking
multifamilyHousing
The National Resource Network; HR&A Advisors, Inc. NRN Dearborn Final Presentation | March 16, 2017 | 31
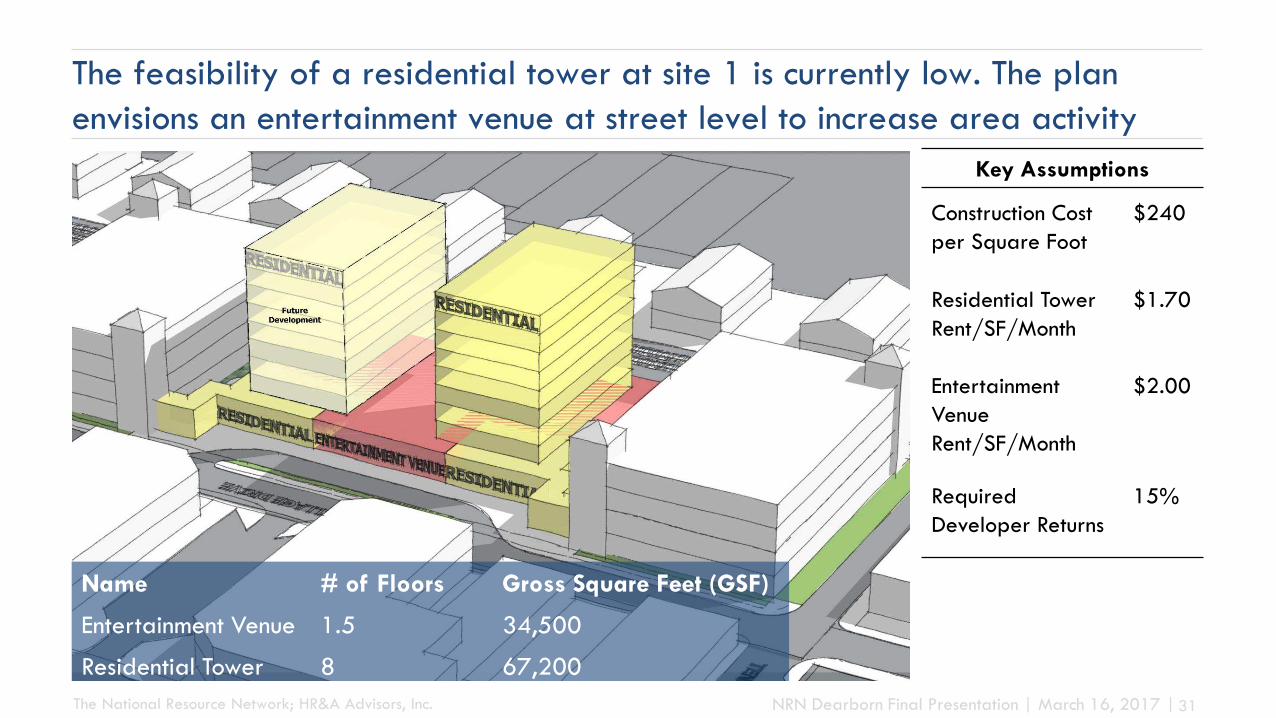
The feasibility of a residential tower at site 1 is currently low. The plan envisions an entertainment venue at street level to increase area activity
Name # of Floors Gross Square Feet (GSF)
Entertainment Venue 1.5 34,500
Residential Tower 8 67,200
Key Assumptions
Construction Cost per Square Foot
$240
Residential Tower Rent/SF/Month
$1.70
Entertainment Venue Rent/SF/Month
$2.00
Required Developer Returns
15%

The National Resource Network; HR&A Advisors, Inc. NRN Dearborn Final Presentation | March 16, 2017 | 32
After abating taxes and providing a loan, rents would need to increase to $2.52 per GSF per month to make the entertainment venue feasible
$8.3 million($240 /GSF)
Development
cost
Supportable cost
at market rents
$4.9 million($141 /GSF)
Gap$3.4 million($99 /GSF)
Community Revitalization Loan
$0.5 million($16 /GSF)
Remaining
Gap
$1.9 million
($56 /GSF)
20-year Municipal Tax Abatement
$1.0 million($28 /GSF)
Incentives to close the
financial gap

The National Resource Network; HR&A Advisors, Inc. NRN Dearborn Final Presentation | March 16, 2017 | 33
Site 2 includes a residential development aimed at University of Michigan –Dearborn students at the gateway to West Downtown
Name # of Floors Gross Square Feet (GSF)
Retail Space 1 3,000
Residential 4 60,800
Key Assumptions
Construction Cost per Square Foot
$180
Rent/SF/Month $1.70
Parking 75 spaces
Required DeveloperReturns
15%

The National Resource Network; HR&A Advisors, Inc. NRN Dearborn Final Presentation | March 16, 2017 | 34
$11.5 million($204 /GSF)
$4.3 million($68 /GSF)
Gap$7.2 million
($112 /GSF)
Rents would need to increase to $2.35 per SF per month to make the development on Site 2 viable after various incentives
Development
cost
Supportable cost
at market rents
Incentives to close the
financial gap
Community Revitalization Loan
$1.0 million($16 /GSF)
Parking Offset Program
$1.5 million($25 /GSF)
Remaining
Gap
$3.8 million
($60 /GSF)
TIF 5-year Tax Abatement$0.7 million($12 /GSF)

The National Resource Network; HR&A Advisors, Inc. NRN Dearborn Final Presentation | March 16, 2017 | 35
Site 3 involves a new multifamily building on the remaining lot adjacent to the Ford West Downtown development proposed parking structure
Name # of Floors Gross Square Feet (GSF)
Residential 4 96,000
Key Assumptions
Construction Cost per Square Foot
$180
Rent/SF/Month $1.70
Required Developer Returns
15%

The National Resource Network; HR&A Advisors, Inc. NRN Dearborn Final Presentation | March 16, 2017 | 36
$17.3 million($180 /GSF)
$9.2 million($96/GSF)
Gap$8.1 million($84 /GSF)
Rents would need to increase to $2.35 per SF per month to make the development on Parcel 3 viable after incentives
Development
cost
Supportable cost
at market rents
Incentives to close the
financial gap
Community Revitalization Loan
$1.4 million($14 /GSF) Remaining
Gap
$5.7 million
($59 /GSF)
TIF 5-year Tax Abatement$1.0 million($10/GSF)
The National Resource Network; HR&A Advisors, Inc. NRN Dearborn Final Presentation | March 16, 2017 | 37
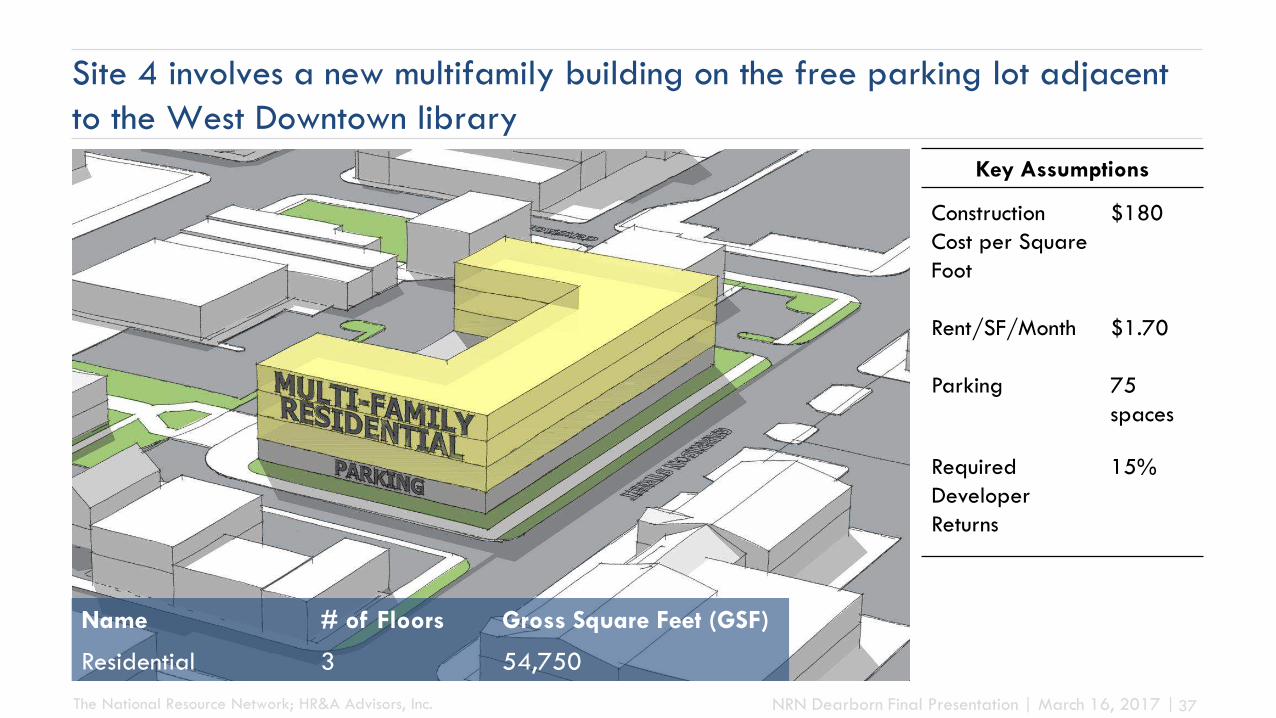
Site 4 involves a new multifamily building on the free parking lot adjacent to the West Downtown library
Key Assumptions
Construction Cost per Square Foot
$180
Rent/SF/Month $1.70
Parking 75 spaces
Required DeveloperReturns
15%
Name # of Floors Gross Square Feet (GSF)
Residential 3 54,750

The National Resource Network; HR&A Advisors, Inc. NRN Dearborn Final Presentation | March 16, 2017 | 38
$11.2 million($204 /GSF)
$5.0 million($91/GSF)
Gap$6.2 million
($113 /GSF)
Rents would need to increase to $1.85 per SF per month to make the development on Site 4 viable after incentives
Development
cost
Supportable cost
at market rents
Incentives to close the
financial gap
Community Revitalization Loan
$0.9 million($16 /GSF)
20-Year Municipal Tax Abatement$1.8 million($32 /GSF)
Remaining Gap
$2.3 million
($41 /GSF)
Parking Offset Program
$1.2 million($23 /GSF)

The National Resource Network; HR&A Advisors, Inc. NRN Dearborn Final Presentation | March 16, 2017 | 39
Taxes make up a high portion of potential development cash flow
Tax =
Assessed Value(replacement cost =
2/3 construction)*
2 1000
73.227X
Dearborn Real Estate Tax Structure Taxes As a Portion of Potential Revenues
Vacancy
Taxes
Sites 2,3,4
25% to
28%
10%
20%
42%
National
Average#
11%
56%
6%
27%
Operation Costs
* Per instruction from the City of Dearborn Assessor, building replacement value is assumed to be 66% of construction cost and not 100% of costs. # Source: National Apartment Association 2015 Survey
Realized Revenues

The National Resource Network; HR&A Advisors, Inc. NRN Dearborn Final Presentation | March 16, 2017 | 40
Dearborn’s tax levels exceed many comparable cities for an equivalent development project
Dearborn Detroit Ferndale Ann Arbor Birmingham
Chapel Hill,
NC Normal, IL
Tax Value BasisConstruction/ Replacement
Asset Sale Value
Construction/ Replacement
Construction/ Replacement
Construction/ Replacement
Asset Sale Value
Asset Sale Value
Millage/$1000 Value 73.227 87.1307 71.1414 48.2228 53.5169 16.104 84.209
Tax as a % of Gross
Potential Revenues 25% 38% 24% 17% 19% 19% 21%

Lessons From Case Studies of Peer Cities
Challenge: Need for Greater Density
Market Assessment: Potential for Multifamily
Urban Design Framework: Connections to Activity Centers
West Downtown Key Site Analysis
Recommendations

The National Resource Network; HR&A Advisors, Inc. NRN Dearborn Final Presentation | March 16, 2017 | 42
Recommendations
1Release a request-for-expressions-of-interest (RFEI) covering all underutilized City-
owned parking lots and properties in West Downtown to explore the market potential
and generate developer interest
2 Work with Dearborn’s institutions to explore implementation of a joint shuttle
3 Improve wayfinding and signage to better brand the West Downtown area

The National Resource Network; HR&A Advisors, Inc. NRN Dearborn Final Presentation | March 16, 2017 | 43
4Implement a form-based code as well as policies and zoning that prioritize mixed-use
in West Downtown
Recommendations
5Implement pedestrian and traffic calming measures like bumpouts and bike lanes
when repaving streets
6Examine potential redesign of the tax structure to reduce the burden on new
construction and improve the feasibility of new development

West Downtown ActivationStrategy Presentation
April, 2017