Embed Size (px)
Citation preview

West Oakland Air Pollution StudiesPresented by Environmental Defense Fund
Port of Oakland Maritime Air Quality Improvement PlanTask Force Meeting
May 9, 2018

Contents
• Introduction
• Study 1: 100x100 black carbon sensor network
• Study 2: Air pollution mapping with Google Street View cars
• Study 3: Air pollution and health analysis

INTRODUCTION

Air Pollution in West OaklandDiesel PM exposure 90th percentile (CalEnviroScreen)

stationary networks, satellite, modeling
How Is Air Pollution Measured?
Examples of modeled air pollution data
Marshall et. al., 2008, Atmos. Environ. 42, 1359-1369
Example of stationary monitoring site
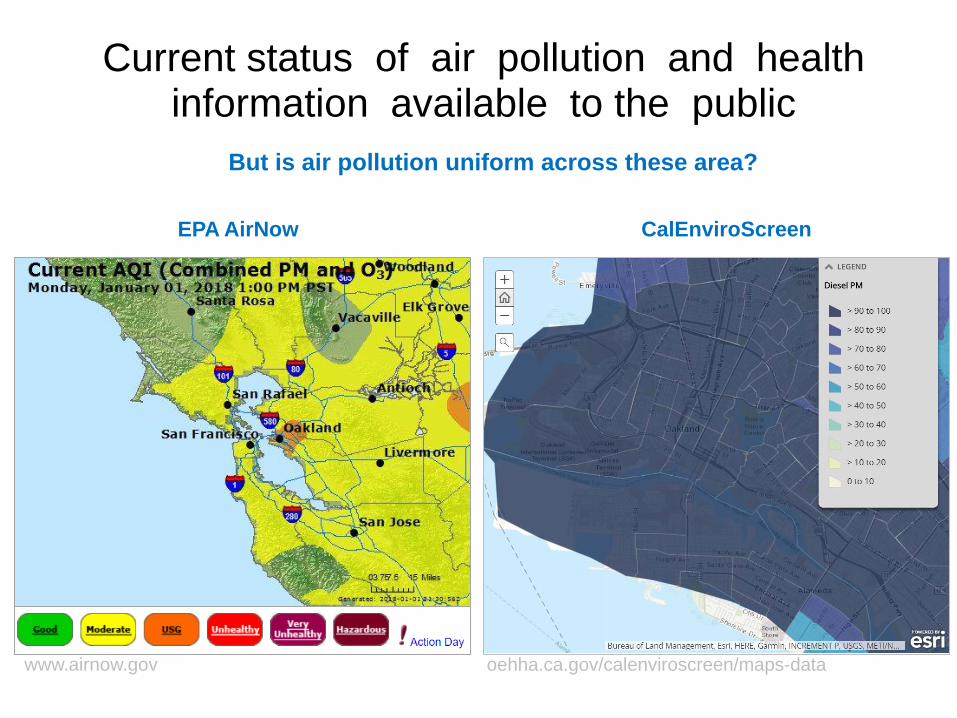
Current status of air pollution and health information available to the public
.
But is air pollution uniform across these area?
EPA AirNow CalEnviroScreen
oehha.ca.gov/calenviroscreen/maps-datawww.airnow.gov

STUDY 1
100X100 BLACK CARBON SENSOR NETWORK

UC Berkeley
Chelsea Preble
Julien Caubel
Troy Cados
Thomas Kirchstetter
100×100 Study:
A West Oakland Community
Air Quality Study

Study Team
UCB/LBNL
Thomas Kirchstetter
Julien Caubel
Troy Cados
Chelsea Preble
Carter Keeling
Shannon Chang
Annie Rosen
Jonathan Slack
Kelly Archer
BAAQMD, Steve Randall, Phil Martien
WOEIP
Margaret Gordon, Brian Beveridge
EDF
Ramon Alvarez, Millie Chu Baird
Fern Uennatornwaranggoon
Cassandra Ely, Maria Harris
UT Austin, Josh Apte
Port of Oakland
Tim Leong, Troy Hosmer

Black Carbon: Sources & Impacts
Trucks play a vital role in moving freight, but black
carbon (BC) soot emitted from diesel engines is of
concern
• Emitted close to people,
associated with adverse
health outcomes, including
cancer, cardiovascular and
respiratory disease
• Short-lived climate
pollutant, contributes to
global warming
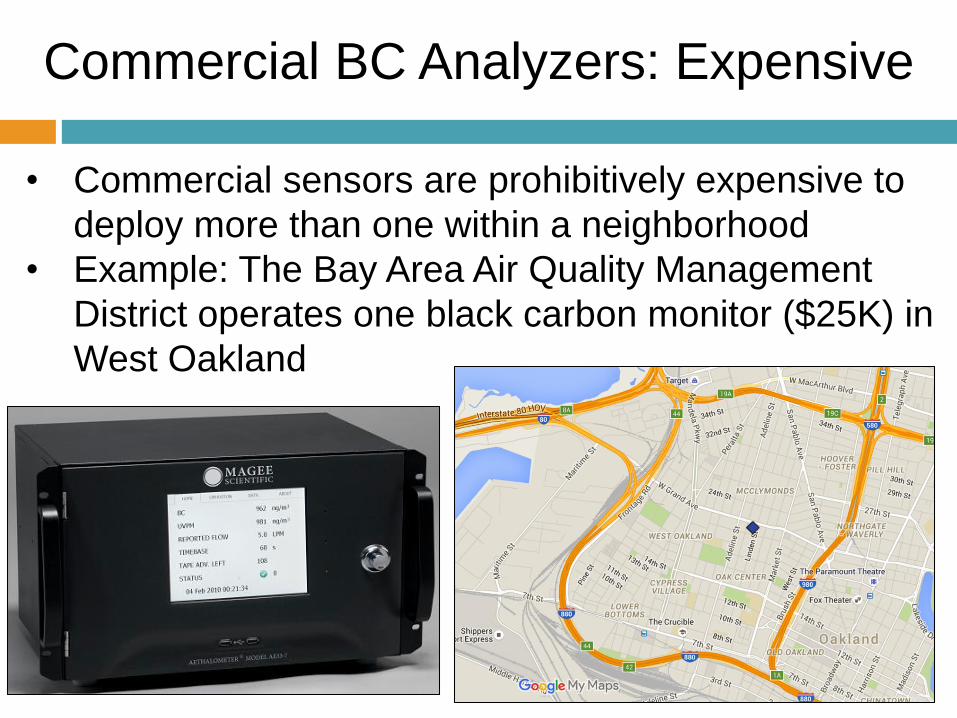
Commercial BC Analyzers: Expensive
• Commercial sensors are prohibitively expensive to
deploy more than one within a neighborhood
• Example: The Bay Area Air Quality Management
District operates one black carbon monitor ($25K) in
West Oakland

UCB/LBNL Low-Cost BC Sensor
We developed a low-cost
BC sensor with similar
measurement principle as
commercial instruments
12

UCB Low-Cost BC SensorCaubel, Cados, Kirchstetter (2018) A New Black Carbon Sensor for Dense
Air Quality Monitoring Networks, Sensors
30
Solar panel
(DC plug optional)
Zip-tie mounting
Inlet
(with rain cover)
Weather-proof box
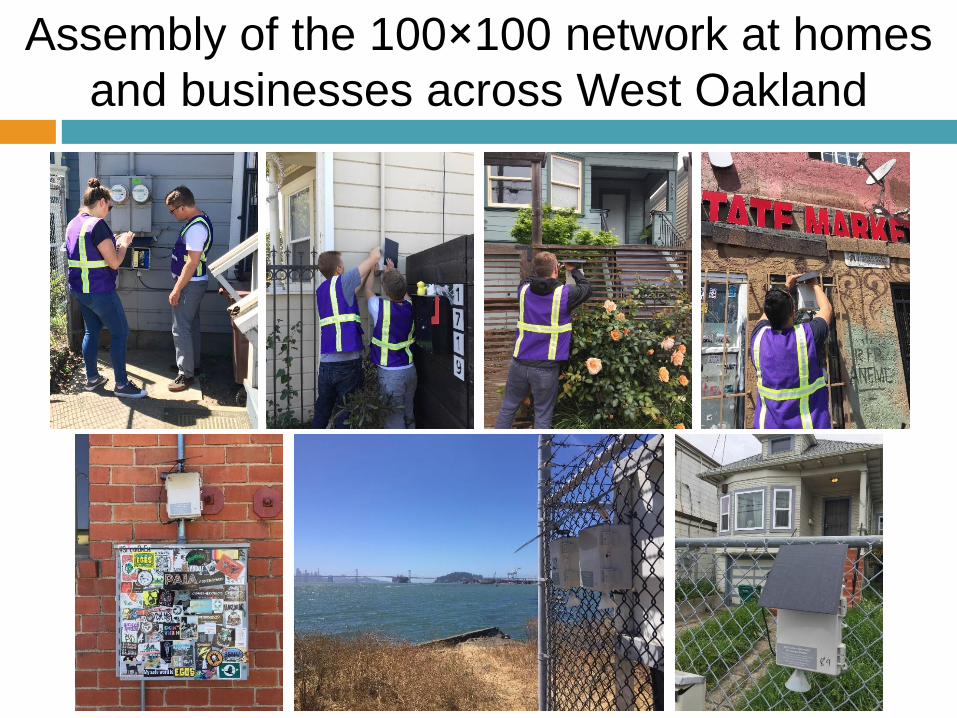
Assembly of the 100×100 network at homes
and businesses across West Oakland

Regulatory monitoring


Thank You

STUDY 2
AIR POLLUTION MAPPING WITH GOOGLE STREET VIEW CARS

High Resolution Air Pollution Mapping with Google Street View Cars
www.edf.org/airqualitymaps

Mobile Monitoring with GSV
DATA COLLECTION
BC, NO, NO2
1Hz sample rate
Daytime, 150 days over 1 year (mid 2015 – mid 2016)
Each road/highway segment sampled 30+ times
400+ unique miles of roads. 14,000+ miles driven total.
Each road segment (30 m) has ~100 observations
3×10⁶ data points
www.edf.org/airqualitymaps

Air pollution is unevenly distributed
BAAQMD fixed-site monitor
West Oakland – Black Carbon www.edf.org/airqualitymaps
The most polluted areas
have levels of black
carbon ~5 times higher
than the lowest polluted
areas.
Many places see higher
concentrations than
levels measured at
BAAQMD central site.
Median BC levels
comparison
study
0.51 µ/m3
BAAQMD
monitor
0.50 µ/m3

East Oakland – Black Carbon
www.edf.org/airqualitymaps/air-
pollution-and-health-east-oakland

We found multiple hotspots/areas of high pollution
Example: Metal recycler on Peralta/Poplar and 28th st. Black carbon levels here are more than 3x the median for WO.
Street View and aerial imagery of metal recycling cluster show frequent visits by heavy duty trucks at the facilities.
Newly built children’s playground across the street from the recycler.
www.edf.org/airqualitymaps

Air pollution high on prohibited truck routes
Generally, black carbon levels on residential streets are similar to urban background level. However, our map reveals
elevated levels of pollution on many streets where trucks are prohibited.
EDF Black Carbon Map Oakland Truck Routes and Truck Prohibited Streets
www.edf.org/airqualitymaps

Example 2: Elevated BC levels on 7th St,
a busy truck route with housing nearby
Example 1: Trucks queuing on Frontage
Road leading to port entrance
Elevated pollution levels on streets where trucks are known to queue or have high truck volume
www.edf.org/airqualitymaps

A Tale of Two Freeways: air pollution much higher on I-880 than I-580
How much
higher is
pollution on
I-880 vs. I-580?
BC: ~80%
NO: ~130%
NO2: ~60%
www.edf.org/airqualitymaps/tale-two-freeways

STUDY 3
AIR POLLUTION & HEALTH

Do local differences in air quality affect health?
Study Question: Do people living in areas of Oakland with higher pollution have higher cardiovascular health risks?
Researchers used:• Individual electronic medical records from Kaiser
Permanente patients living in West Oakland, Downtown Oakland and East Oakland
o Heart disease, stroke and death
• Analyzed difference in health risk for people living at addresses with higher vs. lower air pollution
o Accounted for neighborhood socioeconomic factors and individual data on medications, other health problems, medication, smoking, age, race, sex, and body mass index.

Implications
• Revise Conditional Use Permits to sunset industrial use permits near residential areas
• Provide alternative locations and incentives / financial support for businesses to move out of residential areas
• “Receptor side” mitigations (pollution barriers, air filtration etc)
Proximity
• More enforcement officers; proper training
• Truck signage; truck driver education
• Improve truck routes
Enforce-ment
• Adopt cleaner technologies; invest in zero emission equipment & infrastructure
• Reduce emissions from existing technologiesEmissions

Thank you
Contacts:
Maria Harris, PhD
Environmental Epidemiologist
T 415 293 6164
Fern Uennatornwaranggoon
Bay Area Air Quality Policy Manager
T 415 293 6162
Environmental Defense Fund
123 Mission Street, 28th Floor
San Francisco, CA 94105
www.edf.org