Embed Size (px)
Citation preview
1
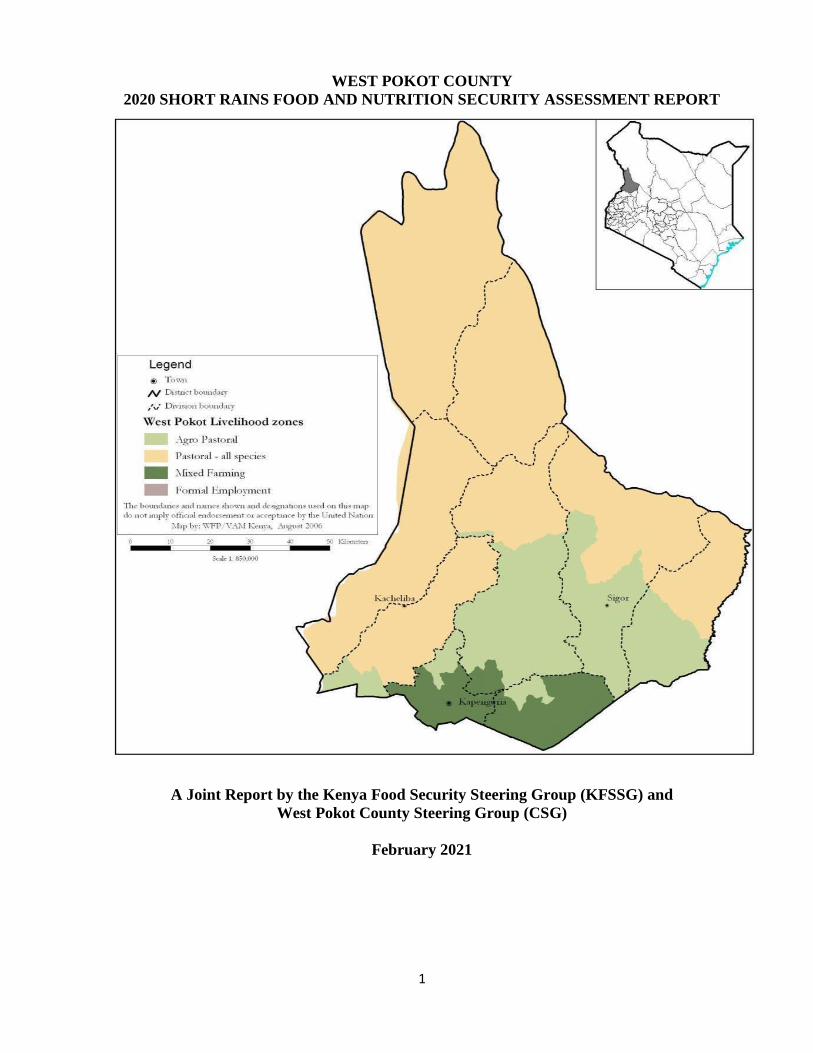
WEST POKOT COUNTY
2020 SHORT RAINS FOOD AND NUTRITION SECURITY ASSESSMENT REPORT
A Joint Report by the Kenya Food Security Steering Group (KFSSG) and
West Pokot County Steering Group (CSG)
February 2021

2
Executive Summary
The October-November-December (OND) short rains food and nutrition security assessment exercise
was conducted in West Pokot County in January 2021. The objective was to establish the County’s
food and nutrition status after the short rains season. The exercise was done in an objective, evidence-
based and transparent manner involving a multi-sectoral team of the technical County Steering Group
(CSG) members led by the National Drought Management Authority. Information and data used was
obtained through, review of secondary information sources. Sector checklists and community interview
guides were used to acquire primary data from the field. During field work, the assessment team visited
various sampled areas for validation and triangulation of information, using the livelihood zone as the
unit of analysis. The county experienced a timely rainfall onset in the first dekad of October 2020, with
the season recording 108 percent of normal cumulative rainfall amounts. The rainfall was evenly
distributed in space but with poor temporal distribution. Cessation was early in the third dekad of
November 2020 compared to the normal cessation in the first dekad of January 2021. The key drivers
to food and nutrition security were, rainfall, which performed poorly due to early cessation and poor
temporal distribution, low livestock production, below normal crop production and disrupted market
operations. Food availability at household level was low while access from markets faced challenges
due to disrupted market operations. Maize price per kg was Kshs. 33 in January 2021, being eight
percent below the long term average (LTA) and 10 percent above the previous month. Cereal stocks
held by households were below normal. Goat price was Kshs 4,800, which is 55 percent above the LTA
price while two percent below the previous month. The current terms of trade is 161 kilograms of maize
from the sale of a goat, being 83 percent above the LTA and 3 percent below that of the previous month.
Households with borderline and acceptable food consumption were 17 and 78 percent respectively
reflecting a similar situation compared to December 2020. The proportion of households in January
2021 with acceptable, borderline and poor food consumption categories was 78, 21.3 and 0.7 percent
respectively, reflecting an improvement compared to December 2020 which was 75.3, 18.5 and 6.2
percent for acceptable, borderline and poor categories respectively. Pasture and browse condition was
good to fair across livelihood zones and projected to last one month less than normal. The livestock
body condition was good in mixed farming zones but varied between good and fair in pastoral and
agro-pastoral livelihood zones as compared to being good during normal. Livestock migrations were
normal, although the livestock numbers migrating are likely to increase soon. Water consumption was
normal at 15, 10 and eight liters per person per day in mixed farming, agro-pastoral and pastoral
livelihood zones respectively. The proportion of children who received Vitamin A supplementation for
children aged 6-11 months in the last 6 months was 86 percent. Vitamin A supplementation for the
same category for a similar period in 2019 was 104 percent, representing a decrease. Cases of URTI
for under-fives were higher compared to the last three years while total cases for the general population
were higher than 2017 and 2018 but less than total cases recorded in 2019 while those of diarrhoea for
both the under-fives and the general population decreased. Malaria cases for both under-fives and
general population for July to December 2020 were highest compared to the last three years. 209 cases
of measles epidemic were reported between July and December 2020 compared to 7 cases that were
reported in the same period of 2019. Cases of dysentery between July and December 2020 were 734
compared to 812 cases in 2019. Cases of typhoid between July and December 2020 were 14,382
compared to 20,661 reported the same period of 2019. The proportion of households with acceptable,
borderline and poor food consumption was 78, 21.3 and 0.7 percent respectively, where those who
employed no coping mechanism to access food was 79.3 percent while those applying stress coping
being 20.7 percent. There was a drastic drop in enrolment in schools in the current period of 26 and 29
percent for boys and girls respectively. The County is generally classified under the None/Minimal
Phase (Phase 1) of the Integrated food security Phase Classification.

3
TABLE OF CONTENTS
Executive Summary ........................................................................................................................................... 2
1.0 INTRODUCTION ....................................................................................................................................... 5
1.1 County background ............................................................................................................................... 5
1.2 Methodology and approach................................................................................................................... 5
2.0 DRIVERS OF FOOD AND NUTRITION SECURITY IN THE COUNTY .............................................. 6
2.1 Rainfall performance ............................................................................................................................. 6
2.2 Insecurity/Conflict ................................................................................................................................. 6
2.3 COVID-19 Pandemic ............................................................................................................................. 6
2.4 Other shocks and hazards ..................................................................................................................... 6
3.0 IMPACTS OF DRIVERS ON FOOD AND NUTRITION SECURITY ..................................................... 7
3.1 Availability.............................................................................................................................................. 7
3.1.1 Crops Production ............................................................................................................................ 7
3.1.2 Cereal stock ..................................................................................................................................... 8
3.1.3 Livestock Production ...................................................................................................................... 9
3.1.4 Impact on availability ................................................................................................................... 11
3.2 Access .................................................................................................................................................... 11
3.2.1 Markets prices – functioning ....................................................................................................... 11
3.2.2 Terms of trade ............................................................................................................................... 12
3.2.3 Income sources .............................................................................................................................. 13
3.2.4 Water access and availability ....................................................................................................... 13
3.2.5 Food consumption ......................................................................................................................... 14
3.2.6 Coping strategy ............................................................................................................................. 14
3.3 Utilization.............................................................................................................................................. 15
3.3.1 Morbidity and mortality patterns ............................................................................................... 15
3.3.2 Immunization and vitamin A supplementation .......................................................................... 15
3.3.3 Nutritional status and dietary diversity ...................................................................................... 17
3.3.4 Health and nutrition sector in COVID-19 context ..................................................................... 17
3.3.5 Public interventions, risk communication and community level actions ................................. 18
3.3.6 Coordination and leadership in COVID-19 pandemic preparedness and response ............... 18
3.3.7 Sanitation and hygiene.................................................................................................................. 18
3.4 Trends of key food security indicators ............................................................................................... 19
3.5 Education .............................................................................................................................................. 19
3.5.1 Enrolment ...................................................................................................................................... 19
3.5.2 Effects of COVID-19 in schools ................................................................................................... 20
3.5.3 Effects of short rains on schools ................................................................................................... 20
4
3.5.4 School feeding ................................................................................................................................ 20
3.5.5 Inter sectoral links where available ............................................................................................. 20
4.0 FOOD SECURITY PROGNOSIS ............................................................................................................. 21
4.1 Prognosis assumptions ......................................................................................................................... 21
4.2 Food security outlook for the next six months................................................................................... 21
5.0 CONCLUSION AND INTERVENTIONS ............................................................................................... 22
5.1 Conclusion ............................................................................................................................................ 22
5.1.1 Phase classification ........................................................................................................................ 22
5.1.2 Summary of findings ..................................................................................................................... 22
5.1.3 Sub-County ranking ..................................................................................................................... 22
5.2 Ongoing interventions ......................................................................................................................... 22
5.2.1 Food interventions ........................................................................................................................ 22
5.2.2 Non-food interventions ................................................................................................................. 22
5.3 Recommended Interventions .............................................................................................................. 24
5.3.1 Food interventions......................................................................................................................... 24
5.3.2 Non-food interventions ................................................................................................................. 24

5
1.0 INTRODUCTION
1.1 County background
The County of West Pokot is located in the
North-Western part of Kenya. It borders
Turkana County to the North, Trans Nzoia
and Elgeyo Marakwet Counties to the
South, while Baringo County to the East. It
also borders the Republic of Uganda to the
West. It has four administrative units
which include Pokot North, Pokot South,
Pokot Central, and Pokot West sub-
counties. It covers an area of 9,169.4
square kilometers that support a human
population of 621,241 persons (Kenya
National Bureau of Statistics KNBS,
2019). The three main livelihood zones in
the County are pastoral, agro-pastoral and mixed farming, with 33, 37 and 30 percent of the population
respectively. The population proportion by livelihood zone (figure 1). Livestock production is the
economic mainstay of the county contributing to 60, 30 and 26 percent of cash income in the pastoral,
mixed farming and agro-pastoral livelihood zones respectively. Cash crop farming and poultry
production contribute 15 percent each, of cash income in the mixed farming livelihood zones and the
agro-pastoral livelihood zones respectively. The main hazards experienced in the County are
livestock/crop pests and diseases, Malaria outbreaks as well as waterborne disease epidemics such as
Cholera, Typhoid and Dysentery.
1.2 Methodology and approach
The short rains food and nutrition security assessment exercise was conducted with the main objective
of developing an objective, evidence-based and transparent food and nutrition security situation
analysis. The analysis took into account the cumulative effects of previous seasons in addition to the
current short rains season to provide immediate and medium term recommendations for possible
response options based on the situation analysis. The multi-sectoral and multi-agency food security
assessment exercise was conducted in January 2021, by the West Pokot County Technical County
Steering Group (CSG) members, including personnel from non-state actors that include Action against
Hunger (ACF), UNICEF and Kenya Red Cross Society (KRCS) The assessment covered the three main
livelihoods of the county from which sampling was done. The sampling sites that were visited during
the assessment exercise include, Kodich, Ng’otut, Kong’elai and Nasal in the Pastoral zone, while areas
covered in the Agro-pastoral livelihood zone include Wakor, Sigor and Lomut. In Mixed farming
livelihood zones, the areas sampled for primary data collection were, Cheptuya, Roponya, Kiringet and
Kishaunet. The primary data was collected through community, market interviews and direct
observation. Secondary data was sourced from the sectoral technical reports and the National Drought
Management Authority’s (NDMA) early warning system monthly bulletins. The integrated food
security phase classification (IPC) protocols were used during analysis and subsequent classification
of the severity and identification of the possible causes of food insecurity.

6
2.0 DRIVERS OF FOOD AND NUTRITION SECURITY IN THE COUNTY
2.1 Rainfall performance
The onset of the season was timely and
started in first dekad of October 2020,
with cumulative amounts of 170 mm
compared with the long term average
(LTA) of 157 mm for the season. The
amounts ranged between 110 to 125
percent of normal across the County.
The distribution in terms of space was
even but in terms of time, the
distribution was poor. The cessation of
the season was however earlier than
normal and occurred in the third dekad
of November instead of the usual
period in the first dekad of January.
2.2 Insecurity/Conflict
There were no conflicts experienced during in the County during the season. All hotspots were calm at
the moment.
2.3 COVID-19 Pandemic
There was limited movement for both human and livestock which affected livestock productivity and
marketing. Movement of goods and services was restricted thus affecting provision of various food
commodities to the markets. The restrictions affected migration where pastoralists barred from crossing
over to Uganda in search of pasture, where they could have otherwise moved during such times of the
year.
2.4 Other shocks and hazards
There was desert locust invasion in various parts of West Pokot County, experienced in every sub-
county. However, invasion was higher in Pokot North and Pokot Central sub-counties. It is estimated
that 9,980 acres of pasture and browse were destroyed by the desert locust. Spraying of locust was done
in Pokot North and the effects of the spray had not yet been assessed especially on the bee colonies.
Locust invasion remains a threat in the County. Cases of livestock disease outbreak like Foot and Mouth
Disease (FMD) and Lumpy Skin Disease (LSD) were prevalent in various parts of the County.
7
3.0 IMPACTS OF DRIVERS ON FOOD AND NUTRITION SECURITY
3.1 Availability
3.1.1 Crops Production
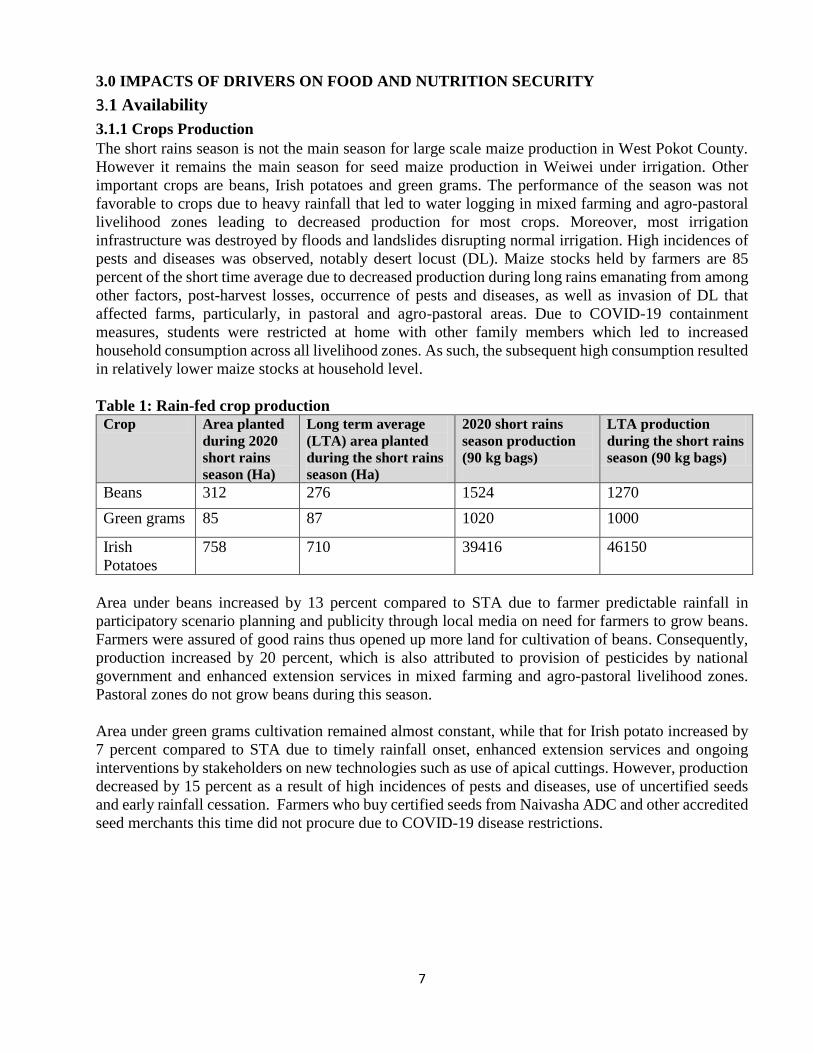
The short rains season is not the main season for large scale maize production in West Pokot County.
However it remains the main season for seed maize production in Weiwei under irrigation. Other
important crops are beans, Irish potatoes and green grams. The performance of the season was not
favorable to crops due to heavy rainfall that led to water logging in mixed farming and agro-pastoral
livelihood zones leading to decreased production for most crops. Moreover, most irrigation
infrastructure was destroyed by floods and landslides disrupting normal irrigation. High incidences of
pests and diseases was observed, notably desert locust (DL). Maize stocks held by farmers are 85
percent of the short time average due to decreased production during long rains emanating from among
other factors, post-harvest losses, occurrence of pests and diseases, as well as invasion of DL that
affected farms, particularly, in pastoral and agro-pastoral areas. Due to COVID-19 containment
measures, students were restricted at home with other family members which led to increased
household consumption across all livelihood zones. As such, the subsequent high consumption resulted
in relatively lower maize stocks at household level.
Table 1: Rain-fed crop production
Crop Area planted
during 2020
short rains
season (Ha)
Long term average
(LTA) area planted
during the short rains
season (Ha)
2020 short rains
season production
(90 kg bags)
LTA production
during the short rains
season (90 kg bags)
Beans 312 276 1524 1270
Green grams 85 87 1020 1000
Irish
Potatoes
758 710 39416 46150
Area under beans increased by 13 percent compared to STA due to farmer predictable rainfall in
participatory scenario planning and publicity through local media on need for farmers to grow beans.
Farmers were assured of good rains thus opened up more land for cultivation of beans. Consequently,
production increased by 20 percent, which is also attributed to provision of pesticides by national
government and enhanced extension services in mixed farming and agro-pastoral livelihood zones.
Pastoral zones do not grow beans during this season.
Area under green grams cultivation remained almost constant, while that for Irish potato increased by
7 percent compared to STA due to timely rainfall onset, enhanced extension services and ongoing
interventions by stakeholders on new technologies such as use of apical cuttings. However, production
decreased by 15 percent as a result of high incidences of pests and diseases, use of uncertified seeds
and early rainfall cessation. Farmers who buy certified seeds from Naivasha ADC and other accredited
seed merchants this time did not procure due to COVID-19 disease restrictions.

8
Table 2: Irrigated Crop production
Crop Area planted
during 2020
short rains
season (Ha)
Long term average
(LTA) area planted
during the short rains
season (Ha)
2020 short rains
season production
(90 kg bags/MT)
LTA production during
the short rains season
(90 kg bags/MT)
Maize 320 345 6880 7,590
Beans 16 25 112 187.5
Green
grams
85 89 340 382.7
Area under Maize, beans and green grams was 93, 64 and 96 percent of STA respectively. The decrease
in area under crops was due to destroyed irrigation infrastructure occasioned by landslides and floods
notably Weiwei and Kaminia irrigation schemes as well as reduced subsidized land preparation services
by the county government. Likewise, production was below STA for maize, beans and green grams by
9, 40 and 11 percent respectively owing to decreased area and apparent low yields attributed to
incidences of crop pests and diseases compounded with DL invasion and leaching.
COVID -19 disease control restrictions reduced interaction of extension staff by farmers and delayed
introduction of agriculture projects like Northern Rangelands Trust (NRT) and Kenya Climate Smart
Agriculture Project that could have assisted with provision of seeds especially green grams.
3.1.2 Cereal stock
Table 3: Quantities held currently (90 kg bags)
Commodity Maize Beans Sorghum
Current STA Current STA Current STA
Farmers 520,910 610,800 5,560 5,250 3,850 3,980
Traders 32,380 39,880 1,000 1,200 2,300 2,500
Millers 0 0 0 0 0 0
Food Aid/
NCPB
0 0 0 0 0 0
Maize stocks held by farmers are 85 percent of STA due to decreased production during main season
(long rains) attributed to factors of post-harvest losses, occurrence of pests and diseases as well as
invasion of DL in farms in pastoral and agro-pastoral areas. COVID-19 disease restrictions held
students at home with other family members which led to increased consumption compared to normal
across all livelihood zones.
Traders held 19 percent less compared to STA due to farmers reluctance to sell at lower prices. Traders
had no incentive to buy because they did not have the market to dispose at competitive prices since the
NCBP had not started buying, which currently NCPB has no stocks.
Maize stocks are expected to last for 3-4 months compared to 5 months in mixed farming livelihood
zone. In pastoral and Agro-pastoral livelihood zones, it is expected to last for 2-3 months compared to
4-5 months normally. Beans held by farmers are 106 percent of STA due to favorable short rains
performance and cumulative stocks from long rains. Stocks for Sorghum and green grams held by
9
farmers and traders are lower compared to STA across the livelihood zones due to reduced trade
between counties due to COVID-19 restrictions that minimized cross border trade.
3.1.3 Livestock Production
The main species of livestock kept in the county are indigenous cattle, goats, sheep, poultry, camels
and donkeys. Livestock sector contributes significantly to both food and income. For most households
across the three livelihood zones in the County livestock contributes 69, 30 and 26 percent to cash
income in pastoral, mixed farming and agro-pastoral livelihood zones respectively. The county also
produces significant amount of honey, although this was affected by much rainfall and locust invasion,
among others. The short rains ceased earlier than normal and this affected the performance of livestock
with respect to water and forage availability in some areas.
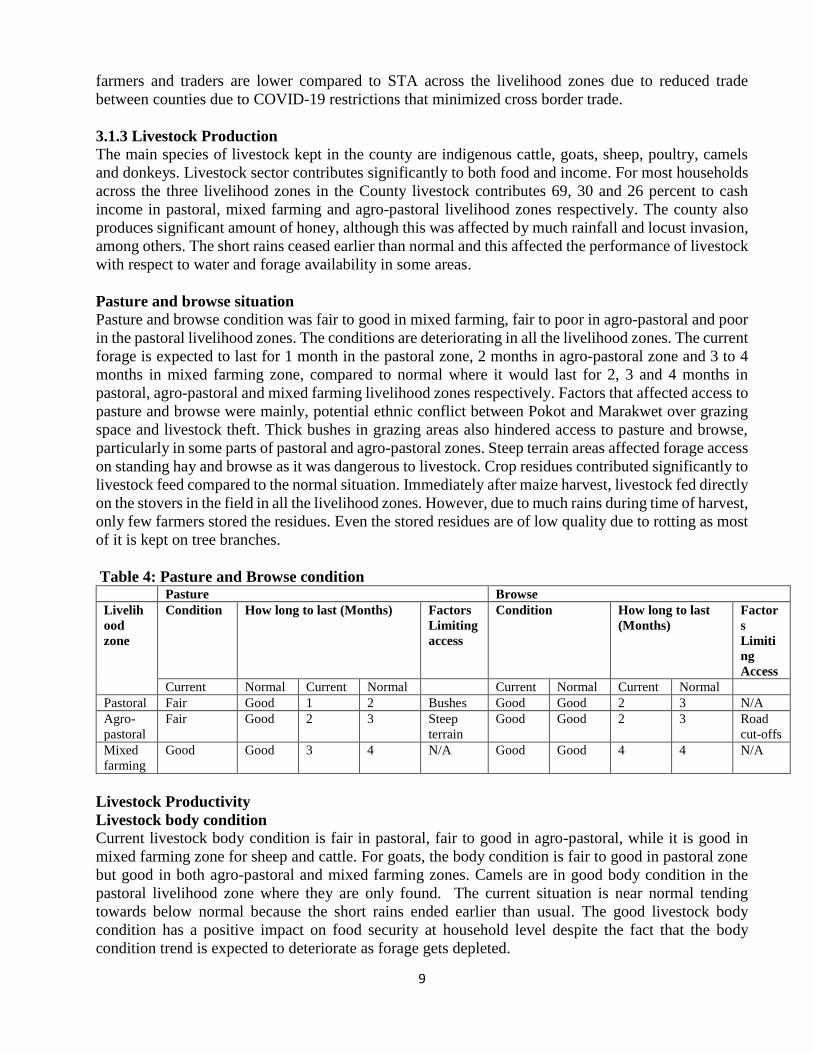
Pasture and browse situation
Pasture and browse condition was fair to good in mixed farming, fair to poor in agro-pastoral and poor
in the pastoral livelihood zones. The conditions are deteriorating in all the livelihood zones. The current
forage is expected to last for 1 month in the pastoral zone, 2 months in agro-pastoral zone and 3 to 4
months in mixed farming zone, compared to normal where it would last for 2, 3 and 4 months in
pastoral, agro-pastoral and mixed farming livelihood zones respectively. Factors that affected access to
pasture and browse were mainly, potential ethnic conflict between Pokot and Marakwet over grazing
space and livestock theft. Thick bushes in grazing areas also hindered access to pasture and browse,
particularly in some parts of pastoral and agro-pastoral zones. Steep terrain areas affected forage access
on standing hay and browse as it was dangerous to livestock. Crop residues contributed significantly to
livestock feed compared to the normal situation. Immediately after maize harvest, livestock fed directly
on the stovers in the field in all the livelihood zones. However, due to much rains during time of harvest,
only few farmers stored the residues. Even the stored residues are of low quality due to rotting as most
of it is kept on tree branches.
Table 4: Pasture and Browse condition Pasture Browse
Livelih
ood
zone
Condition How long to last (Months) Factors
Limiting
access
Condition How long to last
(Months)
Factor
s
Limiti
ng
Access
Current Normal Current Normal Current Normal Current Normal
Pastoral Fair Good 1 2 Bushes Good Good 2 3 N/A
Agro-
pastoral
Fair Good 2 3 Steep
terrain
Good Good 2 3 Road
cut-offs
Mixed
farming
Good Good 3 4 N/A Good Good 4 4 N/A
Livestock Productivity
Livestock body condition
Current livestock body condition is fair in pastoral, fair to good in agro-pastoral, while it is good in
mixed farming zone for sheep and cattle. For goats, the body condition is fair to good in pastoral zone
but good in both agro-pastoral and mixed farming zones. Camels are in good body condition in the
pastoral livelihood zone where they are only found. The current situation is near normal tending
towards below normal because the short rains ended earlier than usual. The good livestock body
condition has a positive impact on food security at household level despite the fact that the body
condition trend is expected to deteriorate as forage gets depleted.

10
Table 5: Livestock body condition
Livelihood
zone
Cattle Sheep Goat Camel
Current Normal Curren
t
Normal Curren
t
Normal Curren
t
Normal
Pastoral Fair Good Fair Good Fair-
Good
Good Good Good
Agro-pastoral Fair-
Good
Good Fair-
Good
Good Good Good N/A N/A
Mixed
Farming
Good Good Good Good Good Good N/A N/A
Tropical livestock units (TLUs)
TLUs remained normal at 2 to 3 TLUs in all the three livelihood zones for the poor households and
were 6, 5 and 4 for the medium income households in the pastoral, agro-pastoral and mixed farming
zones respectively, compared with the normal TLUs for the zones of 7, 6 and 5 units.
Table 6: Tropical Livestock Units (TLUs) by household income groups
Livelihood zone Poor income households Medium income households
Current Normal Current Normal
Pastoral 2-3 3-4 4-6 7-8
Agro-pastoral 2-3 3-4 4-5 5-6
Mixed Farming 2-3 3-4 3-4 4-5
Birth rate
The birth rates were normal for all livestock species across the livelihood zones except slight
improvements in goats in agro-pastoral and mixed farming zones. The improvement in birth rates
particularly in goats is attributed to good browse and water availability in the mixed farming and agro-
pastoral livelihood zones, especially in the earlier period before assessment.
Milk production and consumption
Milk production is adequate and normal at household level across all the livelihood zones owing to
stability in production and availability of livestock since no significant migrations had been
experienced. The price of milk is at normal level in all the livelihood zones and households have enough
milk for their families. The situation translates into a stable food and nutrition security at household
level, especially to children under five years. The situation is expected to begin deteriorating as the dry
spell approaches.
Table 7: Milk production, consumption and farm gate prices in the County
Livelihood
zone
Milk Production
(Litres)/Household
Milk consumption
(Litres) per Household
Prices (Ksh)/Litre
Current LTA Current LTA Current LTA
Pastoral 0.5 0.5 0.5 0.5 60 60
Agro-
pastoral
1 1 1 1 60 75

11
Mixed
farming
3 2 2 2 50 60
Livestock Migration
Livestock migration was minimal and considered normal, since it occurred in areas that experience
migration such as Pokot Central and Pokot North sub-counties at this time of the year. The migrations
which usually occur for search of pasture were low due to COVID-19 restrictions. About 30 percent of
livestock mainly cattle had been migrated, as compared to over 40 percent normally.
Livestock Diseases and Mortalities
Peste des Petits Ruminants (PPR) was the main disease reported to be affecting livestock across the
County. Black water was reported in mixed farming zone while Lumpy Skin Disease (LSD) and Foot
and Mouth Disease (FMD) was reported in both agro-pastoral and mixed farming zones. The death
rates were however normal in all livelihood zones. Vaccination against PPR was ongoing in the County.
Water for Livestock
The main sources of water for livestock and domestic use remained rivers, water pans, shallow wells
and boreholes. In pastoral and agro pastoral zones, the current sources of water for livestock are mostly
rivers and boreholes, while in mixed farming zones, the main sources are rivers, streams and shallow
wells. The water volumes in these sources were fairly recharged at about 70 percent in all the watering
points. Agro-pastoral areas mainly depend on dams and pans. The current trekking distance from
grazing areas to water points is slightly higher than normal across the three livelihood zones. In agro-
pastoral and pastoral livelihood zones, the trekking distance is 2 and 6 kilometers respectively while in
the mixed farming areas, the trekking distance is about one kilometer. The livestock watering frequency
is 3 and 5 times in Pastoral and Agro-pastoral areas respectively for all species as compared to 4 and 6
times per day during normal periods. All livestock species are watered daily in mixed farming areas.
Table 8: Water for livestock
Livelihood zone Return trekking distances
(Kms)
Expected duration to
last (Months)
Watering frequency
Current Normal Current Normal Current Normal
Pastoral 6 7 1 3 3 4
Agro pastoral 2 3 2 3 5 6
Mixed Farming 1 2 3 3 7 7
The available water is expected to last up to 1, 2 and 3 months in pastoral, agro-pastoral and mixed
farming livelihood zones respectively as compared to 3 months normally.
3.1.4 Impact on availability
There were less than normal cereal stocks held by households, indicating a deteriorated food security
situation. The relatively below normal livestock body condition has a negative implication to household
food security since there is declined milk availability, owing to less milk production at household level.
3.2 Access
3.2.1 Markets prices – functioning
Market operations
The main livestock markets in the County are Kishaunet in the mixed farming, Chepareria, Ortum,
Sigor, Lomut in agro-pastoral livelihood zone and Orolwo, Nakujit and Kacheliba in the pastoral
livelihood zones. The main markets in the County were operating sub-optimally due to COVID-19
12
restrictions. The trade volumes were also lower than normal since some suppliers were not accessing
the markets optimally. The market supply sources were however normal other than the quantities,
which were less than normal. The market supply of livestock is currently low across the livelihood
zones compared to normal. The sources of livestock are mainly from within the communities around
the market area, the neighbouring wards and in North Pokot and some livestock are from Uganda.
Foodstuff markets are Makutano, Chepareria, Chepkopegh, Ortum, Orolwo, Kaibichbich, Kacheliba
and Amakuriat. The common livestock traded are cattle, sheep, and goats while food items sold on the
markets are maize and beans with other household commodities in the markets being cooking oil, sugar,
and soap. Market supplies showed a reducing trend owing to the limited movement occasioned by
COVID-19 containment measures. There were cases of distress sales due to pressure for income as
schools opened. There was a generally lower than normal percentage of households that purchased food
stuffs from the market as a result of movement restrictions due to COVID-19 disease control measures.
The trend of livestock trade is likely to remain low in the next 3 months, due to the ongoing dry spell
coupled with COVID-19 control measures in place.
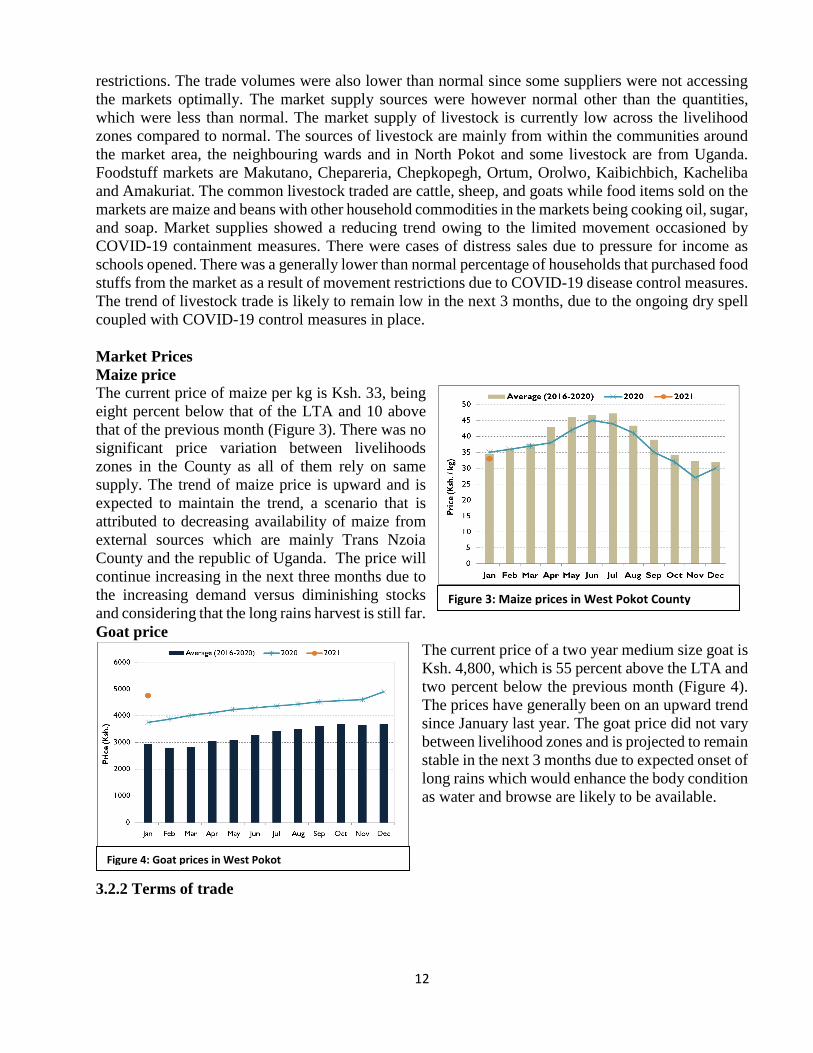
Market Prices
Maize price
The current price of maize per kg is Ksh. 33, being
eight percent below that of the LTA and 10 above
that of the previous month (Figure 3). There was no
significant price variation between livelihoods
zones in the County as all of them rely on same
supply. The trend of maize price is upward and is
expected to maintain the trend, a scenario that is
attributed to decreasing availability of maize from
external sources which are mainly Trans Nzoia
County and the republic of Uganda. The price will
continue increasing in the next three months due to
the increasing demand versus diminishing stocks
and considering that the long rains harvest is still far.
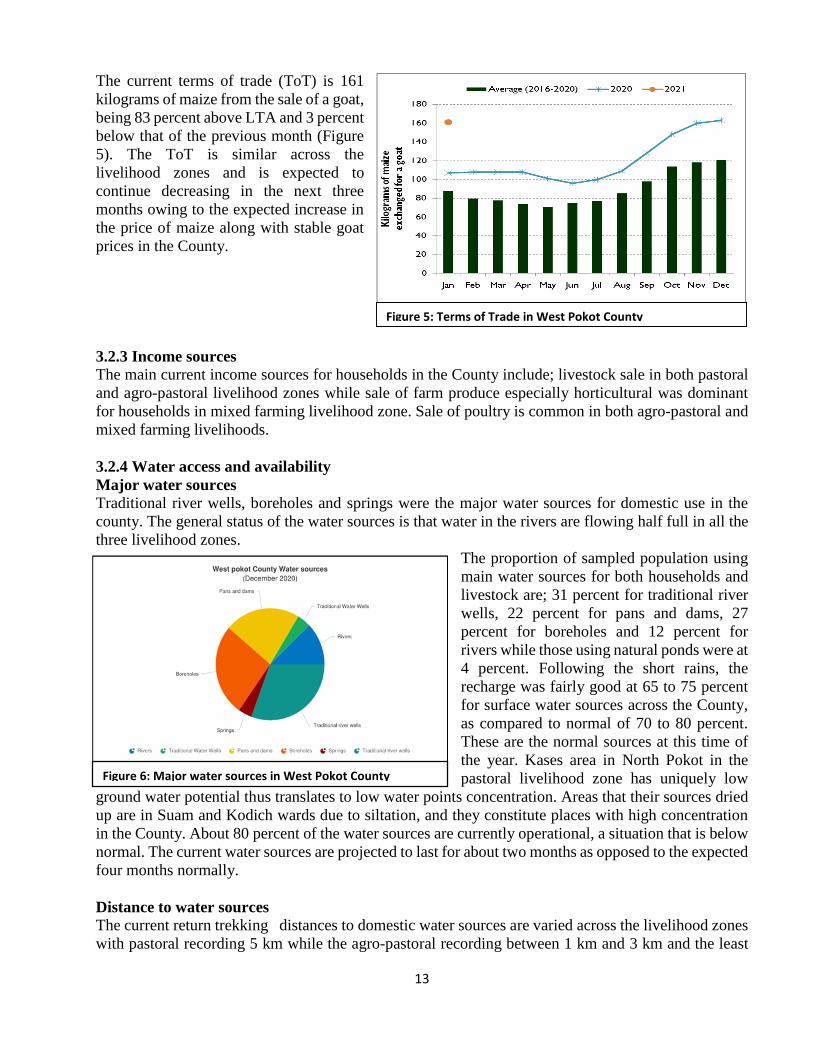
Goat price
The current price of a two year medium size goat is
Ksh. 4,800, which is 55 percent above the LTA and
two percent below the previous month (Figure 4).
The prices have generally been on an upward trend
since January last year. The goat price did not vary
between livelihood zones and is projected to remain
stable in the next 3 months due to expected onset of
long rains which would enhance the body condition
as water and browse are likely to be available.
3.2.2 Terms of trade
Figure 3: Maize prices in West Pokot County
Figure 4: Goat prices in West Pokot
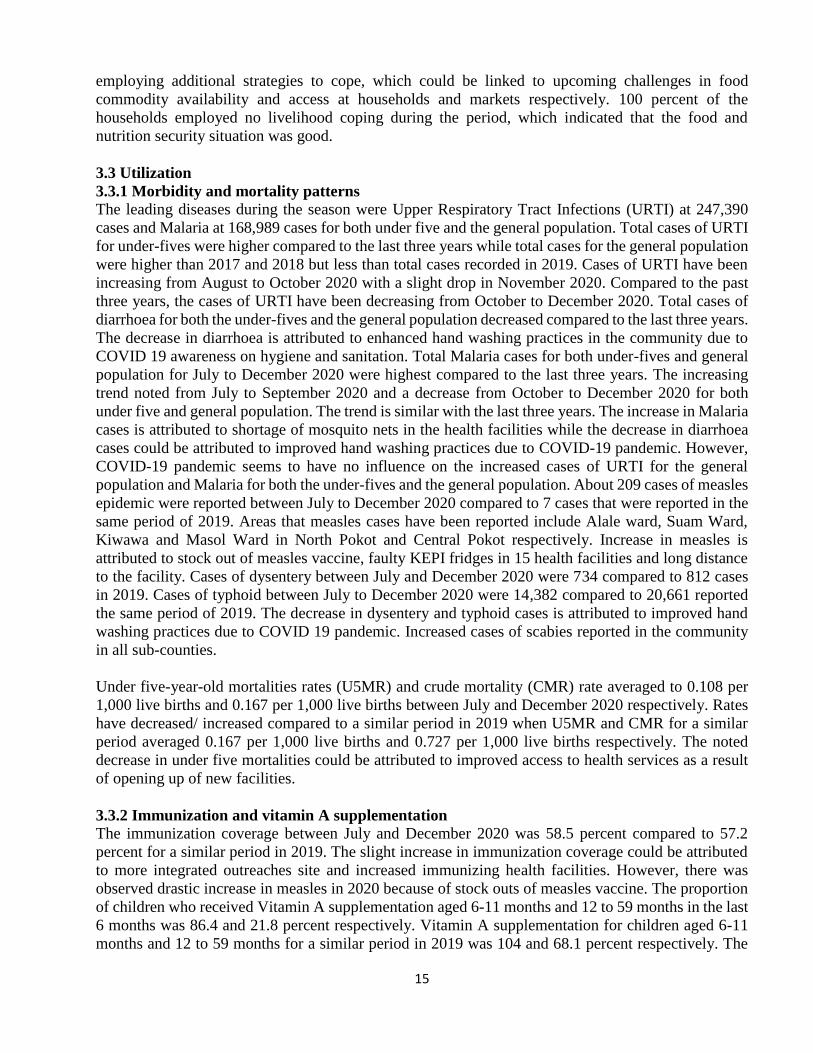
13
The current terms of trade (ToT) is 161
kilograms of maize from the sale of a goat,
being 83 percent above LTA and 3 percent
below that of the previous month (Figure
5). The ToT is similar across the
livelihood zones and is expected to
continue decreasing in the next three
months owing to the expected increase in
the price of maize along with stable goat
prices in the County.
3.2.3 Income sources
The main current income sources for households in the County include; livestock sale in both pastoral
and agro-pastoral livelihood zones while sale of farm produce especially horticultural was dominant
for households in mixed farming livelihood zone. Sale of poultry is common in both agro-pastoral and
mixed farming livelihoods.
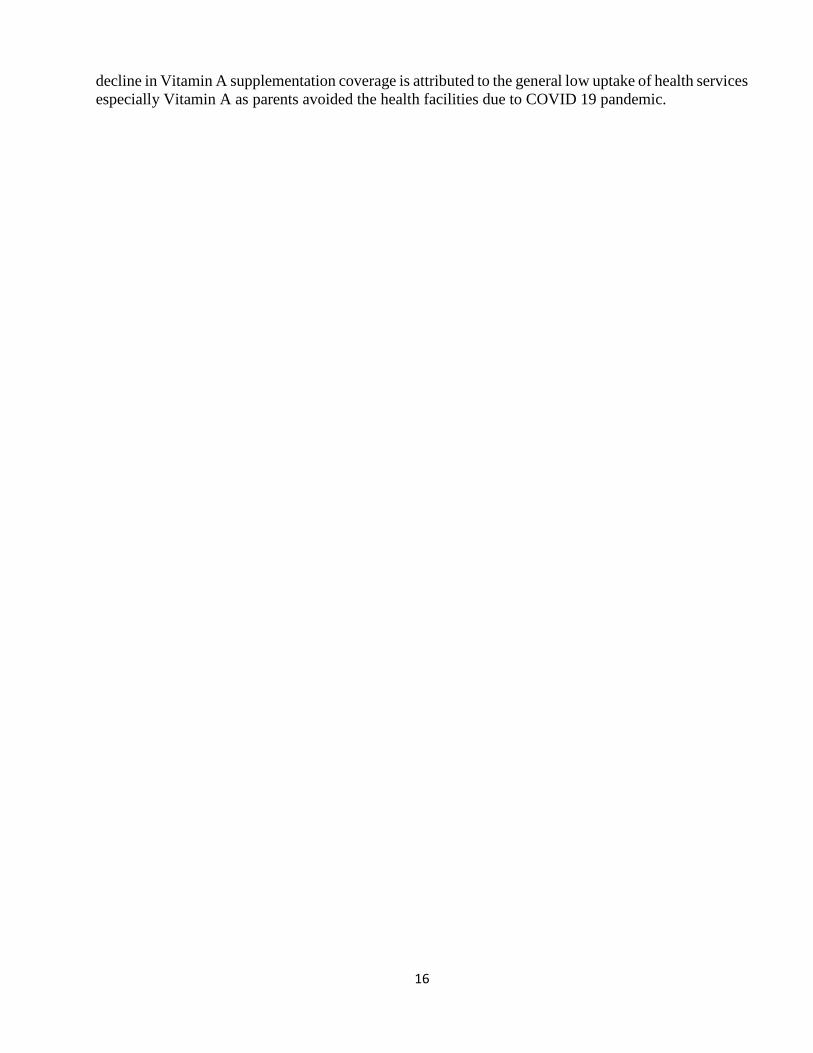
3.2.4 Water access and availability
Major water sources Traditional river wells, boreholes and springs were the major water sources for domestic use in the
county. The general status of the water sources is that water in the rivers are flowing half full in all the
three livelihood zones.
The proportion of sampled population using
main water sources for both households and
livestock are; 31 percent for traditional river
wells, 22 percent for pans and dams, 27
percent for boreholes and 12 percent for
rivers while those using natural ponds were at
4 percent. Following the short rains, the
recharge was fairly good at 65 to 75 percent
for surface water sources across the County,
as compared to normal of 70 to 80 percent.
These are the normal sources at this time of
the year. Kases area in North Pokot in the
pastoral livelihood zone has uniquely low
ground water potential thus translates to low water points concentration. Areas that their sources dried
up are in Suam and Kodich wards due to siltation, and they constitute places with high concentration
in the County. About 80 percent of the water sources are currently operational, a situation that is below
normal. The current water sources are projected to last for about two months as opposed to the expected
four months normally.
Distance to water sources
The current return trekking distances to domestic water sources are varied across the livelihood zones
with pastoral recording 5 km while the agro-pastoral recording between 1 km and 3 km and the least
Figure 5: Terms of Trade in West Pokot County
Figure 6: Major water sources in West Pokot County

14
being the mixed farming at less than 1km. The implication on the usage is that the shorter the distance
the higher the water usage by households while those recording longer distances use less water per
person per day. Most areas in the pastoral livelihood zones recorded relatively high return distances
due to scarcity of water sources as some sources in the areas recharged poorly.
Waiting time at the source
Waiting time is varied across all the livelihood zones with pastoral having the highest time at between
one and two hours. In these areas, livestock is given preference, coupled with the existence of fewer
sources of water. In agro-pastoral zones, the waiting time ranges between 30 minutes and one hour
because of the many sources of water. Waiting time in the mixed farming zones is less than 30 minutes
since there are many water sources with less cases of congestion.
Cost of water
The cost of water at the source is nil but vendors charge transportation charges in pastoral livelihood
zones costing between Kshs. 20 and Kshs. 50 per 20 liter jerrican as compared to the normal cost of
between Kshs. 10 and Kshs. 30, whereas in agro-pastoral and mixed farming zones, the charges are
between Kshs. 10 and Kshs. 20 depending on the distance. The charges normally expected at such a
time of the year in the former areas is usually Kshs.10. The relatively higher cost of transportation of
water in the pastoral areas limits water use by households as compared to other zones.
Water consumption
The average water consumption per person per day is varied across the livelihood zones with mixed
farming recording the highest use of 15 liters per person per day and is attributed to better availability
and accessibility while the agro-pastoral livelihood zones recorded 10 liters per person per day with the
pastoral households recording the use of 8 liters per person per day. The variation is normal for such
period of the year. Possible contamination points are water dams/pans and rivers where both livestock
and humans wade in to drink, bathe and launder.
3.2.5 Food consumption
Food Consumption The proportion of households in January 2021 with acceptable, borderline and poor food consumption
categories was 78, 21.3 and 0.7 percent respectively, reflecting an improvement compared to December
2020 which was 75.3, 18.5 and 6.2 percent for acceptable, borderline and poor categories respectively.
The proportion of households with poor food consumption in January 2021 was 0.7 percent, a
significant improvement from December 2020 which had 6.2 percent. There was significant variation
between the two livelihood zones with 100 percent of households in both mixed farming and agro-
pastoral livelihood zones being categorized as having acceptable FCS compared to 72 percent
households under the same category in the pastoral livelihood zone which the proportion of households
with borderline and poor food consumption of 25 and three percent respectively. There are more food
sources diversity in mixed farming and agro-pastoral livelihood zones as compared to pastoral
livelihoods due to ongoing local harvests mainly in mixed farming areas.
3.2.6 Coping strategy
The proportion of households who employed no coping mechanism to access food in January 2021 was
79.3 percent with those applying stress coping being 20.7 percent while no households employing crisis
coping. The situation indicates a deterioration compared to December 2020 which had 84,16 and zero
percent under no coping, stress and crisis coping strategies. There was an increase in proportion of
households employing stressed coping mechanisms. The increase indicates that households had started
15
employing additional strategies to cope, which could be linked to upcoming challenges in food
commodity availability and access at households and markets respectively. 100 percent of the
households employed no livelihood coping during the period, which indicated that the food and
nutrition security situation was good.
3.3 Utilization
3.3.1 Morbidity and mortality patterns The leading diseases during the season were Upper Respiratory Tract Infections (URTI) at 247,390
cases and Malaria at 168,989 cases for both under five and the general population. Total cases of URTI
for under-fives were higher compared to the last three years while total cases for the general population
were higher than 2017 and 2018 but less than total cases recorded in 2019. Cases of URTI have been
increasing from August to October 2020 with a slight drop in November 2020. Compared to the past
three years, the cases of URTI have been decreasing from October to December 2020. Total cases of
diarrhoea for both the under-fives and the general population decreased compared to the last three years.
The decrease in diarrhoea is attributed to enhanced hand washing practices in the community due to
COVID 19 awareness on hygiene and sanitation. Total Malaria cases for both under-fives and general
population for July to December 2020 were highest compared to the last three years. The increasing
trend noted from July to September 2020 and a decrease from October to December 2020 for both
under five and general population. The trend is similar with the last three years. The increase in Malaria
cases is attributed to shortage of mosquito nets in the health facilities while the decrease in diarrhoea
cases could be attributed to improved hand washing practices due to COVID-19 pandemic. However,
COVID-19 pandemic seems to have no influence on the increased cases of URTI for the general
population and Malaria for both the under-fives and the general population. About 209 cases of measles
epidemic were reported between July to December 2020 compared to 7 cases that were reported in the
same period of 2019. Areas that measles cases have been reported include Alale ward, Suam Ward,
Kiwawa and Masol Ward in North Pokot and Central Pokot respectively. Increase in measles is
attributed to stock out of measles vaccine, faulty KEPI fridges in 15 health facilities and long distance
to the facility. Cases of dysentery between July and December 2020 were 734 compared to 812 cases
in 2019. Cases of typhoid between July to December 2020 were 14,382 compared to 20,661 reported
the same period of 2019. The decrease in dysentery and typhoid cases is attributed to improved hand
washing practices due to COVID 19 pandemic. Increased cases of scabies reported in the community
in all sub-counties.
Under five-year-old mortalities rates (U5MR) and crude mortality (CMR) rate averaged to 0.108 per
1,000 live births and 0.167 per 1,000 live births between July and December 2020 respectively. Rates
have decreased/ increased compared to a similar period in 2019 when U5MR and CMR for a similar
period averaged 0.167 per 1,000 live births and 0.727 per 1,000 live births respectively. The noted
decrease in under five mortalities could be attributed to improved access to health services as a result
of opening up of new facilities.
3.3.2 Immunization and vitamin A supplementation
The immunization coverage between July and December 2020 was 58.5 percent compared to 57.2
percent for a similar period in 2019. The slight increase in immunization coverage could be attributed
to more integrated outreaches site and increased immunizing health facilities. However, there was
observed drastic increase in measles in 2020 because of stock outs of measles vaccine. The proportion
of children who received Vitamin A supplementation aged 6-11 months and 12 to 59 months in the last
6 months was 86.4 and 21.8 percent respectively. Vitamin A supplementation for children aged 6-11
months and 12 to 59 months for a similar period in 2019 was 104 and 68.1 percent respectively. The
16
decline in Vitamin A supplementation coverage is attributed to the general low uptake of health services
especially Vitamin A as parents avoided the health facilities due to COVID 19 pandemic.

17
3.3.3 Nutritional status and dietary diversity
The CHANIS data shows more children under the age of 5 years were underweight in the month of
July to December 2019 compared to the same period in 2020. The highest proportion of underweight
recorded could be attributed to scale up of family MUAC. Very low cases of underweight in 2020 could
be attributed to low uptake of health services as parents avoided the health facilities due to COVID 19
pandemic. According to community interviews conducted, most households are consuming three meals
in Mixed farming and agro-pastoral zones and two meals in the pastoral areas in a day comprising of
Ugali, vegetables, meat, milk, beans, porridge and potatoes. Admissions to Supplementary Feeding
Program (SFP) and Outpatient Therapeutic Program (OTP) have remained low in 2020 compared to
2019. SFP admissions are 473 and 3,518 for 2020 and 2019 respectively while OTP admissions are
1,438 and 1,607 for 2020 and 2019 respectively.
The proportion of children under the age of five years who were ‘at risk’ of malnutrition was 2.2 percent
(Moderate acute-2.2 percent and Severe acute-0 percent malnutrition), in comparison to that of the
previous month of 2.4 percent, reflecting improvement in nutrition. Compared to the long term average
of 4.7 percent, the proportion of children ‘at risk’ of malnutrition is below the normal range due to
stable milk consumption and acceptable food consumption score across the livelihood zones. Due to
disruption of health services as a result of COVID-19 control measures, MUAC screening has not been
possible for the month of July and August 2020 in NDMA sentinel sites.
3.3.4 Health and nutrition sector in COVID-19 context
The onset of COVID-19 brought fear and apprehension among community members, especially on any
newcomer to the village even their own, if they have been away. There was a lot of fear and avoidance
of health facilities, especially when a rumor exists, but fortunately most tests have been turning
negative. At the onset of COVID-19 pandemic led to reduced uptake of health services in the static
health facilities due to COVID 19 measures in place, this has also affected uptake of nutrition services
but currently due to several sensitization measures put in place, the community members are starting
to seek health services normally. The county has 132 static health facilities, during the period July to
December 2020. The 132 health facilities continued to offer health and nutrition services with COVID
19 IPC measures such as hand washing, wearing of face mask and keeping social distance and taking
of temperatures of all clients visiting the facilities.
Outreach services are supported by different actors such as KRCS -15, ACF - 46, THS-70 and Rotary
doctors supported 20 outreaches. However, KRCS supported outreaches ended in February, 2020 due
to funding constraint while THS outreaches are inconsistent and unintegrated. The outreaches are
ongoing in the community with strict observation of MOH guidelines. The department also adopted
one child one MUAC tape in the outreaches and improvised pants just to reduce contact. Through the
community health platform, community services are ongoing with the CHVS acting as agents to teach
community on health and Nutrition education, distributing health leaflets, some are also utilized at the
border point to screen any entrant to the county. Health services were disrupted and as a result,
professionals could not carry out Malezi bora at ECDE centers which are the major vitamin A
supplementation avenue.
Reporting and request for nutrition commodities for SFP and OTP is done online through LMIS. The
county has had stock out for SFP and CSB commodities due to lack of partner to support in procuring
the commodities. The county has been receiving RUTF commodities through KEMSA. This has

18
enabled the county to report Zero stock out for OTP supplies. The county has inadequate supply of
PPEs for COVID -19 response.
3.3.5 Public interventions, risk communication and community level actions
The County through the of Health ministry with partners support have implemented various
interventions, including, distribution of masks, thermo-guns and sanitizers although not all areas and
health facilities were covered. The health sector has been up-scaling enforcement of public health
guidelines to ensure social places adhere to the regulations in such places as supermarkets, banking
halls, religious gatherings, funerals, public transport among others. Screening and provision of
sanitation facilities such as hand washing containers and soap at border points is on-going but some of
the border points ceased due to lack of support. Radio talks have been on-going on matters nutrition
and other health services in the context of COVID-19. currently, community members have reduced
their adherence to MOH guidelines such as social distancing, hand washing, mask wearing and use of
sanitizers.
The pandemic has led to, increase in teenage pregnancies, borrowing of food from neighbours as an
alternative means of survival and seeking support from relatives. On the contrary, the pandemic on the
other hand has led to improved hygiene and sanitation through regular hand washing with soap and use
sanitizers. Social safety net programs in the health and nutrition sector include provision of
supplementary feeds e.g FBF, food aid through provision of cereals and pulses and cash transfer for
adults aged 60 years and above. Due to limited traders dealing with milk and other food commodities,
locally produced products are being consumed at household level.
3.3.6 Coordination and leadership in COVID-19 pandemic preparedness and response
To halt and reverse the effects of the COVID- 19 pandemic on access to essential health and nutrition
services, the County and other partners have taken the issue of COVID-19 seriously by training all front
line health workers on how to manage the pandemic by providing PPEs in terms of masks and sanitizers
to all health care workers and creating isolation center (Kapenguria ECD 300 BED capacity) though
not fully equipped. During the COVID 19 pandemic nutrition coordination forums such as CNTF and
the in-charges meetings have been ongoing both face to face and virtual meetings. In the period July-
December 2020, 1 CNTF meeting was held which was face to face at county level meeting and 8 in-
charges meeting which were held in each of the four sub counties in West Pokot County. The meetings
have been instrumental in tracking progress for nutrition indicators and sharing updates on nutrition
services in the context of the COVID 19 pandemic.
3.3.7 Sanitation and hygiene
The main sources of water in the community include rivers, earth pans/Dams, unprotected shallow
wells and unprotected dug wells. These water sources are all at risk of contamination from the
surrounding due to effects of open defecation with little or no water treatment done. 24.1 percent of the
households draw water from safe water sources. The community basically collects water using 20 litre
plastic jerrican and store using the same containers. Majority of the community use containers without
lids. Methods of water treatment in the community include; chemicals, boiling and pot filters. only 10
percent of the households treat water before drinking. The methods of treating water in the households
was include, boiling, chemical treatment and pot filtering at 59.6, 36.8 and 1.8 percent respectively.
Water treatment is commonly practiced in mixed farming as opposed to agro-pastoral and pastoral
livelihood zones respectively. This is attributed to the level of education and water availability in these
zones. The major sources of water contamination are open defecation especially in pastoral and agro-

19
pastoral livelihood zones and mixed farming to some extent. Dumping of waste into water sources for
example rivers and dams is still evident.
Majority of the households practice open defecation at 45.4 percent especially in pastoral and agro-
pastoral livelihood zones. Households in mixed farming majorly dispose human waste in pit latrines.
The household waste is disposed indiscriminately with a small percentage in pits or burning. The latrine
coverage for the county is at 48 percent. Most of the latrine coverage is concentrated in mixed farming
livelihood zones whereas few are found in agro-pastoral and pastoral livelihood zones. Handwashing
practices at 4 critical times are 7.5 percent representing an insignificant increase from 7.2 percent in
2019 SMART survey. This explains the high cases of diarrhea in this county.
3.4 Trends of key food security indicators
Table 9: Food security trends in West Pokot County
Indicator Long rains assessment, July
2020
Short rains assessment,
January 2021 (current)
Percent of maize stocks held
by households (agro-pastoral)
30 85
Livestock body condition Good to fair Good to fair
Water consumption (litres per
person per day)
Mixed farming: 20 lppd, AP: 15
lppd, Pastoral: 10 Lppd
Mixed farming: 15lppd, AP:
10 lppd, Pastoral: 8 Lppd
Price of maize (per kg) Average County price: Ksh. 44 33
Distance to grazing 3 km 4
Terms of trade (pastoral zone) 125 kg 161
Coping strategy index 1.49 1
Food consumption score Acceptable: 81.3%, Borderline:
18.7%, Poor: 0%
Acceptable: 78, Borderline: 17
Poor: 5
3.5 Education
3.5.1 Enrolment
Table 10: School enrollments for term I 2020 and term II 2021 in West Pokot County
Term II 2021 (Current) Term I 2020 (Previous)
Enrolment No. of Boys No. of Girls Total No. of Boys No. of Girls Total
ECD 23,996 23,560 47,556 39,337 39,932 79,269
Primary 68,398 65,429 133,827 92,313 91,789 184,102
Secondary 17,222 15,879 33,101 22,707 19,820 41,755
There are 1,057 public ECDE centres in the County. Enrolment in public ECDE centres was 47,556 of
which 23,996 were boys while 23,560 were girls compared to an enrolment of 79,269 in the last
assessment, a similar period of the year. The sector experienced a number of challenges that inhibited
enrolment that include lack of robust nutritional support in most centres in the county long trekking
distance to the ECDE centres by learners, prolonged closure of schools occasioned with COVID-19
pandemic and fear of COVID-19 spread. The county has 662 public primary schools and 69 private
schools. The current enrollment in public primary school is 133,827 with a population of 68,398 boys
and 65,429 girls compared to 184,102 who comprised of 92,313 boys and 91,789 girls. There are 66
low cost boarding primary schools in the county. In the secondary school sector there are 179 public
secondary schools and 4 private schools with a total enrollment of 33,101 students with 17,222 boys
and 15,879 girls compared to an enrolment of 42,134 students having 22,431boys and 19,703 girls,
during the last assessment, February 2020. There was a high dropout/absenteeism at 5,485 representing

20
24.2 percent for boys, girls 3,941 making 19.89 percent and 9,426 (which is 22.05 percent for both.
The drop was attributed to prolonged closure of schools, lack of fees, teenage pregnancy and child
labour as well as fear of COVID 19 spread.
Participation
There was a drastic drop in enrolment in the county in the current period where boys enrolment dropped
by 23,915 representing 25.9 percent while girls dropped by 26,360 representing 28.7 percent and the
total population thus dropping by 50,275 that constituted 27.3 percent, a scenario attributed to delayed
supply of food to schools, prolonged closure occasioned by the spread of COVID 19, teenage
pregnancies/child marriage which is still rampant in the county, most of the boys were initiated and
they are yet to come back to school, child labour is still common in the county where the learners are
engaged in gold mining, aloe Vera harvesting, livestock herding and boda boda business. The school
infrastructure in most schools is poor, while the existing one is inadequate, the schools going girls have
challenges of accessing sanitary towels and most school going children have challenges in obtaining
the face masks.
3.5.2 Effects of COVID-19 in schools
There was increased cases of sexual gender based violence, increased teenage pregnancies, high rate
of school dropout/absenteeism, increased child labour, increase in drug and substance abuse amongst
the learners and unruly behaviors among the learners,
3.5.3 Effects of short rains on schools
There was minimal effects of short rain on schools however buildings of schools around Turkwel were
submerged by water from the gorge. The number of schools affected included 13 ECDE centre,20
primary schools and 6 secondary schools drawn from, West Pokot, Pokot North and Pokot central.
3.5.4 School feeding
There was a regular school meals programme for primary schools in the entire county benefitting
184102 students (92,313boys, and 91,789 girls), however there was delayed supply of food to school
impacting negatively on enrolment in this sector. There was no feeding program in place for ECDE
learners.
3.5.5 Inter sectoral links where available
There were strategies that were put in place before schools were opened which included increased hand
washing points, provision of masks and desks to some selected schools, acquisition of thermos-guns as
well as teacher training and community sensitization on COVID-19 MOH protocol.
21
4.0 FOOD SECURITY PROGNOSIS
4.1 Prognosis assumptions
The food security prognosis in the county for the next six months is based on the following assumptions:
The long rains March-April-May (MAM) season is expected to perform below normal (January
2021, Kenya Meteorological Services Department downscaled forecast).
The current below normal cereal stocks are likely to remain low due to lower than normal 2020
production and maize prices expected to increase to above LTA, as the harvesting season is still far.
The current market disruptions and below normal performance are expected to continue due to the
continued COVID-19 pandemic containment restriction measures.
Forage condition is expected to regenerate at lower than normal levels even after the MAM rainfall
season since the rains are expected to perform poorly. Risks of desert locust expected to affect
forage in rangelands.
Crop performance is likely to be poor and low harvests expected owing to the projected below
normal rainfall performance, with risks of desert locust invasion.
The livestock prices are expected to be low as there is decreased demand to sell livestock leading
to low terms of trade and weak food security at household level.
4.2 Food security outlook for the next six months
Food security outcomes in the next three months (February – April)
The declining food stocks at the household level across the livelihood zones coupled with market
disruptions is likely to negatively affect food consumption. The food consumption is expected to
worsen. The currently decreasing livestock prices are likely to continue decreasing while the already
increasing maize prices are expected to drastically increase further, leading to low purchasing power
hence poor food access, especially in pastoral and agro-pastoral livelihood zones since most households
in these areas are depending on market purchases. The nutrition status is expected to worsen as milk
consumption decreases at household level and as the production declines due to expected out-
migrations of livestock. However, no abnormal mortalities are expected in the next three months.
Food security outcome in the last three months of the six months (May – July) projection
Food consumption is expected to worsen further as the long rains harvests would not have been yet
realized. With the expected below normal MAM long rains, pasture and browse will regenerate
optimally thus would fail to adequately support livestock production. As such, milk production and
consumption will be below normal and negatively affect the food and nutrition security. More
livelihood change is expected as most households are expected to employ more livelihood strategies.
During this period, nutrition status for under fives is likely to deteriorate as milk availability fluctuates
below normal. Nevertheless, no abnormal mortalities are expected during this period.

22
5.0 CONCLUSION AND INTERVENTIONS
5.1 Conclusion
5.1.1 Phase classification
More than four in five households are able to meet essential food and nonfood needs without engaging
in atypical, unsustainable strategies to access food and income, including any reliance on humanitarian
assistance. As such, the County is classified under Minimal Food Insecurity (IPC Phase 1).
5.1.2 Summary of findings
The current food security situation is as a result of below normal rainfall performance in the county.
The depressed rainfall performance limited optimal crop and livestock production in most parts of the
county. Cereal stocks at household level were less than LTA and may last less than normal as attributed
to students being retained at home for a long time due to COVID-19 Pandemic control measures. The
measures has led to movement restrictions and poor performance of the market affecting food access.
The COVID-19 Pandemic has also led to high cases of teenage pregnancies and school drop-out as a
result of closure of schools. Extension services were also minimal due to COVID-19 control measures.
Nevertheless, the COVID-19 pandemic has on the other hand led to improved hygiene and sanitation
through hands washing and use of sanitizers and reduced cases of diarrhea. There were minimal
livestock disease outbreaks in the county. Distance to water sources increased slightly following poor
recharge of most water sources. The forage condition had lower regeneration leading to a less time of
duration especially in pastoral livelihood zones. The milk production was lower than normal affecting
its consumption by households.
5.1.3 Sub-County ranking
Sub County Food security Rank Main food security threat (Contributing factors)
Pokot North 1 Low latrine coverage, low immunization coverage
Locust invasion, Measles, Interrupted honey production and
Livestock migrations
Pokot Central 2 Locust invasion, Measles cases, Low latrine coverage
Human wildlife conflict
Pokot West 3 High crop pest and diseases, Low immunization coverage
and Prevalence of COVID 19 disease
Pokot South 4 High fungal disease incidences on horticulture
5.2 Ongoing interventions
5.2.1 Food interventions
5.2.2 Non-food interventions
Agriculture
Interv
ention
Object
ive
Specific
Location
Activit
y target
Cost No. of
beneficiaries
Implementatio
n Time Frame
Implementation
stakeholders
Distrib
ution
of
Onion
seeds
Increas
e area
under
bulb
onions
Batei,Lo
mut
8M Over 200
farmers
1Year County
government
Desert
Locust
Surveil
To
control
DL
County
wide
- All
farmers/pasto
ralists
Continuous FAO/County
government

23
lance
and
reporti
ng
Rehabi
litation
of
Kamini
a
irrigati
on
scheme
Bring
back
schem
e to is
optima
l
agricul
tural
produc
tion
levels
Pokot
South
50M 480 1 year ADB
Livestock
Sub
Count
y
Intervention War
d
No. of
beneficiari
es
Implemente
rs
Impacts in
terms of food
security
Cost Time Frame
All
sub-
counti
es
Advise all
market
participants
to adhere to
COVID-19
measures
All
ward
s
-Leaders
-Extension
workers
-Revenue
collectors
-Health
workers
-Reduced
COVID-19
infections hence
healthy
households
Negligibl
e
Throughout
short rains
period
All
sub-
counti
es
Provide
cleaning
materials at
the livestock
sale yards on
market days
All
saley
ards
-Revenue
Department
-Health
Department
-Reduced
COVID-19
infections
hence healthy
households
Throughout
short rains
period
Health
Sub
County
Intervention Ward No. of
beneficiaries
Proposed
Implementers
Required
Resources
Available
Resources
Time Frame
All sub-
counties
Advise all
market
participants
to adhere to
COVID-19
measures
All
wards
-Leaders
-Extension
workers
-Revenue
collectors
-Health
workers
-Reduced
COVID-19
infections
hence
healthy
households
Negligible Throughout
short rains
period
24
All sub-
counties
Provide
cleaning
materials at
the livestock
sale yards on
market days
All
saleyards
-Revenue
Department
-Health
Department
-Reduced
COVID-19
infections
hence
healthy
households
Throughout
short rains
period
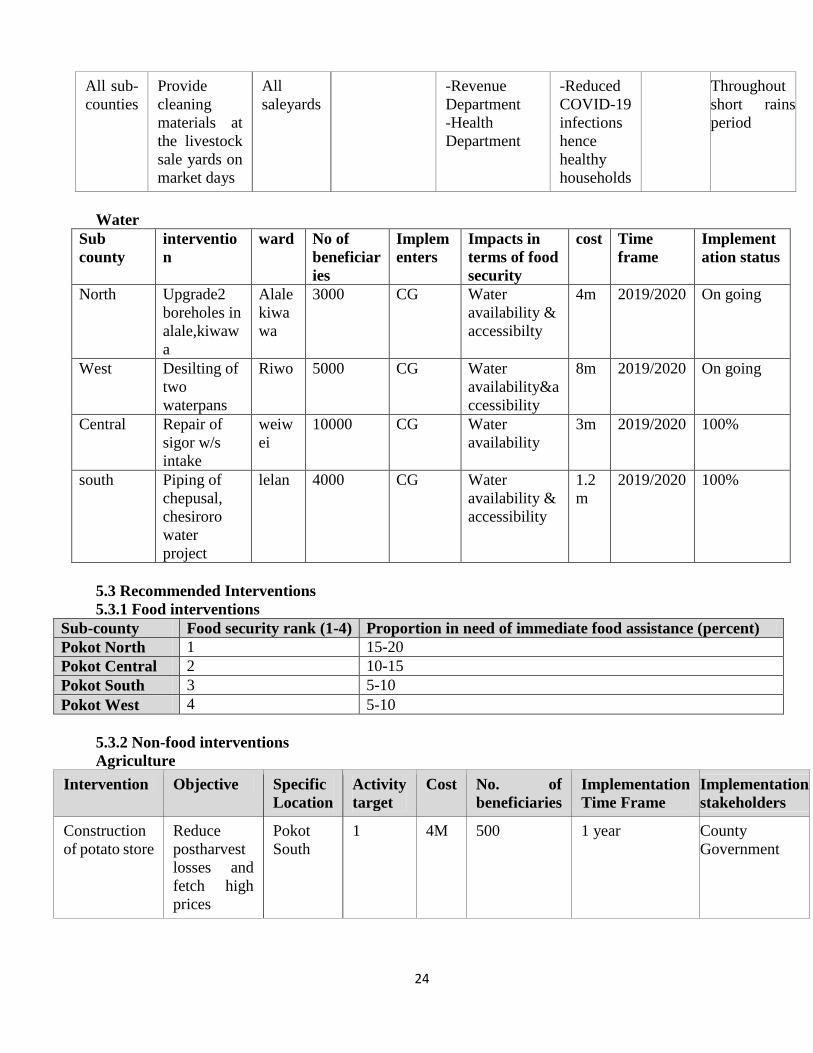
Water
Sub
county
interventio
n
ward No of
beneficiar
ies
Implem
enters
Impacts in
terms of food
security
cost Time
frame
Implement
ation status
North Upgrade2
boreholes in
alale,kiwaw
a
Alale
kiwa
wa
3000 CG Water
availability &
accessibilty
4m 2019/2020 On going
West Desilting of
two
waterpans
Riwo 5000 CG Water
availability&a
ccessibility
8m 2019/2020 On going
Central Repair of
sigor w/s
intake
weiw
ei
10000 CG Water
availability
3m 2019/2020 100%
south Piping of
chepusal,
chesiroro
water
project
lelan 4000 CG Water
availability &
accessibility
1.2
m
2019/2020 100%
5.3 Recommended Interventions
5.3.1 Food interventions
Sub-county Food security rank (1-4) Proportion in need of immediate food assistance (percent)
Pokot North 1 15-20
Pokot Central 2 10-15
Pokot South 3 5-10
Pokot West 4 5-10
5.3.2 Non-food interventions
Agriculture
Intervention Objective Specific
Location
Activity
target
Cost No. of
beneficiaries
Implementation
Time Frame
Implementation
stakeholders
Construction
of potato store
Reduce
postharvest
losses and
fetch high
prices
Pokot
South
1 4M 500 1 year County
Government

25
Control of
Desert Locust
Reduce
damage to
crops and
pastures
All
wards
invaded
- 5M All farmers
and
pastoralists
2 Months National
Government,
County
government,
Stakeholders
Soil and water
conservation
To conserve
environment
and its
resources
Pokot
south
and
Central
Sub
counties
- 10M - 3months National
Government,
County
government,
Stakeholders
Rehabilitation
of irrigation
infrastructure
Bring back
scheme to is
optimal
agricultural
production
levels
Pokot
Central
and
Pokot
South
- - - 1 year County
Government,
NG,Others
Enhance
subsidized
land
preparation
services
To reduce
land
preparation
cost
County
wide
1440 Ha 5M 720 Continuous County
Government
Livestock
Sub
County
Intervention Ward No. of
beneficiaries
Proposed
Implementers
Required
Resources
Available
Resources
Time Frame
All sub-
counties
Advise all
market
participants
to adhere to
COVID-19
measures
All
wards
-Leaders
-Extension
workers
-Revenue
collectors
-Health
workers
-Reduced
COVID-19
infections
hence
healthy
households
Negligible Throughout
short rains
period
All sub-
counties
Provide
cleaning
materials at
the livestock
sale yards on
market days
All
saleyards
-Revenue
Department
-Health
Department
-Reduced
COVID-19
infections
hence
healthy
households
Throughout
short rains
period
Health and Nutrition
Immediate Recommended Interventions
Sub
County/Ward
Interve
ntion
Loca
tion
No. of
beneficiaries
Proposed
Implementers
Required
Resources (Ksh)
Available
Resources
Time
Frame
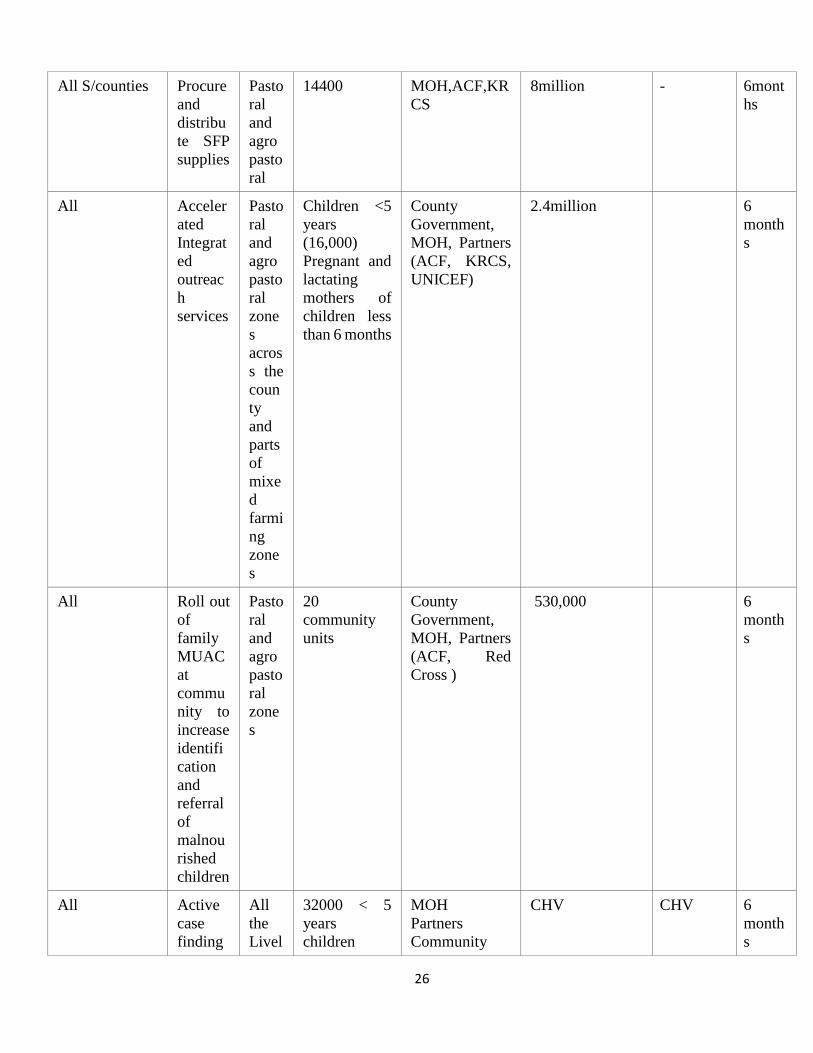
26
All S/counties Procure
and
distribu
te SFP
supplies
Pasto
ral
and
agro
pasto
ral
14400 MOH,ACF,KR
CS
8million - 6mont
hs
All Acceler
ated
Integrat
ed
outreac
h
services
Pasto
ral
and
agro
pasto
ral
zone
s
acros
s the
coun
ty
and
parts
of
mixe
d
farmi
ng
zone
s
Children <5
years
(16,000)
Pregnant and
lactating
mothers of
children less
than 6 months
County
Government,
MOH, Partners
(ACF, KRCS,
UNICEF)
2.4million 6
month
s
All Roll out
of
family
MUAC
at
commu
nity to
increase
identifi
cation
and
referral
of
malnou
rished
children
Pasto
ral
and
agro
pasto
ral
zone
s
20
community
units
County
Government,
MOH, Partners
(ACF, Red
Cross )
530,000 6
month
s
All Active
case
finding
All
the
Livel
32000 < 5
years
children
MOH
Partners
Community
CHV CHV 6
month
s
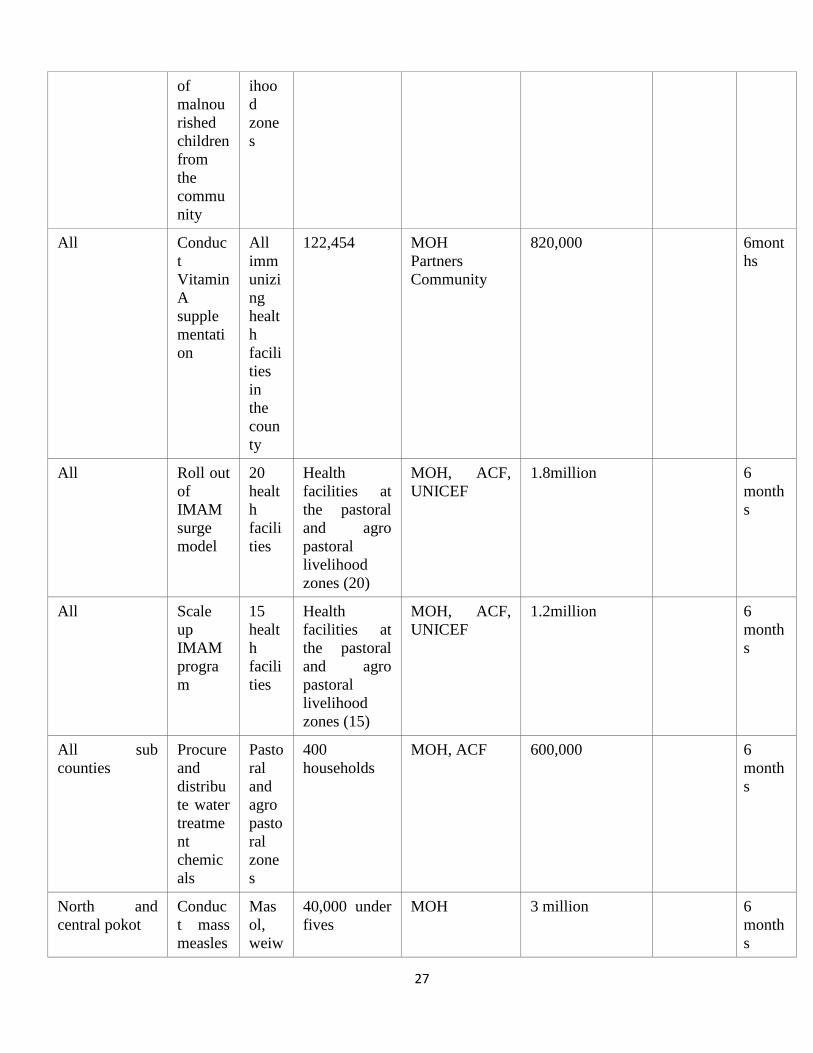
27
of
malnou
rished
children
from
the
commu
nity
ihoo
d
zone
s
All Conduc
t
Vitamin
A
supple
mentati
on
All
imm
unizi
ng
healt
h
facili
ties
in
the
coun
ty
122,454 MOH
Partners
Community
820,000 6mont
hs
All Roll out
of
IMAM
surge
model
20
healt
h
facili
ties
Health
facilities at
the pastoral
and agro
pastoral
livelihood
zones (20)
MOH, ACF,
UNICEF
1.8million 6
month
s
All Scale
up
IMAM
progra
m
15
healt
h
facili
ties
Health
facilities at
the pastoral
and agro
pastoral
livelihood
zones (15)
MOH, ACF,
UNICEF
1.2million 6
month
s
All sub
counties
Procure
and
distribu
te water
treatme
nt
chemic
als
Pasto
ral
and
agro
pasto
ral
zone
s
400
households
MOH, ACF 600,000 6
month
s
North and
central pokot
Conduc
t mass
measles
Mas
ol,
weiw
40,000 under
fives
MOH 3 million 6
month
s
28
vaccina
tion
ei,
kiwa
wa,
Alale
,Sua
m,
kony
ao
ward
s
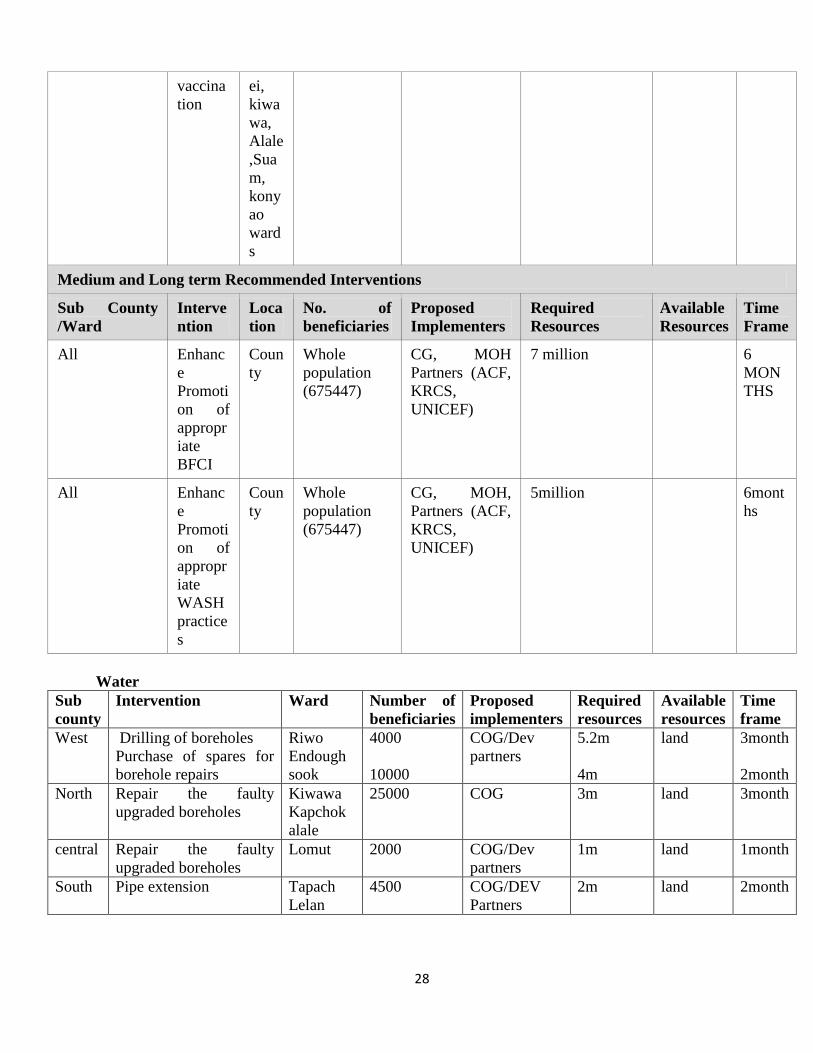
Medium and Long term Recommended Interventions
Sub County
/Ward
Interve
ntion
Loca
tion
No. of
beneficiaries
Proposed
Implementers
Required
Resources
Available
Resources
Time
Frame
All Enhanc
e
Promoti
on of
appropr
iate
BFCI
Coun
ty
Whole
population
(675447)
CG, MOH
Partners (ACF,
KRCS,
UNICEF)
7 million 6
MON
THS
All Enhanc
e
Promoti
on of
appropr
iate
WASH
practice
s
Coun
ty
Whole
population
(675447)
CG, MOH,
Partners (ACF,
KRCS,
UNICEF)
5million 6mont
hs
Water
Sub
county
Intervention Ward Number of
beneficiaries
Proposed
implementers
Required
resources
Available
resources
Time
frame
West Drilling of boreholes
Purchase of spares for
borehole repairs
Riwo
Endough
sook
4000
10000
COG/Dev
partners
5.2m
4m
land 3month
2month
North Repair the faulty
upgraded boreholes
Kiwawa
Kapchok
alale
25000 COG 3m land 3month
central Repair the faulty
upgraded boreholes
Lomut 2000 COG/Dev
partners
1m land 1month
South Pipe extension Tapach
Lelan
4500 COG/DEV
Partners
2m land 2month