Embed Size (px)
Citation preview

WEST RAND DISTRICT MUNICIPALITY
INTEGRATED DEVELOPMENT PLAN 2016/17 TO 2020/21 Revised in
2020/21
PREPAREDIN-HOUSE: West Rand District Municipalit, Private Bag x 033, Randfontein
1
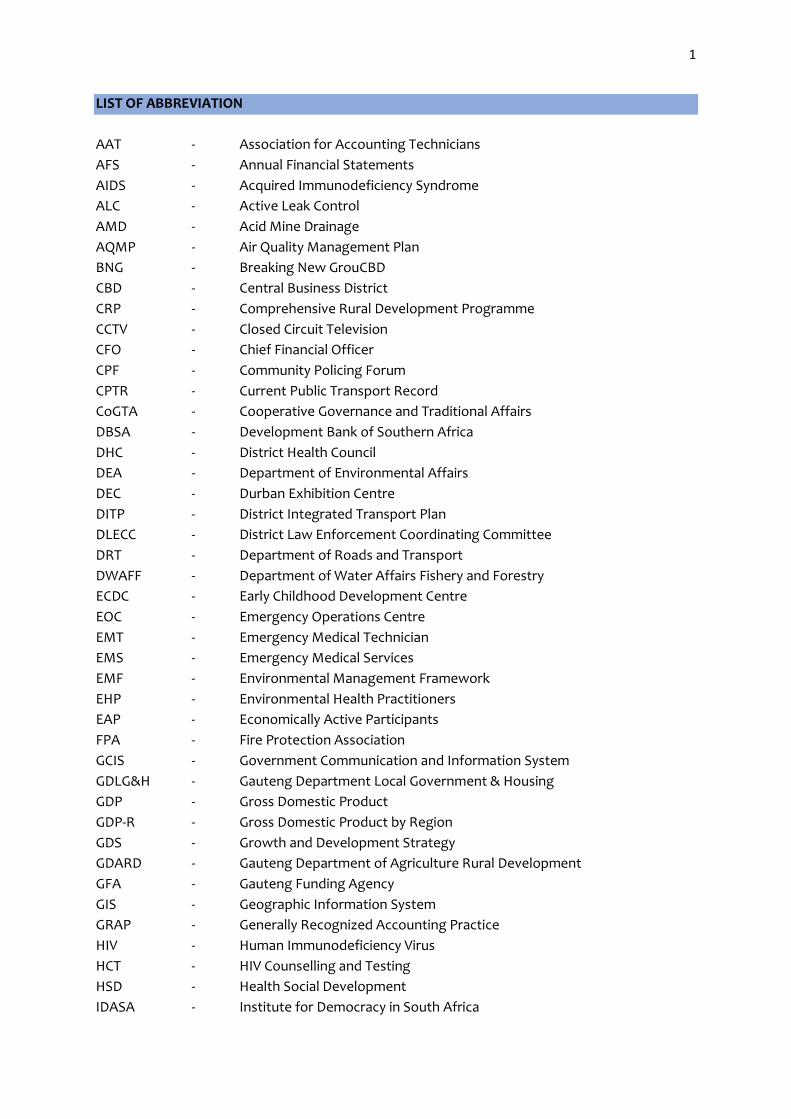
LIST OF ABBREVIATION
AAT - Association for Accounting Technicians
AFS - Annual Financial Statements
AIDS - Acquired Immunodeficiency Syndrome
ALC - Active Leak Control
AMD - Acid Mine Drainage
AQMP - Air Quality Management Plan
BNG - Breaking New GrouCBD
CBD - Central Business District
CRP - Comprehensive Rural Development Programme
CCTV - Closed Circuit Television
CFO - Chief Financial Officer
CPF - Community Policing Forum
CPTR - Current Public Transport Record
CoGTA - Cooperative Governance and Traditional Affairs
DBSA - Development Bank of Southern Africa
DHC - District Health Council
DEA - Department of Environmental Affairs
DEC - Durban Exhibition Centre
DITP - District Integrated Transport Plan
DLECC - District Law Enforcement Coordinating Committee
DRT - Department of Roads and Transport
DWAFF - Department of Water Affairs Fishery and Forestry
ECDC - Early Childhood Development Centre
EOC - Emergency Operations Centre
EMT - Emergency Medical Technician
EMS - Emergency Medical Services
EMF - Environmental Management Framework
EHP - Environmental Health Practitioners
EAP - Economically Active Participants
FPA - Fire Protection Association
GCIS - Government Communication and Information System
GDLG&H - Gauteng Department Local Government & Housing
GDP - Gross Domestic Product
GDP-R - Gross Domestic Product by Region
GDS - Growth and Development Strategy
GDARD - Gauteng Department of Agriculture Rural Development
GFA - Gauteng Funding Agency
GIS - Geographic Information System
GRAP - Generally Recognized Accounting Practice
HIV - Human Immunodeficiency Virus
HCT - HIV Counselling and Testing
HSD - Health Social Development
IDASA - Institute for Democracy in South Africa

2
IDP - Integrated Development Plan
ICT - Information Communication Technology
ICD - Integrated Community Development
IGR - Intergovernmental Relations
IMATU - Independent Municipal and Allied Trade Union
ISPMTT - Intervention Support Projects Monitoring Task Team
IT - Information Technology
ITS - Information Technology Support
IWMP - Integrated Waste Management Plan
KPI - Key Performance Indicator
LED - Local Economic Development
LM - Local Municipality
MFMA - Municipal Financial Management Act, Act No. 56 of 2003
MHS - Municipal Health Services
MIG - Municipal Infrastructure Grant
MLAP - Management Letter Action Plan
MMC - Member of Mayoral Committee
MMMTT - Municipal Mitigation Monitoring Task Team
MPAC - Municipal Public Accounts Committee
MSA - Municipal Systems Act, Act No. 32 of 2000
MSIG - Municipal Service Infrastructure Grant
NDFG - Neighbourhood Development Fund Grant
NDP - Neighbourhood Development Programme
NDP - National Development Plan
NEMWA - National Environmental Management Waste Act
NEMA - National Environmental Management Act
NGO - Non-Governmental Organization
NSDP - National Spatial Development Perspective
NT - National Treasury
NNR - National Nuclear Regulator
NYS - National Youth Services
OLS - Operating Licence Strategy
OPCA - Operation Clean Audit
PCF - Premier’s Coordinating Forum
PHC - Primary Health Care
PIER - Public Information Education Relations
PMS - Performance Management System
RMC - Risk Management Committee
PSO - Project Support Office
RTO - Regional Tourism Organization
RWG - Rail Working Group
SODA - State of the District Address
SALGA - South African Local Government Association
SAMWU - South African Municipal Workers Union
SANS - South African National Standard
3
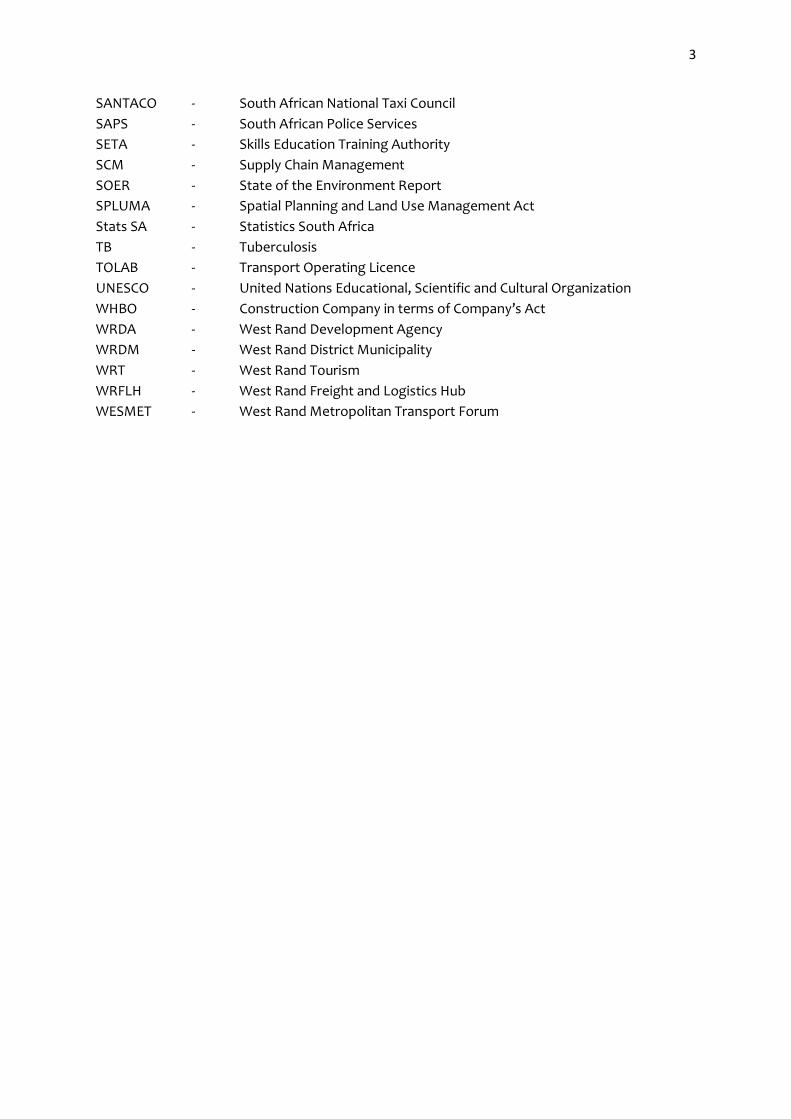
SANTACO - South African National Taxi Council
SAPS - South African Police Services
SETA - Skills Education Training Authority
SCM - Supply Chain Management
SOER - State of the Environment Report
SPLUMA - Spatial Planning and Land Use Management Act
Stats SA - Statistics South Africa
TB - Tuberculosis
TOLAB - Transport Operating Licence
UNESCO - United Nations Educational, Scientific and Cultural Organization
WHBO - Construction Company in terms of Company’s Act
WRDA - West Rand Development Agency
WRDM - West Rand District Municipality
WRT - West Rand Tourism
WRFLH - West Rand Freight and Logistics Hub
WESMET - West Rand Metropolitan Transport Forum
4
Table of Contents
SECTION A: 1. VISION, MISSION AND CORE VALUES ........................................................... 7
1.1 WEST RAND DISTRICT MUNICIPALITY CONTEXTUALISATION ....................................... 8
SECTION B: 1.2 DEMOGRAPHIC PROFILE OF THE MUNICIPALITY (SITUATIONAL ANALYSIS) ........................................................................................................................... 10
SECTION C: 1.3 PROCESS FOLLOWED IN DEVELOPING THE IDP ........................................ 27
SECTION D: 1.4 POWERS AND FUNCTIONS OF THE MUNICIPALITY .................................. 31
SECTION E: 1.5 SERVICE DELIVERY LANDSCAPE – DEVELOPMENT PRIORITY ................... 32
SECTION F: 1.6 DISTRICT DEVELOPMENT MODELLING INTERVENTION ............................ 44
SECTION G: DEVELOPMENT STRATEGIES .......................................................................... 53
1.7. Electricity Commission (Development Strategy – Electricity) .................................... 53
1.7.3. Game Changers / Strategic Projects (Electricity) ................................................................. 64
1.7.4. Key Risks & Challenges (Electricity)...................................................................................... 68
1.7.5. General Comments / Requests (Electricity) .......................................................................... 70
1.8 Water and Sanitation Commission (Development Strategy – Water and Sanitation) 72
1.8.2. Target/measures to be achieved over the next 5 years (Water & Sanitation) .................. 80
1.8.3. Game Changers /Strategic Projects (Water & Sanitation) .................................................. 85
1.8.4. Key Risk & Challenges (Water & Sanitation) ....................................................................... 88
1.8.5. General Comments Request (Water & Sanitation) ............................................................. 91
1.9. Roads, Transport and Storm Water Commission (Development Strategy – Roads, Transport and Storm Water) .............................................................................................. 95
1.9.1 Service Delivery Backlogs (Roads, Transport and Stormwater) ............................. 96
1.9.2. Target/measures to be achieved over the next 5 years (Roads, Transport and
Stormwater) .................................................................................................................................. 100
1.9.3. Game Changers / Strategic Projects (Roads, Transport and Stormwater) ...................... 105
1.9.4. Key Risks & Challenges (Roads, Transport and Stormwater) .......................................... 109
1.9.5. General Comments / Requests (Roads, Transport and Stormwater) ............................... 113
1.10. Human Settlement Commission (Development Strategy – Human Settlement) .... 116
1.10.1 Service Delivery Backlogs (Human Settlements) .............................................................. 117
1.10.2. Target/measures to be achieved over the next 5 years (Human Settlements) ............. 125
1.10.3. Game Changers / Strategic Projects (Human Settlements) ............................................. 129
1.10.4. Key Risks & Challenges (Human Settlements) ................................................................. 132
1.10.5. General Comments / Requests (Human Settlements) ............................................ 134

5
1.11. Regional Re-industrialisation Commission (Development Strategy - Regional Re-industrialisation) .............................................................................................................. 136
1.11.2 Target/measures to be achieved over the next 5 years (Regional Re-
industrialisation) ........................................................................................................................... 150
1.11.3. Game Changers / Strategic Projects (Regional Re-industrialisation) .............................. 157
1.11.4. Key Risks & Challenges (Regional Re-industrialisation) ................................................... 160
1.11.5. General Comments / Requests (Regional Re-industrialisation) ....................................... 165
1.12. Community Services Commission (Development Strategy – Community Services) ........................................................................................................................... 169
1.12.1 Public Safety ......................................................................................................................... 169
1.12.1.1. Service Delivery Backlogs (Public Safety) ....................................................................... 169
1.12.1.2. Target/measures to be achieved over the next 5 years (Public Safety) ....................... 174
1.12.1.3. Game Changer / Strategic Projects (Public Safety) ........................................................ 177
1.12.1.4. Key Risks & Challenges (Public Safety) ........................................................................... 179
1.12.1.5General Comments / Requests (Public Safety) ................................................................. 180
1.12.2. Community Services: Health & Social Development ........................................................ 182
1.12.2.2. Target/measures to be achieved over the next 5 years (Health and Social
Development) ................................................................................................................................ 190
1.12.2.3. Game Changers / Strategic Projects (Health and Social Development) ...................... 197
1.12.2.4. Key Risks & Challenges (Health and Social Development) ........................................... 199
1.12.2.5. General Comments / Requests (Health and Social Development) ............................... 202
1.13. Environment Management Commission (Development Strategy – Environmental Management) ................................................................................................................... 206
.13.1. Service Delivery Backlog (Environmental Management) .................................................. 206
1.13.2. Target/measures to be achieved over the next 5 years (Environmental Management)
........................................................................................................................................................ 211
1.13.3. Game Changers / Strategic Projects (Environmental Management) .............................. 219
1.13.4. Key Risks & Challenges (Environmental Management) .................................................. 225
1.13.5. General Comments / Requests (Environmental Management) ....................................... 227
1.14. Consolidated Support Services Dashboard (Development Strategy – Support Services) ........................................................................................................................... 229
Regional Outcome 2: Accountable Municipal Administration ................................................... 229
Regional Outcome 3: Skilled, Capacitated, Competent and Motivated Workforce ................. 230
Regional Outcome 4: Ethical Administration & Good Governance ........................................... 230
Regional Outcome 13: Robust Financial Administration ............................................................ 231
Regional Outcome 14: Institutional Planning and Transformation ........................................... 232
Commissions’ inputs towards New Functions and Powers ....................................................... 234
6
SECTION I: 1.15 ASSESSMENT/ANALYSIS OF THE MUNICIPALITY’S STRENGTHS, WEAKNESSES, OPPORTUNITIES AND THREATS (SWOT) ................................................ 418
SECTION J: 1.16. WRDM HIGH LEVEL ORGANISATIONAL STRUCTURE ............................. 420
SECTION K: 1.17 CONSTITUENT LOCAL MUNICIPALITIES PRIORITIES / NEEDS / PROJECTS / PROGRAMMES .................................................................................................................. 421
1.17.1 MOGALE CITY LOCAL MUNICIPALITY ...................................................................... 421
1.17.2 RAND WEST CITY LOCAL MUNICIPALITY ................................................................ 421
1.17.3 MERAFONG CITY LOCAL MUNICIPALITY ................................................................. 424
........................................................................................................................................................ 424
Community Priorities 2020 – 2021 ................................................................................................ 424
SECTION L: 1.18 IDP VERTICAL ALIGNMENT: SECTOR PROJECTS AND PROGRAMMES: 429
SECTION N: 1.20 2020/21 DRAFT BUDGET REPORT ........................................................... 438
Budget overview ............................................................................................................................ 438
7
SECTION A: 1. VISION, MISSION AND CORE VALUES
The WRDM Vision, Mission and Values were reviewed for relevance, against this, it was agreed to
add Transparency and Accountability to the core values, in order to capture the sceptre of the
whole Good Governance, since only one principles of Good Governance was captured then, which
was Responsibility.
VISION:
Integrating District Governance to achieve a better life for all
MISSION:
To provide an integrated and excellent developmental district governance system in the West
Rand
SLOGAN:
Green is the new Gold
CORE VALUES
Service excellence;
Pride;
Integrity;
Responsibility;
Transparency;
Accountability;
Innovation; and
Teamwork

8
1.1 WEST RAND DISTRICT MUNICIPALITY CONTEXTUALISATION
The West Rand District Municipality (WRDM) is a Category C municipality located in the west of
the Gauteng Province and consists of three local municipalities namely: Mogale City Local
Municipality, Merafong City Local Municipality and Rand West City Local Municipality – is home
to the famous Cradle of the Humankind World Heritage Site and is about 50 minutes from OR
Tambo International Airport. It borders the North West Province and accessibility is easy from all
major Gauteng centres. This region is a great base from which to explore the fascinating and
ancient part of South Africa. The West Rand Region has a rich and diverse landscape with the
lovely Magaliesberg Mountains forming the backdrop. Towns in the region include Krugersdorp,
Randfontein, Westonaria and Carletonville. Each of these is in easy reach of the peaceful
countryside well known for its warm hospitality.
Spatial context
Merafong's historical development is closely-knit with the discovery of rich gold deposits in the
early 1930s. Fochville is the oldest town in the region, and was declared a town in 1951. The town
Carletonville was named after Guy Carleton Jones, an engineer from the Gold Fields Ltd mining
company, who played a prominent role in the discovery of the West Wits gold field, of which
Carletonville forms a part. The mining company decided, in November 1946, to establish the town.
Carletonville was proclaimed in 1948 and attained Town Council Status on 1 July 1959. Formerly a
cross-border municipality, the entire municipality was transferred to the North West Province
following the abolition of cross-border municipalities by an amendment to the South African

9
Constitution in 2005. The municipality was part of the North West Province from 2005 to 2009,
when it was reincorporated into the Gauteng Province by another amendment to the
Constitution, following often-violent protests in the township of Khutsong.
An urban concentration is found in the south-eastern part around Krugersdorp and Kagiso. The
Krugersdorp CBD is the main business, social and administration centre and fulfils a regional
function. The areas around Krugersdorp are established middle-to-high income residential areas
with the full range of urban amenities, services and facilities. The areas to the south of
Krugersdorp, namely Kagiso, Azaadville and Rietvallel (referred to as the Kagiso complex), are
predominantly disadvantaged settlements with more limited access to service and facilities. The
Kagiso complex is physically separated from Krugersdorp’s urban areas by an extensive mining
belt that runs roughly in an east-west direction through the area. In the 2015/16 annual report of
Mogale City, it was indicated that the municipality has 99 urban formal settlement.
In terms of overall spatial structure, Rand West City has three distinct separate precincts: the
urban residential and economic core, the mining precinct and agricultural land. The west of Rand
West City is characterized by extensive farmland and agricultural holdings containing a rural
residential node known as Badirile. The Rand West City Local Municipality is characterised by
dispersed urban structures consisting of various urban areas and mining villages spread across
the entire municipal area. The rural areas consist of a large number of farms, as well as agricultural
holdings. There is very limited scope for new development north of the ridge due to dolomitic
conditions. The established settlements e.g. Westonaria, Simunye, Bekkersdal and Venterspost
cannot be expanded / can only be expanded in a very limited way.
The strategic location of the WRDM in relation to the Gauteng Province creates a huge potential
for the agriculture sector to grow and stimulate economic development in the region. The
advantage held by farmers within the West Rand is their close proximity to the largest consumer
market of perishable goods in South Africa (i.e. City of Tshwane and City of Johannesburg),
coupled with the fact that the region has areas with good to excellent agricultural potential.
Furthermore, the region possesses the potential to develop agro-processing within its borders,
as the majority of required resources are available. Mining is still a very important economic
sector in the West Rand, both in terms of production and employment and its influence in the
economy of the West Rand is still to be felt for many years to come. Therefore it’s critical that the
mining sector be used as a catalyst for developing other economic activities within the region.

10
SECTION B: 1.2 DEMOGRAPHIC PROFILE OF THE MUNICIPALITY (SITUATIONAL ANALYSIS)
Note: The statistical data used during the compilation of this report was sourced from different
sources and therefore, some information is subject to revision.
THE WEST RAND REGION PROFILE
The Birthplace of Mankind
Known as the residency of human evolution, the West Rand is the epitome of beauty and
inimitability. The Beauty of West Rand stems beyond tourist attraction, it has fascinated the
academics and researchers both local and international because its history echoing of the past,
present and the future. Beneath the soil of the West Rand, lies the predetermination of the
human nature: the Strekkfontein Caves in the Mogale City Local Municipality. The Caves have
harboured a 2.2 million old Mrs Ples’s skull whom the fossil has been pedagogically placed in the
Cradle of Humankind for academic purposes as revealed in April 1947 by Dr. Robert Broom along
with students from the University of the Witwatersrand. While the Mrs. Ples skull was small, about
the size of a chimpanzee's, it was apparent the creature stood upright. 'Mrs. Ples' earned her
nickname from the media after Dr. Broom originally identified the species as a new one,
Plesianthropus transvaalensis, though it was later identified as Australopithecus africanus. Stw 573,
nicknamed “Little Foot”, is a nearly complete Australopithecus was also found at the Sterkfontein
Caves between 1994 and 1998. It is due to the structure of the 4 ankle bones that scientists were
able to dissert that the owner was able to walk upright. The recovery of the bones proved
extremely difficult and tedious, because they are completely embedded in concrete-like rock. It
is due to this that the recovery and excavation of the site took around 15 years to complete.

11
In the West Rand Region, under Mogale City’s starry sky lays the Dinaledi chamber ("chamber of
stars") where a fossil by the name of Karabo was discovered a decade ago and later a much more
recent discovery was found. Homo Naledi, an extinct species of homonin was discovered in the
Rising Star Cave System. As of 10 September 2015, 1550 specimens have been extracted including
Karabo who was also discovered in from the Rising Star Cave in the Cradle of Humankind. Homo
Naledi’s name was derived from the Sotho language, where the word.
1.2.1 Population profile NB! Population numbers are valid for a decade. New Census count will be conducted in 2021. The stats are relied in between
the first five year count thus some projections emit from the second five year predictions
Demographic statistics are essential for planning in both the country and its regions. The West
Rand District population is 6.3 percent of the Gauteng Province, which makes it the least
populated region in the province, with less than million residents.
Figure 1: West Rand Population Pyramid

12
Source: IHS Markit, 2017
Figure Figure 1 shows the population pyramid for the West Rand District between 2010 and 2016
as expounded by the StatsSA during the national census count.The figure shows a similar
structure as that of the Gauteng Province and the country as whole. It indicates that there is a
youth population bulge, which also represents most of the working age population of the region.
It is beneficial for a region to have a majority of its population falling within the working age
group, however, this has to be accompanied by higher levels of economic growth and
employment. Low growth in economic activity as indicated in Figure 5, further down, may create
socio-economic challenges such as poverty and inequality.
Figure 2: Total Population for the District and its Locals
Source: IHS Markit, 2017
Figure 2 expands on the population pyramid and shows total population for the District and its
Local Municipalities between 2011 and 2016. The District’s population remains below a million
mark, and the largest share resides in Mogale City. The figure shows a rising trend for all the
regions with the exception of Merafong City.

13
1.2.2.1. NATALITY RATE
As of the year 2017 the WRDM registered 7707 births around the region. This includes the local
municipalities as well. The number was stated by the Stats SA which the information was withheld
until 27 August 2018 (StatsSA, 2018:35).
1.2.3 MORTALITY
This section looks at mortality and fertility in the West Rand District and its local municipalities.
Figure 1.1.3: Crude Death Rate, West Rand District, 2003, 2009 & 2013*
Figure 1.1.3 shows crude death rates for the local municipalities of the West Rand district for the
year 2017. At 24.9 per 1,000 of its population, Mogale City had the lowest death rate in 2017; it at
25.5 in 2017. Rand West had the death rate of 23.8 for 2017. The death rate in Merafong City in
2017 is 25.0.
West Rand DM Mogale City RandWest Merafong City
Male 25,44402797 23,34586505 28,65142932 25,11122096
Female 24,39646231 27,98659782 18,68038912 24,99629389
Total 24,93936279 25,62626347 23,86352097 25,05785229
05
101520253035
Death Mortality Rate

14
Figure 1.2.4: HIV+ Estimates, West Rand District, 2015
Definition of disease and illness accrording to World Health Organization (WHO), disease refers to the affliction of a specific organ or the entire body due to a harmful microorganism such as bacteria or virus, injury, chemical imbalances in the body, exposure to toxins, and production of immature cells. Illness, on the other hand, is the reaction of the body to the disease. Figure 1.2.4 depicts the HIV estimates as well as the other diseases and illnesses in the District.
Figure 1.2.4 shows the estimation percentage of people living with HIV in the West Rand District Municipalities for the years 2015. 1.2.5 DEVELOPMENT INDICATORS
Development indicators provide a tool with which regions are able to track progress on their
developmental goals and objectives. This section provides analysis of both poverty and the Gini-
coefficient. In this section, poverty is dissected into two forms, the absolute (living under R417
per month) and reletive poverty (above R417 per month) The Gini co-efficient measures the
extent to which the distribution of income among individuals or households within an economy
deviates from a perfectly equal distribution. Thus a Gini co-efficient of 0 represents perfect
equality, while an index of 1 implies perfect inequality.

15
Figure 1.2.5: Number of People below Food Poverty Line, 2010 – 2015
Source: IHS Markit, 2017
Figure 1.2.5 shows the number of people living below the food poverty line in the West Rand and
its local municipalities for 2010 and 2015. The figure indicates a rising trend in all the regions
between the two review periods. Mogale City recorded the largest numbers in both periods,
which may indicate that poverty tends to be high in regions with higher economic activity as
people migrate to such regions for better economic and living conditions. This migration is often
accompanied with high unemployment and people that are unable to provide for their needs.
Figure 1.2.6: Gini Coefficient, 2010 & 2015
Source: IHS Markit, 2017
The Gini co-efficient indicates more or less similar trends to that of poverty. The economic hub of
the District, Mogale City, has highest level of income inequality. With the largest share of the
District’s population, it has the largest concentration of levels of income inequality at 0.64,
followed by the newly merged of the Rand West City local Municipality at 0.60.
West Rand Mogale City Rand West City Merafong City
2010 104 806 46 427 35 324 23 054
2015 125 335 59 301 40 166 25 868
10 000
30 000
50 000
70 000
90 000
110 000
130 000
150 000
2010 2015
0,52 0,54 0,56 0,58 0,60 0,62 0,64 0,66
West Rand
Mogale City
Rand West City
Merafong City
West Rand Mogale City Rand West City Merafong City
2010 0,62 0,64 0,60 0,57
2015 0,62 0,64 0,60 0,58
2010 2015

16
1.2.6 DISTRICT ECONOMIC ACTIVITY
The global economic trends continue to affect South Africa, Gauteng and its region’s outlook. The
commodity price slump has also affected economies of commodity exporting countries including
South Africa. The West Rand, with its economy dominated by mining & quarrying activities, is also
affected by such global events.
Figure 1.2.6: Growth in Economic Activity, 2010 - 2016
Source: IHS Markit, 2017
Figure 1.2.6 shows growth in economic activity for the West Rand and it’s Local Municipalities
from 2010 to 2016. The figure indicates that Mogale City recorded positive growth rates from 2010
to 2013, the Rand West City did so for 2013 and 2014 only. Economic growth remained in negative
territory for the district and the rest of the local municipalities for most parts of the review years.
Merafong City, the growth rate has been negative throughout the review period.
Table 1: Sectors Share of the Regional Total, 2016
-15%
-10%
-5%
0%
5%
10%
2010 2011 2012 2013 2014 2015 2016
West Rand Mogale City Rand West City Merafong City
West
Rand
Mogale City Rand West
City
Merafong City
Agriculture, forestry &
fishing
Mining & quarrying
1,7%
28,6%
2,4%
4,9%
1,2%
47,6%
1,3%
33,8%
Primary Sector 30.0% 7.3% 48.8% 35
Manufacturing 13,6% 24,4% 11,9% 4,2%
Electricity, gas & water 4,4% 7,5% 3,4% 2,2%
Construction 3,1% 4,1% 2,6% 2,6%
West
Rand
Mogale City Rand West
City
Merafong City
Wholesale & retail trade 11,4% 12,4% 8,9% 12,9%

17
Source: IHS Markit, 2017
Table 1 shows the sector’s share of the region’s total economic activity for 2016. Activities in the
West District remain dominated by the mining & quarrying at 28.6%. The sector is also more
dominant in the Rand West City at 47.6% and Merafong City at 33.8%. In Mogale City,
manufacturing dominates economic activity at 24.4%. To diversify economic activities in all the
Gauteng regions, the Transformation, Modernisation and Re-industrialisation (TMR) pillars
identifies sectors to promote economic development in each of the province’s municipalities
including the West Rand.
1.2.6 LABOUR PROFILE
The National Development Plan (NDP) as the overarching policy document for the country as a
whole, targets creating 11 million jobs by 2030. This however, may prove difficult to achieve as it
was based on an average economic growth rate of 5% a year. Gauteng Province has one of the
highest unemployment rate compared to other provinces, especially in its District Municipalities.
This section looks at the labour profile of the West Rand District and its Local Municipalities.
Figure 1.2.6: Economically Active Population 2010 and 2015
Source: IHS Markit, 2017
Figure 1.2.6 shows the Economically Active Population (EAP) for the District and its Local
Municipalities for 2010 and 2015. With the exception of Merafong City, there has been an increase
in the EAP for the District and the other two Locals. An increase in the EAP must be followed by
a similar increase in employment levels, if not, it may result in high unemployment rates.
West Rand Mogale City Rand West City Merafong City
2010 104 806 46 427 35 324 23 054
2015 125 335 59 301 40 166 25 868
0
20 000
40 000
60 000
80 000
100 000
120 000
140 000
Transport &
communications
7,0% 8,1% 5,2% 7,6%
Finance & business services 12,8% 13,9% 8,1% 16,4%
Government, social &
people services
17,4% 22,2% 11,1% 18,8%
Total Industries 100,0% 100,0% 100,0% 100,0%
18
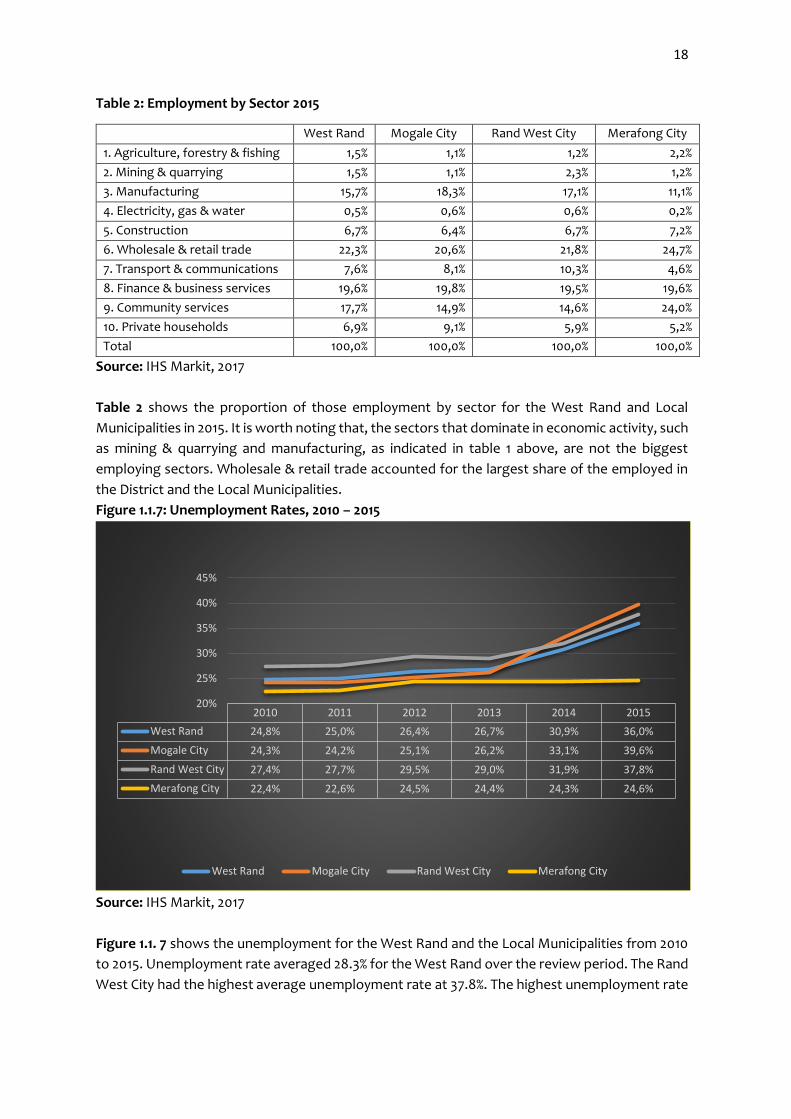
Table 2: Employment by Sector 2015
West Rand Mogale City Rand West City Merafong City
1. Agriculture, forestry & fishing 1,5% 1,1% 1,2% 2,2%
2. Mining & quarrying 1,5% 1,1% 2,3% 1,2%
3. Manufacturing 15,7% 18,3% 17,1% 11,1%
4. Electricity, gas & water 0,5% 0,6% 0,6% 0,2%
5. Construction 6,7% 6,4% 6,7% 7,2%
6. Wholesale & retail trade 22,3% 20,6% 21,8% 24,7%
7. Transport & communications 7,6% 8,1% 10,3% 4,6%
8. Finance & business services 19,6% 19,8% 19,5% 19,6%
9. Community services 17,7% 14,9% 14,6% 24,0%
10. Private households 6,9% 9,1% 5,9% 5,2%
Total 100,0% 100,0% 100,0% 100,0%
Source: IHS Markit, 2017
Table 2 shows the proportion of those employment by sector for the West Rand and Local
Municipalities in 2015. It is worth noting that, the sectors that dominate in economic activity, such
as mining & quarrying and manufacturing, as indicated in table 1 above, are not the biggest
employing sectors. Wholesale & retail trade accounted for the largest share of the employed in
the District and the Local Municipalities.
Figure 1.1.7: Unemployment Rates, 2010 – 2015
Source: IHS Markit, 2017
Figure 1.1. 7 shows the unemployment for the West Rand and the Local Municipalities from 2010
to 2015. Unemployment rate averaged 28.3% for the West Rand over the review period. The Rand
West City had the highest average unemployment rate at 37.8%. The highest unemployment rate
2010 2011 2012 2013 2014 2015
West Rand 24,8% 25,0% 26,4% 26,7% 30,9% 36,0%
Mogale City 24,3% 24,2% 25,1% 26,2% 33,1% 39,6%
Rand West City 27,4% 27,7% 29,5% 29,0% 31,9% 37,8%
Merafong City 22,4% 22,6% 24,5% 24,4% 24,3% 24,6%
20%
25%
30%
35%
40%
45%
West Rand Mogale City Rand West City Merafong City

19
in the district may be partly as a result of low growth in economic activity due to weak mining
sector activities.
In 2018, a total number of 192 000 people were unemployed in West Rand, which is an increase
of 108 000 from 84 800 in 2008. The total number of unemployed people within West Rand
constitutes 9.55% of the total number of unemployed people in Gauteng Province. The West Rand
District Municipality experienced an average annual increase of 8.53% in the number of
unemployed people, which is worse than that of the Gauteng Province, which had an average
annual increase in unemployment of 4.99%.
In 2018, the unemployment rate in West Rand District (based on the official definition of
unemployment) was 45.78%, which is an increase of 21.7 percentage points. The unemployment
rate in West Rand District is higher than that of Gauteng. When comparing unemployment rates
among the local municipalities within West Rand District Municipality, Rand West City Local
Municipality has the highest unemployment rate of 56.4%, which has increased from 27.0% in
2008. It can be seen that the Merafong City Local Municipality had the lowest unemployment rate
of 24.0% in 2018, which increased from 23.5% in 2008.
The declining economic base of the District resulted in the following service delivery challenges:
- Mounting pressure on the financial capacity of municipalities to address service delivery
backlogs;
- Rapid urbanization and resultant growth of informal settlements which encouraged the
increase in housing demands;
- Pressure exerted on existing infrastructure, thereby unable to cope with the demand on
the aging infrastructure;
- Fragmented, autonomic and individual approach to service delivery by municipalities
within the District.
Even though the West Rand region is plaughed by the highest rate of unemplyement in Gauteng,
more of the educational awareness is needed regarding the detrimental economic practices to
the environment as well as the ecology. Below is a transitory analysis of what some economic
activities has led to; the District Municipality’s response as well the locals in undergoing an
educational path to educate the members of the public. A sustainable economic practice is
emphasised.
Merafong City
The Witwatersrand mining belt is characterised by three mining areas called the ‘West’, ‘Central’
and ‘East’ Rand. Creating a landscape of barren and unsafe spaces, mine waste affects common
environmental resources such as air and water. The surfacing of acid mine drainage decant in the
West Rand (in 2002) demonstrates the limited capabilities of the Witwatersrand’s hydrological
and ecological systems to buffer the effects of mine contamination. Mine residue areas constitute
large sections of wasteland in Merafong City, Westonaria, Randfontein, Johannesburg and
Ekurhuleni.

20
Communities live unaware of both the short- and long-term effects of mining waste on their
health and immediate environment. Using contaminated mine water for bathing, watering crops,
recreation, and landscaping` has become an intrinsic part of the lives of those who live beside a
mine dump. Often located close to impoverished communities, the legacy of mine waste
contamination continues to disrupt the lives of the financially vulnerable who have less capacity
to offset the effects of mining waste on their health and wellbeing than their more privileged
compatriots do. Moreover, the said communities are also often located on unstable ground such
as dolomitic land.
2.5.2 Mogale City
The MCLM falls within six (6) quaternary catchments. An east-west watershed dominates the
largest part of the MCLM, which falls within the Limpopo catchment and drains via the Crocodile
River. A small portion to the south of the MCLM, falls within the Vaal catchment and drains via
the Klip River. The major rivers within the MCLM include the Crocodile River, Magalies River,
Hugenote Spruit, Rietspruit, Bloubank River and Muldersdrift se Loop. One of the most significant
pollution risks is the past and existing mining activity within the Mogale City local municipality,
specifically wastewater discharge and solid waste disposal in the form of slimes dams and derelict
sand dumps. Contamination of surface and groundwater resources through radioactive plumes
and dust fall out is a serious concern in the mining nodes. Runoff from sand dumps in the Chamdor
area, situated in the upper catchment of the Klip River, may pollute the Klip River.
Tailings containing iron pyrites (the source of acid-mine drainage) and large amounts of cyanide
have been unlawfully disposed of in a mine pit. Potential catastrophes like the collapse of slime
dams, specifically those next to Kagiso, may result in serious surface water contamination and
loss of life of in the neighbouring communities (e.g. Sinqobile and Kagiso hostels). Sinkholes
develop in river systems due to dolomitic instability, which may cause channeling of surface
pollution into ground water resources. Geological faults and dykes that cross-river systems may
divert surface water pollutants to ground water resources. Septic tanks/french drains are used
where bulk water borne sewage is not available (e.g. in rural areas). Inappropriate subdivisions,
consent uses, rezoning, and township establishments result in a higher pollution risk to ground
water resources.
Mogale City has compiled a draft Integrated Environmental Management Strategy for MCLM has
been, in which issues regarding water quality deterioration are addressed directly. These issues
include inter alia the following:
Mines must comply with Environmental Management Program Reports (EMPR’s);
Development plans that address inter alia water pollution, the provision of basic services
and development beyond the 1:100 year flood line;
Compliance of mines, industry and developers with national legislation e.g. The
Environmental Conservation Act, 1989 (Act 73 of 1989), National Environmental
Management Act (Act 107 of 1998) and local by-laws;
Funding possibilities for the rehabilitation of abandoned or liquidated mining discard
must be investigated;
Ensure no disposal of hazardous waste occurs at the general waste landfill sites;
Develop spillage reporting procedures and remediation programmes.

21
1.2.7 HOUSEHOLD INFRASTRUCTURE AND EDUCATION
Information about access to household amenities remains essential for the purposes of planning
and budgeting for Gauteng and all its municipalities.
Using the StatsSA definition of a household and a dwelling unit, households can be categorised
according to type of dwelling. The categories are:
• Very formal dwellings - structures built according to approved plans, e.g. houses on a
separate stand, flats or apartments, townhouses, rooms in backyards that also have
running water and flush toilets within the dwelling.
• Formal dwellings - structures built according to approved plans, i.e. house on a separate
stand, flat or apartment, townhouse, room in backyard, rooms or flat let elsewhere etc,
but without running water or without a flush toilet within the dwelling.
• Informal dwellings - shacks or shanties in informal settlements, serviced stands, or
proclaimed townships, as well as shacks in the backyards of other dwelling types.
• Traditional dwellings - structures made of clay, mud, reeds, or other locally available
material.
As per the last StatsSA count. West Rand District Municipality had a total number of 137 000
(50.29% of total households) living in very formal dwelling units, 63 200 (23.26% of total
households) living in formal dwelling units and a total number of 47 500 (17.48% of total
households) living in informal dwelling units.
Table 3: Household Infrastructure, 2010 & 2015
West Rand Mogale City Rand West City Merafong City
2010 2015 2010 2015 2010 2015 2010 2015
Formal Housing 68.2% 70.8% 70.6% 69.8% 63.4% 65.4% 69.9% 80.1%
Hygienic Toilets 85.7% 87.0% 87.2% 89.3% 83.3% 84.0% 86.2% 86.6%
Piped Water 90.6% 90.4% 91.6% 92.2% 90.4% 90.9% 89.0% 86.1%
Electricity 80.3% 78.7% 84.4% 81.8% 72.4% 69.7% 83.3% 84.4%
Refuse
Removal 78.4% 82.0% 80.8% 84.4% 77.1% 77.6% 76.2% 83.1%

22
Source: IHS Markit, 2017
Notes: A formal dwelling unit is a structure built according to approved plans. Hygienic toilets
were defined as flush toilets, chemical toilets and pit latrines with a ventilation pipe. Access to
piped water was measured at the RDP level of piped water within the household’s dwelling,
within their yard or within 200 metres of their dwelling.
From 2010 to 2015, household infrastructure in the West Rand improved in three out of five
categories, namely, formal housing, hygienic toilets and refuse removal. The share of households
living in formal housing increased from 68.2% to 70.8%. Mogale City was the only West Rand Local
Municipality where this decreased, from 70.6 to 69.8%. Access to hygienic toilets in the district
rose from 85.7 to 87%. Access to refuse removal by the local authorities increased from 78.4% to
82%. Access to piped water decreased marginally, from 90.6% to 90.4%. This was due to a decrease
in access in Merafong City as access increased in the other two local municipalities. Access to
electrical connections decreased from 80.3% to 78.7%. In this case, it was Mogale City and Rand
West City where access decreased and in Merafong City where it rose.
2010 2015 2010 2015 2010 2015 2010 2015
West Rand Mogale City Rand West City Merafong City
Formal Housing 68,20% 70,80% 70,60% 69,80% 63,40% 65,40% 69,90% 80,10%
Hygienic Toilets 85,70% 87,00% 87,20% 89,30% 83,30% 84,00% 86,20% 86,60%
Piped Water 90,60% 90,40% 91,60% 92,20% 90,40% 90,90% 89,00% 86,10%
Electricity 80,30% 78,70% 84,40% 81,80% 72,40% 69,70% 83,30% 84,40%
Refuse Removal 78,40% 82,00% 80,80% 84,40% 77,10% 77,60% 76,20% 83,10%
0,00%10,00%20,00%30,00%40,00%50,00%60,00%70,00%80,00%90,00%
100,00%
Household Infrastructure, 2010 & 2015

23
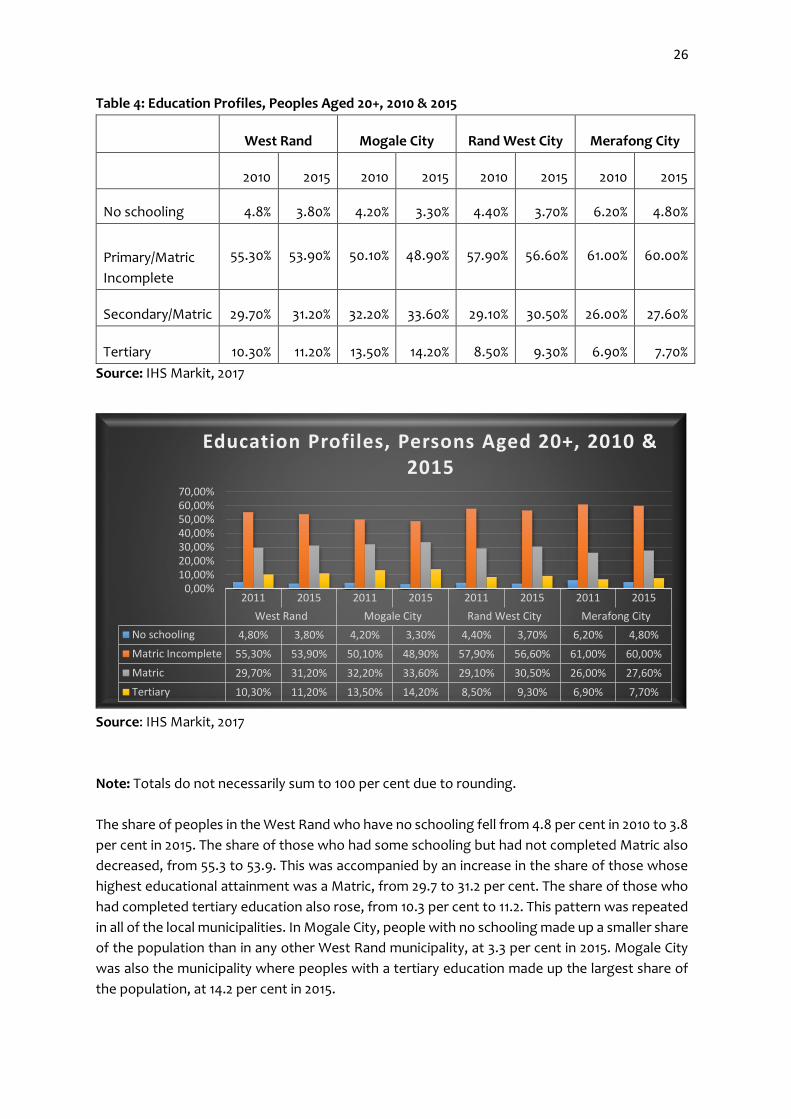
Table 4: Education Profiles, Peoples Aged 20+, 2011 & 2016
West Rand Mogale City Rand West City Merafong City
2011 2016 2011 2016 2011 2016 2011 2016
No schooling 4.8% 8.2% 4.2% 7% 4.4% 8.9% 6.2% 10.2%
Primary/Matric
Incomplete
55.3% 9.6% 50.1% 8.3% 57.9% 10.2% 61.0% 12%
Secondary/Matric 29.7% 75.6% 32.2% 75.9% 29.1% 77.7% 26.0% 72.2%
Tertiary 10.3% 6.6% 13.5% 8.9% 8.5% 3.5% 6.9% 5.7%
Source: IHS Markit, 2017
Source: IHS Markit, 2017
Note: Totals do not necessarily sum to 100 per cent due to rounding.
The share of peoples in the West Rand who have no schooling fell from 4.8% in 2010 to 3.8% in
2015. The share of those who had some schooling but had not completed Matric also decreased,
from 55.3% to 53.9%. This was accompanied by an increase in the share of those whose highest
educational attainment was a Matric, from 29.7% to 31.2%. The share of those who had completed
tertiary education also rose, from 10.3% to 11.2%. This pattern was repeated in all of the Local
Municipalities. In Mogale City, peoples with no schooling made up a smaller share of the
population than in any other West Rand Municipality, at 3.3% in 2015. Mogale City was also the
Municipality where peoples with a tertiary education made up the largest share of the population,
at 14.2% in 2015.
2011 2015 2011 2015 2011 2015 2011 2015
West Rand Mogale City Rand West City Merafong City
No schooling 4,80% 3,80% 4,20% 3,30% 4,40% 3,70% 6,20% 4,80%
Matric Incomplete 55,30% 53,90% 50,10% 48,90% 57,90% 56,60% 61,00% 60,00%
Matric 29,70% 31,20% 32,20% 33,60% 29,10% 30,50% 26,00% 27,60%
Tertiary 10,30% 11,20% 13,50% 14,20% 8,50% 9,30% 6,90% 7,70%
0,00%10,00%20,00%30,00%40,00%50,00%60,00%70,00%
Education Profiles, Persons Aged 20+,2010 & 2015

24
1.2.8 ACCESS TO SERVICES
Figure: 1.2.8 Households with Piped Water at or Above RDP
Figure 1.2.8 shows the share of households in the West Rand municipalities with access to water
at or above the RDP-level, from 2012 to 2016 financial year is at 94.4 percentage. The West Rand
households had access to piped water at this level. In all of the West Rand local municipalities,
the percentage of households with access to the service at this level fell, though the marginal in
Westonaria with the highest percentage of 98.2.
With the exception of Westonaria, where population growth was static, these decreases in share
were influenced by rising populations and in-migration percentage. At 97.1 percent, for Merafong
City was the second, which had the highest level of access in 2016. Randfontein’s 88.8 percent.
Westonaria had the highest share of households with access, falling 98.2 percent in 2016. Mogale
City has obtain 93.4 percent in total.
Figure: 1.2.9 Share of Households with Hygienic Toiles
2016
West Rand 94,2%
Mogale City 93,4%
Randfontein 88,8%
Westonaria 98,2%
Merafong City 97,1%
84,0%86,0%88,0%90,0%92,0%94,0%96,0%98,0%
100,0%
Households with Piped Water at or Above RDP
2016
West Rand 85,6%
Mogale City 88,8%
Randfontein 88,0%
Westonaria 66,0%
Merafong City 89,4%
0,0%10,0%20,0%30,0%40,0%50,0%60,0%70,0%80,0%90,0%
100,0%
Share of Households with Hygienic Toiles

25
Figure 1.2.9 shows the percentage of households in the West Rand municipalities with hygienic
toilets. In contrast to access to water, all households in the region saw an increase in access to
proper sanitation. Merafong City had the highest level of access, at 89.4 percent and followed by
Mogale City households which had access of 88.8 percentage. However, household’s access level
is 88.0 percentage, and Rand West is 85.6 percentage.
In 2016, Randfontein households had the highest level of access, at 88.0 percent, followed by
Mogale City at 88.8. However, Access in Mogale City grew to 88.8 percent over the same period,
making it the highest in 2016. At 66.0 percent, a noticeably lower level of access was recorded
for Westonaria in 2016.
Figure: 1.2.10 Share of Households with Formal Refuse Removal
Figure: 1.2.10 how’s the percentage of households in the West Rand municipalities with access to
formal refuse removal in 2016. Access in the West Rand remained static at around 81.6 percent.
In Mogale City is at 83.7 percent, and Merafong City, access is 76.7 percent, Randfontein and
Westonaria for 2016 is 78.0 and Westonaria is found be found with highest percentage of 87.7 of
refuse removal.
1.2.9 EDUCATION PROFILES
This section analyses the education profiles of the local municipalities within West Rand district.
Due to the lack of data, the section only analyses education attainment for the local
municipalities.
2016
West Rand 81,6%
Mogale City 83,7%
Randfontein 78,0%
Westonaria 87,7%
Merafong City 76,7%
70,0%
72,0%
74,0%
76,0%
78,0%
80,0%
82,0%
84,0%
86,0%
88,0%
90,0%
Share of Households with Formal Refuse Removal
26
Table 4: Education Profiles, Peoples Aged 20+, 2010 & 2015
West Rand Mogale City Rand West City Merafong City
2010 2015 2010 2015 2010 2015 2010 2015
No schooling 4.8% 3.80% 4.20% 3.30% 4.40% 3.70% 6.20% 4.80%
Primary/Matric
Incomplete
55.30% 53.90% 50.10% 48.90% 57.90% 56.60% 61.00% 60.00%
Secondary/Matric 29.70% 31.20% 32.20% 33.60% 29.10% 30.50% 26.00% 27.60%
Tertiary 10.30% 11.20% 13.50% 14.20% 8.50% 9.30% 6.90% 7.70%
Source: IHS Markit, 2017
Source: IHS Markit, 2017
Note: Totals do not necessarily sum to 100 per cent due to rounding.
The share of peoples in the West Rand who have no schooling fell from 4.8 per cent in 2010 to 3.8
per cent in 2015. The share of those who had some schooling but had not completed Matric also
decreased, from 55.3 to 53.9. This was accompanied by an increase in the share of those whose
highest educational attainment was a Matric, from 29.7 to 31.2 per cent. The share of those who
had completed tertiary education also rose, from 10.3 per cent to 11.2. This pattern was repeated
in all of the local municipalities. In Mogale City, people with no schooling made up a smaller share
of the population than in any other West Rand municipality, at 3.3 per cent in 2015. Mogale City
was also the municipality where peoples with a tertiary education made up the largest share of
the population, at 14.2 per cent in 2015.
2011 2015 2011 2015 2011 2015 2011 2015
West Rand Mogale City Rand West City Merafong City
No schooling 4,80% 3,80% 4,20% 3,30% 4,40% 3,70% 6,20% 4,80%
Matric Incomplete 55,30% 53,90% 50,10% 48,90% 57,90% 56,60% 61,00% 60,00%
Matric 29,70% 31,20% 32,20% 33,60% 29,10% 30,50% 26,00% 27,60%
Tertiary 10,30% 11,20% 13,50% 14,20% 8,50% 9,30% 6,90% 7,70%
0,00%10,00%20,00%30,00%40,00%50,00%60,00%70,00%
Education Profiles, Persons Aged 20+, 2010 & 2015

27
SECTION C: 1.3 PROCESS FOLLOWED IN DEVELOPING THE IDP
1.3.1. IDP FRAMEWORK PLAN BACKGROUND
In terms of section 34 of the Municipal Systems Act, each district municipality must adopt a
framework for integrated development planning in the area as a whole, and it must be agreed
upon by both local municipalities and district municipality. The IDP framework is therefore
developed to ensure coordination and alignment in the whole IDP process by all role players.
WHAT IS THE FRAMEWORK PLAN?
The function of the Framework Plan is to ensure that the process of the district IDP and local IDPs
are mutually linked and can inform each other, ensuring co-operative governance as contained in
section 41 of the Constitution. The Framework must:
a) Identify the plans and planning requirements binding in terms of national and provincial
legislation and identify those which were omitted in the past IDP process;
b) Identify the matters to be included in the district and local IDPs that require alignment;
c) Specify the principles to be applied and co-ordinate the approach to be adopted;
d) Determine procedures for consultation between the district municipality and the local
municipalities;
e) Determine the procedures to effect amendments to the Framework Plan;
f) Incorporate comments from the MEC and those derived from self-assessments; and
g) Provide guidelines for the Performance Management System (PMS) and Integrated
Development Plan (IDP) implementation and communication plans.
Therefore the Framework Plan is a co-ordination tool for the WRDM to ensure that interrelated
parallel planning processes within the district are coordinated to obtain maximum benefit for the
district as a whole.
The IDP Framework Plan comprises the following:
Elements of the IDP;
Framework programme with time frames;
Mechanisms and procedures for alignment;
Mechanisms and procedures for consultation;
Binding plans and planning requirements at Provincial and National level; and
Procedures and principles for monitoring the planning process and amendment
LEGISLATIVE BACKGROUND
Constitution Act 108 of 1996 - the Constitution mandates that a municipality must undertake
developmentally-orientated planning so as to ensure that it:
a. strives to achieve the objectives of local government set out in section 152;
b. gives effect to its developmental duties as required by section 153;
c. together with other organs of state contributes to the progressive realization of
fundamental rights contained in sections 24, 25, 26, 27 and 29;

28
White Paper - “South Africa has been given a rare and historic opportunity to transform local
government to meet the challenges of the next century”. The White Paper establishes the basis
for a new developmental local government and characterizes it as a system, which is committed
to working with citizens, groups and communities to create sustainable human settlements
which provide for a decent quality of life and meet the social, economic and material needs of
communities in a holistic way.
To achieve developmental outcomes will require significant changes in the way local government
works. The White Paper further puts forward three interrelated approaches which can assist
municipalities to become more developmental:
Integrated development planning and budgeting;
Performance management; and
Working together with local citizens and partners.
Municipal Systems Act 32 of 2000 - the Municipal Systems Act (32 of 2000) is the key legislation
that gives direction and guidance on the development processes of the IDP.
Chapter five of the act details the process as follows:
Section 25(1) mandates that each municipal council must, upon election adopt a single, inclusive
and strategic plan which:
a. links, integrates and co-ordinates plans;
b. aligns the resources and capacity with the implementation of the plan;
Section 27 mandates the district municipality, in consultation with the local municipalities – to
adopt a framework for integrated development planning, which shall bind both the district
municipality and its local municipalities. On the basis of the agreed framework plan, Section 28
mandates that each municipal council must adopt a process plan to guide the planning, drafting
and adoption and reviewing of its integrated development plan.
Local Government: Municipal Planning and Performance Management Regulations, 2001 – The
regulations were issued in 2001so as to develop further guidelines and clarity in the issues of the
IDPs, The Municipal Planning and Performance Management Regulations set out in detail
requirements for Integrated Development Plans.
Municipal Finance Management Act 56 of 2003 - the MFMA (56 of 2003) speaks about promotion
of cooperative governance and makes special emphasis on alignment of the IDP and the Budget.
This is enshrined in chapter 5 of the MFMA (Act 56 of 2003). Consequently, the West Rand District
Municipality, in pursuit of the above legislative directives, presented the IDP framework to guide
its process plans and consequently the IDP plans of both the district itself and the local
municipalities within the area of its jurisdiction.
IDP Process is undertaken in order to achieve the following:
- To inform other components of the municipal business process, including
institutional and financial planning and budgeting; and
- To inform the cyclical intergovernmental planning and budgeting cycles.
- The IDP process will focus and be influenced by the following areas:
29
- Local Government MEC‟s comments;
- Improvement on the IDP/Budget Process based on the previous performance;
- Amendments on the existing documents/newly adopted policies; and
- Adjustment of powers and functions.
As per legislative requirement, an adopted IDP is submitted to the MEC of Local Government for
comments. These comments will be incorporated during the review process to influence the
finalization of the process. However, it is necessary that they are received on time to allow
municipalities’ ample time to process and put them in effect.
In summing up the above, the outlined IDP Framework with timeframes, role players,
mechanisms of alignment and the binding legislations, ensures that the WRDM will table the IDP
and Budget on time. Compliance with the timeframes provided will allow enough time to table
the Draft IDP and Budget on or before March and take it to council for approval on or before in
May each financial year.
The way forward is for all municipalities to prepare Process Plans in concurrence with the District
Framework Plan and set out the following:
HOW the planning process will unfold per municipality;
WHAT actions are required;
WHO will be responsible for implementing these actions;
WHEN will the action have to be implemented; and
WHAT will the actions COST?
The achievement of an aligned IDP process depends on the co-operation of all municipalities in
order to achieve their developmental objectives in a spirit of co-operative governance.
DEVELOPMENT RATIONALE
Two fundamental theories influence the formulation or development of all policies adopted by
all structures of the South African State at all levels. The first theory is that local government
should be a developmental local government i.e. it should be an agent for development of
communities and also the approach to service provision needs to be developmental. The second
theory is that of understanding the space economy in the sense that different geographic spaces
in any country, province or municipality have different social and economic potential. It further
argues that investment should be Target/measureed according to the varying potential.
DEVELOPMENTAL LOCAL GOVERNMENT
A developmental local government is best understood when defined through the developmental
state. A prerequisite to developmental local government is a developmental state, as it never
exists in isolation and always within the framework of a broader state. Ours is not just a
developmental state, but a democratic developmental state. A democratic developmental state
is not only able to transform its economic base by promoting productive, income generating

30
economic activities, but must ensure that economic growth has the resultant effect of improving
the living conditions of the majority of its population.To position a state in such a way that it
realises its intentions to be developmental, it needs to have clearly defined socio-economic
objectives that require active state intervention. According to research, what sets a
developmental state apart from others is that not only is it able to clearly set its development
objectives, it also establishes institutional structures geared to achieve the set objectives.
THE PROCESS OF DEVELOPING THE IDP IS DONE IN THE FOLLOWING FIVE (5) KEY PHASES:
Phase 1 determines the situation of municipalities, their priority issues as well as an
indication on what the plans should be focusing on;
Phase 2 is where development objectives, strategies and vision based on key issues are
formulated;
Phase 3 is derived from the strategies, objectives and vision to inform concrete proposals
for projects to implement these strategies;
Phase 4 is to ensure that all sector plans from within and outside the municipality are
aligned and integrated; and
Phase 5 is the public comments and approval of the plan.

31
SECTION D: 1.4 POWERS AND FUNCTIONS OF THE MUNICIPALITY
The process on re-restoration of functions and powers commenced in December 2016 in the form
of a correspondence received from the Gauteng Member of the Executive Committee (MEC) of
Cooperative Governance and Traditional Affairs and Human Settlement.
To date, the process is led by COGTA, COGTA is still busy with an assessment in terms of the
wayforward.
The WRDM views this process as a low hanging fruit towards implementation of the building
blocks with regards to the initiative of Strengthen of District Municipalities from a District
Development Modelling perspective as pronounced by the President in the State of the Nation
Address (SONA) in February 2020.

32
SECTION E: 1.5 SERVICE DELIVERY LANDSCAPE – DEVELOPMENT PRIORITY
The Executive Mayor, Cllr D. S Thabe unpacks his first 100 day as a point of departure in
mapping out his perspective on the service delivery land scape of the West Rand District
Municipality and beyond.
In August 2019, I commenced my Term of Office as the Executive
Mayor of the West Rand District Municipality. Where we reflected
on where we are and as you want to listen with anticipation about
what my 1st 100 days was, I have to, as a point of departure, talk to
you about my welcome gift. My welcome gift, was a state of a
municipality that was rooted in challenges around late salaries,
strikes, VBS, low staff morale, that. All of that did one thing to you
as individuals, it put you into a lack of confidence about who we are
and what we stand for.
When I was elected, Executive Mayor, I made a choice very cautiously and very selectively
and one that I am proud of, I made a choice whether I would go down the high road or
the low road. The low road would be, maintain the status quo with a circle of relationships
and continue in a certain space and create the same outcome or to abandon that process
and start afresh with a team that is prepared to go down the high road that was different.
My first comment of my 100 days is, I am thankful and grateful of the people on the
ground that are ready to join the struggle towards entrenching the chance of creating a
new path.
“100 days have past, what have we done?”
From an Institutional Planning and Transformation perspective we pride ourselves on
moving midterm municipal performance from 71% in 2018/19 financial year to 92% in
2019/20 financial year – 21% performance growth.
To maintain our performance accolades, we accede to the premise that, the whole is
greater than the sum of its parts. What we mean, and please allow me to spend some
time on people and soft issues, the impact, thereof, on service delivery efficiency and
effectiveness. We have contextualised our service delivery value chain and offering from
an Inside-Out model, what this posits is that in order to improve service delivery in the
external environment, the District internal operations and capabilities must first be
improved. The Inside-Out model illustrates the integral relationship between the internal
capabilities of the District and the fourteen (14) regional outcomes of our Regional Plan,
which has been the cornerstone of our regional developmental agenda since August
2016. The model, highlights the need to get internal issues right in order to drive success

33
in the external environment – for this, the internal and the external environments need
to be in alignment.
Internal capabilities are centred firstly on people employed within the municipality, and
secondly on finance, process, and customer service capabilities. This underlines people,
finance, processes, and customer service as the core of the internal municipal
environment that drives delivery of regional outcomes within the municipality. With
regard to people in particular, a strategic and professional HR function is critical to
ensuring the appropriate skills are in place to support the required internal capabilities. A
capable and well-capacitated internal environment is key to producing the products and
services required to meet the needs of the external environment.
The model equates addressing of the needs of the external environment as successful
delivery of the 14 regional outcomes, which are as follows: 1. Basic Service Delivery
Improvement 2. Accountable Municipal Administration 3. Skilled, Capacitated,
Competent, and Motivated Workforce 4. Ethical Administration and Good Governance 5.
Safe Communities 6. Educated Communities 7. Healthy Communities 8. Sustainable
Environment 9. Build Spatially Integrated Communities 10. Socially Cohesive Communities
11. Reduced Unemployment 12. Economic Development 13. Robust Financial
Administration 14. Institutional Planning and Transformation
A specific example of the Inside-Out Model can be seen within HR. HR is crucial to ensure
skilled, happy and productive employees in a virtuous cycle. The virtuous cycle occurs in
the ‘inside’ portion of the model. When employees within the municipalities have high
morale and are supported by the required resources (finance, staff, skills etc.) and
efficient processes they produce high-quality customer service which in turn translates
into successful delivery of the 14 regional outcomes within the District.
Against this context, we will be embarking upon a journey to the higher road, it is our
intention to commence with the journey in April 2020. The journey amongst other things
will be deep rooted in implementing the Inside-Out model, where we will look into re-
igniting our fire, our passion, our vigour and our engagement towards inculcating a high
performance culture within our District.
From a financial health perspective, we have been facing financial challenges which
derives from the past financial years and where we were unable to honour short term
commitments especially with regards to salary obligations. Under such severe
circumstances we are relieved to inform you that the District has been able to honour
salary commitments on time to our employees and we have negotiated with creditors
and suppliers to link payment arrangements to the receipt of equitable share.

34
The Municipality has improved on the managing working capital through negotiations
with its constituent local municipalities with regards to the regional contributions that
have been long outstanding to the District. The Municipality, furthermore requested
assistance from Provincial COGTA to assist in sustaining the unfunded fire services
function and the amount of R27 million assistance was confirmed by the Provincial
Government.
From a financial sustainability p0int of view, we are in the process of establishing a
Resource Mobilisation Task Team, the terms of reference of this committee will be
finalised mid-February 2020. During this Term of Office, we will explore innovation on
how we can streamline our IGR processes together with our Constituent Local
Municipalities in order to implement our Regional Shared Services, which was identified
as a deliverable of our Municipal Financial Recovery Plan. Through Shared Services we
currently have a missed opportunity of benefiting from a total of R933 million
conservative approach, R1.4 billion moderate approach and R2 billion aggressive
approach from a regional perspective.
From a Good Governance perspective, our Audit Committee has been instrumental
towards the achievement of an unqualified group audit opinion. Through review,
approval and implementation of the Internal Audit Charter. Review and approval of the
three (3) year internal audit plan and annual plan. Evaluation of independence,
effectiveness and performance of the internal audit function and compliance with its
mandate. In line with our OPCA, we had a total of 28 findings where 9 have been
completed and finalised, where 19 are in progress, it is envisaged that the findings in
progress towards finalisation will be done by 30 May 2020.
In line with promoting clean governance within the District, my Term of Office has
delivered an unqualified group audit opinion on non-compliance, which we view as our
stepping stone towards achieving clean audit (i.e. group unqualified audit report with no
findings). The District is also reporting consistently to National Treasury in line with
Municipal standard chart of accounts (MSCOA) format which was promulgated by
National Treasury in 2014 that from the 1st of July 2017 all the Municipalities in the country
should comply with MSCOA regulations.
Our risk profile of the municipality, has not changed from the previous financial year as
most risks are inherent in nature and can only be managed to a certain level. The
municipality recorded the following eight (8) key risks for 2019/20 financial year, all these
risks are in red and management is giving them immediate attention as needed:
• Increase in crime
• Disruption of Operations
• Financial Unsustainability of the municipality

35
• Unplanned and uncontrolled land use (Land grab and informal
settlements)
• Human Capital ineffectively optimized
• Loss of life and property
• Decline in the economic viability of the District
• New Infections
Furthermore, we continue to create fraud and corruption awareness, where we conduct
surveys for the entire municipality including all fire stations.
Still on Good Governance and Institutional Transformation, we have facilitated the
approval of the following documents as direct deliverables and recommendations of the
Municipal Financial Recovery Plan implementation:
System of Delegations;
Legal Compliance Matric;
Contract Management;
Separation of Powers;
Policy on drafting of By-laws; and
Terms of Reference and Establishment of a Disciplinary Board.
We also ensured a focused approach on the review of the organogram in line with the
expectations of the Municipal Financial Recovery Plan. The organogram having been
reviewed was subsequently approved by Council on 22 October 2019. Its implementation
however has been held in abeyance pending interaction with the MEC.
On the same token, the following vacancies of Manager Supply Chain Management, and
Manager Information Communication and Technology were filled as a result of concerns
raised by the Auditor General of South Africa (AGSA) that the vacancies are critical and
needed to be filled in order to address the shortcomings raised by the AGSA during the
previous audits. The recruitment process of the vacancy, Chief Financial Officer has been
finalised and the vacancy is filled from the 1st of March 2020
In an effort to ensure that West Rand communities feel and are safe, we have:
Empowered our community members and community based organizations
on emergency and disaster related incidents
Training, support and empowerment of Fire Protection Associations
Effective response to fire and rescue services distressed calls
Improvement of operational staff proficiency levels through radical internal
training
Completion of local municipal risk & vulnerability assessments

36
Development of Disaster Management Annual Report
Continuous contingency planning for high risk establishments and community
based events
Ensuring the effective functioning of the Emergency Operations Centre (EOC)
Provision of community safety services that meets the requirements of the
National, Provincial and Regional Crime Prevention Strategies
Management of the extreme shortage of resources for Emergency
Management Services, Disaster Management & Community Safety Services
From a Disaster Management Perspective, we have effectively assisted and supported all
three constituent local municipalities in identifying emergency and disaster related risks
and related vulnerabilities. Befitting plans to mitigate these risks were put in place and
are currently monitored on continuous basis. Disaster Management Officers also assisted
municipalities with the development of sectoral reactive contingency plans for respective
departments. Disaster Management Advisory Forum meeting were scheduled and took
place accordingly. Amongst the discussions were issues of Zama-Zama operations in the
area and plenary for International Day for Disaster Risk Reduction, which was hosted by
Provincial Disaster Management Centre on the 25th October 2019 at Chief Mogale in
Mogale City.
All disaster management related programs implemented during the period under review
are to a larger extent the programs contained in the Council approved Disaster
Management Plan. This plan remains the apex of the day to day disaster management
responsibility of the West Rand District Municipality and they are also implemented in
accordance with other related primary legal and policy frameworks.
There has been a noticeable improvement of cooperation in most of the constituent
Municipalities particularly on issues of Disaster Management. The involvement on risk
and vulnerability assessments conducted by the WRDM in consultation with the relevant
constituent local municipalities is beginning to shape up properly. Meetings were held
with Merafong Local Municipality and Provincial Disaster Management Centre with
regards to the persistent formation of sinkholes in the Merafong area.
The situation in Merafong has drastically deteriorated. New sinkholes/dolomite formed
at several locations in old Khutsong which severely damaged internal water supply pipes
to Khutsong extensions and sewer pipe networks that drain via outfall sewers to the
Khutsong Water Treatment Plant. The formation of these sinkholes affected normal
service delivery as they caused severe damages to water pipes, sewer pipes,
infrastructure and property. In addition thereto, the most recent sinkholes have created

37
a threat to the safety of residents. The situation has become priority by the re-
establishment of Merafong Dolomite Risk Management with the following tasks:
Revise the original settlement plan and Risk Strategy
Secure additional land to address backlog
Our Emergency Operations Centre (EOC) has registered 2184 distressed incoming calls,
whereas these calls inter alia includes municipal essential services complaints (service
delivery) at 1436, emergency services calls (fire & rescue services, emergency medical
services , SAPS and disaster management) at 530 and traffic services calls at 22. Through
our Public Information, Education and Relations (PIER) we have conducted 18 awareness
campaigns to identified high risk institutions.
Special focus during this period was placed on NGO’s such ECD’s, Old Age Homes and
homes for the disabled, etc. 703 Community members were reached through the PIER
outreach programs. Smoke detectors were installed in various old age homes, disabled
homes and places of safety in conjunction with Gauteng province. Nine (9) institutions
were assisted with the drafting of evacuation plans and Seven (7) evacuation drills were
conducted with various institutions. Our Fire Protection Associations and Volunteers
(FPA) received and extinguished a total of 208 veld fires which affected a radius of 12 636
hectares.
From an Emergency Management Services perspective, we have responded to 89% of all
fire and rescue calls within 20 minutes in rural areas. Whereas a total of 90% fire and
rescue calls was responded to within 1o minutes in CBD areas.
In an effort to try and maintain work life balance, we enrolled our fire fighters on the
Toughest Firefighter competition. We are pleased to announce that the team we put
forward for participation has made us very proud. The individual competition consist of
all four stages consecutively by the member participating and the relay completion
consist of four members per team, each member completing one of the stages. There
were a total of 120 competitors nationally of which 78 completed the whole course of
which all our team members completed the course. The members did extremely well and
as such were rated very high and placed as follows:
Manie Gouws: 2nd overall and first in the over 40 age group
G Malejwe : 9th overall and 3rd in the 18-29 age group
T Molefe: 12th overall and 4th in the 18-29 age group
A Benson: 23rd overall and 7th in the 18-29 age group
A Nomala: 55th overall and 11th in the 35-39 age group
T Nkoe: 58th overall and 10th in the 30-35 age group
S Mokemane: 60th overall and 14th in the 35-39 age group

38
Our heartfelt congratulations goes to the team for flying our flag high. Congratulations, you
have done us proud!
In line with inter-agency operations we have assisted with the removal and relocation of
the informal settlement at Makhulugama situated in Mogale city in conjunction with
various role players. The whole processes commenced on the 1st August 2019 and
concluded on the 3rd August 2019. The department provided support and backup services
with the removal of chemicals used in illegal mining operations and safety related issues.
With regards to continual professional development of our employees in October we
commissioned a multi-disciplinary exercise was hosted by the WRDM at Oak tree at the
R24 N14 crossing. The exercise consisted of a multi patient accident involving Hazardous
Materials, people trapped in the caves and a vehicle fire. The exercise tested the response
capabilities of the following agencies: WRDM Emergency Management Service,
Community safety, SAPS, Local and provincial traffic agencies. The exercise was great
success and shortcomings were identified and a training plan was implemented to
address the short comings.
Our emergency services training academy has conducted 4 courses in quarter one (1) of
2019/20 financial year i.e. Two Motor Vehicle Rescue was conducted on 24 June 2019 to
25 July 2019 in Mogale City and Merafong and 20 learners attended, Two Fire Search and
rescue courses was conducted in Mogale City and Merafong respectively on 29 July to 2
August 2019 and 20 learners attended and officer development training was conducted
on 9 to 11 July 2019 and 23 learners attended. An Officer Development course was
conducted on the 9th to 11th July 2019 and twenty three members attended.
We have issued 55 hazardous material/flammable liquids certificates were throughout
the region. A total of hundred and forty one (141) building inspections were conducted
during the quarter under review in terms of the approved Fire Brigade By-Laws and the
Building Regulations and Standards Act. Where Sixty six (66) building plans were
approved and ninety nine (99) transport permits were issued. Forty six (46) fire cause
investigations were conducted. We have furthermore, managed to collect revenue to the
tune of R118 000 from Certificates of compliance with building regulations, building plans,
hazardous material transport permits and transport permits.
From a community safety perspective, The District implemented all its safety programs in
terms of the District Community Safety Plan, Regional Crime Prevention Strategy which
is in concurrence with the National and Provincial Crime Prevention Strategies, Chapter
12 of the National Development Plan, the White Paper on Safety and Security, The
Municipal Systems Act Chapter 2 (4) and all these primary legal and policy provisions are
informed by Section 52 (1) (d) of the Constitution of the Republic of South Africa. The
39
following programs and campaigns were conducted which formed significant part of the
safety plan:
– Victim empowerment in muldersdrift
– 8 Substance abuse and schools safety programs in the following schools :
Lukhanyo Secondary School; Kamogelo Primary School; Wedela Technical School;
Matlhasedi Primary School; Die Poort Primary School; Magalies Group of schools;
Zuurbekom Primary school; and Lodirile Secondary School
– 3 Rural safety meetings were c0nvened in Magaliesburg in line with
implementation of the rural safety plans
– 1 By-Law enforcement in West Village Mogale on the eradication of illegal dumping
From a Municipal Health Services perspective, we are pleased to announce we have
achieved 82% on compliance to National Norms and Standards Audit as carried out by the
National Department of Health.
We have furthermore, inspected 1808 food premises in order to protect the public from
harmful pathogens, we also took 150 food samples to monitor for compliance with food
handling regulations. In ensuring water safety in relation to water quality, a total number
of 303 potable water samples were taken with only 7 none compliant. Our water is above
the 85% standard of compliance. Our Environmental Health Practitioners also conduct
health surveillance of premises inspections at Initiations schools to prevent deaths and
health nuisances in line with chapter 27 of the municipal health services by-laws no 126 of
24 June 2011. In Merafong City, there were 3 initiation schools operating in the area,
through our robust intervention in line with MHS compliance and monitoring, zero deaths
were reported, zero casualties were reported, and one illegal school was closed down.
We also conducted health surveillance inspections to 362 ECDC’s of which 159 were
compliant.
As you are aware our financial situation affects our ability to provide services effectively,
against, through IGR we managed to get assistance from the South African Weather
Services (SAWS) and the Gauteng Department of Agriculture and Rural Development
(GDARD) in order to assists with the management of our Air Quality Stations since the
service provider terminated their service due to non-payment. SAWS agreed to assist
with the management of the stations at no cost to the municipality and GDARD indicated
that they will procure analysers.
On Infrastructure Development, the District has an embedded challenge around the state
of infrastructure which puts a strain in an effort to effectively and timeously meet the
demands and needs of our West Randers.

40
Against this, we devised a strategy to address this challenge in a more cohesive and
wholesome approach. We commissioned a process to develop a District Wide Integrated
Infrastructure Master Plan (DWIMP). The DWIIMP will compose of the following:
o Roads Master Plan
o Stormwater Master Plan
o Electricity Master Plan
o Water & Sewerage Master Plan
o Integrated Waste Management Plan
Over the past few years tenders were advertised, however, due to financial constraints
an appointment could not be made. The West Rand Development Agency (WRDA) was
also requested to engage with various organisations to acquire the necessary funds to
develop this strategic Plan. A Local Company, CoGTA via. the MISA initiative and DBSA
have expressed an interest in setting aside funds to develop the DWIIMP.
We are currently coordinating engagements between CoGTA, DBSA and the Local
Company to see if these organisations can co-fund the Plan. The discussions are ongoing
and are seemingly positive.
With regards to our Road Asset Management System, the National Department of
Transport (NDOT), as part of the S’Hambe Sonke Programme, has provided grant funding
for the implementation of Road Asset Management Systems (RAMS). The strategic goal
of the RAMS Grant is to ensure efficient and effective investment in rural roads through
the development of Road Asset Management Systems (RAMS) and the collection of
associated road and bridge inventory data, condition assessments, and traffic
information. Improved data on roads will guide infrastructure investment, improve
accessibility to and mobility of rural communities.
The RAMS programme was extended to the West Rand District Municipality (WRDM) late
into the 2015/2016 financial year. The WRDM then appointed a Service Provider to
implement the project in the then four local municipalities within the WRDM.
The contract with the Service Provider terminated at the end of June 2018 and it was
decided that the programme would be managed in-house. The RAMS project is set to run
to the end of the 2020/2021 financial year.
The objective of the grant is to assist District Municipalities to develop in-house skills and
human resource capacity and to create employment for unemployed graduates. At the
end of the project, District Municipalities (along with their Local Municipalities) should be
able to fulfil their role as a transport planning authority, and to utilize the RAMS as a
planning tool for prioritizing transport infrastructure expenditure.
41
The Programme is proceeding satisfactorily. During the period in question the five
Technicians working on the programme undertook the second round of visual condition
inspections of roads and associated infrastructure.
It is intended that a Service Provider be appointed in the near future to enhance capacity
of the team so that the RAMS Programme can be implemented in-house in totality.
In October 2019, the Gauteng Department of Roads and Transport in partnership with
municipalities, hosted a variety of events cutting across the Gauteng City Region to
promote public transport and sustainable mobility during the month of October 2019.
Furthermore, we conducted awareness campaigns at the following primary schools:
Mogale City LM - Tsakani Primary School in Kagiso
Rand West City LM - Malerato Primary School in Mohlakeng
Merafong City LM - Kamohelo Primary School in Khutsong
On re-restoration of our Powers and Functions, in line with the Local Government:
Municipal Structures Act. 1998. The intention is for the WRDM to acquire ownership and
Operate and Maintain Bulk Infrastructure as pertains to Roads, Storm water, Electricity,
Water, Sanitation and Solid Waste. A Framework and Evaluation Plan for the
establishment of Water Services Authority for the Region was developed and adopted by
Council.
There is ongoing interaction between the WRDM and CoGTA with regards to mapping a
way forward around the Powers and Functions.
With regards to Service Delivery Grant Funding such as Municipal Infrastructure Grant and
Integrated Urban Development Grant, only Merafong City and Rand West City Local
Municipalities within the West Rand District receive the MIG Allocation. Mogale City Local
Municipality used to receive the MIG Allocation until the end of June 2019. They are now
receiving the Integrated Urban Development Grant (IUDG). In essence the IUDG aims to
achieve three main outcomes:
• Improved access to municipal infrastructure,
• Improved quality of municipal services through infrastructure that is in a
better condition, and
• Improved spatial integration.
With regards to Bulk Infrastructure for Human Settlement, there are numerous Human
Settlement Developments planned to the undertaken in the District. It is expected that
the local municipalities would provide Bulk Infrastructure to supply these Developments
with Services. However, the locals do not, in the main, have spare capacity to provide
these Services neither do they have the funds to install the Bulk as required.

42
It is proposed that the locals utilise the MIG / USDG to provide the Bulk Infrastructure,
however, due to other demands as indicated earlier the LM’s require these Grants to
sustain existing infrastructure.
Another funding model needs to be developed to ensure that there is adequate Bulk
Services available to service Human Settlement Developments. Perhaps a holistic
approach needs to be adopted where provision is made for the Development inclusive of
Bulk Services.
In an effort to improve our commuting experience for our West Randers, the District
through the Gauteng Department of Roads and Transport (GDRT), is participating in
survey commissioned by the professional services of the Council for Scientific and
Industrial Research (CSIR) as the implementation agent to undertake the Gauteng
General Household Travel Survey (GGHTS).
This household travel survey is primarily required for strategic transport planning
purposes within Gauteng and is a provincial wide primary data collection project aimed
at collecting information about Gauteng household travel patterns.
The objectives of the Survey are:
To enable both province and municipalities in Gauteng Province to undertake
improved integrated transport planning,
Facilitate continuous update of strategic transport models,
Enable continuous measurement of the provincial transport system’s
performance against set standards
Enable future planning to be undertaken on a needs basis.
Planning and Logistical arrangements for the implementation of the Project commenced
in September 2018. The CSIR allocated a sample size of 6000 households to the West
Rand District Municipality. Mogale City was allocated 2470, Rand West City 1917 and
Merafong City 1613 Households to be surveyed. Various delays were experienced which
impacted on the actual commencement date of the Survey. Some of these include School
Holidays, availability of equipment, National Elections, etc.
The Service Provider appointed by CSIR to undertake the Survey in the District
commenced surveying during June 2019 and completed the survey in September 2019.
The final draft report, for comment, is expected to be received in January with the final
report expected by the end February.
In closing, an important part of where we come from, is that we sowed the seeds for
national transformation in local government and this saw fruits in terms of the concept
of regional thinking and regional planning. What is inspiring to note, what we started as
a concept, developed into a structure and a framework that we build and defined. What

43
becomes interesting, and what puts us in a pioneering space, is that, in our early days of
conceptualising our District Model of transformation underpinned by regional planning
and region thinking methodology, through our transformation context of 1 Region 1 Plan
1 Action 1 System, we had representation from COGTA, Treasury, SALGA and even the
Presidency.
What becomes more inspiring, is that, they watched us and observed us and in their
design to the President to announce the new transformation of local government is to
be based on District Modelling, through “1 Plans”. Our design framework of regional
planning through 1 Region 1 Plan 1 Action 1 System saw legs in their design framework of
District Modelling of 1 Plans.
We have a role to play in that space, and the role that we play is to pace set the country
in that thinking and methodology, because we have already done it, we have the
technology infrastructure to embed the District Modelling methodology. Against this,
over the next six months our focus is take our regional thinking and regional planning
methodology to fruition in order for the West Rand District Municipality to earn its
rightful position amongst the 44 District Municipalities in the country, to be able to lead
the country in that transformation of local government through District Modelling, and
that, will be our contribution to the country as the West Rand in nation building.
44
SECTION F: 1.6 DISTRICT DEVELOPMENT MODELLING INTERVENTION
In August 2019, at the PCC meeting, the Chairperson, His
Excellency, Mr MC Ramaphosa, President of the Republic of
South Africa highlighted the pronouncement he made on the
State of the Nation Address with regards to the review of the
country’s service delivery model, which has resulted in the
development of the new District Development Model, which
will address gaps identified in the old service delivery model.
The President also highlighted that the model will give effect to
the Khawuleza way of doing things, where the Presidency will
soon convene the Khawuleza Forums in District Municipalities.
The district will be the building blocks and coordination mechanisms for the new DDM.
The proposed District Model builds on the White Paper on Local Government (1998),
which locates the role of local government as critical in “rebuilding local communities and
environment, as the basis for a democratic, integrated, prosperous and truly non-racial
society”. Therefore, the model is a practical Intergovernmental Relations (IGR)
mechanism for all three spheres of government to work jointly and to plan and act in
unison. The model consists of a process by which joint and collaborative planning is
undertaken at local, district and metropolitan spheres together by all three spheres of
government resulting in a single strategically focussed Joined-Up plan, “a One Plan” of
government, for each of the 44 districts and 8 metropolitan geographic spaces in the
country.
Having provided this context, from a National perspective, the West Rand Region, over a
decade ago embarked upon a journey to create a single Municipality in the West Rand
which was aimed to enable the West Rand to be better equipped to support the Gauteng
City Regional initiatives, address issues of partial fragmentation of the West Rand and
Gauteng, support improved resource management and efficiencies through economies
of scale in the Region, all aimed at ultimately improving service delivery in the Region.
Since 2003, various attempts had been made to amalgamate the five municipalities, viz
the West Rand District Municipality, Mogale City Local Municipality, Randfontein Local
Municipality, Westonaria Local Municipality and Merafong Local Municipality with very
limited success.
In 2016, the Demarcation Board passed a resolution to adopt a phased approach towards
the creation of a single municipality for the West Rand. Phase 1 of the process comprised
the merging of Westonaria Local Municipality and Randfontein Local Municipality into

45
Randwest City Local Municipality with the amalgamation of the remaining Municipalities
remaining as a Vision for 2021.
In December 2016, at time, the Powers and Functions were restored to the West Rand
District Municipality in line with the Municipal Structures’ Act 117 of 1998, Section 84 and
in support of the Vision above, the West Rand District Municipality through by developed
a framework for a West Rand Regional Plan which would guide development of the IDP’s
for the Local Municipalities. The Regional Plan was developed to achieve Fourteen
Outcomes and was based on the inputs from the IDP’s as developed by the Local
Municipalities with notable gaps between the desired outcomes and the underpinning
supporting plans by the Municipalities to achieve the desired outcomes. This Regional
Plan was endorsed by the Political and Administrative Leadership of all Municipalities
within the West Rand Region.
Against the above context the West Rand Region Strategic Planning Session was held
with the objective of addressing gaps to alignment, to enable delivery of the Regional
Plan, Outcomes and to obtain recommendations around the implementation of the new
powers and functions. The Strategic Planning Session was held on the 22nd and 23rd of
February 2017 at the Carletonville Civic Centre with the Executive Mayors, MMC’s, Chief
Whips, Municipal Managers, HOD’s, Managers from the West Rand Constituent
Municipalities and Stakeholder Representatives from CoGTA, SALGA, Provincial Treasury
and WRDA in attendance.
The workshop was contextualised against the importance of the role played by Local
Government and the importance of positioning the West Rand as a strong Region. More
emphasis was also placed on the importance of the Constituent Municipalities working
together towards a common goal and highlighted that the achievement of One Metro
status should be something that is earned resulting from joint successes across the
Region.
The strategic planning workshop was therefore, launched against a transformation
context of the aspiration of the future in a concept 1R, 1P,1A ,1S (One-Region, “One-Plan”,
One Action, One-system) which is intended to serve as one common unifying message
which must guide the Regional Planning, Regional Commitment and Regional Delivery
and Regional Monitoring against the Regional Plan. Delegates were urged to plan
seamlessly and to be driven by one common purpose being the Regional Plan which is
underpinned by Fourteen Outcomes.
The need for alignment between the IDPs and importantly that the plan should align to
the political manifestos as well as National and Provincial priorities. Delegates were
furthermore encouraged to work collectively in repositioning the West Rand

46
economically, underpinned by political stability and One-Plan that enables qualitative
service delivery to the people.
District Development Model, National Perspective
Over the 25 years of democracy there have been several attempts at steering
development towards communities in a coordinated manner, with a view of maximising
impact and delivering cohesive, vibrant, sustainable and safe communities. These have
included the War on Poverty, Urban Renewal Programme (URP), the Integrated
Sustainable Rural Development Programme (ISRDP), the Comprehensive Rural
Development Programmes (CRDP), District level Planning and Implementation
Management Support Centre, Local Government Turnaround Strategy and the Back to
Basics. All of which sought to improve the quality of life for all through impactful delivery.
There have also been recent reforms as directed by the National Treasury budgeting
processes, including the Built Environment Performance Plans (BEPPS) processes and the
Integrated Urban Development Framework (IUDF), all of which are facilitating for better
spatial targeting and alignment of government investment spending. Despite all to these
attempts horizontal and vertical silos persist.
The main problem is that the current system is reliant on each sphere to align their plans
with other spheres especially in respect of strategic infrastructure investment, whereas
a more efficient approach is to have all three sphere of government work off a common
strategic alignment platform. A district development model provides such a platform in
seeking to provide a solution for the misalignment, the model therefore, extends beyond
the current approach which relies solely on the “discretionary” alignment of planning
between and amongst the three spheres of government, through joint planning.
Joint planning is specifically focussed on strategic and long-term issues where
agreements between the three spheres are critical and necessary for cohesion and
impact, and where these agreements help shape short, medium and long-term plans and
actions of all three spheres of government in context of their own planning and
implementation responsibilities. The Model is not top-down but rather based on the
outcome of joint planning which determines the best or most appropriate interventions
and actions according to the differentiated circumstances of different district and
metropolitan areas.
In this regard, the DDM is premised on the principle of long term integrated development
planning, budgeting and performance management as would be contained in One Plan.
Such a plan should have direct linkage to the National Development Plan’s priorities and
time frames for which must be translated to medium term priorities from the 6th to the
11th administration. The One Plan must also be based on and related to the Integrated

47
Development Plan, which are localised plans which must be unified at district and metro
levels, and be related to neighbouring and feeder IDPs which must talk to each other. This
would enable a focus (in execution) to achieve these long term goals at the same time as
government drives medium-term policy priorities.
The following have been identified as pillars that are underpinning the One Plan
implementation model:
-Demographic and District Profile:
• Multi-dimensional Poverty Index
• Hunger
• Skills audit in the district
• Land use and Audit of the district
• Social Capital Index
• Health Index
• Inequality
• Service Delivery Index
• Stakeholder Analysis
- Economic Positioning
• Economic Development Opportunities Mapping
• Competitive edge is created that enables domestic and foreign investment
attraction and job creation. The economic positioning informs the spatial
restructuring that is required
• Unemployment/Employment
• Local Economic Development (LED) supported by cooperatives, township and
rural economies
• Economic anchors in the areas
-Spatial Restructuring
• Transformed and efficient spatial development pattern and form in order to
support a competitive local economy and integrated sustainable human settlements.
• Spatial restructuring informs infrastructure investment in terms of quantum and
as well as location and layout of infrastructure networks.
• Harmonization of Spatial Development Plans at the District and provincial levels,
for national support
• At least 1 SDZ in each District and/or City
- Governance and Management
• Coordination, accountability and management structures at national, provincial,
district, local and ward level
• Championship

48
• Technical support capacity with cooperative, civil society and spheres reach
• Leadership and management, in particular with regards to planning, budgeting,
financial and performance management takes place in an effective, efficient,
accountable and transparent manner. It also includes spatial governance, that is, the
process by which the spatial transformation goals are achieved through assessing
and directing land development and undertaking land use management and land
release of municipal/public land.
• Monitoring and evaluation starting at a ward level coordinated at the district
- Infrastructure Engineering
• The process by which infrastructure planning and investment especially bulk
infrastructure, roads, transport, water sanitation, electricity, energy, solid waste;
• Integrated human settlements in a sustainable way over the long-term; and
• Alternative forms of labour intensive infrastructure projects such as the paving of
access, ring and local roads
-Integrated Services Provisioning
• Deliver integrated human settlement, municipal and community services in
partnership with communities so as to transform spatial patterns and development for
planned integrated sustainable human settlements with an integrated
infrastructure network.
• Holistic household level service delivery in the context of a social wage and
improved jobs and livelihood
DDM Regional Perspective: State of readiness
As early as 2003, the Councillors of the West Rand Municipalities started discussions
around the creation of a single Municipality. It was a slow process and not much was
achieved.
In 2007, a feasibility study was undertaken (Study did not include Merafong at the time).
The feasibility study evaluated WRDM on 65 Criteria and over 6 Evaluation areas. The
results of the study showed that the Region complied at an 85% level to becoming a single
region which confirmed that the Region was not far off in terms of the criteria from the
Municipal Demarcation Board.
To drive the process, a Transformation Committee of 30 members was established
representing all Municipalities in the Region and Civil Society. It was deemed necessary
49
to have sub-committees and four sub-committees were established, viz: Economic
Development and Integrated Planning, Finance, Social Transformation and Corporate
Governance.
No progress was made because of challenges around lack of Management and
Coordination, lack of administrative support, lack of resources, and lack of commitment,
large Committees and Non- attendance of meetings
In 2010, a Strategic Planning session was held in Muldersdrift with Executive Councils &
members of all Municipalities. In that session a working document was developed. There
were also some challenges at the time, whereby in September 2010, another session was
held in Mogale. In this session the working document was reviewed which resulted in the
conceptualisation of the Vision 2016 Strategic Framework and approval by all
Municipalities within the Region.
The implementation of the Strategic Framework also had some challenges which resulted
in minimal progress being made, because of the Local Government Elections of 2011, non-
attendance of meetings, change in Political Leadership, minimal participation of
Accounting Officers, lack of resources, lack of internal capabilities and lack of dedicated
teams.
In 2011 after the Local Government elections the 3rd Strategic Review session was held
which was also aimed at inducting the new councillors. The session resulted in the
reduction of Transformation Committee members from 30 to 15, proportionately
representing all Political Parties in the Region. Accounting Officers were assigned to sub-
committees and all Municipalities confirmed their commitment to the Project. It was also
noted that all Political parties in the District supported the Vision of 2016 to create a single
Municipality.
The justification for a single Municipality was set out as follows:
1. To support the Gauteng City Region initiatives
2. To address partial fragmentation of West Rand and Gauteng
3. To support improved resource management and efficiencies through
economies of scale in the region
4. To improve service delivery in the region
5. To improve standardisation through integration
Over the years leading up to 2011, there was public participation and engagement with
the communities and the creation of a single municipality became part of the manifesto
of the region.

50
In March 2012, Randfontein Publicity Association submitted support letter. Where in
September 2012, Sectorial Meeting with Religious Leaders were held including several
meetings with Councils of Local Municipalities and in November 2012, Executive Meetings
and Sector Meetings were held.
In March to April 2013, Media campaign were launched on Radio, Print, TV and
Memorabilia, this included structured public participation including collaboration with
the Municipal Demarcation Board.
In 2016 Demarcation Board passed a resolution for a phased approach towards the
creation of a single municipality for the West Rand:
• Phase 1: The merging of Randfontein and Westonaria Local Municipalities into
Rand West City Local Municipality
• Phase 2: The creation of the West Rand Metro
In September 2016, after the elections it was agreed to have one 5-year Plan for the West
Rand Region. The WRDM, at the time, was vested with the accountability to develop the
5-year Regional Plan in line with the Municipal Structures Act 117 of 1998, Section 84. The
5-year Plan provided a framework for integrated development plans of all municipalities
in the area of the District municipality. The plan identified fourteen (14) Regional
Outcomes for implementation:
Outcome 1 - Basic Service Delivery Improvement; Outcome 2 - Accountable Municipal
Administration; Outcome 3 - Skilled, Capacitated, Competent and Motivated Workforce;
Outcome 4Ethical Administration and Good Governance; Outcome 5 - Safe Communities;
Outcome 6 Educated Communities; Outcome 7 - Healthy Communities; Outcome 8
Sustainable Environment; Outcome 9 - Build Spatially Integrated Communities; Outcome
10 - Socially Cohesive Communities; Outcome 11 Reduced Unemployment; Outcome – 12
Economic Development; Outcome 13 - Robust Financial Administration; and Outcome 14
- Institutional Planning and Transformation.
In December 2016, the WRDM received a correspondence from Provincial COGTA with
regards to the re-restoration of the Powers and Functions as enshrined in the Structures
Act.
In February 2017, the West Rand Economic Summit identified opportunities for Economic
Re-Industrialisation of the West Rand and a task team was assigned and to work on an
Implementation Framework of the recommendations. This was proceeded by the West
Rand Regional Strategic Planning Framework Workshop (WRRSPFW) that was held in
Carletonville.

51
In March 2017, the West Rand Regional Shared Services Centre (WRRSSC) feasibility study
project commenced for a three (3) month period, where it was concluded in May 2017,
wherein the report was presented to a joint sitting of Political and Administrative
Leadership of the WRDM and the Constituent Local Municipalities of the West Rand at
the WRDM Imbizo Council Chambers.
Subsequent to the above presentation by the service provided, it was resolved that the
WRRSSC feasibility study be adopted by all Councils within the region. The study had
identified the following at high level:
-Proposed Operating Model for the WRRSSC solution:
The model brings together the otherwise isolated municipalities in a holistic way which
encapsulates their strengths and interdependencies. WRRSCC should not be viewed in
isolation; the WRRSSC will enable the local municipalities given that core service
delivery (“the Frontline Functions” or “the Frontline”) remains at the municipal level.
The different parties therefore have a mutually beneficial relationship. Service delivery is
enabled by the WRRSSC but the core functions remain at the municipal level.
The regional committees will drive how this operates, there will be joint ownership by all
the municipalities as a part of the institutional structure, in particular through the regional
WRRSSC Committee. The WRRSSC Front Office provides call centres, portals, and kiosks
to facilitate efficient, effective contact with customers, employees and service providers.
These will bring the municipalities closer to their constituencies. It is not enough for
municipalities to be de facto responsive and attentive to their constituencies; they also
have to be perceived by their communities as being responsive and attentive. The
WRRSSC Front Office will help improve both the perception amongst the public as well
the de facto status quo.
The WRRSSC Back Office houses the key support functions of the WRRSSC, described
further below. A key feature of the shared services capabilities proposed for the West
Rand is the administration and specialist knowledge hubs that will service the service
delivery Frontline (viz. the municipalities). Another key feature is the creation of
Business Partner roles, such as the HR Business Partner, and the Chief Strategy and
Performance Management Officer.
Business Partners will play a key delivery role within municipalities, with the ability to
leverage off the capabilities provided by the WRRSSC, while retaining delivery and
reporting responsibility to the municipality. The various interacting parties, as can be seen
in the model, (refer to the annexure, pages 6 – 12), have a symbiotic relationship. This
relationship, if managed optimally, will positively impact the customer who is
ultimately going to benefit from the improved service delivery that the WRRSSC Solution
enables.

52
-Scenario Analysis Costs and Benefits:
Implementation of a WRRSSC Solution in the West Rand has the potential to deliver
substantial benefits, ultimately leading to improved employee morale, reduced budget
deficits, and higher customer satisfaction with service delivery.
The costs and benefits associated with the implementation of WRRSSC are outlined in
the table below.
Conservative Moderate Aggressive
Total benefit R 933 million R 1.4 billion R 2 billion
Total cost R 220 million R 290 million R 441 million
The benefits range from R933 million for the conservative scenario, to R2 billion for the
aggressive scenario. It should be noted that the benefits stand to increase by
approximately R1 billion from the conservative to the aggressive implementation.
However, the implementation costs are likely to increase by only R221 million, or 20%
of the difference in benefits, from the conservative to the aggressive scenarios.
-Early Implementation of WRRSSC Capability: Performance Management
Performance Management was identified as low hanging fruit for early implementation
of the WRRSSC because an implementation platform was needed to embed the planning
and reporting of the fourteen (14) Regional Outcomes as articulated within the West
Rand Regional Five (5) Year Plan. Performance management in the previous financial
years’ had undergone implementation as a key enabling WRRSSC capability from a
system perspective.
The state of readiness to implement the District Development Model within the West
Rand Region is underpinned by the development of the West Rand Regional Five (5) Year
Plan, which identified WRRSSC as a forerunner in this process. The success criteria
towards full implementation of the District Development Modelling is highly contingent
upon the efficiency of the regional IGR structures. It is on this basis that the region is
prioritising the review of the regional IGR protocol.
53
SECTION G: DEVELOPMENT STRATEGIES
The Development Strategies builds from the outputs of the West Rand Region Strategic Planning
Workshop which ensured a focused approach around the understanding of the state of backlogs
across each functional area, development of a set of common indicators to support achievement
of Regional Outcomes, definition of Target/measures for each constituent Municipality, definition
of Key Risks and Challenges, brainstorming of implementation recommendations for Functions
and Powers and the establishment of the status quo for Support Functions. The Strategic
Planning Workshop ensued a commission structure, which comprised of six commission to
discuss the Regional Outcomes relating to service delivery. The discussion of the Regional
Outcomes relative to the Support Functions was contingent upon the outcome of the Shared
Services Feasibility Study at the time and will be the subject of future planning.
The Strategic Planning Workshop ensued a commission structure, which comprised of six
commission to discuss the Regional Outcomes
1.7. Electricity Commission (Development Strategy – Electricity)
The Electricity Commission focussed on the following Regional Outcomes, Outputs and Sub-
Outputs. Below is the outputs as received from the Commission.
Regional Outcome 1: Basic Service Delivery
o Regional Output 1.4: Enhance the effectiveness and efficiency of the Indigent
Programme
Regional Sub Output 1.4.1: Alignment on Strategic Inputs
o Regional Output 1.5: Provision of Reliable Electrical Supply
Regional Sub Output 1.5.1: Electricity Infrastructure and Maintenance
Regional Sub Output 1.5.2: Electricity Losses
o Regional Output 1.8: Optimise Infrastructure Utilisation
Regional Sub Output 1.8.1: Municipal Infrastructure and Maintenance
o Regional Output 1.9: Reduce Outsourced Municipal Services
Regional Sub Output 1.9.1: Identification and Implementation of
Initiatives to reduce Outsourcing
o Regional Output 1.10: Service Delivery Master Plans
Regional Sub Output 1.10.1: Master Plans Development

54
Regional Outcome 1: Basic Service Delivery Improvement
Regional Output 1.4: Enhance the effectiveness and efficiency of the Indigent Programme
Regional Sub Output 1.4.1: Alignment on Strategic Inputs
MUNI. CURRENT
STATUS QUO
CURRENT GAPS ESTIMATED
BUDGET
COMMENTS
RWCLM All registered
Indigents are
receiving 50-kWh
free basic
electricity.
Ongoing.
22 000 Informal
settlement structures /
units not yet
connected.
Budget constraints
Existing informal
settlements on private
land.
Areas not proclaimed
yet
R330m
required.
14 - informal
settlements formed
by this 22000 units
All Wards in
Mogale City
distributed
by MCLM
Ongoing Budget constraints R3m
required per
annum
Installation of
electricity
prepayment meters
for all registered
Indigents.
Merafong
city area
All registered
indigents receive
50kwh FBE
Budget Constraints R6m Cost estimates
include Indigent
management
Additional Comments from Commission:
Mogale & Rand West indigent programmes are in place, problems exist where there are
areas that are not proclaimed – services cannot be provided according to law.
For networks that need to be upgraded due to lack of maintenance the Mogale program is
in place
Rand West’s problem of failing infrastructure is a concern with R50k per annum needed
Regional Outcome 1: Basic Service Delivery Improvement
Regional Output 1.5: Provision of Reliable Electrical Supply
Regional Sub Output 1.5.1: Electricity Infrastructure and Maintenance
MUNI. CURRENT
STATUS QUO
CURRENT GAPS ESTIMATED
BUDGET
COMMENTS
RWCLM –
Network
upgrade:
Upgrading of
bulk substation
all areas.
Most of the
substation
switchgear incl.
buildings are old
and no spares
available to repair.
Ageing
infrastructure with
less capacity to
meet the current
and growing
network demand
and services.
R50m per
annum
required.
RWCLM has recently
appointed a service
provider on a 36-
months period on an
“if and when require
basis”.

55
Not safe to
operate.
No proper
maintenance done
for several years.
Budget constraints.
RWCLM -
Upgrading of
medium voltage
Networks in
Rand west area.
Increase in
number of power
outages due to
ageing networks,
especially on the
small holdings and
in Mohlakeng.
Networks
overloaded.
Critical position not
being filled.
Budget constraints.
Network
vandalism.
R20m per
annum
required.
Current vacant
positions in the
electricity section –
(50)
RWCLM –
Access to
electricity
All informal
settlements not
supplied with
basic electricity,
only public
lighting.
New MV & LV
networks to be
installed.
New substations to
be build.
Budget constraints
R330m over
the next five
years
required.
RWCLM –
Network
expansion
No bulk supply
available to certain
new
developments,
existing MV
network must be
extend.
New MV & LV
networks to be
installed.
New substations to
be build.
Budget constraints
R20m
required per
annum.
Rand West -
Provide bulk MV
& LV electrical
internal
networks in
Mohlakeng Ext.
5
No bulk
infrastructure in
the vicinity.
Budget constraints R60m
required.
CoGTA donated
R8m towards phase 1
(Construction of
switching station in
the area)
RWCLM –
Construction of
new Borwa
substation,
Westonaria
New bulk
infrastructure
Budget constraints R80m
required
DOE donated R9,5m
towards phase.1
(Construction of new
bulk switching station
in the area, this will
eventually supply all
houses in the area)
All areas in the
MCLM
distribution
area. 33 kV
maintenance
Ongoing as per
maintenance
programme
Ageing
infrastructure and
redundant
equipment.
Vandalism
R4m per
annum
All programs are up to
date
All areas in the
MCLM
distribution
Ongoing as per
maintenance
programme
Ageing
infrastructure and
redundant
R4m per
annum
All programs are up to
date

56
area. 6,6 & 11 kV
maintenance
equipment.
Vandalism
All areas in the
MCLM
distribution
area. Street
light
maintenance
Ongoing as per
maintenance
programme
Network vandalism R22m per
annum
All programs are up to
date
MCLM - ESKOM
distribution
within
Municipal
distribution
area
Uncertainty over
transfer
Needs to be
clarified
To be
determined
Needs to be
negotiated and clarity
obtained from NERSA
All areas in the
MCLM
distribution
area. Low
Voltage
maintenance
Ongoing as per
maintenance
programme
Ageing
infrastructure and
redundant
equipment.
Vandalism
R4m per
annum
All programs are up to
date
Regional Outcome 1: Basic Service Delivery Improvement
Regional Output 1.5: Provision of Reliable Electrical Supply
Regional Sub Output 1.5.2: Electricity Losses
MUNI. CURRENT
STATUS QUO
CURRENT GAPS ESTIMATED
BUDGET
COMMENTS
RWCLM -
Installation of
zone metering
in the region,
Rand west is @
22% of losses
Mogale city is @
9%
Budget constrains
affect the
implementation of
installation of zone
metering
R10m
Rand West
If we can install zone
meters from the bulk
intake points
downstream to mini
substation levels, we
can easy detect where
our biggest losses
occur.
RWCLM –
Replace
vandalized
pillar meter
boxes with new
strong boxes.
Increase of theft
and illegal
connections in
pillar boxes
Budget constraints R5m per
annum
required.
By securing the
existing vandalized
meter/pillar boxes,
electricity losses will
also be reduced,
which will increase
revenue.
Mogale
Spruit
substation
distribution
area. Spruit
Multi-year project
in first phase of
project.
Insufficient Budget
to complete project
phases
R26m
required to
complete
entire
project
This project will
unlock the potential
of further
development which in

57
1x20MVA
Transformer
(33 kV Firm
Capacity
Upgrade)
return will guarantee
Revenue for MCLM
Mogale
Northern
suburbs,
Diswilmar
Ruimsig
Pinehaven etc.
Transmission
Line between
Factoria and
Libertas
Substations (33
kV Firm
Capacity
Upgrade)
Multi-year project
to be awarded
shortly.
Insufficient Budget
to complete project
phases
Total
estimated
budget
R80m to
complete
entire
project
The completion of this
project will ensure a
firm supply to this
area. There is
currently no back up
33kV network
towards this area.
Mogale
Meter box
subsidies for
prepayment
installations
Purchase meter
boxes to
accommodate
prepayment
applications. This
project assists in
the collection of
revenue.
Total estimated
budget R3m per
annum
This project
will
guarantee
Revenue for
MCLM
Regional Outcome 1: Basic Service Delivery Improvement
Regional Output 1.8: Optimise Infrastructure Utilisation
Regional Sub Output 1.8.1: Municipality Infrastructure and Maintenance
MUNI. CURRENT
STATUS QUO
CURRENT GAPS ESTIMATED
BUDGET
COMMENTS
RWCLM
Upgrading of
existing
substations:
Westergloor,
Mohlakeng,
Muni Aureus,
Westonaria,
Glenhavie
No proper
maintenance
done for past
few years,
Capacity
constraints
Budget
constraints
Eskom support
R50m pa
required.
No new developments
can be accommodated
in these areas of supply.
RWCLM has recently
appointed a service
provider on a 36-
months period on a “if
and when basis
require”.
RWCLM -
Upgrading of
Ageing
infrastructure,
the existing
Budget
constraints
R20m pa
required.
Rand west require a
minimum of R20m per
annum to replace old
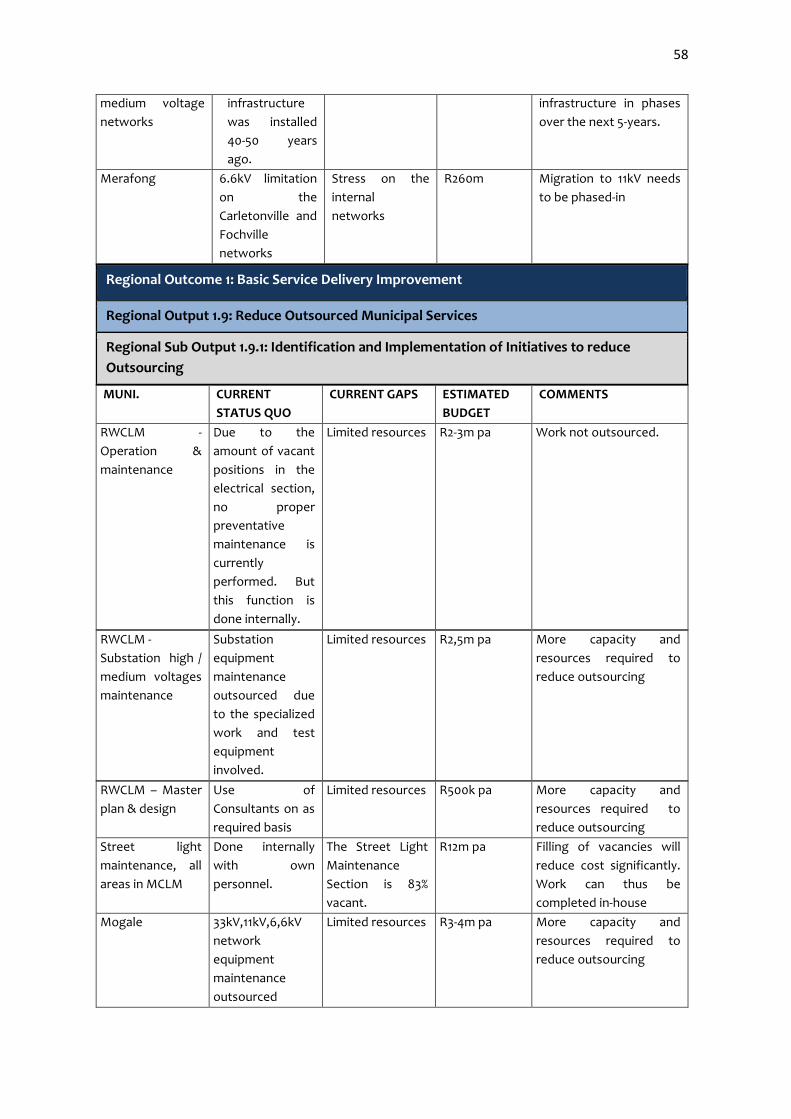
58
medium voltage
networks
infrastructure
was installed
40-50 years
ago.
infrastructure in phases
over the next 5-years.
Merafong 6.6kV limitation
on the
Carletonville and
Fochville
networks
Stress on the
internal
networks
R260m Migration to 11kV needs
to be phased-in
Regional Outcome 1: Basic Service Delivery Improvement
Regional Output 1.9: Reduce Outsourced Municipal Services
Regional Sub Output 1.9.1: Identification and Implementation of Initiatives to reduce
Outsourcing
MUNI. CURRENT
STATUS QUO
CURRENT GAPS ESTIMATED
BUDGET
COMMENTS
RWCLM -
Operation &
maintenance
Due to the
amount of vacant
positions in the
electrical section,
no proper
preventative
maintenance is
currently
performed. But
this function is
done internally.
Limited resources R2-3m pa Work not outsourced.
RWCLM -
Substation high /
medium voltages
maintenance
Substation
equipment
maintenance
outsourced due
to the specialized
work and test
equipment
involved.
Limited resources R2,5m pa More capacity and
resources required to
reduce outsourcing
RWCLM – Master
plan & design
Use of
Consultants on as
required basis
Limited resources R500k pa More capacity and
resources required to
reduce outsourcing
Street light
maintenance, all
areas in MCLM
Done internally
with own
personnel.
The Street Light
Maintenance
Section is 83%
vacant.
R12m pa Filling of vacancies will
reduce cost significantly.
Work can thus be
completed in-house
Mogale 33kV,11kV,6,6kV
network
equipment
maintenance
outsourced
Limited resources
R3-4m pa More capacity and
resources required to
reduce outsourcing

59
Plenary Comments / Feedback/ Recommendations
a) Clarify understanding of regulations on electricity around the supply to informal settlements
against the understanding that if people stayed in a settlement for over 3yrs then they had
the right to service delivery.
b) Consider ways of managing electricity in a win-win manner with regards to the management
of revenues from bulk electricity and how to manage assets and debts
Merafong Transformer
maintenance
Switchgear
maintenance
Budget R3m pa To meet the regulated
maintenance standards
Regional Outcome 1: Basic Service Delivery Improvement
Regional Output 1.10: Service Delivery Master Plans
Regional Sub Output 1.10.1: Master Plans Development
AREA CURRENT
STATUS QUO
CURRENT GAPS ESTIMATED
BUDGET
COMMENTS
MCLM
electricity
distribution
area
Master plan
previously updated in
2012/2013 financial
year.
Budget
constraints to
remunerate
consultants to
update existing
master plan.
R3m A master plan is a live
document that has to be
updated annually to
sustain development in
the MCLM area
RWCLM -
electricity
distribution
area
Combined master
plan in progress
Existing Master plan
updated 2014
Requires
update 2017
Budget
constraints
R2m A master plan is a live
document that has to
be updated annually to
sustain development in
the RWCLM area.
RWCLM in the process
to appoint a service
provider to
compile/update
MATERPLAN.
Merafong • Electricity
master Plan
review
underway
• Combin
ed
services
/infrastr
ucture
master
plan
• R3m • Standalone
master plans
inhibit proper
planning

60
c) On indigents consider Regional parity in terms of electricity amounts alloted
1.7.2 Target/measures to be achieved over the next 5 years (Electricity)
Outcome 1: Basic Service Delivery Improvement
Output 1.4: Enhance the effectiveness and efficiency of the Indigent Programme
Sub Output 1.4.1: Alignment on Strategic Inputs
Muni. Year 1
2016/17
Year 2
2017/18
Year 3
2018/19
Year 4
2019/20
Year 5
2020/21
WRDM n/a Oversight & monitoring of electrification:
human settlement &
other developments
Oversight & monitoring of electrification:
human settlement &
other developments
Oversight & monitoring of electrification:
human settlement &
other developments
Oversight & monitoring of electrification:
human settlement &
other developments
Mogale 10% 20% 20% 20% 30%
Randwest Securing funding budget to electrify Zenzelle informal settlement.
(+- 6000 units) Electrification
of (180) two room units at Mohlakeng Hostels.
Electrification of (429) new RDP houses – Mohlakeng Ext.11
10%
Electrification of (1500) x houses – Mohlakeng ext. 5
10%
20% 30% 30%
Merafong 100 % of registered beneficiaries (Indigents)
100 % of registered beneficiaries (Indigents)
100 % of registered beneficiaries (Indigents)
100 % of registered beneficiaries (Indigents)
100 % of registered beneficiaries (Indigents)
Additional Comments from Commission:
In process to provide meters
Rand West progress not started, installation only start year 3 and beyond
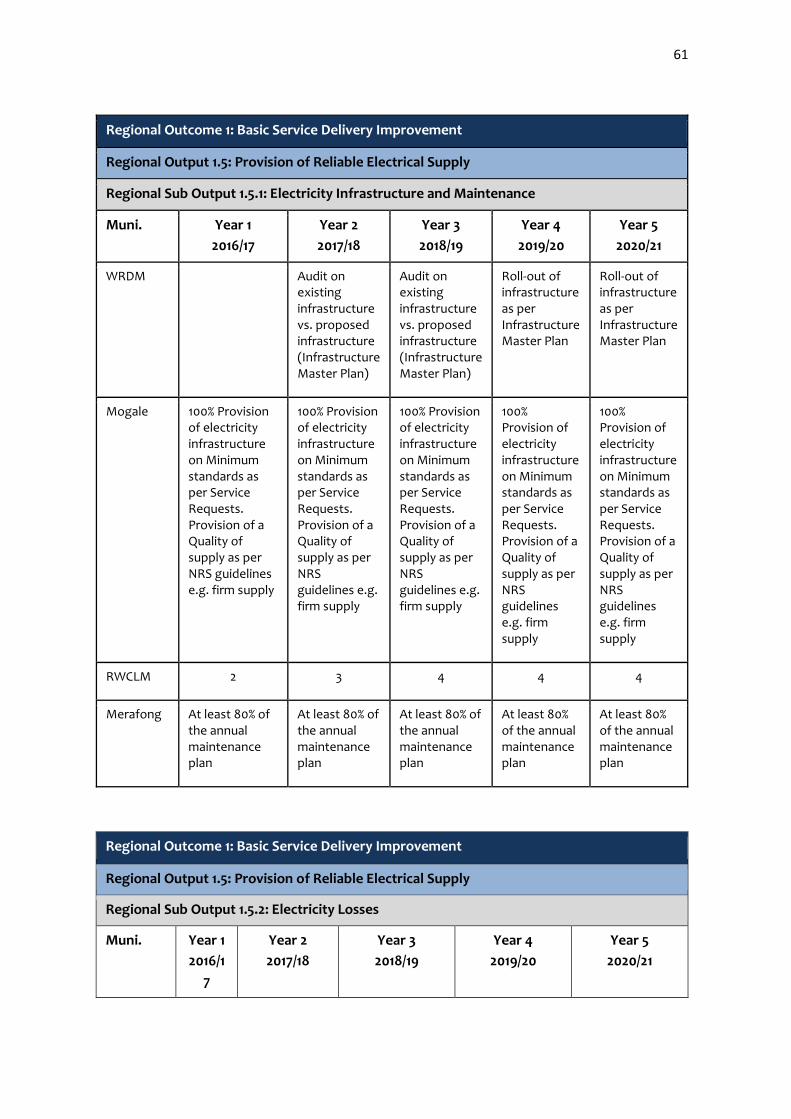
61
Regional Outcome 1: Basic Service Delivery Improvement
Regional Output 1.5: Provision of Reliable Electrical Supply
Regional Sub Output 1.5.1: Electricity Infrastructure and Maintenance
Muni. Year 1
2016/17
Year 2
2017/18
Year 3
2018/19
Year 4
2019/20
Year 5
2020/21
WRDM Audit on existing infrastructure vs. proposed infrastructure (Infrastructure Master Plan)
Audit on existing infrastructure vs. proposed infrastructure (Infrastructure Master Plan)
Roll-out of infrastructure as per Infrastructure Master Plan
Roll-out of infrastructure as per Infrastructure Master Plan
Mogale 100% Provision of electricity infrastructure on Minimum standards as per Service Requests. Provision of a Quality of supply as per NRS guidelines e.g. firm supply
100% Provision of electricity infrastructure on Minimum standards as per Service Requests. Provision of a Quality of supply as per NRS guidelines e.g. firm supply
100% Provision of electricity infrastructure on Minimum standards as per Service Requests. Provision of a Quality of supply as per NRS guidelines e.g. firm supply
100% Provision of electricity infrastructure on Minimum standards as per Service Requests. Provision of a Quality of supply as per NRS guidelines e.g. firm supply
100% Provision of electricity infrastructure on Minimum standards as per Service Requests. Provision of a Quality of supply as per NRS guidelines e.g. firm supply
RWCLM 2 3 4 4 4
Merafong At least 80% of the annual maintenance plan
At least 80% of the annual maintenance plan
At least 80% of the annual maintenance plan
At least 80% of the annual maintenance plan
At least 80% of the annual maintenance plan
Regional Outcome 1: Basic Service Delivery Improvement
Regional Output 1.5: Provision of Reliable Electrical Supply
Regional Sub Output 1.5.2: Electricity Losses
Muni. Year 1
2016/1
7
Year 2
2017/18
Year 3
2018/19
Year 4
2019/20
Year 5
2020/21

62
WRDM Audit on Electricity Losses and development of Electricity Loss Programme
Oversee the implementation of Electricity Loss Programme
Oversee the implementation of Electricity Loss Programme
Oversee the implementation of Electricity Loss Programme
Mogale 0% 2% 2% 2% 2%
RWCLM 0% 2% 2% 2% 2%
Merafon
g
15% 15% 15% 15% 15%
Regional Outcome 1: Basic Service Delivery Improvement
Regional Output 1.8: Optimise Infrastructure Utilisation
Regional Sub Output 1.8.1: Municipal Infrastructure and Maintenance
Muni. Year 1
2016/17
Year 2
2017/18
Year 3
2018/19
Year 4
2019/20
Year 5
2020/21
WRDM Oversee & Monitoring of replacement of ageing infrastructure
Oversee & Monitoring of replacement of ageing infrastructure
Oversee & Monitoring of replacement of ageing infrastructure
Oversee & Monitoring of replacement of ageing infrastructure
Mogale The replacement of ageing infrastructure and redundant equipment. Ensure firm supply to all distribution areas. Prohibit Vandalism
The replacement of ageing infrastructure and redundant equipment. Ensure firm supply to all distribution areas. Prohibit Vandalism
The replacement of ageing infrastructure and redundant equipment. Ensure firm supply to all distribution areas. Prohibit Vandalism
The replacement of ageing infrastructure and redundant equipment. Ensure firm supply to all distribution areas. Prohibit Vandalism
The replacement of ageing infrastructure and redundant equipment. Ensure firm supply to all distribution areas. Prohibit Vandalism
RWCLM - Apply to Eskom to upgrade existing substations.
11/6.6-kVSwitchgear replacement
Replacement of old electrical
Apply to Eskom to upgrade existing substations.
11/6.6-kVSwitchgear replacement
Replacement of old electrical
Apply to Eskom to upgrade existing substations.
11/6.6-kVSwitchgear replacement
Replacement of old electrical
Apply to Eskom to upgrade existing substations.
11/6.6-kVSwitchgear replacement
Replacement of old electrical

63
Regional Outcome 1: Basic Service Delivery Improvement
Regional Output 1.9: Reduce Outsourced Municipal Services
Regional Sub Output 1.9.1: Identification and Implementation of Initiatives to reduce
Outsourcing
Muni. Year 1
2016/17
Year 2
2017/18
Year 3
2018/19
Year 4
2019/20
Year 5
2020/21
Mogale Provision of required additional resources to reduce outsourced work
Provision of required additional resources to reduce outsourced work
Provision of required additional resources to reduce outsourced work
Provision of required additional resources to reduce outsourced work
Provision of required additional resources to reduce outsourced work
RWCLM Provision of required additional resources to reduce outsourced work
Provision of required additional resources to reduce outsourced work
Provision of required additional resources to reduce outsourced work
Provision of required additional resources to reduce outsourced work
Provision of required additional resources to reduce outsourced work
Merafong Rehabilitate the 20MVA at Reinecke Substation
20% of mini-substations oil rehabilitation
20% of mini-substations oil rehabilitation
20% of mini-substations oil rehabilitation
20% of mini-substations oil rehabilitation
Regional Outcome 1: Basic Service Delivery Improvement
Regional Output 1.10: Service Delivery Master Plans
Regional Sub Output 1.10.1: Master Plans Development
Muni. Year 1
2016/17
Year 2
2017/18
Year 3
2018/19
Year 4
2019/20
Year 5
2020/21
networks in phases.1
networks in phases.2
networks in phases.3
networks in phases.4
Merafong Not Budgeted for Kokosi Lines upgrade
Finalise the Khutsong South Internal Network
Install additional 10MVA Substation in Khutsong South
Commission a Network Control Room

64
WRDM Preparation
of Integrated
Infrastructur
e Master
Plan
Preparation
of Integrated
Infrastructur
e Master
Plan
Implementation
of
recommendation
s
Implementation
of
recommendation
s
RWCLM Appointment of Consultant to update Masterplan annually
Merafong
Budge
t for
the
Plans
for
2017/1
8
Appoint
Specialists
Integrated
with other
Services and
the region
Annual review of
Master Plans
Annual review of
Master Plans
1.7.3. Game Changers / Strategic Projects (Electricity)
Regional Outcome 1: Basic Service Delivery Improvement
Regional Output 1.4: Enhance the Effectiveness and Efficiency of the Indigent Programme
Regional Sub Output 1.4.1: Alignment on Strategic Inputs
Muni. Year 1
2016/17
Year 2
2017/18
Year 3
2018/19
Year 4
2019/20
Year 5
2020/21
WRDM
Regional Policy on providing electricity to indigents
Roll-out of Policy on providing electricity to indigents
Roll-out of Policy on providing electricity to indigents
Roll-out of Policy on providing electricity to indigents
Mogale The completion of 100% of registered indigents in the MCLM distribution area
The completion of 100% of registered indigents in the MCLM distribution area
The completion of 100% of registered indigents in the MCLM distribution area
The completion of 100% of registered indigents in the MCLM distribution area
The completion of 100% of registered indigents in the MCLM distribution area
RWCLM Securing funding budget to electrify Zenzelle informal settlement. (+- 6000 units)
Electrification of (180) two room units at
Electrification of (1500) x houses – Mohlakeng ext. 5
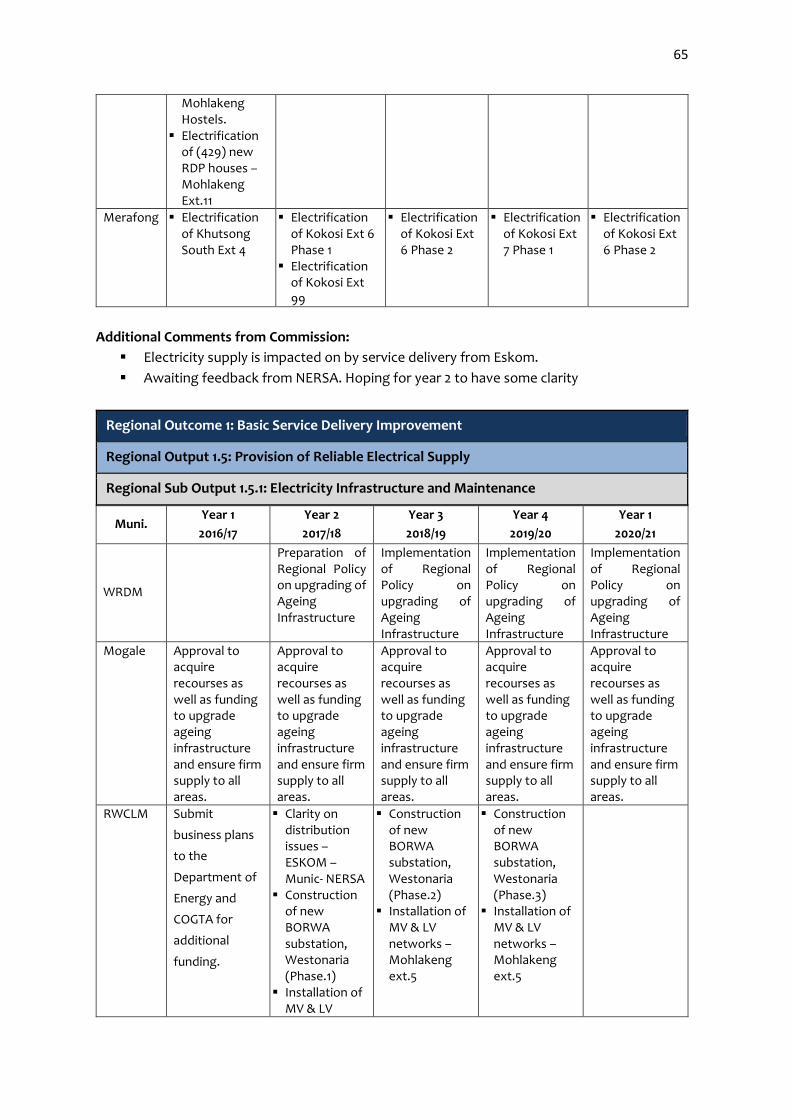
65
Mohlakeng Hostels.
Electrification of (429) new RDP houses – Mohlakeng Ext.11
Merafong Electrification of Khutsong South Ext 4
Electrification of Kokosi Ext 6 Phase 1
Electrification of Kokosi Ext 99
Electrification of Kokosi Ext 6 Phase 2
Electrification of Kokosi Ext 7 Phase 1
Electrification of Kokosi Ext 6 Phase 2
Additional Comments from Commission:
Electricity supply is impacted on by service delivery from Eskom.
Awaiting feedback from NERSA. Hoping for year 2 to have some clarity
Regional Outcome 1: Basic Service Delivery Improvement
Regional Output 1.5: Provision of Reliable Electrical Supply
Regional Sub Output 1.5.1: Electricity Infrastructure and Maintenance
Muni. Year 1
2016/17
Year 2
2017/18
Year 3
2018/19
Year 4
2019/20
Year 1
2020/21
WRDM
Preparation of Regional Policy on upgrading of Ageing Infrastructure
Implementation of Regional Policy on upgrading of Ageing Infrastructure
Implementation of Regional Policy on upgrading of Ageing Infrastructure
Implementation of Regional Policy on upgrading of Ageing Infrastructure
Mogale Approval to acquire recourses as well as funding to upgrade ageing infrastructure and ensure firm supply to all areas.
Approval to acquire recourses as well as funding to upgrade ageing infrastructure and ensure firm supply to all areas.
Approval to acquire recourses as well as funding to upgrade ageing infrastructure and ensure firm supply to all areas.
Approval to acquire recourses as well as funding to upgrade ageing infrastructure and ensure firm supply to all areas.
Approval to acquire recourses as well as funding to upgrade ageing infrastructure and ensure firm supply to all areas.
RWCLM Submit
business plans
to the
Department of
Energy and
COGTA for
additional
funding.
Clarity on distribution issues – ESKOM – Munic- NERSA
Construction of new BORWA substation, Westonaria (Phase.1)
Installation of MV & LV
Construction of new BORWA substation, Westonaria (Phase.2)
Installation of MV & LV networks – Mohlakeng ext.5
Construction of new BORWA substation, Westonaria (Phase.3)
Installation of MV & LV networks – Mohlakeng ext.5

66
networks – Mohlakeng ext.5
Merafong Rehabilitation of Fochville Substation
Rehabilitation of Reinecke Substation
Upgrade the Main Feeder Lines in Kokosi
Replace over-head line with bundle conductor in Fochville
Finalize the Bulk Projects in Khutsong South/ Carletonville
Regional Outcome 1: Basic Service Delivery Improvement
Regional Output 1.8: Optimise Infrastructure Utilisation
Regional Sub Output 1.8.1: Municipal Infrastructure and Maintenance
Muni. Year 1
2016/17
Year 2
2017/18
Year 3
2018/19
Year 4
2019/20
Year 1
2020/21
Mogale
CLM
The
replacement of
ageing
infrastructure
and redundant
equipment.
Ensure firm
supply to all
distribution
areas. Prohibit
Vandalism
The replacement
of ageing
infrastructure
and redundant
equipment.
Ensure firm
supply to all
distribution
areas. Prohibit
Vandalism
The replacement
of ageing
infrastructure
and redundant
equipment.
Ensure firm
supply to all
distribution
areas. Prohibit
Vandalism
The
replacement of
ageing
infrastructure
and redundant
equipment.
Ensure firm
supply to all
distribution
areas. Prohibit
Vandalism
The
replacement of
ageing
infrastructure
and redundant
equipment.
Ensure firm
supply to all
distribution
areas. Prohibit
Vandalism
RWCLM - Apply to Eskom
to upgrade
existing
substations.
11/6.6-
kVSwitchgear
replacement
Replacement
of old electrical
networks in
phases.1
Apply to Eskom
to upgrade
existing
substations.
11/6.6-
kVSwitchgear
replacement
Replacement
of old electrical
networks in
phases.2
Apply to
Eskom to
upgrade
existing
substations.
11/6.6-
kVSwitchgear
replacement
Replacement
of old
electrical
networks in
phases.3
Apply to
Eskom to
upgrade
existing
substations.
11/6.6-
kVSwitchgear
replacement
Replacement
of old
electrical
networks in
phases.4
Merafong Not Budgeted
for
Kokosi Lines
upgrade
Finalise the
Khutsong South
Internal Network
Install
additional
10MVA
Substation in
Commission a
Network
Control Room

67
Khutsong
South
Muni. Year 1
2016/17
Year 2
2017/18
Year 3
2018/19
Year 4
2019/20
Year 1
2020/21
RWCLM Appointment of Consultant to update Masterplan annually
Merafong Budget for the
Plans for 2017/18
Appoint
Specialists
Integrated with
other Services
and the region
Annual review
of Master
Plans
Annual review
of Master
Plans
Regional Outcome 1: Basic Service Delivery Improvement
Regional Output 1.10: Service Delivery Master Plans
Regional Sub Output 1.10.1: Master Plans Development

68
1.7.4. Key Risks & Challenges (Electricity)
Outcome 1: Basic Service Delivery Improvement
Output 1.4: Enhance the effectiveness and efficiency of the Indigent Programme
Sub Output 1.4.1: Alignment on Strategic Inputs
Municipality Key Risks and Challenges
Mogale Budget constraints
Lack of capacity
Ageing infrastructure
Firm supply on all main distribution substations and networks
Lack of resources
RWCLM Budget constraints
Lack of capacity
Ageing infrastructure
Lack of resources
Capacity constrains from Eskom Substation
Firm supply
Merafong Bulk Capacity
DORA allocations
Regional Outcome 1: Basic Service Delivery Improvement
Regional Output 1.5: Provision of Reliable Electrical Supply
Regional Sub Output 1.5.1: Electricity Infrastructure and Maintenance
Municipality Key Risks and Challenges
Mogale CLM Vandalism
Theft
Illegal connection
Meeting of demand with ageing infrastructure
Insufficient Funding
RWCLM Budget constraints
Meeting of demand with ageing infrastructure
Merafong LM Funding
Spatial Planning
Eskom co-operation

69
Regional Outcome 1: Basic Service Delivery Improvement
Regional Output 1.5: Provision of Reliable Electrical Supply
Regional Sub Output 1.5.2: Electricity Losses
Municipality Key Risks and Challenges
RWCLM Budget constraints,
Capacity constraints,
Ageing Infrastructure
Regional Outcome 1: Basic Service Delivery Improvement
Regional Output 1.8: Optimise Infrastructure Utilisation
Regional Sub Output 1.8.1: Municipal Infrastructure and Maintenance
Municipality Key Risks and Challenges
RWCLM Budget constraints,
Capacity constraints,
Merafong Budget and Funding
Skilled Personnel
Regional Outcome 1: Basic Service Delivery Improvement
Regional Output 1.9: Reduce Outsourced Municipal Services
Regional Sub Output 1.9.1: Identification and Implementation of Initiatives to reduce
Outsourcing
Municipality Key Risks and Challenges
Mogale Funding to establish design office & upgrade facilities
Lack of resources
RWCLM Funding to establish design office & upgrade facilities
Lack of resources
Merafong Budgets
Skilled personnel
Regional Outcome 1: Basic Service Delivery Improvement
Regional Output 1.10: Service Delivery Master Plans

70
Regional Sub Output 1.10.1: Master Plans Development
Municipality Key Risks and Challenges
Mogale Time constraints
alignment
RWCLM Time constraints
Alignment
Funding
Merafong Funding
1.7.5. General Comments / Requests (Electricity)
Outcome 1: Basic Service Delivery Improvement
Output 1.4: Enhance the effectiveness and efficiency of the Indigent Programme
Sub Output 1.4.1: Alignment on Strategic Inputs
Municipality General Comments/ Requests
Mogale Attain assistance from local government e.g. DoE to subsidise
Indigent Program
RWCLM Human settlements can fast track the development to reduce
informal settlement
Planning & communication of all spheres of government National/
Provincial/Local Government
Merafong A special tariff for FBE needs to be formulated
Outcome 1: Basic Service Delivery Improvement
Output 1.5: Provision of Reliable Electrical Supply
Sub Output 1.5.1: Electricity Infrastructure and Maintenance
Municipality General Comments/ Requests
RWCLM RWCLM is currently in the process to appoint a service provider to
compile/ update existing Electricity Masterplan.
This masterplan will cater for all future planned developments incl.
Eskom upgrades.
Merafong Bulk capacity provision is a priority,
Maintenance of existing infrastructure need a focused funding
method

71
Outcome 1: Basic Service Delivery Improvement
Output 1.5: Provision of Reliable Electrical Supply
Sub Output 1.5.2: Electricity Losses
Municipality General Comments/ Requests
RWCLM The Electricity section will keep submitting business plans and
submit to external institutions for funding.
Merafong Network optimisation shall also be utilised as a tool to curb system
losses
Outcome 1: Basic Service Delivery Improvement
Output 1.8: Optimise Infrastructure Utilisation
Sub Output 1.8.1: Municipal Infrastructure and Maintenance
Municipality General Comments/ Requests
RWCLM The Electricity section will keep submitting business plans and submit
to external institutions for funding.
Merafong Aging infrastructure rehabilitation to meet the increase in demand
need to be prioritised
Outcome 1: Basic Service Delivery Improvement
Output 1.9: Reduce Outsourced Municipal Services
Sub Output 1.9.1: Identification and Implementation of Initiatives to reduce Outsourcing
Municipality General Comments/ Requests
RWCLM By filling all vacant positions within the electrical section, will reducing
the outsourcing of services to contractors. Most work to be done in-
house.
Merafong Reliability on external services to be reduced and enhance regional
shared services
Outcome 1: Basic Service Delivery Improvement
Output 1.10: Service Delivery Master Plans
Sub Output 1.10.1: Master Plans Development
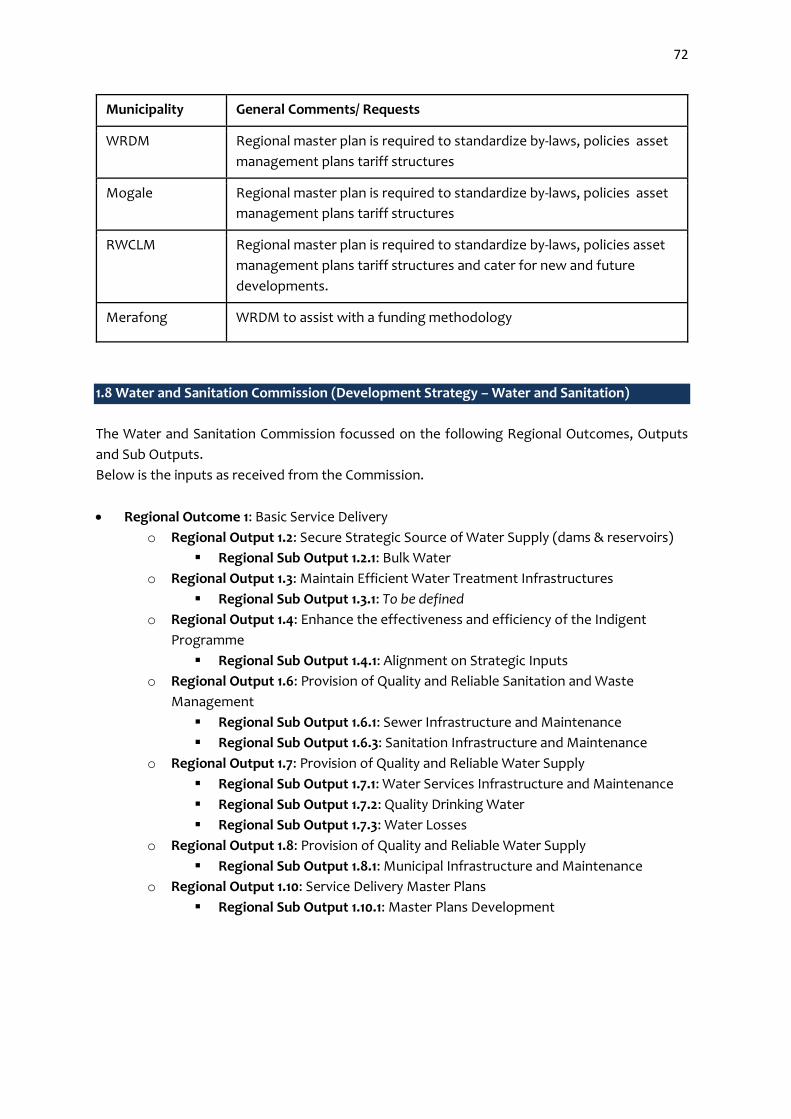
72
Municipality General Comments/ Requests
WRDM Regional master plan is required to standardize by-laws, policies asset
management plans tariff structures
Mogale Regional master plan is required to standardize by-laws, policies asset
management plans tariff structures
RWCLM Regional master plan is required to standardize by-laws, policies asset
management plans tariff structures and cater for new and future
developments.
Merafong WRDM to assist with a funding methodology
1.8 Water and Sanitation Commission (Development Strategy – Water and Sanitation)
The Water and Sanitation Commission focussed on the following Regional Outcomes, Outputs
and Sub Outputs.
Below is the inputs as received from the Commission.
Regional Outcome 1: Basic Service Delivery
o Regional Output 1.2: Secure Strategic Source of Water Supply (dams & reservoirs)
Regional Sub Output 1.2.1: Bulk Water
o Regional Output 1.3: Maintain Efficient Water Treatment Infrastructures
Regional Sub Output 1.3.1: To be defined
o Regional Output 1.4: Enhance the effectiveness and efficiency of the Indigent
Programme
Regional Sub Output 1.4.1: Alignment on Strategic Inputs
o Regional Output 1.6: Provision of Quality and Reliable Sanitation and Waste
Management
Regional Sub Output 1.6.1: Sewer Infrastructure and Maintenance
Regional Sub Output 1.6.3: Sanitation Infrastructure and Maintenance
o Regional Output 1.7: Provision of Quality and Reliable Water Supply
Regional Sub Output 1.7.1: Water Services Infrastructure and Maintenance
Regional Sub Output 1.7.2: Quality Drinking Water
Regional Sub Output 1.7.3: Water Losses
o Regional Output 1.8: Provision of Quality and Reliable Water Supply
Regional Sub Output 1.8.1: Municipal Infrastructure and Maintenance
o Regional Output 1.10: Service Delivery Master Plans
Regional Sub Output 1.10.1: Master Plans Development

73
1.8.1. Service Delivery Backlogs (Water & Sanitation)
Regional Outcome 1: Basic Service Delivery Improvement
Regional Output 1.2: Secure Strategic Source of Water Supply (dams & reservoirs)
Regional Sub Output 1.2.1: Bulk Water
MUNI. CURRENT
STATUS QUO
CURRENT GAPS ESTIMATED
BUDGET
COMMENTS
RWCLM Informal settlements in
RWCLM do not have
access to piped water
Informal
settlements are
provided with
water using water
tankers
R100m The DWS is currently
funding projects to
provide water
infrastructure to
informal settlements
through its Water
Services Infrastructure
Grant
RWCLM Network upgrade -
Water supply networks
are ageing
Upgrading of
water networks in
RWCLM
R300m
Business plans have
been submitted to
COGTA to request
funding
RWCLM Network expansion -
The available reservoirs
are not adequate to
cater for new
developments
2 x additional
reservoirs are
required
R500m R100m per annum
over a 5 year period to
construct 2 new
reservoirs
Mogale Muldersdrift- Lack of
bulk infrastructure to
meet with the
developmental needs
30Ml/day
reservoir is to be
constructed.
Johannesburg
Water line
currently being
used
R70m Funding not secured-
MIG Business Plan
submitted
Mogale Munsieville Township-
Upgrade of the 2Ml/day
reservoir and pump
station
Construction of
the 5Ml/day
reservoir
R32m Feasibility studies, BPs
completed, MIG
application submitted.
Mogale Magaliesburg-
Construction of new
10Ml/day Reservoir
R50m Feasibility studies and
land acquisition are
still to be done.

74
Mogale Kagiso Township-
Upgrade of the existing
bulk water, reservoirs
and pump station to
accommodate new
housing developments
726 Houses being
built in Ext 13, 800
additional in Chief
Mogale, and
Leratong Node
Development in
the pipeline
Feasibility studies and
land acquisition are
still to be done.
Merafong Khutsong- collapsed
reservoir
decommissioned
DWS- funded
relocation
R70m Tender is at awarding
stage
Merafong Khutsong South-900
mm pipe collapsed due
to sinkhole
Declared Disaster R24m sinkhole
rehabilitation,
R40m pipe
reconstruction
R40M secured by
COGTA for pipe
reconstruction,
COGTA will be IA
Merafong Welverdiend- existing
2.5 ML reservoir not
sufficient for the area
Need for reservoir
upgrade
R50m No Funding
Merafong Fochville- existing 12 ML
reservoir not sufficient
for the entire town
30ML expansion
needed
R159m No funding
Merafong Carletonville-Rand
Water high pressure
pipe directly connected
to the network
Area declared as a
Disaster. New
reservoir and
pipeline required
R70m Funding still a
challenge
Regional Outcome 1: Basic Service Delivery Improvement
Regional Output 1.4: Enhance the Effectiveness and Efficiency of the Indigent Programme
Regional Sub Output 1.4.1: Alignment on Strategic Inputs
MUNI. CURRENT
STATUS QUO
CURRENT GAPS ESTIMATED
BUDGET
COMMENTS
Merafong 4038 Indigents receives
the free basic services
Registration of
indigents
R500,000 (6Kl
free supply)
List obtained from
indigent management
section, numbers keep
rising-linked to finance
department
-excluding informal
settlements
RWCLM Access to free basic
water
RWCLM is providing
6KL of free basic water
to indigent community
members
N/A N/A 7500 households are
registered as indigent
households in RWCLM
and are provided with
6KL of free basic water
Mogale Providing 6KL of free
basic water to indigent
community members
Ongoing
Registration of
indigents
R33m Installation of prepaid
meters. Ongoing

75
Regional Outcome 1: Basic Service Delivery Improvement
Regional Output 1.6: Provision of Quality and Reliable Sanitation and Waste Management
Regional Sub Output 1.6.1: Sewer Infrastructure and Maintenance
MUNI. CURRENT
STATUS QUO
CURRENT GAPS ESTIMATED
BUDGET
COMMENTS
RWCLM Ageing infrastructure
System cannot cope
with volumes due to
growing population
Recurring
blockages and
burst pipes
R100m A total of R20m per
annum is required to
upgrade ageing sewer
infrastructure
Khutsong:
Ext 3 outfall sewer line
collapsed due to
sinkhole formation
Area declared
under Disaster.
R22m Funding still a
challenge
Fochville/ Greenspark:
Outfall sewer line
overloaded
R30m Funding still a
challenge
Internal reticulation
sewer network
blockages due to load
(over loaded). Lines
encroached with
structures and
damaged
Lines
refurbishment
needs to be
done. Lines to be
re-routed
R35m Funding still a
challenge
Regional Outcome 1: Basic Service Delivery Improvement
Regional Output 1.6: Provision of Quality and Reliable Sanitation and Waste Management
Regional Sub Output 1.6.3: Sanitation Infrastructure and Maintenance
AREA CURRENT
STATUS QUO
CURRENT GAPS ESTIMATED
BUDGET
COMMENTS
RW City The Randfontein &
Badirile WWTW need
upgrading.
Limited capacity
at WWTW’s
R200m To accommodate new
housing
developments

76
Mogale Upgrade of current
sewer network to meet
increase demand from
Housing projects – all
areas
Sewer Pump station
upgrades to prevent
sewer spillages and
environmental
pollution – all areas
Provision of
environmentally
friendly toilets to
eliminate use of
chemical toilets – all
areas
150km of
network
required
All pump
stations are
under severe
pressure due to
old age and
increase in
development
Installation of
min. 6000
Enviro-loos to
improve
sanitation per
household and
reduce use of
chemical toilets
R375m
R120m
R90m
Increase in housing
development in
various areas and old
infrastructure
necessitated new
major upgrades and
more network
development
Feasibility studies to
be conducted to
provide exact needs
per area.
Service provider
appointed on an as
and when basis due to
budget constraints.
Merafong Khutsong - Ext 3 outfall
sewer line collapsed due
to sinkhole formation
Fochville/Greenspark
Internal sewer
reticulation network
blockages due to over
load. Lines encroached
with structures and
damaged
Area declared a
Disaster.
Outfall sewer line
overloaded
Lines
refurbishment
needs to be
done. Lines to be
re-routed
R22m
R30m
R35m
Funding a challenge
Funding a challenge
Funding a challenge

77
Regional Outcome 1: Basic Service Delivery Improvement
Regional Output 1.7: Provision of Quality and Reliable Water Supply
Regional Sub Output 1.7.1: Water Services Infrastructure and Maintenance
AREA CURRENT
STATUS QUO
CURRENT GAPS ESTIMATED
BUDGET
COMMENTS
Mogale Ageing
infrastructure and
asbestos pipes
Rand Water &
GIFA conducting
feasibility study
for water losses
due to aging
infrastructure
R450m To reduce water
losses as one of the
key objectives.
RWCLM Ageing
infrastructure and
asbestos pipes
prevalent
Ageing
infrastructure
resulting in
recurring burst
pipes
R100m Water networks need
to be refurbished to
eliminate water burst
pipes
Merafong Khutsong ,
Welverdiend,
Carletonville:
Aging infrastructure
not suitable for
dolomitic ground
need to be replaced
by HDPE pipes
Business plan
was submitted
to MIG
R242m Funding a challenge
Fochville:
Negative impact on
service delivery due
to aging
infrastructure
Asbestos
cement pipes
need to be
replaced and
related bulk
R300m Funding a challenge
Regional Outcome 1: Basic Service Delivery Improvement
Regional Output 1.7: Provision of Quality and Reliable Water Supply
Regional Sub Output 1.7.2: Quality Drinking Water
MUNI. CURRENT
STATUS QUO
CURRENT GAPS ESTIMATED
BUDGET
COMMENTS
RWCLM Compliant to DWS
Quality Standards
N/A R2m pa R2m per annum is
required to analyse
water samples at a
SANAS accredited
laboratory to comply
with DWS Blue Drop
requirements
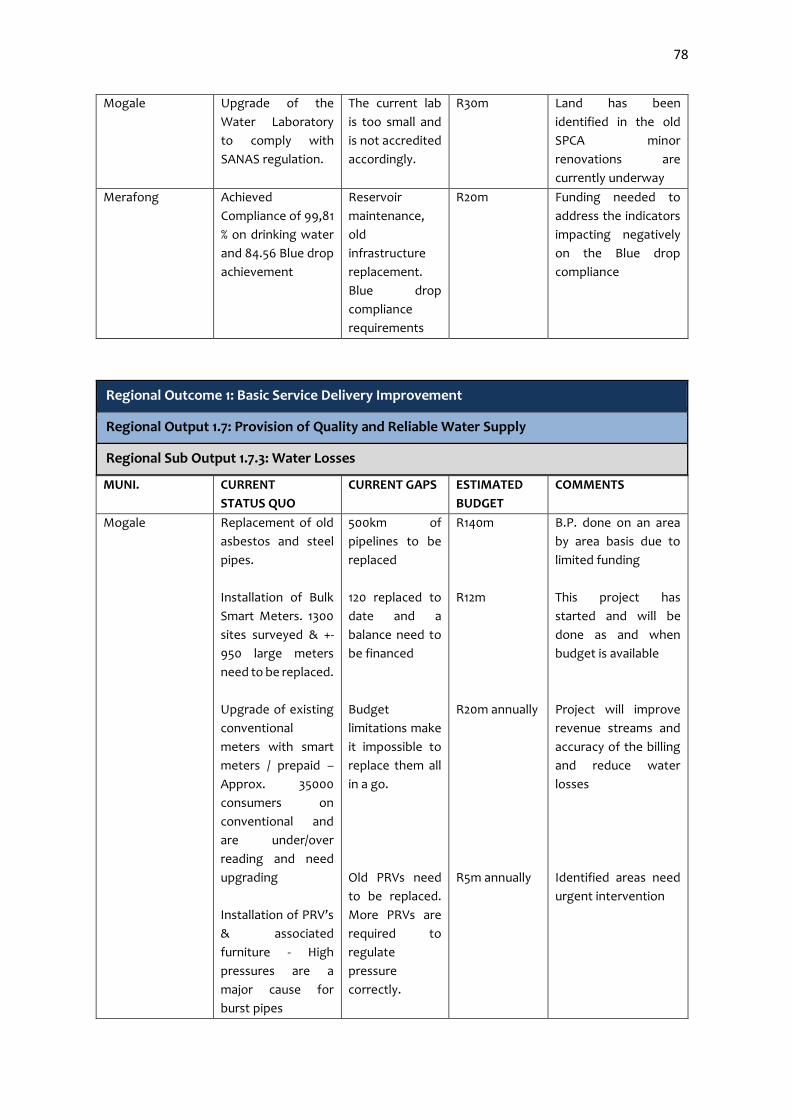
78
Mogale Upgrade of the
Water Laboratory
to comply with
SANAS regulation.
The current lab
is too small and
is not accredited
accordingly.
R30m Land has been
identified in the old
SPCA minor
renovations are
currently underway
Merafong Achieved
Compliance of 99,81
% on drinking water
and 84.56 Blue drop
achievement
Reservoir
maintenance,
old
infrastructure
replacement.
Blue drop
compliance
requirements
R20m Funding needed to
address the indicators
impacting negatively
on the Blue drop
compliance
Regional Outcome 1: Basic Service Delivery Improvement
Regional Output 1.7: Provision of Quality and Reliable Water Supply
Regional Sub Output 1.7.3: Water Losses
MUNI. CURRENT
STATUS QUO
CURRENT GAPS ESTIMATED
BUDGET
COMMENTS
Mogale Replacement of old
asbestos and steel
pipes.
Installation of Bulk
Smart Meters. 1300
sites surveyed & +-
950 large meters
need to be replaced.
Upgrade of existing
conventional
meters with smart
meters / prepaid –
Approx. 35000
consumers on
conventional and
are under/over
reading and need
upgrading
Installation of PRV’s
& associated
furniture - High
pressures are a
major cause for
burst pipes
500km of
pipelines to be
replaced
120 replaced to
date and a
balance need to
be financed
Budget
limitations make
it impossible to
replace them all
in a go.
Old PRVs need
to be replaced.
More PRVs are
required to
regulate
pressure
correctly.
R140m
R12m
R20m annually
R5m annually
B.P. done on an area
by area basis due to
limited funding
This project has
started and will be
done as and when
budget is available
Project will improve
revenue streams and
accuracy of the billing
and reduce water
losses
Identified areas need
urgent intervention

79
RWCLM 35% Water losses No zone
metering
R250m All water supply zones
require zone meters
to be able to quantify
water losses and
mitigate them
Merafong High water losses
due to lack of water
management
system, telemetry,
aging
infrastructure,
dolomitic instability,
metering, billing
Business plan
was submitted
to source
funding
R15m Funding a challenge
Regional Outcome 1: Basic Service Delivery Improvement
Regional Output 1.8: Optimise Infrastructure Utilisation
Regional Sub Output 1.8.1: Municipal Infrastructure and Maintenance
MUNI. CURRENT
STATUS QUO
CURRENT GAPS ESTIMATED
BUDGET
COMMENTS
RWCLM Ageing
infrastructure
Networks need
to be
refurbished
R200m R200m is required to
upgrade water and
sanitation
infrastructure over a
period of five years
Merafong Ageing
infrastructure,
sinkhole formation
Network need
to be
refurbished,
dolomite
strategy plan
needs to be in
place
R300m
Regional Outcome 1: Basic Service Delivery Improvement
Regional Output 1.10: Service Delivery Master Plans
Regional Sub Output 1.10.1: Master Plans Development
MUNI. CURRENT
STATUS QUO
CURRENT GAPS ESTIMATED
BUDGET
COMMENTS
RWCLM No Water and
Sanitation Master
Plan
Budget
constraints
Unknown It must be noted that
the previous
Westonaria and
Randfontein LM’s did
have master plans

80
Mogale Out dated Insufficient
funding
R5m Prepare business
plans to various
spheres to acquire
funding.
Merafong Not in place Lack of funding,
sourced funding
from DBSA
through MISA
R3m Awaiting
implementation
1.8.2. Target/measures to be achieved over the next 5 years (Water & Sanitation)
Regional Outcome 1: Basic Service Delivery Improvement
Regional Output 1.2: Secure Strategic Source of Water Supply (dams & reservoirs)
Regional Sub Output 1.2.1: Bulk Water
Muni. Year 1
2016/17
Year 2
2017/18
Year 3
2018/19
Year 4
2019/20
Year 5
2020/21
WRDM Formalisation of WRDM as Regional Water Services Authority
Preparation of Regional Water Services development Plan
Implementation of Regional Water Services development Plan
Implementation of Regional Water Services development Plan
Mogale Drafting and finalization of business plans
Securing of funding
Secure suitable land and funding to proceed with priority 1 reservoir.
Construction Construction Commissioning.
Randwest Planning and source funds
Appointment of consultants to design
Construction of reservoir 1
Construction of reservoir 2
Commissioning
Merafong Merafong LM
Planning and sourcing funding for Kokosi, Welevdiend and Carletonville
Khutsong Reservoir should be in construction stage, Reconstruction of Additional pipe line. Procurement processes for Kokosi, Welverdiend, Carletonville
Khutsong Reservoir should be in completion stage.
Construction process for Kokosi, Welverdiend, Carletonville
Construction process for Kokosi, Welverdiend, Carletonville
Completion stage Kokosi, Welverdiend, Carletonville
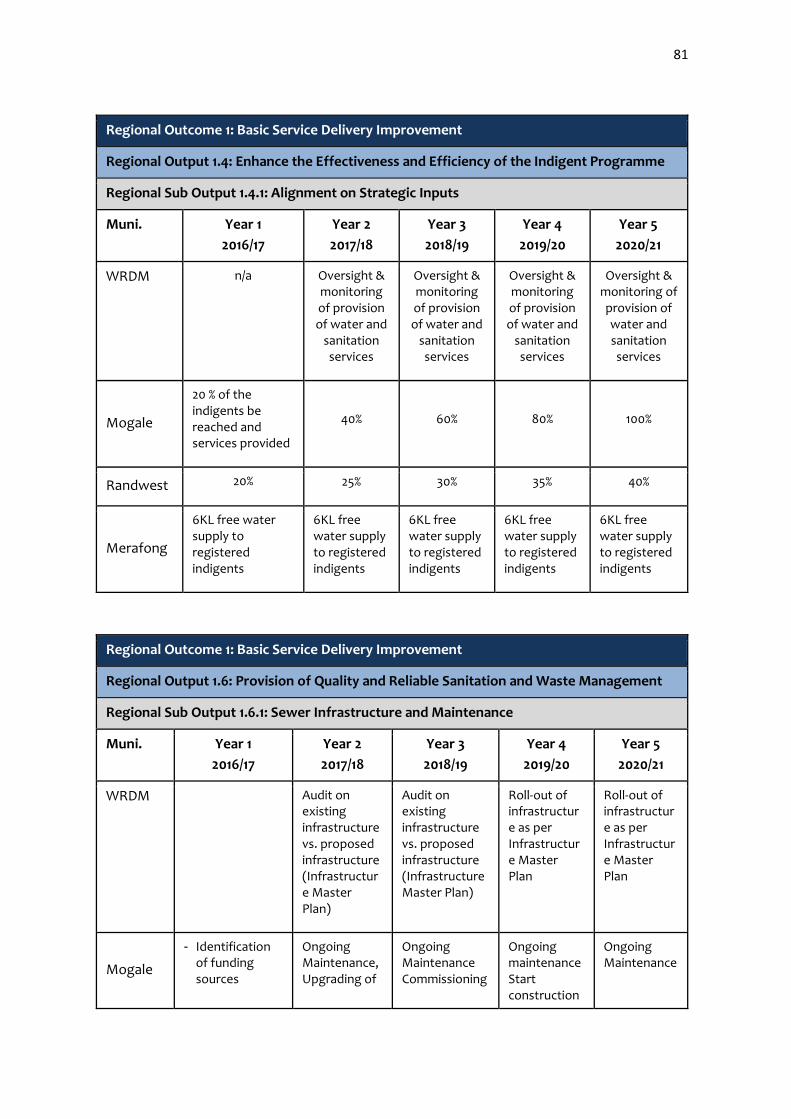
81
Regional Outcome 1: Basic Service Delivery Improvement
Regional Output 1.4: Enhance the Effectiveness and Efficiency of the Indigent Programme
Regional Sub Output 1.4.1: Alignment on Strategic Inputs
Muni. Year 1
2016/17
Year 2
2017/18
Year 3
2018/19
Year 4
2019/20
Year 5
2020/21
WRDM n/a Oversight & monitoring of provision of water and
sanitation services
Oversight & monitoring of provision of water and
sanitation services
Oversight & monitoring of provision of water and
sanitation services
Oversight & monitoring of provision of water and sanitation services
Mogale
20 % of the indigents be reached and services provided
40% 60% 80% 100%
Randwest 20% 25% 30% 35% 40%
Merafong
6KL free water supply to registered indigents
6KL free water supply to registered indigents
6KL free water supply to registered indigents
6KL free water supply to registered indigents
6KL free water supply to registered indigents
Regional Outcome 1: Basic Service Delivery Improvement
Regional Output 1.6: Provision of Quality and Reliable Sanitation and Waste Management
Regional Sub Output 1.6.1: Sewer Infrastructure and Maintenance
Muni. Year 1
2016/17
Year 2
2017/18
Year 3
2018/19
Year 4
2019/20
Year 5
2020/21
WRDM Audit on existing infrastructure vs. proposed infrastructure (Infrastructure Master Plan)
Audit on existing infrastructure vs. proposed infrastructure (Infrastructure Master Plan)
Roll-out of infrastructure as per Infrastructure Master Plan
Roll-out of infrastructure as per Infrastructure Master Plan
Mogale
- Identification of funding sources
Ongoing Maintenance, Upgrading of
Ongoing Maintenance Commissioning
Ongoing maintenance Start construction
Ongoing Maintenance
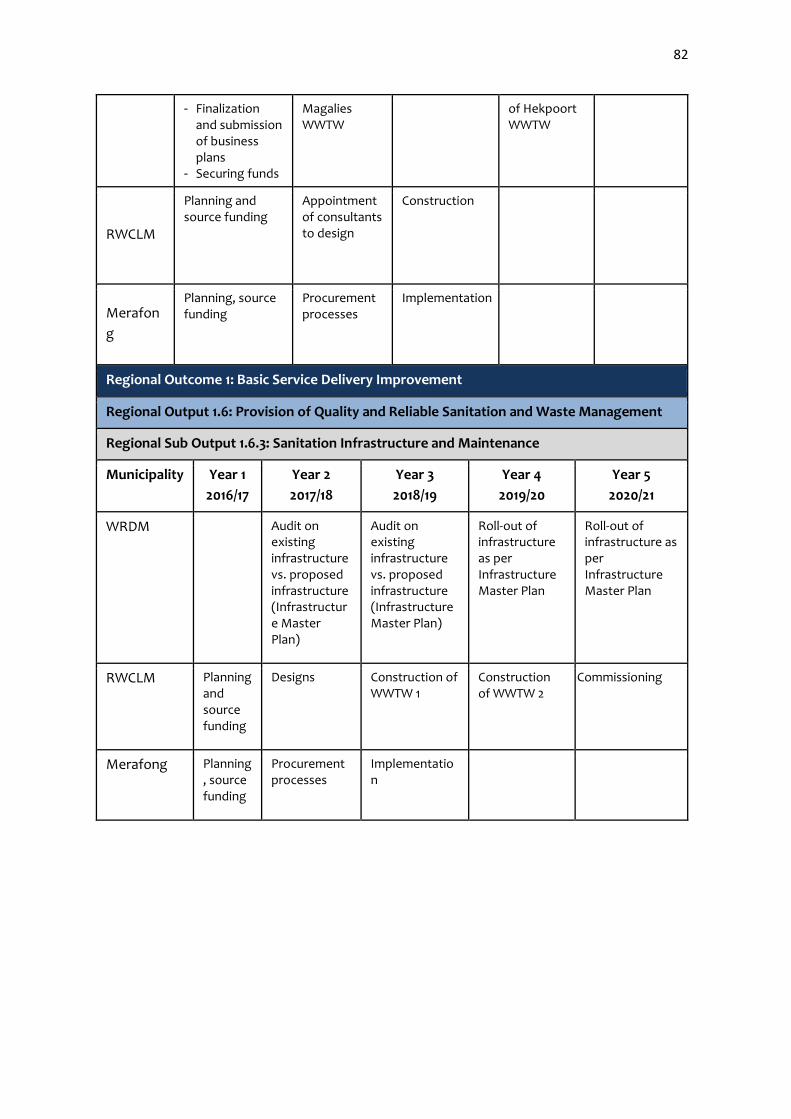
82
- Finalization and submission of business plans
- Securing funds
Magalies WWTW
of Hekpoort WWTW
RWCLM
Planning and source funding
Appointment of consultants to design
Construction
Merafon
g
Planning, source funding
Procurement processes
Implementation
Regional Outcome 1: Basic Service Delivery Improvement
Regional Output 1.6: Provision of Quality and Reliable Sanitation and Waste Management
Regional Sub Output 1.6.3: Sanitation Infrastructure and Maintenance
Municipality Year 1
2016/17
Year 2
2017/18
Year 3
2018/19
Year 4
2019/20
Year 5
2020/21
WRDM Audit on existing infrastructure vs. proposed infrastructure (Infrastructure Master Plan)
Audit on existing infrastructure vs. proposed infrastructure (Infrastructure Master Plan)
Roll-out of infrastructure as per Infrastructure Master Plan
Roll-out of infrastructure as per Infrastructure Master Plan
RWCLM Planning and source funding
Designs Construction of WWTW 1
Construction of WWTW 2
Commissioning
Merafong Planning, source funding
Procurement processes
Implementation
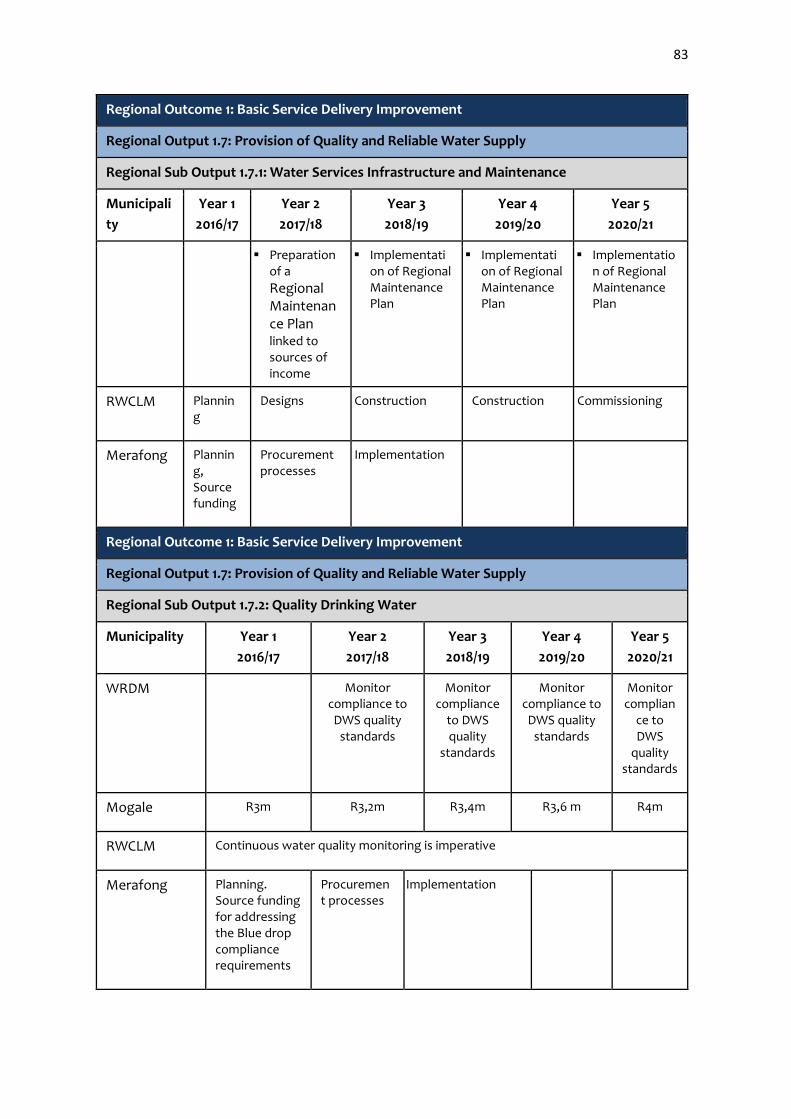
83
Regional Outcome 1: Basic Service Delivery Improvement
Regional Output 1.7: Provision of Quality and Reliable Water Supply
Regional Sub Output 1.7.1: Water Services Infrastructure and Maintenance
Municipali
ty
Year 1
2016/17
Year 2
2017/18
Year 3
2018/19
Year 4
2019/20
Year 5
2020/21
Preparation of a
Regional Maintenance Plan linked to sources of income
Implementation of Regional Maintenance Plan
Implementation of Regional Maintenance Plan
Implementation of Regional Maintenance Plan
RWCLM Planning
Designs Construction Construction Commissioning
Merafong Planning, Source funding
Procurement processes
Implementation
Regional Outcome 1: Basic Service Delivery Improvement
Regional Output 1.7: Provision of Quality and Reliable Water Supply
Regional Sub Output 1.7.2: Quality Drinking Water
Municipality Year 1
2016/17
Year 2
2017/18
Year 3
2018/19
Year 4
2019/20
Year 5
2020/21
WRDM Monitor compliance to DWS quality
standards
Monitor compliance
to DWS quality
standards
Monitor compliance to DWS quality
standards
Monitor complian
ce to DWS
quality standards
Mogale R3m R3,2m R3,4m R3,6 m R4m
RWCLM Continuous water quality monitoring is imperative
Merafong Planning. Source funding for addressing the Blue drop compliance requirements
Procurement processes
Implementation

84
Regional Outcome 1: Basic Service Delivery Improvement
Regional Output 1.8: Optimise Infrastructure Utilisation
Regional Sub Output 1.8.1: Municipal Infrastructure and Maintenance
Municipality Year 1
2016/17
Year 2
2017/18
Year 3
2018/19
Year 4
2019/20
Year 5
2020/21
RWCLM Planning Designs Construction Construction Construction
Planning,
source
funding
Procurement
processes
Implementation
Regional Outcome 1: Basic Service Delivery Improvement
Regional Output 1.7: Provision of Quality and Reliable Water Supply
Regional Sub Output 1.7.3: Water Losses
Municipality Year 1
2016/17
Year 2
2017/18
Year 3
2018/19
Year 4
2019/20
Year 5
2020/21
RWCLM Source funding Designs Install zone
meters
Install
zone
meters
Install
zone
meters
Merafong Achieve
planned water
loss
Target/measure
by addressing
water
management
system
resources
Plan, Source
funding
Procurement
processes
Implementation

85
Regional Outcome 1: Basic Service Delivery Improvement
Regional Output 1.10: Service Delivery Master Plans
Regional Sub Output 1.10.1: Master Plans Developed
Municipality Year 1
2016/17
Year 2
2017/18
Year 3
2018/19
Year 4
2019/20
Year 5
2020/21
Merafong Source
funds,
planning
Procurement,
Appoint
Service
Provider
Implementation
Additional Comments from Commission:
Drafting and finalisation of business plans
1.8.3. Game Changers /Strategic Projects (Water & Sanitation)
Regional Outcome 1: Basic Service Delivery Improvement
Regional Output 1.2: Secure Strategic Source of Water Supply (dams & reservoirs)
Regional Sub Output 1.2.1: Bulk Water
Muni. Year 1
2016/17
Year 2
2017/18
Year 3
2018/19
Year 4
2019/20
Year 1
2020/21
WRDM
Infrastructure
Master Plan
Appointment
as WSA
Stakeholder
and Public
participation
Bylaws,
policies and
tariffs
WSA fully
operational
WSA fully
operational
Mogale
Planning and
funding
Muldersdrift
N14
development
Construction Construction Commissioning
RWCLM Construction of 2 x reservoirs to unlock housing development in the RWCLM
Merafong
Construction of:
- Carletonville Reservoir,
- Fochville Reservoir,
- Replacement of Asbestos Cement pipes,

86
Regional Outcome 1: Basic Service Delivery Improvement
Regional Output 1.4: Enhance the Effectiveness and Efficiency of the Indigent Programme
Regional Sub Output 1.4.1: Alignment on Strategic Inputs
Muni. Year 1
2016/17
Year 2
2017/18
Year 3
2018/19
Year 4
2019/20
Year 1
2020/21
Mogale Database
cleansing of
indigent
registers
Merafong Increases or
decreases of
numbers on the
indigent register
Rand
West
Ensure that all qualifying community members benefit from the indigent
programme
Regional Outcome 1: Basic Service Delivery Improvement
Regional Output 1.6: Provision of Quality and Reliable Sanitation and Waste Management
Regional Sub Output 1.6.1: Sewer Infrastructure and Maintenance
Muni. Year 1
2016/17
Year 2
2017/18
Year 3
2018/19
Year 4
2019/20
Year 1
2020/21
Mogale Lindley
WWTW
construction
Construction
completed
Maintenance Maintenance
Merafong Upgrade security and mechanical components of the following WWTW’s: Kokosi,
Wedela, Khutsong, Oberholzer and Welverdiend.
RWCLM Zuurbekom
WWTW
Mohlakeng
pump station
Zuurbekom
WWTW
Regional Outcome 1: Basic Service Delivery Improvement
Regional Output 1.6: Provision of Quality and Reliable Sanitation and Waste Management
Regional Sub Output 1.6.3: Sanitation Infrastructure and Maintenance
Muni. Year 1
2016/17
Year 2
2017/18
Year 3
2018/19
Year 4
2019/20
Year 1
2020/21
Mogale
Finalize the
implementation
Secure
funding and
Construction Construction
completion
and
Operational.

87
plan of Lindley
WWTW
start
construction.
commissioning
of WWTW.
RWCLM The upgrading of the two WWTW will accommodate new housing developments
in Randfontein and Badirile, the Zuurbekom WWTW is under construction
Mogale
Finalize the
implementation
plan of Lindley
WWTW
Secure
funding and
start
construction.
Construction Construction
completion
and
commissioning
of WWTW.
Operational.
Regional Outcome 1: Basic Service Delivery Improvement
Regional Output 1.7: Provision of Quality and Reliable Water Supply
Regional Sub Output 1.7.1: Water Services Infrastructure and Maintenance
Muni. Year 1
2016/17
Year 2
2017/18
Year 3
2018/19
Year 4
2019/20
Year 1
2020/21
Mogale Ageing
infrastructure
and asbestos
pipes
Secure
funding and
start with
construction
of priority
one area.
Proceed with
construction
of priority 2
area
Proceed with
construction
of priority 3
area
Proceed with
construction
of priority 4
area
RWCLM The upgrading of water networks will result in uninterrupted drinking water
supply to communities and will eliminate water burst pipes
Merafong Replace aging infrastructure
Regional Outcome 1: Basic Service Delivery Improvement
Regional Output 1.7: Provision of Quality and Reliable Water Supply
Regional Sub Output 1.7.2: Quality Drinking Water
Muni. Year 1
2016/17
Year 2
2017/18
Year 3
2018/19
Year 4
2019/20
Year 1
2020/21
Mogale Laboratory –
R 30m – can
provide
service to
other LM’s.
Ensure
accreditation of
Lab.
RWCLM
Merafong
Address the
compliance
requirements

88
Regional Outcome 1: Basic Service Delivery Improvement
Regional Output 1.7: Provision of Quality and Reliable Water Supply
Regional Sub Output 1.7.3: Water Losses
Muni. Year 1
2016/17
Year 2
2017/18
Year 3
2018/19
Year 4
2019/20
Year 1
2020/21
WRDM Analyse and develop strategy
to kerb water losses
Implementation of strategy to
kerb water losses
Implementation of strategy to
kerb water losses
Review of strategy to kerb water
losses
Analyse and develop
strategy to kerb water
losses
Mogale Meter upgrade
program. Top
100 water
user’s priority
program.
Prepaid water
meter
installation
program,
Water pipe
replacement
program
Zonal meter
installation
and
maintenance
Reduce
reaction
time on
service
requests.
RWCLM Source funding Designs Install zone meters
Install zone meters
Install zone meters
Merafong Achieve planned water loss Target/measure by addressing water management system resources
Plan, Source funding
Procurement processes
Implementation
Regional Outcome 1: Basic Service Delivery Improvement
Regional Output 1.8: Optimise Infrastructure Utilisation
Regional Sub Output 1.8.1: Municipality Infrastructure and Maintenance
Municipality Year 1
2016/17
Year 2
2017/18
Year 3
2018/19
Year 4
2019/20
Year 1
2020/21
RWCLM Elimination of sewer blockages and water burst pipes
Merafong Replacement of aging infrastructure, Asbestos cement pipe
1.8.4. Key Risk & Challenges (Water & Sanitation)
Regional Outcome 1: Basic Service Delivery Improvement
Regional Output 1.2: Secure Strategic Source of Water Supply (dams & reservoirs)
Regional Sub Output 1.2.1: Bulk Water
Municipality Key Risks and Challenges

89
WRDM Funding for key regional bulk infrastructure development, financial
support to continue supporting local municipalities
Mogale Funding
RWCLM Funding and land availability
Merafong Funding and sinkhole formation
Regional Outcome 1: Basic Service Delivery Improvement
Regional Output 1.4: Enhance the Effectiveness and Efficiency of the Indigent Programme
Regional Sub Output 1.4.1: Alignment on Strategic Inputs
Municipality Key Risks and Challenges
Mogale - Increasing numbers
- Database maintenance
- Finance
RWCLM Non qualifying community members applying for indigent and not
reaching all community members that qualify
Merafong Database maintenance, finance, increasing numbers
Regional Outcome 1: Basic Service Delivery Improvement
Regional Output 1.6: Provision of Quality and Reliable Sanitation and Waste Management
Regional Sub Output 1.6.1: Sewer Infrastructure and Maintenance
Municipality Key Risks and Challenges
WRDM Funding and skills
Mogale Funding and skills
RWCLM Funding and skills
Merafong Funding and skills
Regional Outcome 1: Basic Service Delivery Improvement
Regional Output 1.6: Provision of Quality and Reliable Sanitation and Waste Management
Regional Sub Output 1.6.3: Sanitation Infrastructure and Maintenance
Municipality Key Risks and Challenges
Mogale Funding and skills
RWCLM Funding and skills
Merafong Funding, skills and sinkhole formation

90
Outcome 1: Basic Service Delivery Improvement
Output 1.7: Maintain Efficient Water Treatment Infrastructures
Sub Output 1.7.1: Water Services Infrastructure and Maintenance
Municipality General Comments/ Requests
Mogale Funding and skills
RWCLM Funding and skills
Merafong Funding, skills and sinkhole formation
Outcome 1: Basic Service Delivery Improvement
Output 1.7: Maintain Efficient Water Treatment Infrastructures
Sub Output 1.7.2: Quality Drinking Water
Municipality General Comments/ Requests
Mogale Funding and skills
RWCLM Funding and skills
Merafong Funding and skills
Regional Outcome 1: Basic Service Delivery Improvement
Regional Output 1.7: Provision of Quality and Reliable Water Supply
Regional Sub Output 1.7.3: Water Losses
Municipality Key Risks and Challenges
Mogale Lack of funds
RWCLM Funding and increasing water losses resulting in loss of revenue
Merafong Lack of funding, sinkhole formation
Regional Outcome 1: Basic Service Delivery Improvement
Regional Output 1.8: Optimise Infrastructure Utilisation
Regional Sub Output 1.8.1: Municipal Infrastructure and Maintenance
Municipality Key Risks and Challenges
RWCLM Funding
Merafong Funding and sinkhole formation

91
Regional Outcome 1: Basic Service Delivery Improvement
Regional Output 1.10: Service Delivery Master Plan
Regional Sub Output 1.10.1: Master Plans Development
Municipality Key Risks and Challenges
Mogale Funding
RWCLM Funding
Merafong Funding commitment from DBSA
1.8.5. General Comments Request (Water & Sanitation)
Outcome 1: Basic Service Delivery Improvement
Output 1.2: Secure Strategic Source of Water Supply (dams & reservoirs)
Sub Output 1.2.1: Bulk Water
Municipality General Comments/ Requests
Mogale There was a general consensus at the Commission on the WRDM
acquiring WSA status.
RWCLM The Rand West City Local Municipality need 2 additional reservoirs to
be able to cater for new developments in the municipality
Merafong Availability of funds to achieve plans
Outcome 1: Basic Service Delivery Improvement
Output 1.4: Enhance the Effectiveness and Efficiency of the Indigent Programme
Sub Output 1.4.1: Alignment on Strategic Inputs
Municipality General Comments/ Requests
Mogale Insufficient statistics available
Outreach programs to be encouraged
RWCLM The Rand West City Local Municipality is committed to providing all
qualifying community members with indigent benefits
Merafong Indigents not coming forth to renew Contract
Outcome 1: Basic Service Delivery Improvement
Output 1.6: Provision of Quality and Reliable Sanitation and Waste Management
Sub Output 1.6.1: Sewer Infrastructure and Maintenance
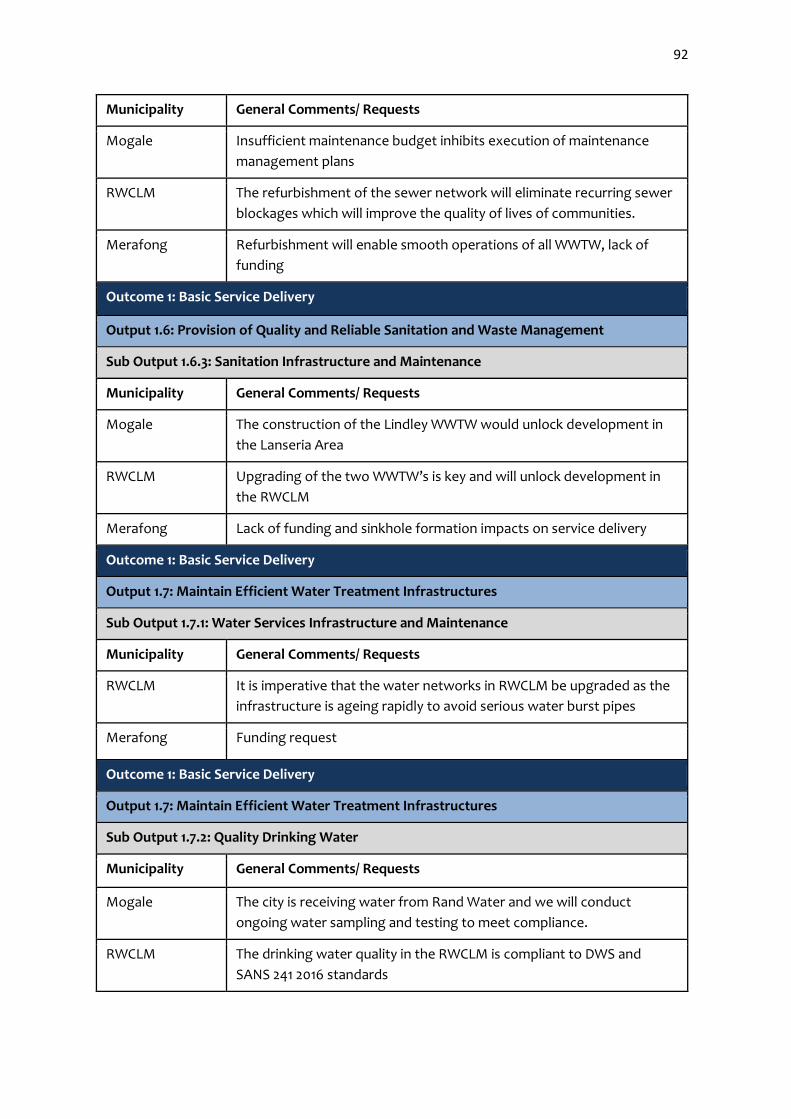
92
Municipality General Comments/ Requests
Mogale Insufficient maintenance budget inhibits execution of maintenance
management plans
RWCLM The refurbishment of the sewer network will eliminate recurring sewer
blockages which will improve the quality of lives of communities.
Merafong Refurbishment will enable smooth operations of all WWTW, lack of
funding
Outcome 1: Basic Service Delivery Improvement
Output 1.6: Provision of Quality and Reliable Sanitation and Waste Management
Sub Output 1.6.3: Sanitation Infrastructure and Maintenance
Municipality General Comments/ Requests
Mogale The construction of the Lindley WWTW would unlock development in
the Lanseria Area
RWCLM Upgrading of the two WWTW’s is key and will unlock development in
the RWCLM
Merafong Lack of funding and sinkhole formation impacts on service delivery
Outcome 1: Basic Service Delivery Improvement
Output 1.7: Maintain Efficient Water Treatment Infrastructures
Sub Output 1.7.1: Water Services Infrastructure and Maintenance
Municipality General Comments/ Requests
RWCLM It is imperative that the water networks in RWCLM be upgraded as the
infrastructure is ageing rapidly to avoid serious water burst pipes
Merafong Funding request
Outcome 1: Basic Service Delivery Improvement
Output 1.7: Maintain Efficient Water Treatment Infrastructures
Sub Output 1.7.2: Quality Drinking Water
Municipality General Comments/ Requests
Mogale The city is receiving water from Rand Water and we will conduct
ongoing water sampling and testing to meet compliance.
RWCLM The drinking water quality in the RWCLM is compliant to DWS and
SANS 241 2016 standards

93
Outcome 1: Basic Service Delivery Improvement
Output 1.7: Maintain Efficient Water Treatment Infrastructures
Sub Output 1.7.3: Water Losses
Municipality General Comments/ Requests
Mogale Review the WSP, implementation program and ongoing
monitoring. Need dedicated WCDM Team
RWCLM The Rand West City Local Municipality is committed to reducing
water losses to acceptable levels. Need dedicated WCDM Team
Merafong Need dedicated WCDM Team
WCDM Funding to curb water losses and implementation of
planned strategy
DWS / GIFA /
MMC
All projects need to be reflected in the WSP.
Assistance being offered by GIFA-
Indications of job opportunities and skills gap relative to
unemployment figures-in response to regional outcome for
unemployment reduction
Outcome 1: Basic Service Delivery Improvement
Output 1.8: Optimise Infrastructure Utilisation
Sub Output 1.8.1: Municipal Infrastructure and Maintenance
Municipality General Comments/ Requests
RWCLM Water and Sanitation networks are ageing and need to be replaced
with new ones
Merafong Lack of funding affects the running smooth of the institution
Outcome 1: Basic Service Delivery Improvement
Output 1.10: Service Delivery Master Plans
Sub Output 1.10.1: Master Plans Development
Municipality General Comments/ Requests
WRDM Intends appointing a Service Provider to Develop various Master Plans.
Funding Challenge.
Mogale Secure funding then assign the project to Consulting Engineers.
RWCLM The Rand West City LM needs a Water and Sanitation Master Plan
Merafong Funding was sourced from DBSA through MISA

94
Plenary Comments / Feedback/ Recommendations
a) Powers and functions issue needs to be cleraly defined
b) Specific Target/measures need to be indicated
c) The moritarium issue on personnel should not be confused with individual municipality
constraints
d) Revisit the acid mine drainage issue
e) Syferfontein and Zuurbekom Waste Water Treatment Works are one and the same thing
f) Kokosi is actually Khutsong Reservoir and is collapsing, need to be looked into.
g) Look ito the capacity of Fochville Reservoir ext. 6, is pressure enough to supply ext 6 and 7?
h) Consider the issues of no bulk storage in Khutsong and Carletonville
i) Consider other and specific funding avenues
j) Revisit the issues of quality of water with regards to acid mine water and drain water
k) Interogate the legalties in terms of mines not using portable water for their activities.
l) On indigents – need to go 1 step further as to the possibility of standardising the approach in
suporting them.
m) Which policies and regulations are informing the Regional Model on indigents.
n) A lack of alignment in planning at a Regional level and not in pockets of constituent
municipalities was observed
o) Not clear about stated game changers being related to stated outcomes
p) Questioning whether or not there is a shift towards standardising baselines to enable
effective reporting
q) Silent on how to manage water losses which includes maintenance which is key in addressing
water shortages

95
1.9. Roads, Transport and Storm Water Commission (Development Strategy – Roads, Transport
and Storm Water)
The Roads, Transport and Stormwater Commission focussed on the Following Regional
Outcomes, Outputs and Sub Outputs. Below is the inputs as received from the Commission.
Regional Outcome 1: Basic Service Delivery
o Regional Output 1.1: Ensure Integrated Transport Planning
Regional Sub Output 1.1.1: Road Maintenance
*Regional Sub Output 1.1.2: Transport Planning
*Regional Sub-output 1.1.2 should read Transport Planning and should be treated within the
Regional context as WRDM has been assigned the function of Transport Planning in terms of
legislation.
o Regional Output 1.9: Reduce Outsourced Municipal Services
Regional Sub Output 1.9.1: Identification and Implementation of Initiatives
to reduce Outsourcing
o Regional Output 1.10: Service Delivery Master Plans
Regional Sub Output 1.10.1: Master Plans Development
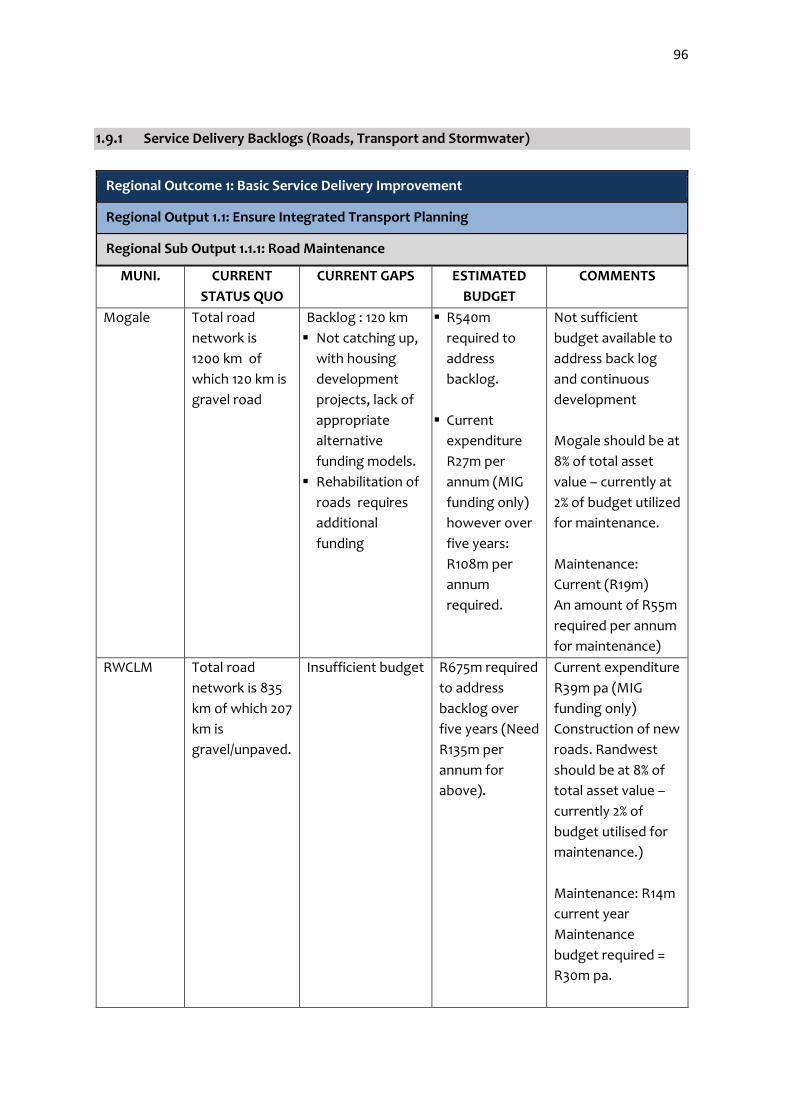
96
1.9.1 Service Delivery Backlogs (Roads, Transport and Stormwater)
Regional Outcome 1: Basic Service Delivery Improvement
Regional Output 1.1: Ensure Integrated Transport Planning
Regional Sub Output 1.1.1: Road Maintenance
MUNI. CURRENT
STATUS QUO
CURRENT GAPS ESTIMATED
BUDGET
COMMENTS
Mogale Total road
network is
1200 km of
which 120 km is
gravel road
Backlog : 120 km
Not catching up,
with housing
development
projects, lack of
appropriate
alternative
funding models.
Rehabilitation of
roads requires
additional
funding
R540m
required to
address
backlog.
Current
expenditure
R27m per
annum (MIG
funding only)
however over
five years:
R108m per
annum
required.
Not sufficient
budget available to
address back log
and continuous
development
Mogale should be at
8% of total asset
value – currently at
2% of budget utilized
for maintenance.
Maintenance:
Current (R19m)
An amount of R55m
required per annum
for maintenance)
RWCLM Total road
network is 835
km of which 207
km is
gravel/unpaved.
Insufficient budget R675m required
to address
backlog over
five years (Need
R135m per
annum for
above).
Current expenditure
R39m pa (MIG
funding only)
Construction of new
roads. Randwest
should be at 8% of
total asset value –
currently 2% of
budget utilised for
maintenance.)
Maintenance: R14m
current year
Maintenance
budget required =
R30m pa.
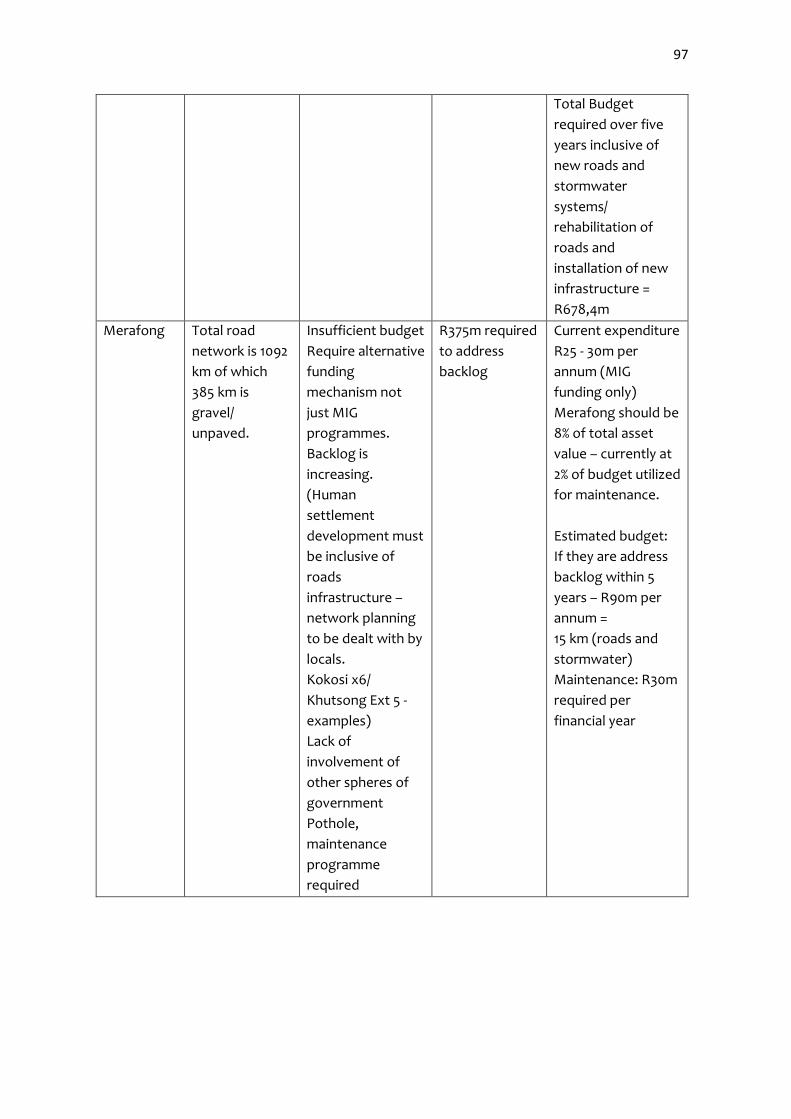
97
Total Budget
required over five
years inclusive of
new roads and
stormwater
systems/
rehabilitation of
roads and
installation of new
infrastructure =
R678,4m
Merafong Total road
network is 1092
km of which
385 km is
gravel/
unpaved.
Insufficient budget
Require alternative
funding
mechanism not
just MIG
programmes.
Backlog is
increasing.
(Human
settlement
development must
be inclusive of
roads
infrastructure –
network planning
to be dealt with by
locals.
Kokosi x6/
Khutsong Ext 5 -
examples)
Lack of
involvement of
other spheres of
government
Pothole,
maintenance
programme
required
R375m required
to address
backlog
Current expenditure
R25 - 30m per
annum (MIG
funding only)
Merafong should be
8% of total asset
value – currently at
2% of budget utilized
for maintenance.
Estimated budget:
If they are address
backlog within 5
years – R90m per
annum =
15 km (roads and
stormwater)
Maintenance: R30m
required per
financial year

98
Regional Outcome 1: Basic Service Delivery Improvement
Regional Output 1.1: Ensure Integrated Transport Planning
Regional Sub Output 1.1.2: Transport Planning
MUNI. CURRENT
STATUS QUO
CURRENT GAPS ESTIMATED
BUDGET
COMMENTS
WRDM Transport
planning
discipline
assigned to
district. No
transport
planning
divisions at
local level.
Outdated ITP
and outdated
OLS/CPTR
Outdated DITP
and LITP
R3,5m WRDM prepares
documentation on
behalf of district and
locals. Inclusive of
OLS and CPTR
Regional Outcome 1: Basic Service Delivery Improvement
Regional Output 1.9: Reduce Outsourced Municipal Services
Regional Sub Output 1.9.1: Identification and Implementation of Initiatives to reduce
Outsourcing
MUNI. CURRENT
STATUS QUO
CURRENT
GAPS
ESTIMATED
BUDGET
COMMENTS
WRDM No design
capacity, project
engineers,
planning
resources and
archiving systems
(GIS).
Development
of a regional
design centre
project
engineers,
planning
resources and
archiving
systems (GIS).
R15m pa Ongoing training of
design centre
personnel
Mogale Vacancy rate is a
major constraint
in meeting the
service delivery
demands
Vacancy per
approved
structure,
approximately
35 %
R10m pa Filling of vacant
post to ensure
reduction the use of
external service
providers and
overtime reduction

99
RWCLM Vacancy rate is a
major constraint
in meeting the
service delivery
demands
Vacancy per
approved
structure,
approximately
50 %
R9m pa Filling of vacant
post to ensure
reduction the use of
external service
providers and
overtime reduction
Regional Outcome 1: Basic Service Delivery Improvement
Regional Output 1.10: Service Delivery Master Plans
Regional Sub Output 1.10.1: Master Plans Development
MUNI. CURRENT
STATUS QUO
CURRENT
GAPS
ESTIMATED
BUDGET
COMMENTS
WRDM Infrastructure
Master Plan
(2012)
Outdated
information
R16m Appointment of
service provider to
attend to Super
Infrastructure
Master Plan
pending.
Mogale Update and
maintain
Pavement
Management
System.
Currently in
process of
developing road
infrastructure
development
plan.
Road and
Stormwater
Assets
Management
Plan in use.
Develop,
review and
update of
various
applicable
plans.
R4m Plans and process
to be aligned on
regional level.
RWCLM Outdated
Infrastructure
Master Plan,
Pavement
Management
Plan and IQMS
outdated.
No Roads and
Stormwater
Asset
Develop,
review and
update of
various
applicable
plans.
R6m Plans and process
to be aligned on
regional level.

100
Management
Plan
Merafong No master plan in
place. National
currently having a
consultant on site
conducting
studies for the
development of a
PMS
Absence of
PMS making it
difficult to
plan for long
term, having
the data for
design life
span of assets
Funded
directly by
National
Government
Expecting
completion by June
2017.
1.9.2. Target/measures to be achieved over the next 5 years (Roads, Transport and
Stormwater)
Regional Outcome 1: Basic Service Delivery Improvement
Regional Output 1.1: Ensure Integrated Transport Planning
Regional Sub Output 1.1.1: Road Maintenance
Muni. Year 1
2016/17
Year 2
2017/18
Year 3
2018/19
Year 4
2019/20
Year 5
2020/21
WRDM Preparation of a
Regional Maintenance Plan linked to sources of income
Implementation of Regional Maintenance Plan
Implementation of Regional Maintenance Plan
Implementation of Regional Maintenance Plan
Mogale R 163m
Maintenance (1 200 km) of assets and backlog eradication
(24 kilometres constructed per year)
R 163m
Maintenance
(1 200 km) of assets and backlog eradication
(24 kilometres constructed per year)
R 163m
Maintenance
(1 200 km) of assets and backlog eradication
(24 kilometres constructed per year)
R 163m
Maintenance
(1 200 km) of assets and backlog eradication
(24 kilometres constructed per year)
R 163m
Maintenance
(1 200 km) of assets and backlog eradication
(24 kilometres constructed per year)
RWCLM R165m
Maintenance (835 km) of
R165m
Maintenance (835 km) of
R165m
Maintenance (835 km) of
R165m
Maintenance (835 km) of
R165m
Maintenance (835 km) of

101
assets and backlog eradication
(42 kilometres constructed per year)
assets and backlog eradication
(42 kilometres constructed per year)
assets and backlog eradication
(42 kilometres constructed per year)
assets and backlog eradication
(42 kilometres constructed per year)
assets and backlog eradication
(39 kilometres constructed per year)
Merafong R375m
Maintenance (1092 km) of assets and backlog eradication
(15 km constructed per year).
R90m
Maintenance of assets and backlog eradication
(15 kilometres constructed per year).
R90m
Maintenance of assets and backlog eradication
(15 kilometres constructed per year).
R90m
Maintenance of assets and backlog eradication
(15 kilometres constructed per year).
R90m
Maintenance of assets and backlog eradication
(15 kilometres constructed per year).
Regional Outcome 1: Basic Service Delivery Improvement
Regional Output 1.1: Ensure Integrated Transport Planning
Regional Sub Output 1.1.2: Transport Planning
Muni. Year 1
2016/17
Year 2
2017/18
Year 3
2018/19
Year 4
2019/20
Year 5
2020/21
WRDM Preparation
of DITP and
LITP.
Facilitation of
MoU
between
WRDM and
Taxi
Fraternity
Framework
plan -
Integrated
Network
planning
(Province/
National)
Non-
motorised
transport
Signage of
MoU (District
and Taxi’s)
and rollout
plan
Preparation
and
Promulgation
of by-laws
Formulation
and
promulgation
of tuc-tuc by-
laws
Taxi Rank
Audit and
rank
management
Review of rail
master plan.
Framework
policy for
intermodal
facilities and
alignment
with BRT
(Jhb)
Framework
plan for
extension of
Gautrain to
West Rand.
Framework
plan –
extension of
N17 to West
Rand
developed
Implementati
on of
Gautrain
Framework
Plan.
Implementati
on of N17
Framework
Plan

102
strategy
revised
Preparation
of Bill Board
policy for taxi
ranks and
road reserves
plan – policy
development
Development
of Heavy
vehicle
mobility
strategy
(inclusive of
regional and
mobile weigh
bridges)
Mogale Plans
prepared by
WRDM on
behalf of
locals
Adoption of
Integrated
Network
framework
plan
Implementati
on of non-
motorised
strategy
Implementati
on of taxi
rank
management
plans and
upgrade of
identified taxi
ranks
Enforcement
of by-laws
Implementati
on of Freight
strategy
(phased
approach
over 5 year
period).
Implementati
on of regional
Bill Board
Policy
Identification
of rail sidings
and possible
linkages with
BRT.
Implementati
on of Freight
strategy
(phased
approach
over 5 year
period).
Identification
of Park-n-Ride
facilities.
Upgrade of
collector
roads to link
to major
Arterials(N14
Implementati
on of Freight
strategy
(phased
approach
over 5 year
period).
Implementati
on of Freight
strategy
(phased
approach
over 5 year
period).
RWCLM Plans
prepared by
WRDM on
behalf of
locals
Adoption of
Integrated
Network
framework
plan
Implementati
on of taxi
rank
management
plans and
upgrade of
identified taxi
ranks
Enforcement
of by-laws
Identification
of rail sidings
and possible
linkages with
BR
Implementati
on of Freight
strategy
(phased
approach
over period of
Identification
of Park-n -
Ride facilities
Upgrade of
collector
roads to link
to major
Arterials(N14/
R28)
Implementati
on of Freight
Implementati
on of strategy
Implementati
on of Freight
strategy
(phase
approach
over period of
5
years )

103
Implementati
on of non-
motorised
strategy
Implementati
on of Freight
strategy
(Phased
approach)
Implementati
on of
regional Bill
Board Policy
5
years )
strategy
(phased
approach
over period of
5
years )
Merafo
ng
Plans
prepared by
WRDM on
behalf of
locals
Adoption of
Integrated
Network
framework
plan
Implementati
on of non-
motorised
strategy
Implementati
on of taxi
rank
management
plans and
upgrade of
identified taxi
ranks
Enforcement
of by-laws
Implementati
on of Freight
strategy
Implementati
on of
regional Bill
Board Policy
Identification
of rail sidings
and possible
linkages with
BRT
Identification
of Park-n-Ride
facilities
Upgrade of
collector
roads to link
to major
Arterials (N12)
Implementati
on of strategy
Implementati
on of Freight
strategy
(phase
approach
over period of
5
years )
Regional Outcome 1: Basic Service Delivery Improvement
Regional Output 1.9: Reduce Outsourced Municipal Services
Regional Sub Output 1.9.1: Identification and Implementation of Initiatives to reduce
Outsourcing
Municipality Year 1
2016/17
Year 2
2017/18
Year 3
2018/19
Year 4
2019/20
Year 5
2020/21
Mogale Increase
personnel by
R2m budget
to reduce
vacancy, and
thus
reducing
Increase
personnel by
R2m budget
to reduce
vacancy, and
thus
reducing
Increase
personnel by
R2m budget
to reduce
vacancy, and
thus
reducing
Increase
personnel by
R2m budget
to reduce
vacancy, and
thus
reducing
Increase
personnel by
R2m budget
to reduce
vacancy,
reducing
external
dependency
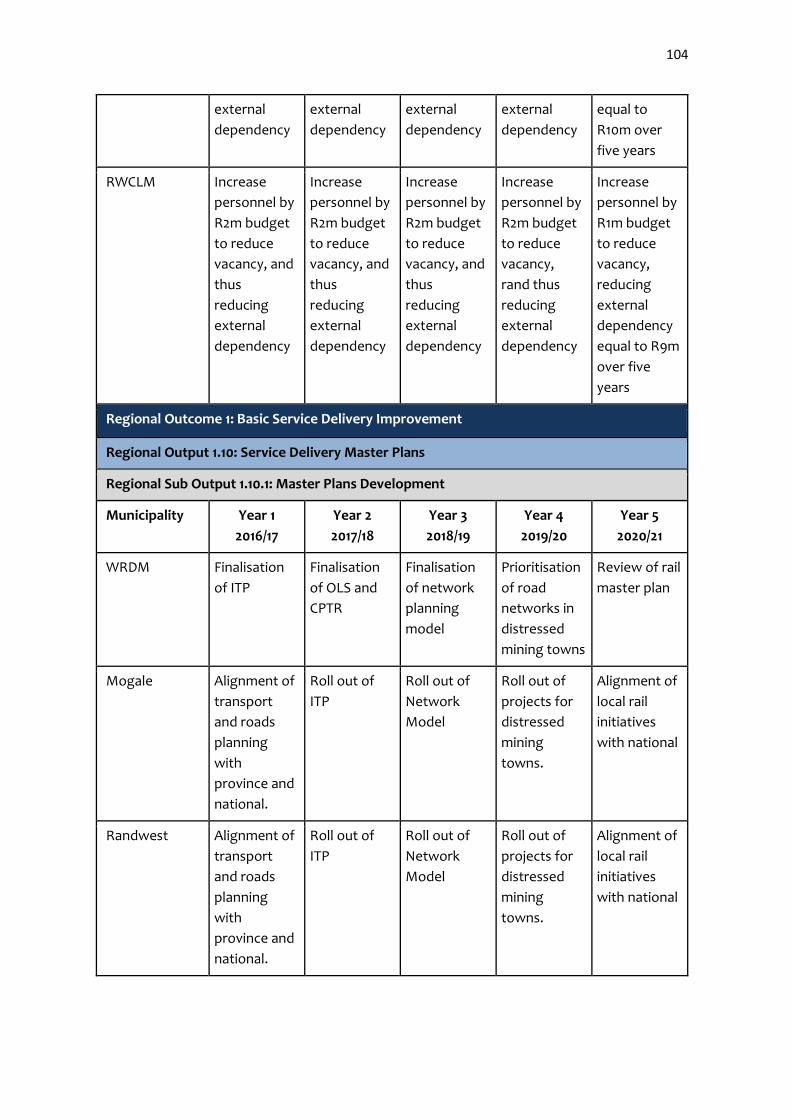
104
external
dependency
external
dependency
external
dependency
external
dependency
equal to
R10m over
five years
RWCLM Increase
personnel by
R2m budget
to reduce
vacancy, and
thus
reducing
external
dependency
Increase
personnel by
R2m budget
to reduce
vacancy, and
thus
reducing
external
dependency
Increase
personnel by
R2m budget
to reduce
vacancy, and
thus
reducing
external
dependency
Increase
personnel by
R2m budget
to reduce
vacancy,
rand thus
reducing
external
dependency
Increase
personnel by
R1m budget
to reduce
vacancy,
reducing
external
dependency
equal to R9m
over five
years
Regional Outcome 1: Basic Service Delivery Improvement
Regional Output 1.10: Service Delivery Master Plans
Regional Sub Output 1.10.1: Master Plans Development
Municipality Year 1
2016/17
Year 2
2017/18
Year 3
2018/19
Year 4
2019/20
Year 5
2020/21
WRDM Finalisation
of ITP
Finalisation
of OLS and
CPTR
Finalisation
of network
planning
model
Prioritisation
of road
networks in
distressed
mining towns
Review of rail
master plan
Mogale Alignment of
transport
and roads
planning
with
province and
national.
Roll out of
ITP
Roll out of
Network
Model
Roll out of
projects for
distressed
mining
towns.
Alignment of
local rail
initiatives
with national
Randwest Alignment of
transport
and roads
planning
with
province and
national.
Roll out of
ITP
Roll out of
Network
Model
Roll out of
projects for
distressed
mining
towns.
Alignment of
local rail
initiatives
with national

105
Merafong Alignment of
transport
and roads
planning
with
province and
national.
Roll out of
ITP
Roll out of
Network
Model
Roll out of
projects for
distressed
mining
towns.
Alignment of
local rail
initiatives
with national
1.9.3. Game Changers / Strategic Projects (Roads, Transport and Stormwater)
Regional Outcome 1: Basic Service Delivery Improvement
Regional Output 1.1: Ensure Integrated Transport Planning
Regional Sub Output 1.1.1: Road Maintenance
Muni. Year 1
2016/17
Year 2
2017/18
Year 3
2018/19
Year 4
2019/20
Year 5
2020/21
WRDM Preparation
of Network
development
plan inclusive
of local
initiatives.
Roll out of
network
development
plan
Roll out of
network
development
plan
Roll out of
network
development
plan
Roll out of
network
development
plan
Mogale Leratong
Intermodal
Development
(Phased
approach,
R150m)
N14 Corridor
development
(Phased
approach)
Phase 1
Pinehaven
intersection
(R600m)
K13 extension
from
Rietvallei to
Zuurbekom
(7 km, R120m)
Link road
from
Rietvallei to
Toekomsrus
(6km, R75m)
Upgrade of
Robert Broom
drive
(4 km, R50m)
N14 Corridor
development
(Phased
approach)
Phase 2
Lanseria
development
(R250m)
RWCLM Upgrade of
R41 and R559
(phased
approach)
Upgrade of
R41 and R559
(phased
approach)
Construction
of K11-
diversion of
heavy
vehicles
(Phased
approach)
Reconstruction
of D762
(Link road to
Carletonville)
Reconstruction
of D448
(Ventersdorp
to Rustenburg)

106
Merafon
g
Construction
of the
Khutsong
Bridge linking
Khutsong
South and
Khutsong
Proper
Upgrade
R500 North
Upgrade
R500 South
Upgrade R501
East
Upgrade R 501
West
Regional Outcome 1: Basic Service Delivery Improvement
Regional Output 1.1: Ensure Integrated Transport Planning
Regional Sub Output 1.1.2: Transport Planning
Municipalit
y
Year 1
2016/17
Year 2
2017/18
Year 3
2018/19
Year 4
2019/20
Year 5
2020/
21
WRDM
(on
regional
level)
Mobility
developmen
t plan
(Corridor
identificatio
n/ /routes
prioritisation
/ business
park
developmen
t/ logistics
and
Industrial
hubs.
Business
case to
access
Presidential
Package for
distressed
mining
towns.
MoU:
Busmark as
strategic
partner
Implementation
of mobility plan
(inclusive of
Busmark
initiative)
Review of rail
master plan
Implementati
on of mobility
plan
Implementatio
n of mobility
plan
Review
of
mobility
plan

107
Mogale Service level
agreements
between
organs of
state: Road
upgrades
Implementation of
mobility plan
Implementati
on of mobility
plan
Implementatio
n of mobility
plan
Review
mobility
plan
RWCLM Service level
agreements
between
organs of
state: Road
upgrades
Implementation of
mobility plan
Implementati
on of mobility
plan
Implementatio
n of mobility
plan
Review
mobility
plan
Merafong Service level
agreements
between
organs of
state: Road
upgrades
Implementation of
mobility plan
Implementati
on of mobility
plan
Implementatio
n of mobility
plan
Review
mobility
plan
Regional Outcome 1: Basic Service Delivery Improvement
Regional Output 1.9: Reduce Outsourced Municipal Services
Regional Sub Output 1.9.1: Identification and Implementation of Initiatives to reduce
Outsourcing
Municipality Year 1
2016/17
Year 2
2017/18
Year 3
2018/19
Year 4
2019/20
Year 5
2020/21
Mogale Increase
workforce to
hundred
percent of the
approved
structure
Increase
workforce to
hundred
percent of
the approved
structure
Increase
workforce to
hundred
percent of
the approved
structure
Increase
workforce to
hundred
percent of
the approved
structure
Increase
workforce
to hundred
percent of
the
approved
structure
RWCLM Increase
workforce to
hundred
percent of the
approved
structure
Increase
workforce to
hundred
percent of
the approved
structure
Increase
workforce to
hundred
percent of
the approved
structure
Increase
workforce to
hundred
percent of
the approved
structure
Increase
workforce
to hundred
percent of
the
approved
structure

108
Merafong Increase
workforce to
hundred
percent of the
approved
structure
Increase
workforce to
hundred
percent of
the approved
structure
Increase
workforce to
hundred
percent of
the approved
structure
Increase
workforce to
hundred
percent of
the approved
structure
Increase
workforce
to hundred
percent of
the
approved
structure
Regional Outcome 1: Basic Service Delivery Improvement
Regional Output 1.10: Service Delivery Master Plans
Regional Sub Output 1.10.1: Master Plans Development
Municipalit
y
Year 1
2016/17
Year 2
2017/18
Year 3
2018/19
Year 4
2019/20
Year 5
2020/21
WRDM Completion of
ITP and
prioritising of
nodal
development
points.
OLS and
CPTR
completed
Funding of
network
planning model
Funding of
road
networks in
distressed
mining
towns
Expansion of
BRT to West
Rand
Mogale Implementatio
n of corridor
development
Formalisation
of Taxi
industry
Implementatio
n of network
model
Construction
of roads to
improve
accessibility
Implementatio
n of BRT
Randwest Implementatio
n of corridor
development
Formalisation
of Taxi
industry
Implementatio
n of network
model
Construction
of roads to
improve
accessibility
Implementatio
n of BRT
Merafong Implementatio
n of corridor
development
Formalisation
of Taxi
industry
Implementatio
n of network
model
Construction
of roads to
improve
accessibility
Implementatio
n of BRT

109
1.9.4. Key Risks & Challenges (Roads, Transport and Stormwater)
Regional Outcome 1: Basic Service Delivery Improvement
Regional Output 1.1: Ensure Integrated Transport Planning
Regional Sub Output 1.1.1: Road Maintenance
Municipality Key Risks and Challenges
WRDM
Insufficient Funding: Compromise maintenance, backlogs and
new projects.
Loss of Institutional memory
Lack of integrated GIS system and archive system
Lack of integrated planning between road and rail.
Omission to proclaim road and rail reserves at planning stage
Neglect of public transport facilities and state owned buildings
(station buildings)
Ageing infrastructure
Lack of proper road signage / bill board control
Maintenance of mine roads (ownership)
Geotechnical conditions
Misalignment between master plans of local/ provincial and
national
Procurement: Tedious processes
Technically skilled personnel should be utilized within technical
field of expertise.
Short term budget commitment should be changed to long
term budget commitment
Mogale
RWCLM
Merafong
Regional Outcome 1: Basic Service Delivery Improvement
Regional Output 1.1: Ensure Integrated Transport Planning
Regional Sub Output 1.1.2: Transport Planning
Muni. Year 1 2016/17
Year 2 2017/18
Year 3 2018/19
Year 4 2019/20
Year 5 2020/21
WRDM Preparation of DITP and LITP.
Facilitation of MoU between WRDM and Taxi Fraternity
Signage of MoU (District and Taxi’s) and rollout plan
Preparation and
Review of rail master plan.
Framework policy for intermodal facilities and
Framework plan for extension of
Gautrain to West Rand.
Framework plan –
Implementation of Gautrain Framework Plan.
Implementation of N17

110
Framework plan - Integrated Network planning (Province/ National)
Non-motorised transport strategy revised
Preparation of Bill Board policy for taxi ranks and road reserves
Promulgation of by-laws
Formulation and promulgation of tuc-tuc by-laws
Taxi Rank Audit and rank management plan – policy development
Development of Heavy vehicle mobility strategy (inclusive of regional and mobile weigh bridges)
alignment with BRT (Jhb)
extension of N17 to West Rand developed
Framework Plan
Mogale Plans prepared by WRDM on behalf of locals
Adoption of Integrated Network framework plan
Implementation of non-motorised strategy
Implementation of taxi rank management plans and upgrade of identified taxi ranks
Enforcement of by-laws
Implementation of Freight strategy (phased approach over 5 year period).
Implementation of regional Bill Board Policy
Identification of rail sidings and possible linkages with BRT.
Implementation of Freight strategy (phased approach over 5 year period).
Identification of Park-n-Ride facilities.
Upgrade of collector roads to link to major Arterials(N14
Implementation of Freight strategy (phased approach over 5 year period).
Implementation of Freight strategy (phased approach over 5 year period).
RWCLM Plans prepared by WRDM on behalf of locals
Adoption of Integrated Network framework plan
Implementation of non-motorised strategy
Implementation of taxi rank management plans and upgrade of identified taxi ranks
Enforcement of by-laws
Implementation of Freight strategy
(Phased approach)
Identification of rail sidings and possible linkages with BR
Implementation of Freight strategy (phased approach over period of 5 years )
Identification of Park-n -Ride facilities
Upgrade of collector roads to link to major
Arterials(N14/ R28)
Implementation of Freight strategy (phased approach over period of 5 years )
Implementation of strategy
Implementation of Freight strategy (phase approach over period of 5 years )

111
Implementation of regional Bill Board Policy
Merafong
Plans prepared by WRDM on behalf of locals
Adoption of Integrated Network framework plan
Implementation of non-motorised strategy
Implementation of taxi rank management plans and upgrade of identified taxi ranks
Enforcement of by-laws
Implementation of Freight strategy
Implementation of regional Bill Board Policy
Identification of rail sidings and possible linkages with BRT
Identification of Park-n-Ride facilities
Upgrade of collector roads to link to major Arterials (N12)
Implementation of strategy
Implementation of Freight strategy (phase approach over period of 5 years )
Regional Outcome 1: Basic Service Delivery Improvement
Regional Output 1.1: Ensure Integrated Transport Planning
Regional Sub Output 1.1.2: Transport Planning
Municipality Key Risks and Challenges
WRDM Insufficient funding.
Loss of institutional memory.
Lack of integrated planning between road and rail.
Lack of proper integrated GIS & archive system.
Procurement– tedious process.
Misalignment between aster plans on regional, provincial and
national level.
Neglect of public passenger transport facilities
Limited modal choice (dominance of taxi’s). Under-utilization of
bus and rail.
Mogale
RWCLM
Merafong

112
Regional Outcome 1: Basic Service Delivery Improvement
Regional Output 1.9: Reduce Outsourced Municipal Services
Regional Sub Output 1.9.1: Municipal Infrastructure and Maintenance
Municipality Key Risks and Challenges
WRDM Insufficient funding.
Loss of institutional memory.
Misalignment of resources to service delivery departments.
Required service delivery levels not achieved
Over use of resources, overtime and equipment
External service providers used resulting into inflated unrealistic
cost of service delivery.
Mogale
RWCLM
Merafong
Regional Outcome 1: Basic Service Delivery Improvement
Regional Output 1.10: Service Delivery Master Plans
Regional Sub Output 1.10.1: Master Plans Development
Municipality Key Risks and Challenges
WRDM Funding and non-alignment with provincial and national projects.
WRDM not being prioritised for expansion of BRT routes.
Mogale Lack of Funding and non-alignment with provincial and national
projects.
RWCLM Lack of Funding and non-alignment with provincial and national
projects.
Merafong Lack of Funding and non-alignment with provincial and national
projects.

113
1.9.5. General Comments / Requests (Roads, Transport and Stormwater)
Outcome 1: Basic Service Delivery Improvement
Output 1.1: Ensure Integrated Transport Planning
Sub Output 1.1.1: Road Maintenance
Municipality General Comments/ Requests
WRDM Alternative sources (other than MIG) should be explored for road
maintenance and construction.
Classification of Road ownership is essential (GIS based)
Business case to be developed to access Presidential Package to
address backlogs in distressed mining towns.
Funding for maintenance and capital development (backlogs)
should be ring-fenced within municipal income stream.
Infrastructure network roll-out plan to be funded through multi-
year financial commitment. (5 years plus)
Introduction of fuel levy to subsidize roads should be explored on
National Level.
Mogale
RWCLM
Merafong
Outcome 1: Basic Service Delivery Improvement
Output 1.1: Ensure Integrated Transport Planning
Sub Output 1.1.2: Transport Planning
Municipality General Comments/ Requests
WRDM Formulation of uniform regional bulk contribution and investment
policies
All organs of state to be involved in network planning and funding.
(PRASA/ Transnet/DRT)
Private initiatives to be sourced for transport infrastructure
Five year strategic planning should extend into a 20 year
implementation plan.
Funding for transport infrastructure related projects should be ring-
fenced within municipal income stream.
Mogale
RWCLM
Merafong

114
Outcome 1: Basic Service Delivery Improvement
Output 1.9: Reduce Outsourced Municipal Services
Sub Output 1.9.1: Identification and Implementation of Initiatives to reduce Outsourcing
Municipality General Comments/ Requests
WRDM Vacancies at service delivery departments to be filled
Appropriate training to personnel / organogram to accommodate
design, planning and project engineers.
Accountability defined through standards of operation
Small medium construction work to be done with internal resources
to reduce dependency on external resources.
Plant equipment and resources for the implementation of projects
to be internally resourced (municipal owned).
Mogale
RWCLM
Merafong
Regional Outcome 1: Basic Service Delivery Improvement
Regional Output 1.9: Reduce Outsourced Municipal Services
Regional Sub Output 1.9.1: Identification and Implementation of Initiatives to reduce Outsourcing
Municipality Year 1 2016/17
Year 2 2017/18
Year 3 2018/19
Year 4 2019/20
Year 5 2020/21
WRDM Alignment of discipline with the Shared Services Model
Roll-out of Shared Services Model
Roll-out of Shared Services Model
Roll-out of Shared Services Model
Mogale Increase personnel by
R2m budget to reduce vacancy, and thus reducing external dependency
Increase personnel by
R2m budget to reduce vacancy, and thus reducing external dependency
Increase personnel by
R2m budget to reduce vacancy, and thus reducing external dependency
Increase personnel by
R2m budget to reduce vacancy, and thus reducing external dependency
Increase personnel by
R2m budget to reduce vacancy, reducing external dependency equal to R10m over five years
RWCLM Increase personnel by
R2m budget to reduce vacancy, and thus reducing
Increase personnel by
R2m budget to reduce vacancy, and thus reducing
Increase personnel by
R2m budget to reduce vacancy, and thus reducing
Increase personnel by
R2m budget to reduce vacancy, rand thus reducing
Increase personnel by
R1m budget to reduce vacancy, reducing external

115
external dependency
external dependency
external dependency
external dependency
dependency equal to R9m over five years
Regional Outcome 1: Basic Service Delivery Improvement
Regional Output 1.10: Service Delivery Master Plans
Regional Sub Output 1.10.1: Master Plans Development
Municipality Key Risks and Challenges
WRDM Formulation of uniform regional bulk contribution and investment
policies
All organs of state to be involved in network planning and funding.
(Prasa/ Transnet/DRT)
Private initiatives to be sourced for transport infrastructure
Five year strategic planning should extend into a 20 year
implementation plan.
Funding for transport infrastructure related projects should be ring-
fenced within municipal income stream.
Mogale
RWCLM
Merafong
Plenary Comments / Feedback/ Recommendations
a) SANRAL not included to control movement of trucks damaging our roads. No e-tolls eg, for
N14
b) How to improve access roads to basic services in communities
c) Around inssufficient funding as a risk to enable maintenance and construction of roads,
consider how we improve fuding without squeezing community pockets further since roads
and stormwater is funded through property tax
d) Roads have reached life span – need to probe how to recapitalise even though the roads may
not be gnerating invome.
e) For planning purposes it is key to look at cross cutting function but are we capacitated
adequately
Regional Outcome 1: Basic Service Delivery Improvement
Regional Output 1.10: Service Delivery Master Plans
Regional Sub Output 1.10.1: Master Plans Development
Municipality Year 1 2016/17
Year 2 2017/18
Year 3 2018/19
Year 4 2019/20
Year 5 2020/21
WRDM Finalisation of ITP
Finalisation of OLS and CPTR
Finalisation of network planning model
Prioritisation of road networks in
Review of rail master plan

116
distressed mining towns
Mogale Alignment of transport and roads planning with province and national.
Roll out of ITP Roll out of Network Model
Roll out of projects for distressed mining towns.
Alignment of local rail initiatives with national
Randwest Alignment of transport and roads planning with province and national.
Roll out of ITP Roll out of Network Model
Roll out of projects for distressed mining towns.
Alignment of local rail initiatives with national
Merafong Alignment of transport and roads planning with province and national.
Roll out of ITP Roll out of Network Model
Roll out of projects for distressed mining towns.
Alignment of local rail initiatives with national
1.10. Human Settlement Commission (Development Strategy – Human Settlement)
The Human Settlement Commission focussed on the following Regional Outcomes, Outputs and
Sub Outputs. Below is the inputs as received from the Commission.
Regional Outcome 9: Build Spatially Integrated Communities
o Regional Output 9.1: Regionally Integrated Spatial Planning
Regional Sub Output 9.1.1: Regional Updated Spatial Development Framework
Regional Sub Output 9.1.2: Provision of State Owned Land and Properties for
Development
Regional Sub Output 9.1.3: Law Enforcement: Illegal Land Use
Regional Sub Output 9.1.4: Implementation of SPLUMA Regulatory Framework
Regional Sub Output 9.1.5: Building Controls
Regional Sub Output 9.1.6: Land Use Management
o Regional Output 9.2: Provision of Housing
Regional Sub Output 9.2.1: Coordination of Housing Projects

117
1.10.1 Service Delivery Backlogs (Human Settlements)
10 Regional Outcome 9: Build Spatially Integrated Communities
Regional Output 9.1: Regionally Integrated Spatial Planning
Regional Sub Output 9.1.1: Regional Updated Spatial Development Framework
MUNI. CURRENT
STATUS QUO
CURRENT GAPS ESTIMATED
BUDGET
COMMENTS
Regional SDF
WRDM
Take cognisance of
RWC merger
WRDM to take lead in
process to ensure
compliance to
SPLUMA Guidelines,
to take current
comparatives in
cognisance and new
development
initiatives / directions
Needs to be
updated to
GSDF2030, new
Merger, etc.
In-house Already adhere to
SPLUMA Guidelines
Mogale Process to appoint
consultants – end
March
Incorporation of
different
strategies
R655,000 Currently updating SDF
Merafong 2016-2021 Approved Capital
Expenditure
Framework – incl.
June 2018
In-house Already adhere to
SPLUMA Guidelines
RWCLM Take cognisance of
RWC (Westonaria &
Randfontein) merger
Consolidating of
the 2 previous
Municipalities
R80,000 Already adhere to
SPLUMA Guidelines – to
accommodate Merger
Regional Outcome 9: Build Spatially Integrated Communities
Regional Output 9.1: Regionally Integrated Spatial Planning
Regional Sub Output 9.1.2: Provision of State owned Land and Properties for Development
MUNI. CURRENT
STATUS QUO
CURRENT GAPS ESTIMATED
BUDGET
COMMENTS
Merafong
Public tenders
invited for 173
vacant stands -
39 awarded
Dormant
subserviced
industrial land
. Bulk Services and
reticulation to be
addressed
Alienation of 15
church stands in
process
None N/A Deeds of sales in
process
Mandate obtained
to create 33
Budget
constraints
R180,000 -

118
additional church
stands for
subdivisions
WRDM
District wide Land
Audit
Frequency of
Land Audit –
previously done
in 2014
District to take the
lead
Action Plan 2017 -
2021
Infrastructure
Masterplan
Compile &
Update district
wide
Infrastructure
Masterplan
District to take the
lead
Action Plan 2017/18
Engagement of
Mines to make land
available for Game
Changers
Signed
Agreements
with Mines
Get decision
makers of
Mining
Houses in
discussions
Trade Unions
involvement
in discussions
All land for Game
Changer Projects to
be added to SLPs
Regional Outcome 9: Build Spatially Integrated Communities
Regional Output 9.1: Regionally Integrated Spatial Planning
Regional Sub Output 9.1.3: Law Enforcement: Illegal Land Use
MUNI. CURRENT
STATUS QUO
CURRENT GAPS ESTIMATED
BUDGET
COMMENTS
RWCLM
People refusing to
take occupation of
houses allocated to
them
Lack of capacity
to deal with
illegal land Use
(for all of the
LMs)
Need to look into a
uniform law-
inforcement agencies
across the region to
deal with illegal land
use operations
Adherence to zoning
must be executed
without any
exception
Merafong
Shack farming in
Driefontein (see the
attached copy)
Privately owned
land is
problematic
People not qualify
stay on privately
owned land

119
Surveys conducted
of illegal land uses
• No uniform
Town Planning
Scheme in
terms of
SPLUMA
• Limited
capacity
R2m Application for
funding assistance
submitted to
National Planning
Division for
development of
LUMS
Mogale
Community
Structures have
been established to
deal with by-law
enforcement like
block committees
which are
dysfunctional
Public Safety
patrols are
conducted in public
land
• Area & Block
Committees
are become
law breakers
• Privately
owned land
invasions
Continues training of
Area & Block
Committees
Regional Outcome 9: Build Spatially Integrated Communities
Regional Output 9.1: Regionally Integrated Spatial Planning
Regional Sub Output 9.1.4: Implementation of SPLUMA Regulatory Framework
MUNI. CURRENT
STATUS QUO
CURRENT GAPS ESTIMATED
BUDGET
COMMENTS
WRDM
Establishment of
District/ Joint MPT
process
• Budgetary
constraints
from the
LMs.
All 3 LMs are
currently in a
process to finally
promulgate their
Bylaws. As the
Model Bylaws,
compiled by Messrs
Kenna Consult, is
forming the
backbone of the 3
sets of Bylaws, these
Bylaws will ensure
that a standard of
uniformity within the
region will be
achieved.
RWCLM Promulgation of
SPLUMA By-Laws • MDB
decision ;
• Budgetary
constraints
from the
LMs.
Mogale
Merafong
By-Laws
promulgated
System of
Delegations in
place
Mogale
Establishment of
Municipal Planning
Tribunal is in
process and
advertisement to
call for
Mayoral approval
is being awaited
for the
formulation of
Appeal Authority.
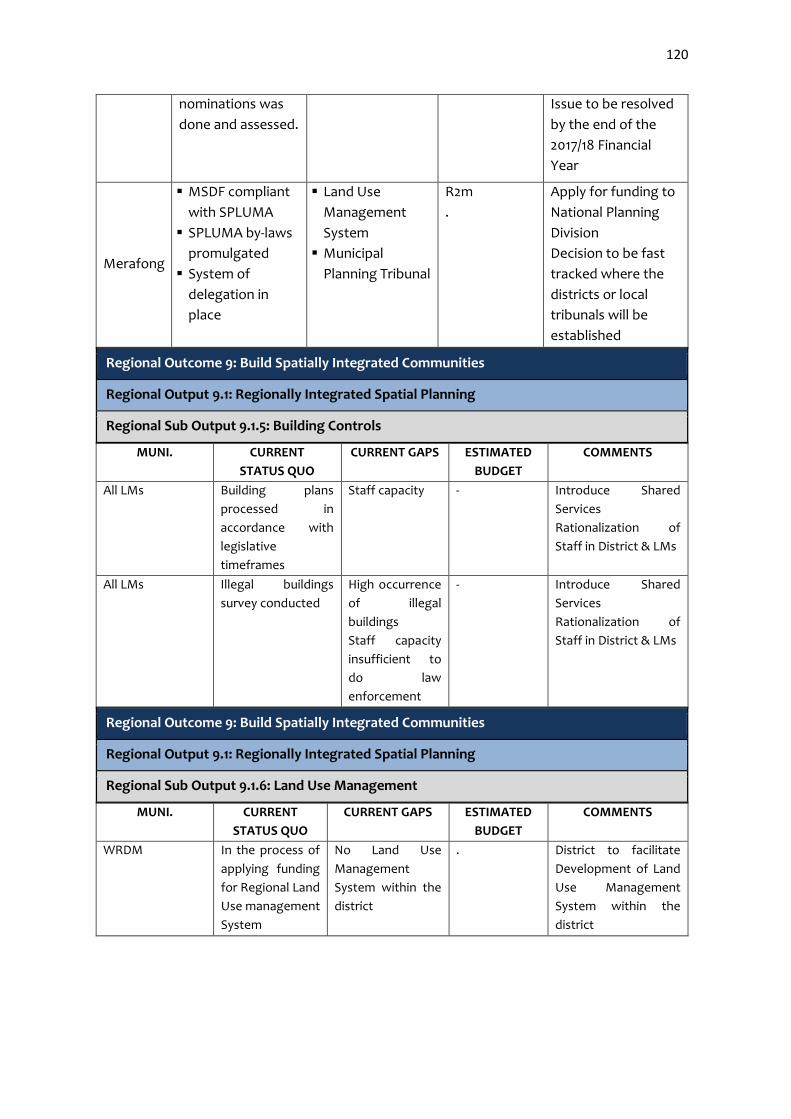
120
nominations was
done and assessed.
Issue to be resolved
by the end of the
2017/18 Financial
Year
Merafong
MSDF compliant
with SPLUMA
SPLUMA by-laws
promulgated
System of
delegation in
place
Land Use
Management
System
Municipal
Planning Tribunal
R2m
.
Apply for funding to
National Planning
Division
Decision to be fast
tracked where the
districts or local
tribunals will be
established
Regional Outcome 9: Build Spatially Integrated Communities
Regional Output 9.1: Regionally Integrated Spatial Planning
Regional Sub Output 9.1.5: Building Controls
MUNI. CURRENT
STATUS QUO
CURRENT GAPS ESTIMATED
BUDGET
COMMENTS
All LMs Building plans
processed in
accordance with
legislative
timeframes
Staff capacity - Introduce Shared
Services
Rationalization of
Staff in District & LMs
All LMs Illegal buildings
survey conducted
High occurrence
of illegal
buildings
Staff capacity
insufficient to
do law
enforcement
- Introduce Shared
Services
Rationalization of
Staff in District & LMs
Regional Outcome 9: Build Spatially Integrated Communities
Regional Output 9.1: Regionally Integrated Spatial Planning
Regional Sub Output 9.1.6: Land Use Management
MUNI. CURRENT
STATUS QUO
CURRENT GAPS ESTIMATED
BUDGET
COMMENTS
WRDM In the process of
applying funding
for Regional Land
Use management
System
No Land Use
Management
System within the
district
. District to facilitate
Development of Land
Use Management
System within the
district

121
Mogale Mogale City
Integrated land
Use
Management
System (New
Town Planning
Scheme)
Digital LIMMS
System still not
implemented
via IT section
Appointment
of Staff
required
No budget
allocated
LIMMS
implementation
is slow across
departments
Currently
severely
understaffed
due to 4
resignations.
Approx. R 1,5m
Salaries
Necessary to ensure
alignment to Spatial
and Land Use
Management Act
2013 (SPLUMA)
The LIMMS system
will ensure tracking
of applications,
digital distribution
and submission as
preferred in terms
of SPLUMA
The section has
been understaffed
for some time and
this has reached a
critical level.
SPLUMA
implementation will
be practically
halted.
Regional Outcome 9: Build Spatially Integrated Communities
Regional Output 9.2: Provision of Housing
Regional Sub Output 9.2.1: Coordination of Housing Projects
MUNI. CURRENT
STATUS QUO
CURRENT GAPS ESTIMATED
BUDGET
COMMENTS
Mohlakeng Ext 11 991 units completed
& allocated
291 units
outstanding
GDHS Awaiting appointment
of Contractor by GDHS
Westonaria Borwa 1583 units
completed &
allocated
500 units under
construction
GDHS Incorporation of
Wagterskop into
Westonaria Borwa by
amendment of
Turnkey Agreement
by GDHS
Simunye infill 1800 units
completed &
allocated
152 units
outstanding
GDHS Awaiting appointment
of Contractor by GDHS
• There is a total of 134 Informal settlements within West Rand Region consisting of:
• 108 from Mogale City
• 17 from Rand West City
• 9 from Merafong City
• There is a total +- 130K households
Montrose Mega
Township
Project approved by
GDHS
Establishment of PSC,
Service Level
Agreement

122
Western Mega
Township
Project approved by
GDHS
Establishment of PSC,
Service Level
Agreement
Syferfontein
Mega Township
Project approved by
GDHS
Outstanding POA
from Johannesburg
Metro, formal hand
over of project to
West Rand region
Portion 83
Middelvlei
Council resolved to
request proposal to
develop the land for
Human Settlements
Proposal
received from
developers,
SCM processes
to unfold
(tender)
Badirile 692 units completed 380 units
outstanding
GDHS Contractor appointed
for installation of
services
Thusanang Need to engage
GDHS to
finalise/resolve
outstanding
Technical issues to
enable Township
Establishment
GDHS Possible
partnership
with the mine.
Mohlakeng Hostel
refurbishment
6 blocks of units
refurbished
Refurbishment/
demolishing of
Madala Hostel
GDHS Awaiting funding from
GDHS
Toekomsrus Ext 4 Township
establishment
underway on
Sibanye Gold Mine
land
Funding for
installation of
services
GDHS Township approved
by Council, EIA
process completed,
awaiting ROD
Merafong Kokosi Ext 6 – 2 138
units
- Provincial Project is
implemented by
GDoHS. Planned
completion date: 30
June 2017
Merafong Khutsong Ext 5 & 6 –
515 services
- R26,282m Funds allocated in
Provincial Adjustment
Budget – December
2016. Funding
agreement
concluded.
Procurement process
in progress.

123
Merafong Khutsong Ext 5 –
500 services
(2017/2018)
- R26m Gazetting of funding
awaited
Merafong Khutsong Ext 5 –
top structures
(2017/2018)
- R55m Gazetting of funding
awaited
Mogale City
1. Kagiso
Extension 13
500 units
completed &
allocated, 223 units
under construction
( 50 units allocated
to the Military
Veterans)
Upgrade the
sewer line to
cater for the
expansion.
R39m Project implemented
through HDA
Mogale City
2. Chief Mogale
725 units completed
in Phase 1, 552 RDP
units and 405
Bonded stock under
construction.
Main
contractors to
address issues
of sub-
contracting
GDHS / ABSA &
MCLM
3 Contractors been
appointed for RDP
structures and ABSA
to finalise
appointment for
Bonded stock.
3. Dr Sefularo
Rural Housing
Installation of
services and
construction of 190
units for Phase 1 is
underway.
Signing of
Funding
Agreement was
delayed due to
the
appointment of
the new MM.
Require funding
to erect and
connection to
sewer plant.
R39m The signing of the
Funding Agreement
had since been
resolved.
Mogale City
4. Dr Motlana
Installation of
services and
construction of 253
units is underway.
Signing of
Funding
Agreement was
delayed due to
the
appointment of
the new MM.
Require funding
to upgrade and
connect to
existing sewer
line
R47m The signing of the
Funding Agreement
had since been
resolved.
The following are Projects under Planning:
Mogale City
1. Dr Sefularo
Phase 2
All planning studies
completed by
MCLM, project
awaiting approved
by GDHS
Require funding
to erect and
connect to
sewer plant.
. It recommended that
phase 2 be approved
to make impact on
Rural Housing.

124
2. Nooitgedacht
(Refentse)
Planning studies still
to be completed by
GDHS.
Main issue here
is the
connection to
bulk which is
under CoJ.
. GDHS to facilitate a
meeting MCLM and
CoJ to unlock the
connection to bulk.
3. Honingklip All planning studies
completed by
MCLM, project
awaiting approved
by GDHS
Require funding
to erect and
connect to
sewer plant.
. The project if
implemented may
bring a huge relief in
terms of security of
tenure within this
area.
Mogale City
4. Ga- Mohale Ext
(Vaalbank 81 & 82)
All planning studies
completed by
MCLM, project
awaiting approved
by GDHS
Acquisition of
the adjacent
portion 56
Vaalbank to
consolidate the
entire area.
. GDHS to finalise the
acquisition of portion
56 Vaalbank.
5. Ethembalethu
phase 2
All planning studies
completed, project
awaiting approved
by GDHS
Consolidation of
the list for the
MHTF.
. N/A
6. Munsieville Ext
9
Had been put on
hold pending
enrolment with
NHBRC.
GDHS to finalise
procurement for
road and storm
water
installation and
the enrolment
with NHBRC.
. Speedy resolution on
the project since it has
been communicated
to the public.
Legacy Projects:
Mogale City
1. Kagiso Ext 12
The appointed
contractor
(incubator) has
taken site and the
project is underway.
Inconsistency
with identified
beneficiaries in
making the
project move
faster.
. Intervention of the
ward councillor to
unlock the challenges
2. Rietvallei phase The project has
stopped due to non-
payments of the
contractor to
complete.
GDHS
commitment to
finalise the
project.
. GDHS must intervene
to assist completion of
the project.
3. Regularisation
of Kagiso Ext 12
People occupying
houses for a long
time and not been
the rightful owners
due to illegal
property exchange.
Not response
from GDHS in
redressing the
matter.
. MCLM had requested
GDHS to intervention
to regularise
ownership of
properties.

125
Future Projects:
Mogale City
1. Brickvalle
(Tarlton)
MCLM had engaged
GDHS to assist with
acquisition of the
land.
Funding for land
and bulk
infrastructure.
. GDHS to finalise the
acquisition of the land.
2. Millsite
Development
MCLM engaged to
with funders to
assist with
acquisition of the
land.
Funding for land
and bulk
infrastructure.
. N/A
Hostel Projects:
Mogale City
Kagiso Hostel
project
Phase 1 to convert
of the hostel into
family units
Phase 1 to
convert of the
hostel into
family units
. GDHS to finalise the
phase1 and give clarity
on phase 2.
MEGA Projects:
Mogale City
1. Leratong Mega
Project
The Developer had
submitted initial
plans for phase for
approval.
Funding bulk
infrastructure
and top
structure.
. The Developer needs
to show commitment
to initiate the project.
NUSP Projects:
Mogale City
1. NUSP
MCLM is currently
working with HDA
on identification of
informal settlement
for intervention.
n/a 4 settlements The project is on track.
Cross cutting measures to unlock funding:
The WRDM endeavours to tap into the following sources of Human Settlement Funding during
2018/19:
• Distressed Mining Towns Fund
• HSDG
• Social Amenities Grant
• Integrated Residential Development Programme
• Institutional Housing Support
• Farm Residence Programme
1.10.2. Target/measures to be achieved over the next 5 years (Human Settlements)
Regional Outcome 9: Build Spatially Integrated Communities
Regional Output 9.1: Regionally Integrated Spatial Planning
Regional Sub Output 9.1.1: Regional Updated Spatial Development Framework

126
Municipality Year 1
2016/17
Year 2
2017/18
Year 3
2018/19
Year 4
2019/20
Year 5
2020/21
WRDM 1 Review of District
SDF
Compliance Compliance Compliance
Mogale 1 Review of Local SDF
Compliance Compliance Compliance
RWCLM 1 Review of Local SDF
Compliance Compliance Compliance
Merafong 1 Review of District
SDF
Compliance Compliance Compliance
Regional Outcome 9: Build Spatially Integrated Communities
Regional Output 9.1: Regionally Integrated Spatial Planning
Regional Sub Output 9.1.2: Provision of State Owned Land and Properties for Development
Municipality Year 1
2016/17
Year 2
2017/18
Year 3
2018/19
Year 4
2019/20
Year 5
2020/21
WRDM
Development and adoption of Regional Investment Policy
Implementation
Implementation
Refinement of Regional Investment Policy
Mogale
RWCLM
Merafong
Regional Outcome 9: Build Spatially Integrated Communities
Regional Output 9.1: Regionally Integrated Spatial Planning
Regional Sub Output 9.1.3: Law Enforcement: Illegal Land Use
Municipality Year 1
2016/17
Year 2
2017/18
Year 3
2018/19
Year 4
2019/20
Year 5
2020/21
WRDM
Development of By-Law on Illegal Occupation of Land
Implementation of By-Law
Implementation of By-Law
Implementation of By-Law
Mogale
RWCLM
Merafong
Regional Outcome 9: Build Spatially Integrated Communities
Regional Output 9.1: Regionally Integrated Spatial Planning

127
Regional Sub Output 9.1.4: Implementation of SPLUMA Regulatory Framework
Municipality Year 1
2016/17
Year 2
2017/18
Year 3
2018/19
Year 4
2019/20
Year 5
2020/21
WRDM Establishment of District Municipal Planning Tribunal
(DMPT) for the region
Operation of DMPT
Operation of DMPT
Operation of DMPT
Mogale
RWCLM
Merafong
Regional Outcome 9: Build Spatially Integrated Communities
Regional Output 9.1: Regionally Integrated Spatial Planning
Regional Sub Output 9.1.5: Building Controls
Municipality Year 1
2016/17
Year 2
2017/18
Year 3
2018/19
Year 4
2019/20
Year 5
2020/21
WRDM Address Capacity through Shared Services: Needs Analysis
Address Capacity through Shared Services
Implementation plan to eradicate illegal buildings
Mogale
RWCLM
Merafong
Regional Outcome 9: Build Spatially Integrated Communities
Regional Output 9.1: Regionally Integrated Spatial Planning
Regional Sub Output 9.1.6: Land Use Management
Municipality Year 1
2016/17
Year 2
2017/18
Year 3
2018/19
Year 4
2019/20
Year 5
2020/21
WRDM Sourcing funding for the development of regional Land Use Management System
Development of regional Land Use Management System
Implementation
Implementation
Implementation
Mogale
RWCLM
Merafong

128
Regional Outcome 9: Build Spatially Integrated Communities
Regional Output 9.2: Provision of Housing
Regional Sub Output 9.2.1: Coordination of Housing Projects
Municipalit
y
Year 1
2016/17
Year 2
2017/18
Year 3
2018/19
Year 4
2019/20
Year 5
2020/21
WRDM Increase incremental housing units by 2000 per annum
Increase incremental housing units by 2000 per annum
Increase incremental housing units by 2000 per annum
Increase incremental housing units by 2000 per annum
Increase incremental housing units by 2000 per annum
Investigation into identified portions of land for human settlements development in close proximity of CBDs:
*See Note hereunder
Investigation into identified portions of land for human settlements development in close proximity of CBDs:
*See Note hereunder
Implement as per recommendations from investigations
Implement as per recommendations from investigations
*Note:
Mogale City – o Certain portions of Portion 7 of the Farm Paardeplaats 177 IQ o Portion 15 of the Farm Paardeplaats 177 IQ
Rand West City – o Portion 47 of the Farm Randfontein 247 IQ o Portion of vacant land next to the Randfontein Municipal building
Merafong City o Carletonville Ext 17 o Erven 19-40 Carletonville Proper o Erf 3960 Fochville
Erven 756-763 Fochville

129
1.10.3. Game Changers / Strategic Projects (Human Settlements)
Regional Outcome 9: Build Spatially Integrated Communities
Regional Output 9.1: Regionally Integrated Spatial Planning
Regional Sub Output 9.1.1: Regional Updated Spatial Development Framework
Municipality Year 1
2016/17
Year 2
2017/18
Year 3
2018/19
Year 4
2019/20
Year 5
2020/21
WRDM Mega projects – to be populated from existing information ( see slide on
Corridor Overview & Mega Project Location)
2 Pilot Human Settlement densification projects per LM in / close to CBD
focussing on affordability (2017/2018)
Tapping into Distress Mining Towns Budget to fund / partially fund Game
Changer Projects
Investor-friendly Infrastructure Master Plan
Tapping into Distress Mining Towns Funding
Above-mentioned depending on land availability
Mogale
RWCLM
Merafong
Regional Outcome 9: Build Spatially Integrated Communities
Regional Output 9.1: Regionally Integrated Spatial Planning
Regional Sub Output 9.1.2: Provision of State Owned Land and Properties for Development
Municipalit
y
Year 1
2016/17
Year 2
2017/18
Year 3
2018/19
Year 4
2019/20
Year 5
2020/21
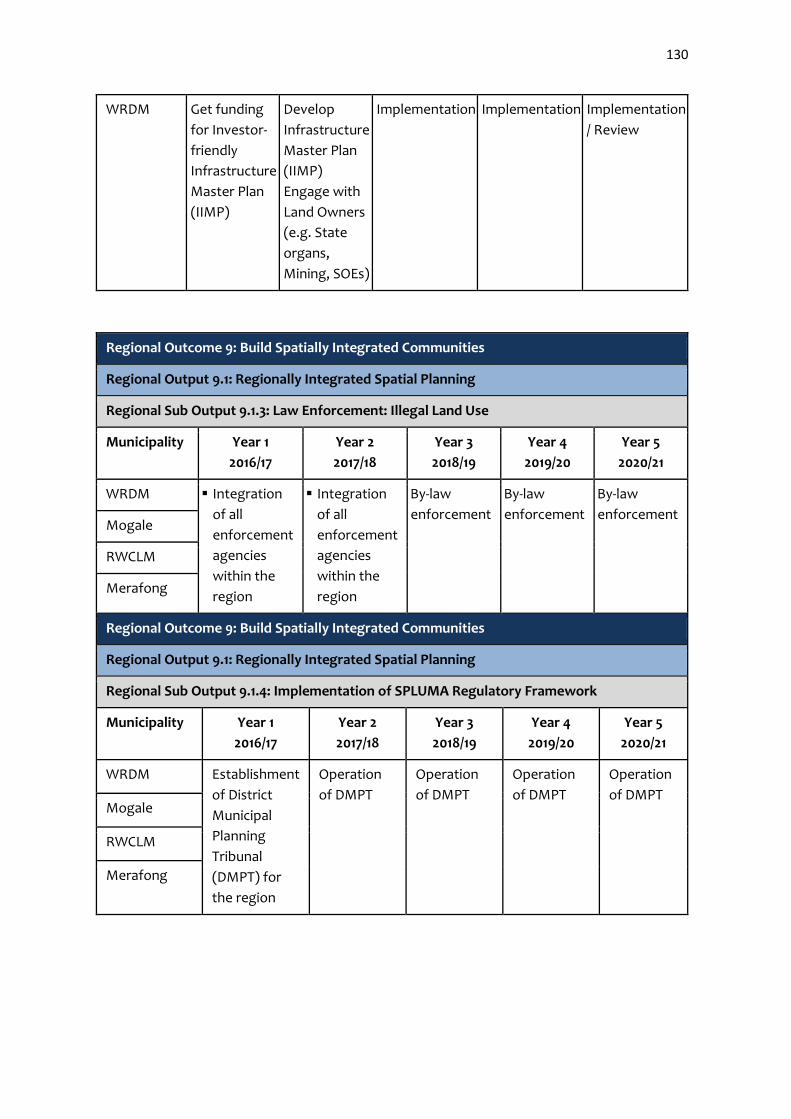
130
WRDM Get funding
for Investor-
friendly
Infrastructure
Master Plan
(IIMP)
Develop
Infrastructure
Master Plan
(IIMP)
Engage with
Land Owners
(e.g. State
organs,
Mining, SOEs)
Implementation Implementation Implementation
/ Review
Regional Outcome 9: Build Spatially Integrated Communities
Regional Output 9.1: Regionally Integrated Spatial Planning
Regional Sub Output 9.1.3: Law Enforcement: Illegal Land Use
Municipality Year 1
2016/17
Year 2
2017/18
Year 3
2018/19
Year 4
2019/20
Year 5
2020/21
WRDM Integration
of all
enforcement
agencies
within the
region
Integration
of all
enforcement
agencies
within the
region
By-law
enforcement
By-law
enforcement
By-law
enforcement Mogale
RWCLM
Merafong
Regional Outcome 9: Build Spatially Integrated Communities
Regional Output 9.1: Regionally Integrated Spatial Planning
Regional Sub Output 9.1.4: Implementation of SPLUMA Regulatory Framework
Municipality Year 1
2016/17
Year 2
2017/18
Year 3
2018/19
Year 4
2019/20
Year 5
2020/21
WRDM Establishment
of District
Municipal
Planning
Tribunal
(DMPT) for
the region
Operation
of DMPT
Operation
of DMPT
Operation
of DMPT
Operation
of DMPT Mogale
RWCLM
Merafong

131
Regional Outcome 9: Build Spatially Integrated Communities
Regional Output 9.1: Regionally Integrated Spatial Planning
Regional Sub Output 9.1.5: Building Controls
Municipality Year 1
2016/17
Year 2
2017/18
Year 3
2018/19
Year 4
2019/20
Year 5
2020/21
WRDM
Implementation of Shared Services Model
Mogale
RWCLM
Merafong
Regional Outcome 9: Build Spatially Integrated Communities
Regional Output 9.1: Regionally Integrated Spatial Planning
Regional Sub Output 9.1.6: Land Use Management
Municipali
ty
Year 1
2016/17
Year 2
2017/18
Year 3
2018/19
Year 4
2019/20
Year 5
2020/21
WRDM Sourcing
funding for
the
developme
nt of
regional
Land Use
Manageme
nt System
Developme
nt of
regional
Land Use
Manageme
nt System
Implementatio
n
Implementatio
n
Implementation
Mogale
RWCLM
Merafong
Regional Outcome 9: Build Spatially Integrated Communities
Regional Output 9.2: Provision of Housing
Regional Sub Output 9.2.1: Coordination of Housing Projects
Municipali
ty
Year 1
2016/17
Year 2
2017/18
Year 3
2018/19
Year 4
2019/20
Year 5
2020/21
WRDM Increase
incremental
housing
units by
2000 per
annum
Increase
incremental
housing units by
2000 per annum
Increase
incremental
housing
units by
2000 per
annum
Increase
increment
al housing
units by
2000 per
annum
Increase
increment
al housing
units by
2000 per
annum
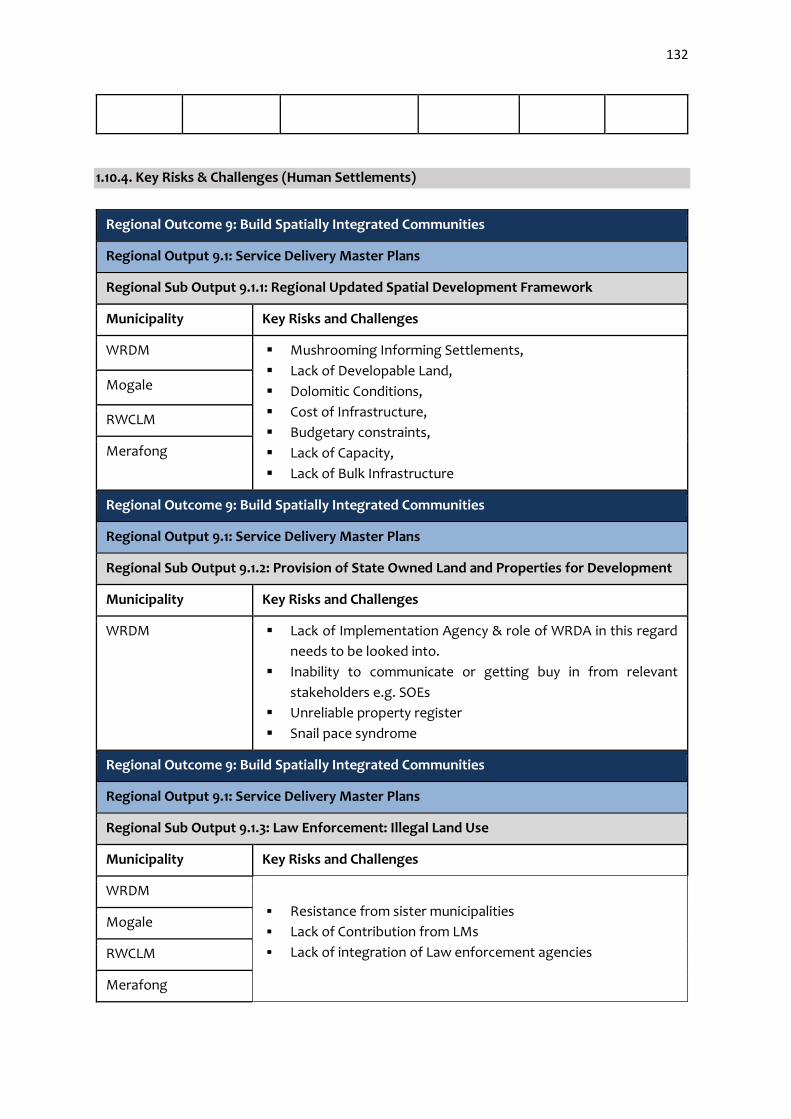
132
1.10.4. Key Risks & Challenges (Human Settlements)
Regional Outcome 9: Build Spatially Integrated Communities
Regional Output 9.1: Service Delivery Master Plans
Regional Sub Output 9.1.1: Regional Updated Spatial Development Framework
Municipality Key Risks and Challenges
WRDM Mushrooming Informing Settlements,
Lack of Developable Land,
Dolomitic Conditions,
Cost of Infrastructure,
Budgetary constraints,
Lack of Capacity,
Lack of Bulk Infrastructure
Mogale
RWCLM
Merafong
Regional Outcome 9: Build Spatially Integrated Communities
Regional Output 9.1: Service Delivery Master Plans
Regional Sub Output 9.1.2: Provision of State Owned Land and Properties for Development
Municipality Key Risks and Challenges
WRDM Lack of Implementation Agency & role of WRDA in this regard
needs to be looked into.
Inability to communicate or getting buy in from relevant
stakeholders e.g. SOEs
Unreliable property register
Snail pace syndrome
Regional Outcome 9: Build Spatially Integrated Communities
Regional Output 9.1: Service Delivery Master Plans
Regional Sub Output 9.1.3: Law Enforcement: Illegal Land Use
Municipality Key Risks and Challenges
WRDM
Resistance from sister municipalities
Lack of Contribution from LMs
Lack of integration of Law enforcement agencies
Mogale
RWCLM
Merafong

133
Regional Outcome 9: Build Spatially Integrated Communities
Regional Output 9.1: Service Delivery Master Plans
Regional Sub Output 9.1.4: Implementation of SPLUMA Regulatory Framework
Municipality Key Risks and Challenges
WRDM
Municipalities opting to do their own MPTs
Lack of integration
Snail pace by the WRDM in establishing the DMPT
Mogale
RWCLM
Merafong
Regional Outcome 9: Build Spatially Integrated Communities
Regional Output 9.1: Service Delivery Master Plans
Regional Sub Output 9.1.5: Building Controls
Municipality Key Risks and Challenges
WRDM
Results from the feasibility study for the Shared Services Model Mogale
RWCLM
Merafong
Regional Outcome 9: Build Spatially Integrated Communities
Regional Output 9.1: Service Delivery Master Plans
Regional Sub Output 9.1.6: Land Use Management
Municipality Key Risks and Challenges
WRDM
Funding Mogale
RWCLM
Merafong

134
Regional Outcome 9: Build Spatially Integrated Communities
Regional Output 9.2: Provision of Housing
Regional Sub Output 9.2.1: Coordination of Housing Projects
Municipality Key Risks and Challenges
WRDM • Mushrooming of Informal Settlements,
• Lack of Developable Land,
• Dolomitic Conditions,
• Cost of Infrastructure,
• Budgetary constraints,
• Lack of Capacity,
• Lack of Bulk Infrastructure
Mogale
RWCLM
Merafong
1.10.5. General Comments / Requests (Human Settlements)
Outcome 9: Build Spatially Integrated Communities
Output 9.1: Regionally Integrated Spatial Planning
Sub Output 9.1.1: Regional Updated Spatial Development Framework
Municipality General Comments/ Requests
WRDM District must lead.
Address the “Planning-in-silo’s” attitude
Districtwide co-operation to be encouraged
Ensure implementation of unpopular decisions
All Mayors must own Outcomes
MMs must own Outputs
Mogale
RWCLM
Merafong
Outcome 9: Build Spatially Integrated Communities
Output 9.1: Regionally Integrated Spatial Planning
Sub Output 9.1.2: Provision of State Owned Land and Properties for Development
Municipality General Comments/ Requests
WRDM Mogale City envisaged new entity on Properties. See how it can
“plugged” into the WRDA. ( District to take the work initiated by
Mogale city forward)
Alignments of property registers with Provincial registers
Mogale
RWCLM
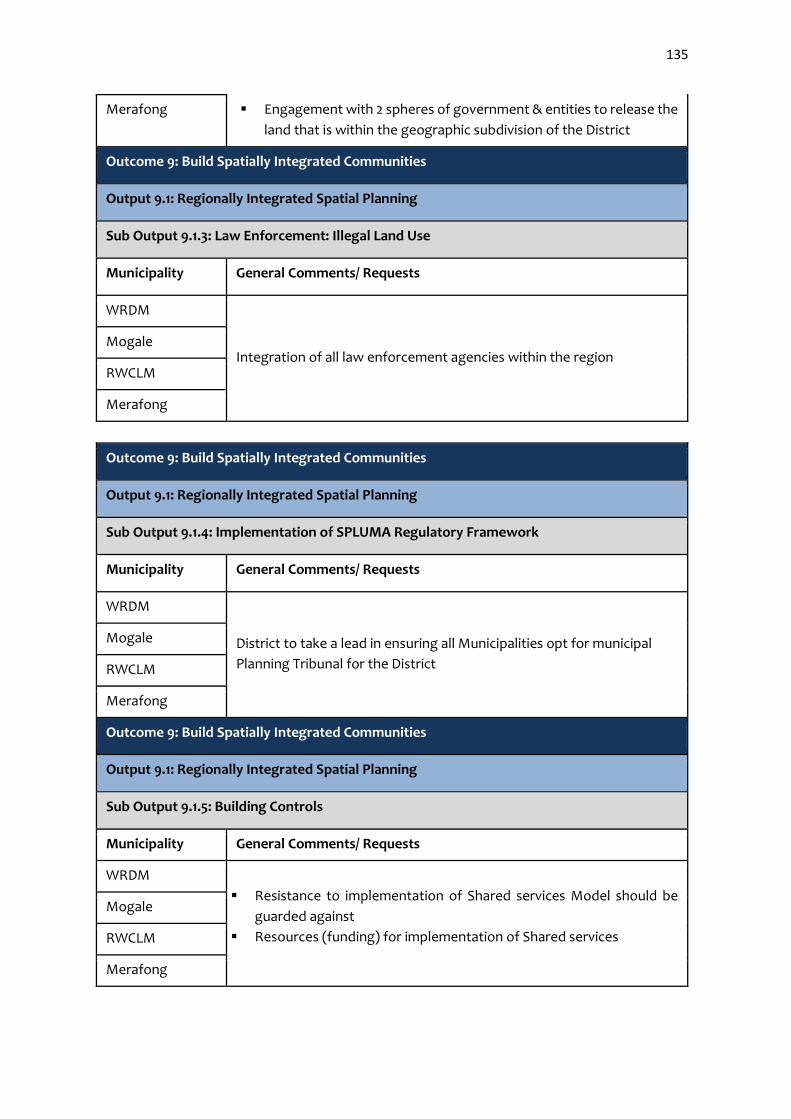
135
Merafong Engagement with 2 spheres of government & entities to release the
land that is within the geographic subdivision of the District
Outcome 9: Build Spatially Integrated Communities
Output 9.1: Regionally Integrated Spatial Planning
Sub Output 9.1.3: Law Enforcement: Illegal Land Use
Municipality General Comments/ Requests
WRDM
Integration of all law enforcement agencies within the region Mogale
RWCLM
Merafong
Outcome 9: Build Spatially Integrated Communities
Output 9.1: Regionally Integrated Spatial Planning
Sub Output 9.1.4: Implementation of SPLUMA Regulatory Framework
Municipality General Comments/ Requests
WRDM
District to take a lead in ensuring all Municipalities opt for municipal
Planning Tribunal for the District
Mogale
RWCLM
Merafong
Outcome 9: Build Spatially Integrated Communities
Output 9.1: Regionally Integrated Spatial Planning
Sub Output 9.1.5: Building Controls
Municipality General Comments/ Requests
WRDM
Resistance to implementation of Shared services Model should be
guarded against
Resources (funding) for implementation of Shared services
Mogale
RWCLM
Merafong

136
Outcome 9: Build Spatially Integrated Communities
Output 9.1: Regionally Integrated Spatial Planning
Sub Output 9.1.6: Land Use Management
Municipality General Comments/ Requests
WRDM
Tap from Grants in line with Powers & Functions Mogale
RWCLM
Merafong
Plenary Comments / Feedback/ Recommendations
a) On non-compliance to Shared services, there is need for a mind shift on how we implement
and should not have issues around Powers and Functions
b) Property management was not through agencies but region-wide and centralised at district
and should remain as such
c) Update actual progress on housing projects
d) Has housing accreditation taken a back seat?
e) Property development needs to run on its own
f) We need to take advantage of the HDA grants
g) Around the Planning Tribunal – understnading was that powers and functions are not a
subject for discussion but already in effect as set own. Seemingly we have not yet come to
terms with the fact that working towards as a Region. There is still localised vs. regional
planning.
h) Everything we plan should be founded on the land. Land issue is deemed as a risk but
notmitigation plans are presented. Human settlement is now set down as a regional approach
not localised.
1.11. Regional Re-industrialisation Commission (Development Strategy - Regional Re-
industrialisation)
The Regional Re-industrialistion Commission focussed on the Following Regional Outcomes,
Outputs and Sub Outputs. Below is the inputs as received from the Commission.
Regional Outcome 11: Reduced Unemployment
o Regional Output 11.1: Promote Job Creation Initiatives
Regional Sub Output 11.1.1: Local Youth Employment Initiatives by Local
Business
Regional Sub Output 11.1.2: Expand Community Works Programme
Regional Sub Output 11.1.3: NDP Programme
Regional Sub Output 11.1.4: Job Creation through LED Initiatives

137
Regional Outcome 12: Economic Development
o Regional Output 12.1: Promote Regional Economic Development and Growth
Regional Sub Output 12.1.1: Diversification of Economic Base
Regional Sub Output 12.1.2: Expand Broad Band Access
Regional Sub Output 12.1.3: Farmer Support Initiatives
Regional Sub Output 12.1.4: Provision of Land to enable Economic Growth,
Settlement of Communities and Urbanisation
Regional Sub Output 12.1.5: SMME Support Programmes
o Regional Output 12.2: Stimulate Tourism, Township and Local Economy
Regional Sub Output 12.2.1: Local Procurement of Goods and Services
Regional Sub Output 12.2.2: LED Programmes
Regional Sub Output 12.2.3: Sustainable Tourism Economy
Regional Sub Output 12.2.4: Agriparks Programme
Service Delivery Backlogs (Regional Re-industrialisation)
MUNI. CURRENT
STATUS QUO
CURRENT GAPS ESTIMATED
BUDGET
COMMENTS
Mogale GP Youth
Hospitality
Programme
27 intake of youth
Narysec
Phase II
recruitment has
began
20 intake of youth
Target/measureed
for 2016/17
Construction
Incubation
Programme
50 SMME’s
(3 year)
Numbers have
decline from 50
intake in 2015/16
to 16 intake in
2016/17
Lack of exit
strategy
High demand
for continuation
of the
programme
Set aside
opportunities
specific for
beneficiaries
High demand
for continuation
of the
programme
National
Department
of Tourism
(DoT)
National
(DRDLR)
R3,8m pa
(Co-funding
between
MCLM and
SEDA)
R3,6m pa
(Co-funding
between
MCLM and
SEDA)
Regional Outcome 11: Reduced Unemployment
Regional Output 11.1: Promote Job Creation Initiatives
Regional Sub Output 11.1.1: Local Youth Employment Initiatives by Local Business

138
Chemical
Incubation
Programme
SMME’s
(3 year)
Tourism/Enterprise
Support
Programme
30 SMMEs (12
Months)
Set aside
opportunities
specific for
beneficiaries
Proposal to be
submitted for
the programme
to be funded
over long-term
period for
support
SMMEs
R520,000
(MCLM Own
funding)
Merafong New Enterprise
Development
Programme
Target/measureed
to the broader
SMMEs
(3 year)
Merafong NYS
Internship Youth
Programme
550 intake of
youth
(12 Months)
Construction
Incubator
Programme
(Sibanye Gold)
50 SMMEs
GP Youth
Hospitality
Programme
16 intake of youth
(12 Months)
Narysec
120 intake of youth
Waste
Management
Programme (SEA)
65
N/A
Slow uptake of
youth into the
programme
Only 5 SMMEs
has registered,
therefore the
uptake is
extremely slow.
R15m
(Anglo Gold
Ashanti SLP)
National
Social Labour
Plan (SLP)
Sibanye Gold
National
Merafong must
engage youth
structures
regarding the
programme
Merafong must
engage SMMEs in
construction
structures
regarding the
programme
RWCLM Narysec 20 undergoing
training
Ongoing
National
Placement
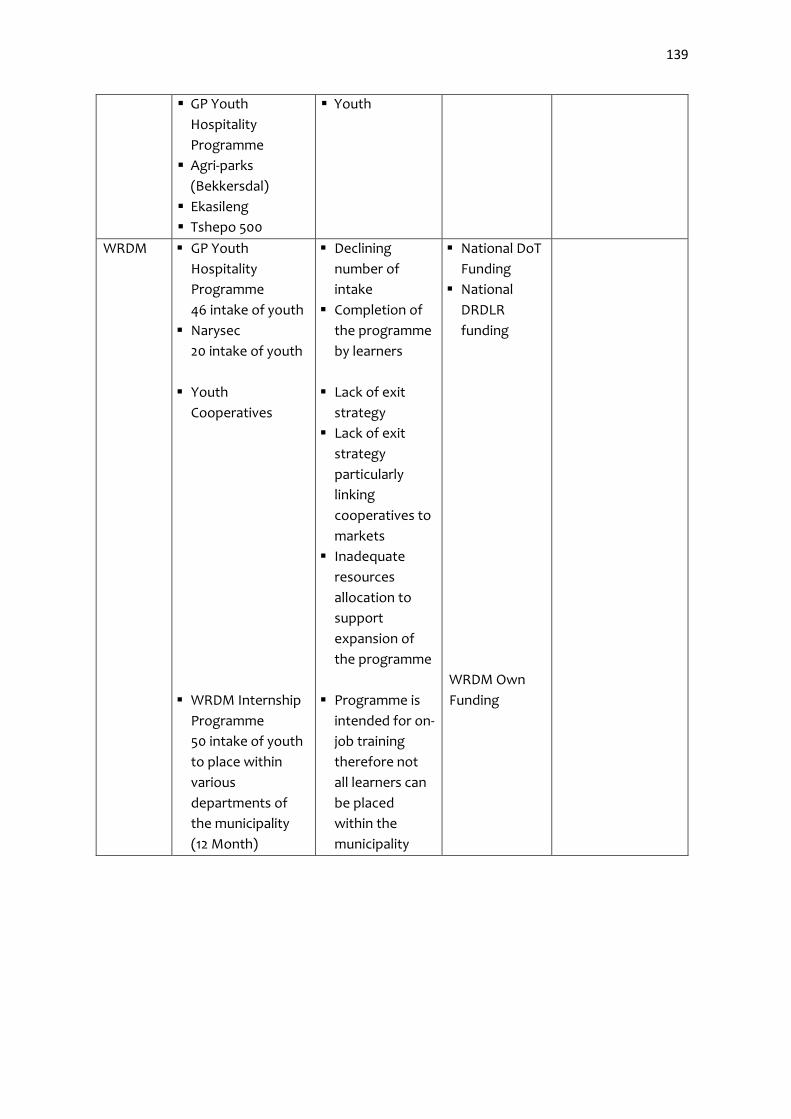
139
GP Youth
Hospitality
Programme
Agri-parks
(Bekkersdal)
Ekasileng
Tshepo 500
Youth
WRDM GP Youth
Hospitality
Programme
46 intake of youth
Narysec
20 intake of youth
Youth
Cooperatives
WRDM Internship
Programme
50 intake of youth
to place within
various
departments of
the municipality
(12 Month)
Declining
number of
intake
Completion of
the programme
by learners
Lack of exit
strategy
Lack of exit
strategy
particularly
linking
cooperatives to
markets
Inadequate
resources
allocation to
support
expansion of
the programme
Programme is
intended for on-
job training
therefore not
all learners can
be placed
within the
municipality
National DoT
Funding
National
DRDLR
funding
WRDM Own
Funding

140
Regional Outcome 11: Reduced Unemployment
Regional Output 11.1: Promote Job Creation Initiatives
Regional Sub Output 11.1.2: Expand Community Works Programme
MUNI. CURRENT
STATUS QUO
CURRENT
GAPS
ESTIMATED
BUDGET
COMMENTS
WRDM EPWP =25 R1m
Mogale CWP has
generated 2784
EPWP has
generated 708
Clarity of roles
and
responsibility
for the
management
of the CWP
and EPWP
Allocation
cannot be
confirmed
R1m
CWP need to be
located within
Economic
Services
Mainstreaming of
EPWP in all
municipal projects
to ensure that the
municipal expand
and grow the
project, therefore
the allocation
from National
Department of
Public Works
(DPW)
Merafong EPWP
Programme
750 intake of
Women, Youth,
PWD
Community
Works
Programme
(CWP)
2000 intake
Women, Youth,
PWD
N/A R1,9m The programme is
successful and the
Target/measure to
be revised to
accommodate more
young people
RWCLM Programme
EPWP=610
beneficiaries
CW=2000
beneficiaries
Limited
Budget in
terms of the
Grants
R3,925m
R7,850m
Grants from DPW,
Provincial CoGTA
and Municipal
Opex
Dladla foundation
– implementation
agent

141
Regional Outcome 11: Reduced Unemployment
Regional Output 11.1: Promote Job Creation Initiatives
Regional Sub Output 11.1.3: NDP Programme
MUNI. CURRENT
STATUS QUO
CURRENT GAPS ESTIMATED
BUDGET
COMMENTS
Mogale Programme:
Walkways Kagiso
& Munsieville for
2015/16
Delays in
implementation
timeframes due
oversight in
SCM process
R73m Review policies
relating to
incorporating local
labour and local
business in catalytic
projects within
MCLM
Merafong Business plans
were submitted
to National
Treasury and
redirected to the
National
Department of
Rural
Development
N/A R365m Elevate this
challenge at
political IGR forum
RWCLM Programme:
Walkways
Mohlakeng &
Toekomsrus for
2016/17
Statistics: +/=660
Jobs
Delays in
implementation
timeframes
+/=R55m Review policies
relating to
incorporating local
labour and local
business in catalytic
projects within
RWCLM
WRDM Walkaways
Implementation
of the project in
Toekomsrus and
Mohlakeng
30 jobs created
thus far
R21,5m
(funding to
be managed
by WRDM)
R10m was received
from treasury in the
last financial year.

142
Additional Comments from Commission:
Assumption: NDP is Neighbourhood Development Programme
Regional Outcome 11: Reduced Unemployment
Regional Output 11.1: Promote Job Creation Initiatives
Regional Sub Output 11.1.4: Job Creation through LED Initiatives
MUNI. CURRENT
STATUS QUO
CURRENT GAPS ESTIMATED
BUDGET
COMMENTS
Mogale Construction
incubator
420 jobs
created
Chemical
incubator
117 jobs created
NDPG funded
projected
116 job created
Lack of exit
strategy
particularly
linking
incubates to
markets
Lack of long-
term
planning for
economic
catalytic
projects and
their impact
on local
economic
development.
Lack of
planning
results in
withdrawal of
grant
allocation
(R47m in
2016/17)
R3,8m pa
(Co-
funding
between
MCLM and
SEDA)
R3,6m pa
(Co-
funding
between
MCLM and
SEDA)
R73m for
2013/14
MTREF
MCLM should
consider
increasing
allocation for
both financial and
human resources
for all incubation
programmes and
after-care support
MCLM should
consider
increasing both
financial and
human resources
for development
of plans for
application of
grant funding
from NT and
other relevant
funding agencies.
Merafong Business &
Industrial Hives
6000 jobs created
The optimally
utilisation units
by tenants.
Budget to be
confirmed
N/A
Rand West • Number
(1000) of jobs
created
through
EPWP & LED
Programmes
Lack of
Capacity
R8,5m Lack of budget -
Opex
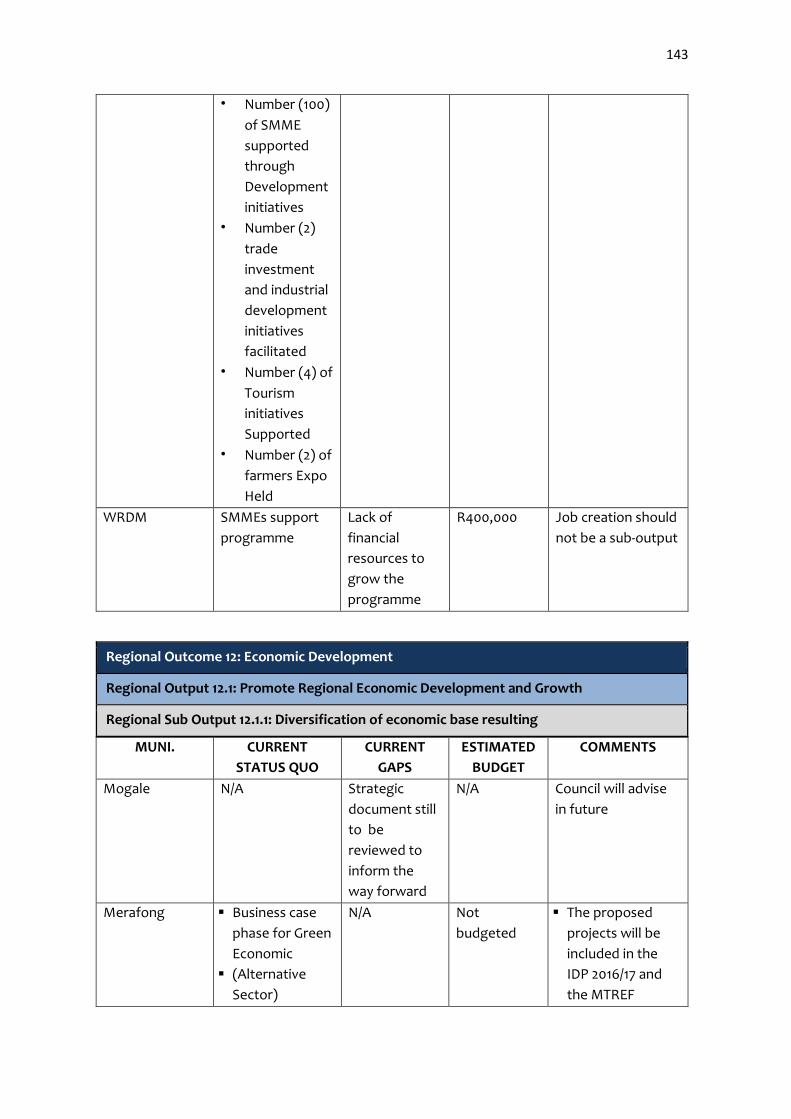
143
• Number (100)
of SMME
supported
through
Development
initiatives
• Number (2)
trade
investment
and industrial
development
initiatives
facilitated
• Number (4) of
Tourism
initiatives
Supported
• Number (2) of
farmers Expo
Held
WRDM SMMEs support
programme
Lack of
financial
resources to
grow the
programme
R400,000 Job creation should
not be a sub-output
Regional Outcome 12: Economic Development
Regional Output 12.1: Promote Regional Economic Development and Growth
Regional Sub Output 12.1.1: Diversification of economic base resulting
MUNI. CURRENT
STATUS QUO
CURRENT
GAPS
ESTIMATED
BUDGET
COMMENTS
Mogale N/A Strategic
document still
to be
reviewed to
inform the
way forward
N/A Council will advise
in future
Merafong Business case
phase for Green
Economic
(Alternative
Sector)
N/A
Not
budgeted
The proposed
projects will be
included in the
IDP 2016/17 and
the MTREF

144
Merafong GDS
identified
diversification
projects.
Feasibility study
solar park and
bio-energy park
in progress
(GIFA)
Attraction of
investment
R6,5m
2017/18 (Feasibility
Studies)
Appointment of
transaction
advisor to
conduct feasibility
study for
alternative energy
projects at
advanced stage.
Bid adjudication
finalised (GIFA
RWCLM Conceptualisation
phase for
Logistics hub (
Airport),
Manufacturing
and Beneficiation
Advanced phase
for the Milling
Plant (Agro-
processing)
Revising the
feasibility
study of the
Logistics Hub –
Regional
Airport
Not
budgeted
The projects are
included in the
2016/17 IDP
WRDM Feasibility
conducted on
Fresh produce
market
Site
identification
GDARD to
provide
funding
Province to gazette
funding allocation
for implementation.
Regional Outcome 12: Economic Development
Regional Output 12.1: Promote Regional Economic Development and Growth
Regional Sub Output 12.1.2: Expand Broad Band Access
MUNI. CURRENT
STATUS QUO
CURRENT
GAPS
ESTIMATED
BUDGET
COMMENTS
Mogale There is strong
broad band
access
Signal is not
strong
Merafong Gauteng
Broadband
Network is being
rolled out in all
public buildings in
Merafong e.g.
libraries,
Limited Access .

145
Khutsong and
business centre
Additional Comments from Commission:
No broad band in the entire region Rand West progress not started, installation only
start year 3 and beyond
Engagement with provincial government is underway to provide funding
Regional Outcome 12: Economic Development
Regional Output 12.1: Promote Regional Economic Development and Growth
Regional Sub Output 12.1.3: Farmer Support Initiatives
MUNI. CURRENT
STATUS QUO
CURRENT
GAPS
ESTIMATED
BUDGET
COMMENTS
Mogale Mechanisation
Programme
+500ha of land
cultivated
2 tractors allocated
Resource
constraints
R300,000 Review and
improve the
programme
including resource
allocation from
2017/18 going
forward
Merafong Four initiatives
currently
implemented,
namely:
Wedela Agricultural
project
Nooitgedacht
Commonage Farm
Tractor
mechanization
programme – 2
tractors and
implements are being
made available to
farmers
Food security
programme
None
Infrastructure
requirements
Budget
constraints for
maintenance
and staff
Limited
budget
R8m
R5m
.
R30,000 p.a.
Project
implemented in
collaboration with
AngloGold Ashanti –
SLP project
22 cattle farmers
are utilising the
farm for grazing.
The farm is over
grazed and has
limited
infrastructure to
manage rotational
grazing

146
Seeds/starter packs
issued to:
14 School Gardens
3 Clinics
11 Home Based Cares /
Community Based
organisations
Operational grant
to implement the
programme was
terminated by
GDARD
RWCLM Farmers Support
Market: conducting
flea market for
farmers exposure
Not enough
products
none Majority of this
farmers they don’t
have transport
WRDM Mechanisation
Provision of
production inputs
Misuse of
tractors
Insufficient
tractors
equipment
Lack of
funding
R100,000 Tractors not for the
purpose intended
for
More equipment
should be provided
Low food security
Regional Outcome 12: Economic Development
Regional Output 12.1: Promote Regional Economic Development and Growth
Regional Sub Output 12.1.4: Provision of Land to enable Economic Growth, Settlements of
Communities and Urbanisation
MUNI. CURRENT
STATUS QUO
CURRENT GAPS ESTIMATED
BUDGET
COMMENTS
Mogale City Land Resource
Mobilization and
Partnership unit has
been newly
establish to manage
the Land on behalf
MCLM
Financial
constraints for
Land Acquisition
for Economic
Development
and Investment
R19m in
2016/17
(which was
adjusted
downwards to
R0)
MCLM must consider
increasing the
financial allocation for
land acquisition based
on the Valuation Roll
of MCLM and the
Market value.
Merafong City 457 ha available for
industrial
development
1 599 ha availed for
residential
development
468 ha available for
agricultural
development
Bulk services
availability
Bulk services
availability and
human
settlement
funding
Infrastructure
and funding for
development
.
.
.
Tenders invited –
process concluded 15
bids awarded
Shortfall of land for
14 719 stands to
address housing
backlog

147
RWCLM Westonaria-ERFs
earmarked for
mixed development
– retail, industrial
and housing
Randfontein-ERFs
earmarked for
mixed development
– retail, industrial
and housing
No services and
budget for the
development of
those sites
No services and
budget for the
development of
those sites
Zoning
Zoning
WRDM Engagement with
mines to release
land for
development is
underway
Dolomitic land
Private land
ownership
Mining houses
prepared to release
land subject to
submission of plans
for development
Regional Outcome 12: Economic Development
Regional Output 12.1: Promote Regional Economic Development and Growth
Regional Sub Output 12.1.5: SMME Support Programmes
MUNI. CURRENT
STATUS QUO
CURRENT GAPS ESTIMATED
BUDGET
COMMENTS
Mogale City Contractors
Incubation
programme
Drop outs from
the programme
Merafong The municipality
currently has 6 hives
consisting of 141
units in the
following areas:
Kokosi Bee-Hive
(22 units)
Greenspark
Business Hive (6
units)
Khutsong Business
Centre (24 units)
Khutsong South
Industrial Hive
(22 units)
Concor Hostel
(12 units)
Carletonville
Informal Trading
Area (55 units)
Limited growth
of SMMEs
R4,2m
R15m
Carletonville Informal
Trading Area Phase 2
(Oberholzer) -
Construction phase –
contractor terminated
due to non-
performance
November 2016 – legal
process unfolding
Establishment of
Enterprise

148
Enterprise
Development
Centre
Development Centre
(One-stop shop) in
collaboration with
AngloGold Ashanti –
SLP project
RWCLM Bekkersdal-
Construction of new
business hive
Toekomsrus-
Refurbishment of
enterprise hive 1. for
retail purposes
Refurbishment of
enterprise hives 2.
for skills
development
Westonaria-
Construction of new
business hive
Delays in
completion of
the project
Limited number
of beneficiaries
to benefit
Delay –
consultation
process
Delays in project
implementation
R8,9m
R2m
R2m
R8,9m
Limited number of
hives / units
Only 8 units
Busy finalizing the
designs
Part of Sibanye Gold
Mine CIS
Regional Outcome 12: Economic Development
Regional Output 12.2: Stimulate Tourism, Township and Local Economy
Regional Sub Output 12.2.1: Local Procurement of Goods and Services
MUNI. CURRENT
STATUS QUO
CURRENT GAPS ESTIMATED
BUDGET
COMMENTS
Merafong Procurement policy
provides for 30%
subcontracting to
local SMMEs
Limited projects
due to limited
budget
RWCLM 30% of all
infrastructure
project should be
locally
subcontracted – to
be equate in
monetary value
Non-compliance
in terms of the
policy – SCM
policy
none All goods and services
procurement locally
WRDM % contract awarded
to SMMEs
Very few SMMEs
have benefited
from
procurement
Regional Outcome 12: Economic Development

149
Regional Output 12.2: Stimulate Tourism, Township and Local Economy
Regional Sub Output 12.2.2: LED Programmes
MUNI. CURRENT
STATUS QUO
CURRENT GAPS ESTIMATED
BUDGET
COMMENTS
Mogale Agri parks programme
Gauteng youth hospitality learnerships
EPWP
SMME support
Merafong
RWCLM
WRDM
Regional Outcome 12: Economic Development
Regional Output 12.2: Stimulate Tourism, Township and Local Economy
Regional Sub Output 12.2.3: Sustainable Tourism Economy
MUNI. CURRENT
STATUS QUO
CURRENT GAPS ESTIMATED
BUDGET
COMMENTS
WRDM There are very few
funded tourism
programmes
Lack of tourism
marketing
R300,000
Merafong Merafong Tourism
Strategy in place
No internal
Capacity to deal
with tourism
R0
RWCLM Revival of the local
tourism association
Current there is
two associations
– Westonaria
and Randfontein
R250,000 Ongoing process -
consultation
Regional Outcome 12: Economic Development
Regional Output 12.2: Stimulate Tourism, Township and Local Economy
Regional Sub Output 12.2.4: Agri-parks Programme
MUNI. CURRENT
STATUS QUO
CURRENT GAPS ESTIMATED
BUDGET
COMMENTS
Mogale Farmer production
Support unit-is
under development
Lack of water GDARD
funding (R4m)
WRDM Farmer Production
Support
Unit is completed
and launched
Agri-hub is currently
being under
development
Appointment of
entrepreneurs
GDARD (R4m)
DRDLR
funding
(R45m)
Funding should be
transferred to the
WRDM to expedite
project
implementation

150
Merafong Farmer Production
Support Unit is
completed
The Merafong Flora
Agri-Park
established (WRDM
Offtake
agreements
Local farmer
production units
to be integrated
with Agri-Park
GDARD
funding (R4m)
RWCLM Westonaria- Mini
Agri-Park
Braavlei- Mega
Agri-Park
Project is
completed.
Beneficiaries
identified
Fencing
completed
Drilling of bore
hole
R21m
R40m
Harvested first
production input
Delays in completion
of studies
1.11.2 Target/measures to be achieved over the next 5 years (Regional Re-industrialisation)
Regional Outcome 11: Reduced Unemployment
Regional Output 11.1: Promote Job Creation Initiatives
Regional Sub Output 11.1.2: Expand Community Works Programme
Municipality Year 1 2016/17
Year 2 2017/18
Year 3 2018/19
Year 4 2019/20
Year 5 2020/21
Regional Outcome 11: Reduced Unemployment
Regional Output 11.1: Promote Job Creation Initiatives
Regional Sub Output 11.1.1: Local Youth Employment Initiatives by Local Business
Municipality Year 1 2016/17
Year 2 2017/18
Year 3 2018/19
Year 4 2019/20
Year 5 2020/21
WRDM % preparation and
implementation of regional re-
industrialisation strategy
Implementation of regional strategy on Local Youth Employment Initiatives by
Local Business
Implementation of regional strategy on Local Youth Employment Initiatives by
Local Business
Implementation of regional strategy on Local Youth Employment Initiatives by
Local Business

151
WRDM & all LMs
Review of Community
Works Policies and Agreements and roll-out
of Programmes
Review of
Community
Works
Policies and
Agreements
and roll-out
of
Programmes
Review of
Community
Works
Policies and
Agreements
and roll-out
of
Programmes
Review of
Community
Works
Policies and
Agreements
and roll-out
of
Programmes
Regional Outcome 11: Reduced Unemployment
Regional Output 11.1: Promote Job Creation Initiatives
Regional Sub Output 11.1.3: NDP Programme
Municipality Year 1 2016/17
Year 2 2017/18
Year 3 2018/19
Year 4 2019/20
Year 5 2020/21
WRDM (in collaboration with RWCLM)
Construction of Side Walks –
Mohlakeng and Toekomsrus
Review of NDPG Business
Plan
Regional Outcome 11: Reduced Unemployment
Regional Output 11.1: Promote Job Creation Initiatives
Regional Sub Output 11.1.4: Job creation through LED initiatives
Municipality Year 1 2016/17
Year 2 2017/18
Year 3 2018/19
Year 4 2019/20
Year 5 2020/21
WRDM Preparation of Regional Re-
Industrialization Strategy
Roll-out of Regional Re-
Industrialization Strategy
Roll-out of Regional Re-
Industrialization Strategy
Roll-out of Regional Re-
Industrialization Strategy

152
Regional Outcome 12: Economic Development
Regional Output 12.1: Promote Regional Economic Development and Growth
Regional Sub Output 12.1.1: Diversification of Economic Base
Municipality Year 1 2016/17
Year 2 2017/18
Year 3 2018/19
Year 4 2019/20
Year 5 2020/21
WRDM Identification of economic
sectors to diversify the
economy
Framework
Roll-out of Diversification of Economic
Base Framework
Roll-out of Diversification of Economic
Base Framework
Roll-out of Diversifica
tion of Economic
Base Framewor
k
RWCLM Mini Park Project
Milling Plant Project
Mega Agri-Park Project
Plastic and Tyre Recycling Plant
Construction of Storage Facilities
Construction of light manufacturing industrial park
Regional Outcome 12: Economic Development
Regional Output 12.1: Promote Regional Economic Development and Growth
Regional Sub Output 12.1.2: Expand Broadband Access
Municipality
Year 1 2016/17
Year 2 2017/18
Year 3 2018/19
Year 4 2019/20
Year 5 2020/21
WRDM Develop a Regional
Broadband Access
Policy
Implementation of a Regional
Broadband Access Policy
Implementation of a Regional
Broadband Access Policy
Implementation of a Regional
Broadband Access Policy
Regional Outcome 12: Economic Development
Regional Output 12.1: Promote Regional Economic Development and Growth
Regional Sub Output 12.1.3: Farmer Support Initiatives
Municipality Year 1 2016/17
Year 2 2017/18
Year 3 2018/19
Year 4 2019/20
Year 5 2020/21

153
WRDM Framework Plan and Monitoring Tool developed for oversight on farmer initiatives
Roll-out of Framework Plan and Monitoring Tool developed for oversight on farmer initiatives
Roll-out of Framework Plan and Monitoring Tool developed for oversight on farmer initiatives
Roll-out of Framework Plan and Monitoring Tool developed for oversight on farmer initiatives
RWCLM Randwest Completion of Isigayo Milling Plant Project
Construction of Mega Agri Park
Finalization of the PPP for Elandsfontein Project
Commercialization of agricultural land in Westonaria
Merafong Establishment of the Prototype at Merafong Flora
Regional Outcome 12: Economic Development
Regional Output 12.1: Promote Regional Economic Development and Growth
Regional Sub Output 12.1.4: Provision of Land to enable Economic Growth, Settlements of Communities and Urbanisation
Municipality Year 1 2016/17
Year 2 2017/18
Year 3 2018/19
Year 4 2019/20
Year 5 2020/21
WRDM Entering into of land lease agreements with mining
houses
Terms & conditions
of land lease
agreements implemente
d
Terms & conditions
of land lease agreements implemente
d
Terms & conditions of
land lease agreements
implemented
Regional Outcome 12: Economic Development
Regional Output 12.1: Promote Regional Economic Development and Growth
Regional Sub Output 12.1.5: SMME Support Programmes
Municipality Year 1 2016/17
Year 2 2017/18
Year 3 2018/19
Year 4 2019/20
Year 5 2020/21

154
WRDM Regional SMME
Support Programme developed
Regional SMME
Support Programme
implemented
Regional SMME
Support Programme
implemented
Regional SMME
Support Programme
implemented
Regional Outcome 12: Economic Development
Regional Output 12.2: Stimulate Tourism, Township and Local Economy
Regional Sub Output 12.2.1: Local Procurement of Goods and Services
Municipality Year 1 2016/17
Year 2 2017/18
Year 3 2018/19
Year 4 2019/20
Year 5 2020/21
WRDM 1. Incubator programs to be linked to job opportunities
2. Recruitment and selection policy to be reviewed to ensure the programs attract the correct candidates
3. Optimal utilisation of business and industrial hives
4. Sub-letting to foreign national
MOGALE
RWCLM
MERAFONG
Regional Outcome 12: Economic Development
Regional Output 12.2: Stimulate Tourism, Township and Local Economy
Regional Sub Output 12.2.2: LED Programmes
Municipality Year 1 2016/17
Year 2 2017/18
Year 3 2018/19
Year 4 2019/20
Year 5 2020/21
WRDM Preparation of a Regional
Township Revitalization
Policy
MOGALE Preparation of a Local Township
Revitalization Policy
RWCLM Preparation of a Local Township
Revitalization Policy
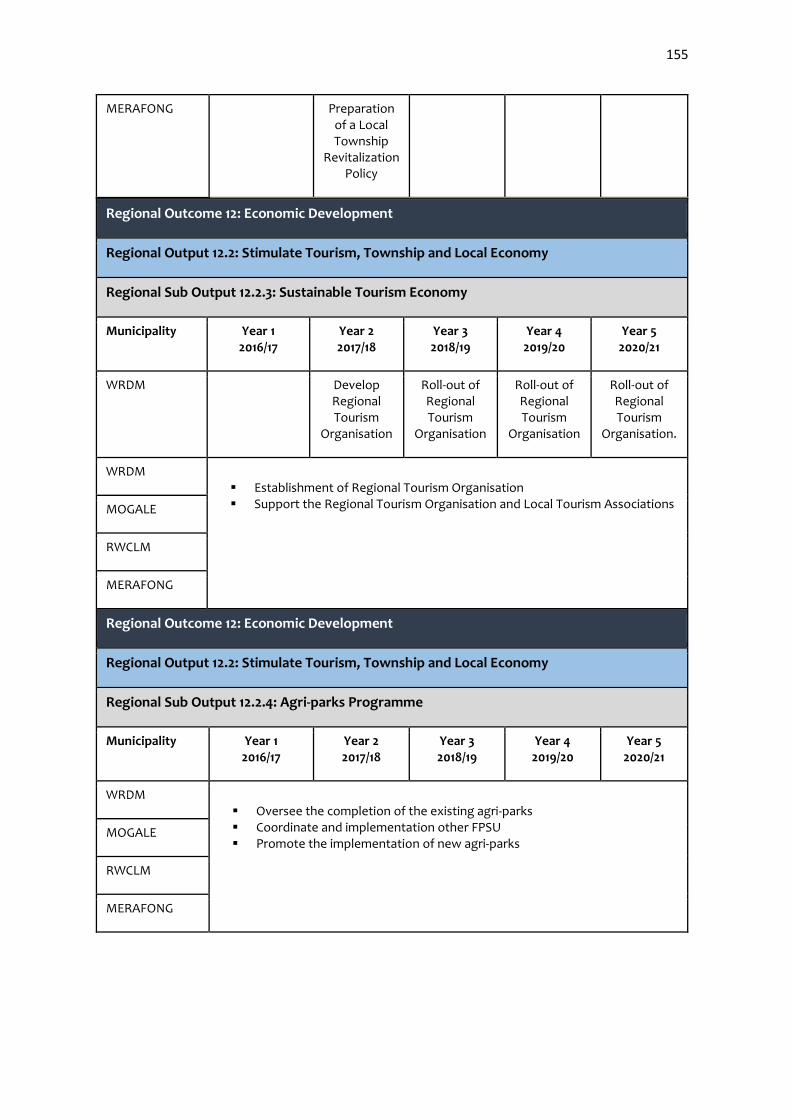
155
Regional Outcome 12: Economic Development
Regional Output 12.2: Stimulate Tourism, Township and Local Economy
Regional Sub Output 12.2.3: Sustainable Tourism Economy
Municipality Year 1 2016/17
Year 2 2017/18
Year 3 2018/19
Year 4 2019/20
Year 5 2020/21
WRDM Develop Regional Tourism
Organisation
Roll-out of Regional Tourism
Organisation
Roll-out of Regional Tourism
Organisation
Roll-out of Regional Tourism
Organisation.
WRDM Establishment of Regional Tourism Organisation Support the Regional Tourism Organisation and Local Tourism Associations
MOGALE
RWCLM
MERAFONG
Regional Outcome 12: Economic Development
Regional Output 12.2: Stimulate Tourism, Township and Local Economy
Regional Sub Output 12.2.4: Agri-parks Programme
Municipality Year 1 2016/17
Year 2 2017/18
Year 3 2018/19
Year 4 2019/20
Year 5 2020/21
WRDM Oversee the completion of the existing agri-parks Coordinate and implementation other FPSU Promote the implementation of new agri-parks
MOGALE
RWCLM
MERAFONG
MERAFONG Preparation of a Local Township
Revitalization Policy

156
Input and perspective from Department of Rural Development and Land Reform.
District Rural Development Plan
The Department of Rural Development and Land Reform developed the West Rand
District Rural Development Plan not only as an integrated, strategic plan for the rural
areas of the district, but also as an attempt at not just shallowly looking at rural areas
as “places of farming, isolation, marginalisation, poverty, and/or despair.” It looks at
these areas as for-far-too-long-forgotten zones of huge opportunities for economic
activities; job creation, a quality of life and a decent chance at life for all that live in
them. In support of this decidedly “opportunity-centred approach”, the Department
of Rural Development and Land Reform introduced a number of novel rural
development concepts, notably those of “functional regional rural zones”, “rural
design” and “transit-orientated rural development”.
While commissioned by the DRDLR, this plan is not intended to be implemented solely
by the Department. Instead it is a framework within which (1) national and provincial
departments and the municipalities in the district, (2) communities and their
representatives, and (3) private sector stakeholders, can engage and deliberate
shared challenges they face, the prospects on offer, and collectively map ways
forward in which all those living in the rural parts of the West Rand District, can make
a life, have a place in life and live a dignified and meaningful life.
The plan was conceived, prepared and refined over the course of a two-year period
through (1) extensive and intensive data gathering, site visits and analysis of and
integration and harmonisation with the legislation, policies, strategies, plans,
frameworks, programmes and projects of national and provincial government
departments and municipalities.
The key West Rand Rural Development Plan outcomes and components are: (1) a set
of three Functional Rural Regions spanning the West Rand District and in some cases
“functionally-tied” to neighbouring districts; (2) a set of three templates, one per
functional rural region, for ease of use in intergovernmental planning, budgeting and
implementation scheduling sessions; (3) a set of significant quick gain actions to be
undertaken in the West Rand District to meet government’s overarching objective of
addressing the triple challenges of inequality, poverty and unemployment facing the
district. It also contributes to the realisation of Outcome 7 by:
Transforming rural nodes into high-potency, catalytic regional rural
development anchors and rural service centres;
Expanding large and small-scale faming and supporting farmers and
associated agro-processing through the Agri-parks
Enabling and supporting Transit-Oriented Rural Development (TORD) along
suitable provincial routes; and
Strengthening and deepening natural systems-based tourism in the district

157
Even though the implementation of the plan rests on the enthusiastic, sustained and
collaborative efforts by a wide range of stakeholders and role-players, the following
actions are important:
Regular engagement with the relevant stakeholders in and outside the district
Lobbying and influencing other stakeholders and role-players for the inclusion
of the West Rand Rural Development Plan objectives, concepts and ideas in
plans, frameworks, policies and strategies that have an impact on rural
development in the province;
Aligning proposed plans, policies and strategies in the DRDLR with those of
other spheres and sectors of government;;
Populating and regularly updating the GIS database with all relevant
information, notably around projects and programmes; and
Keeping an eye open for new national, provincial and municipal legislation,
policies, plans, frameworks, strategies and programmes that may have an
impact on rural development in the district, and informing, as and where
necessary, the other units in the department of such documents.
The Department plans to use the Agri-Park as a catalytic program for the development
of rural West Rand district. The Agri-Park consists of an Agri-Hub in Brandvlei and four
Farmer Production Support Units in Tarlton, Magaliesburg, Bekkersdal and Merafong
Local Municipality. An 800sqm warehouse in currently under construction in
Bekkersdal. In Tarlton, construction of 20 tunnels are in progress in addition to the 10
completed by GDARD.
It is the Departments view that, should all stakeholders and key role players play their
unique roles, there is every chance that the plan could make a real difference for the
better to the lives of those living in rural West Rand District.
1.11.3. Game Changers / Strategic Projects (Regional Re-industrialisation)
Regional Outcome 11: Reduced Unemployment
Regional Output 11.1: Promote Job Creation Initiatives
Regional Sub Output 11.1.1: Local Youth Employment Initiatives by Local Business
Municipality Year 1
2016/17
Year 2
2017/18
Year 3
2018/19
Year 4
2019/20
Year 5
2020/21
WRDM
Reviving Chamdor Skills Centre for technical training as hub
Scarce skills training initiatives for Tourism e.g. Chef training
MOGALE
RWCLM
MERAFONG

158
Regional Outcome 11: Reduced Unemployment
Regional Output 11.1: Promote Job Creation Initiatives
Regional Sub Output 11.1.2: Expand Community Works Programme
Municipality Year 1
2016/17
Year 2
2017/18
Year 3
2018/19
Year 4
2019/20
Year 5
2020/21
RWCLM Refurbishment of (2) existing Business Hive – Toekomsrus
Construction of new (1) Business Hive – Westonaria
Construction of light industrial park
Refurbishment of (3) existing Business Hive – Randfontein
Construction of new (2) Business Hive – Simunye and Zuurbekom
Regional Outcome 11: Reduced Unemployment
Regional Output 11.1: Promote Job Creation Initiatives
Regional Sub Output 11.1.3: NDP Programme
Municipality Year 1
2016/17
Year 2
2017/18
Year 3
2018/19
Year 4
2019/20
Year 5
2020/21
RWCLM Construction of side walks
Construction of Simunye Multi-Purpose Centre
Regional Outcome 11: Reduced Unemployment
Regional Output 11.1: Promote Job Creation Initiatives
Regional Sub Output 11.1.4: Job Creation through LED Initiatives
Municipality Year 1
2016/17
Year 2
2017/18
Year 3
2018/19
Year 4
2019/20
Year 5
2020/21
RWCLM Develop. of Mall Randfontein
Develop. of Business Hive in Bekkersdal & Toekomsrus
Develop. of Pyrolysis Plant
Retail Mall in Bekkersdal
Isigayo Milling Plant
Develop. of Westonaria Ext 11
Agri-Park in Braamvlei
Develop. of Light industrial park
Regional Mall at Westonaria (N12/R28)
Construction of Tourism Centre (N12/R28)
Regional Outcome 12: Economic Development
Regional Output 12.1: Promote Regional Economic Development and Growth
Regional Sub Output 12.1.3: Farmer Support Initiatives
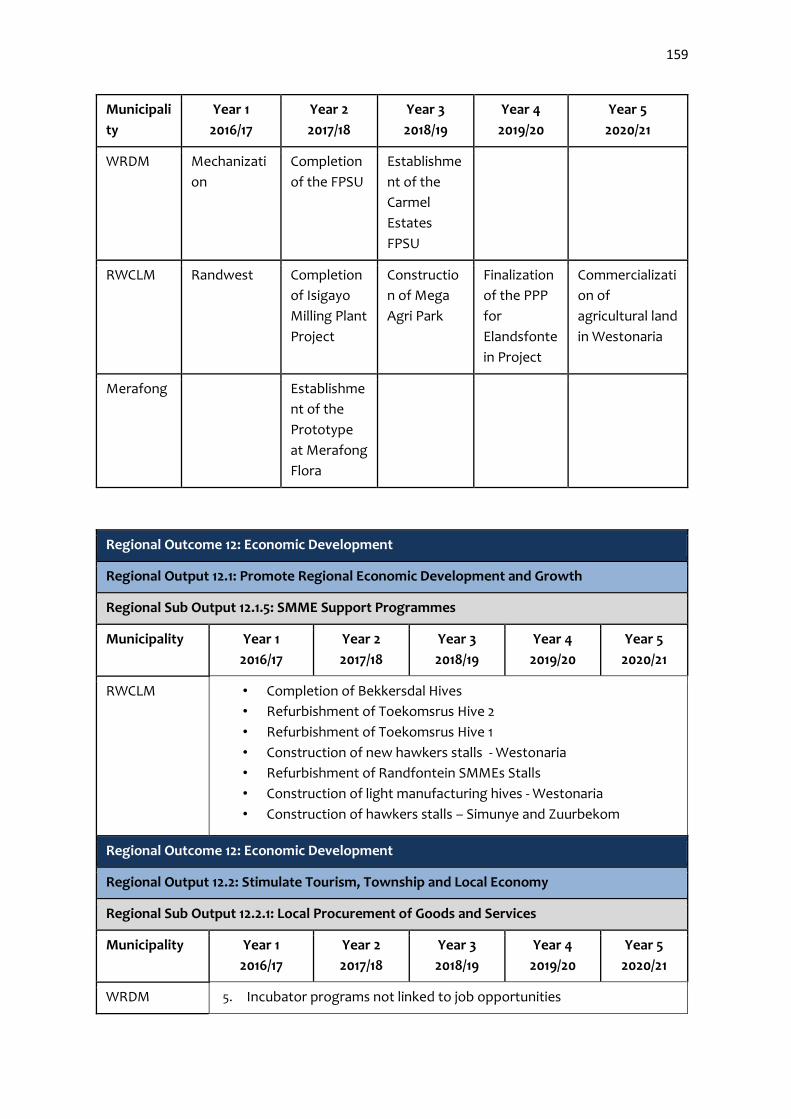
159
Municipali
ty
Year 1
2016/17
Year 2
2017/18
Year 3
2018/19
Year 4
2019/20
Year 5
2020/21
WRDM Mechanizati
on
Completion
of the FPSU
Establishme
nt of the
Carmel
Estates
FPSU
RWCLM Randwest Completion
of Isigayo
Milling Plant
Project
Constructio
n of Mega
Agri Park
Finalization
of the PPP
for
Elandsfonte
in Project
Commercializati
on of
agricultural land
in Westonaria
Merafong Establishme
nt of the
Prototype
at Merafong
Flora
Regional Outcome 12: Economic Development
Regional Output 12.1: Promote Regional Economic Development and Growth
Regional Sub Output 12.1.5: SMME Support Programmes
Municipality Year 1
2016/17
Year 2
2017/18
Year 3
2018/19
Year 4
2019/20
Year 5
2020/21
RWCLM • Completion of Bekkersdal Hives
• Refurbishment of Toekomsrus Hive 2
• Refurbishment of Toekomsrus Hive 1
• Construction of new hawkers stalls - Westonaria
• Refurbishment of Randfontein SMMEs Stalls
• Construction of light manufacturing hives - Westonaria
• Construction of hawkers stalls – Simunye and Zuurbekom
Regional Outcome 12: Economic Development
Regional Output 12.2: Stimulate Tourism, Township and Local Economy
Regional Sub Output 12.2.1: Local Procurement of Goods and Services
Municipality Year 1
2016/17
Year 2
2017/18
Year 3
2018/19
Year 4
2019/20
Year 5
2020/21
WRDM 5. Incubator programs not linked to job opportunities

160
MOGALE 6. Recruitment and selection policy to be reviewed to ensure the
programs attract the correct candidates
7. Optimal utilisation of business and industrial hives
8. Sub-letting to foreign national
RWCLM
MERAFONG
Regional Outcome 12: Economic Development
Regional Output 12.2: Stimulate Tourism, Township and Local Economy
Regional Sub Output 12.2.3: Sustainable Tourism Economy
Municipality Year 1
2016/17
Year 2
2017/18
Year 3
2018/19
Year 4
2019/20
Year 5
2020/21
WRDM
Establishment of RTO
Support the RTO and LTAs
MOGALE
RWCLM
MERAFONG
Regional Outcome 12: Economic Development
Regional Output 12.2: Stimulate Tourism, Township and Local Economy
Regional Sub Output 12.2.4: Agri-parks Programme
Municipality Year 1
2016/17
Year 2
2017/18
Year 3
2018/19
Year 4
2019/20
Year 5
2020/21
WRDM
Oversee the completion of the existing agri-parks
Coordinate and implementation other FPSU
Promote the implementation of new agri-parks
MOGALE
RWCLM
MERAFONG
1.11.4. Key Risks & Challenges (Regional Re-industrialisation)
Regional Outcome 11: Reduced Unemployment
Regional Output 11.1: Promote Job Creation Initiatives
Regional Sub Output 11.1.1: Local Youth Employment Initiatives by Local Business
Municipality Key Risks and Challenges

161
WRDM 1. Sustainability of the programmes because it is dependent on the
national
2. Limited skills of youth
3. Recruitment and selection process
4. Lack of formal incentive structure
5. Budgetary constraints
• Lack of capacity/resources within the municipality
• Youth poses limited skills
• Employers having less confidence in young
RWCLM
MOGALE
MERAFONG
Regional Outcome 11: Reduced Unemployment
Regional Output 11.1: Promote Job Creation Initiatives
Regional Sub Output 11.1.2: Expand Community Works Programme
Municipality Key Risks and Challenges
WRDM 1. Lack of coordination and management amongst departments
2. No clear exit strategy
3. The type work done e.g. picking of litter is regarded as inferior.
4. Retention of same beneficiation
5. Limited budget (Grant & Municipal Opex)
6. Lack of PPP Investment
RWCLM
MOGALE
MERAFONG
Regional Outcome 11: Reduced Unemployment
Regional Output 11.1: Promote Job Creation Initiatives
Regional Sub Output 11.1.3: NDP Programme
Municipality Key Risks and Challenges
WRDM
Delays in implementation Programme MOGALE
RWCLM
MERAFONG
Regional Outcome 11: Reduced Unemployment
Regional Output 11.1: Promote Job Creation Initiatives

162
Regional Sub Output 11.1.4: Job Creation through LED Initiative
Municipality Key Risks and Challenges
WRDM
Implementation of planned v/s funding MOGALE
RWCLM
MERAFONG
Regional Outcome 12: Economic Development
Regional Output 12.1: Promote Regional Economic Development and Growth
Regional Sub Output 12.1.1: Diversification of Economic Base
Municipality Key Risks and Challenges
WRDM 1. Incubator programs not linked to job opportunities
2. Recruitment and selection policy to be reviewed to ensure the
programs attract the correct candidates
3. Optimal utilisation of business and industrial hives
4. Sub-letting to foreign nationals
MOGALE
RWCLM
MERAFONG
Regional Outcome 12: Economic Development
Regional Output 12.1: Promote Regional Economic Development and Growth
Regional Sub Output 12.1.2: Expand Broad Band Access
Municipality Key Risks and Challenges
WRDM
1. Security risk on information management
2. Cost of rolling out the program
3. Limited IT infrastructure leading to a slow roll out of the
program
MOGALE
RWCLM
MERAFONG

163
Regional Outcome 12: Economic Development
Regional Output 12.1: Promote Regional Economic Development and Growth
Regional Sub Output 12.1.3: Farmer Support Initiatives
Municipality Key Risks and Challenges
WRDM Budgetary constraints
Lack of capacity – project monitoring
High breakdown rates for the implements and availability of
spare part s(mechanization)
Mismatch of implements
Thefts
MOGALE
RWCLM
MERAFONG
Regional Outcome 12: Economic Development
Regional Output 12.1: Promote Regional Economic Development and Growth
Regional Sub Output 12.1.4: Provision of Land to enable Economic Growth, Settlement of
Communities and Urbanisation
Municipality Key Risks and Challenges
WRDM
1. Access to private state owned (other spheres of government)
owned land
2. Land use right
MOGALE
RWCLM
MERAFONG
Regional Outcome 12: Economic Development
Regional Output 12.1: Promote Regional Economic Development and Growth
Regional Sub Output 12.1.5: SMME Support Programmes
Municipality Key Risks and Challenges
WRDM
1. No funding for SMME programs at municipal level (financial and non-
financial).
2. Access to business opportunities
3. Lack of business acumen
MOGALE
RWCLM
MERAFONG

164
Regional Outcome 12: Economic Development
Regional Output 12.2: Stimulate Tourism, Township and Local Economy
Regional Sub Output 12.2.1: Local Procurement of Goods and Services
Municipality Key Risks and Challenges
WRDM Lack of compliance with supply chain policies
Issues of the capacity of SMMEs to deliver on contracts
Companies and government not having faith on SMMEs to deliver
Escalation of prices
MOGALE
RWCLM
MERAFONG
Regional Outcome 12: Economic Development
Regional Output 12.2: Stimulate Tourism, Township and Local Economy
Regional Sub Output 12.2.2: LED Programmes
Municipality Key Risks and Challenges
WRDM
Lack of budget for LED programmes
LED sections in municipalities not capacitated to fulfil mandate
MOGALE
RWCLM
MERAFONG
Regional Outcome 12: Economic Development
Regional Output 12.2: Stimulate Tourism, Township and Local Economy
Regional Sub Output 12.2.3: Sustainable Tourism Economy
Municipality Key Risks and Challenges
WRDM
There's limited research and research methods for advancement MOGALE
RWCLM
MERAFONG

165
Regional Outcome 12: Economic Development
Regional Output 12.2: Stimulate Tourism, Township and Local Economy
Regional Sub Output 12.2.4: Agri-parks Programme
Municipality Year 1
2016/17
Year 2
2017/18
Year 3
2018/19
Year 4
2019/20
Year 5
2020/21
WRDM
Disease outbreaks
Sustainability of agri-parks MOGALE
RWCLM
MERAFONG
1.11.5. General Comments / Requests (Regional Re-industrialisation)
Outcome 11: Reduced Unemployment
Output 11.1: Promote Job Creation Initiatives
Sub Output 11.1.1: Local Youth Employment Initiatives by Local Business
Municipality General Comments/ Requests
WRDM 1. Youth employment Programmes should be implemented and
funded at to the district (e.g. Narysec, NYS, GP hospitality
programmes)
2. Development of incentives scheme e.g. tax rebates linked to
employment Target/measures by business.
3. Youth employment initiatives to be mainstreamed throughout the
municipality
4. Partnerships with private sector for youth employment required
RWCLM
MOGALE
MERAFONG
Outcome 11: Reduced Unemployment
Output 11.1: Promote Job Creation Initiatives
Sub Output 11.1.2: Expand Community Works Programme
Municipality General Comments/ Requests
WRDM 1. Coordination structure should be a fully-fledged office
2. All project specifications to be designed to be labour intensive in
compliance with EPWP
3. All Executives should have EPWP as part of their KPIs
4. Fast track of Implementation of MIG infrastructure project - more
EPWP Jobs
RWCLM
MOGALE
MERAFONG
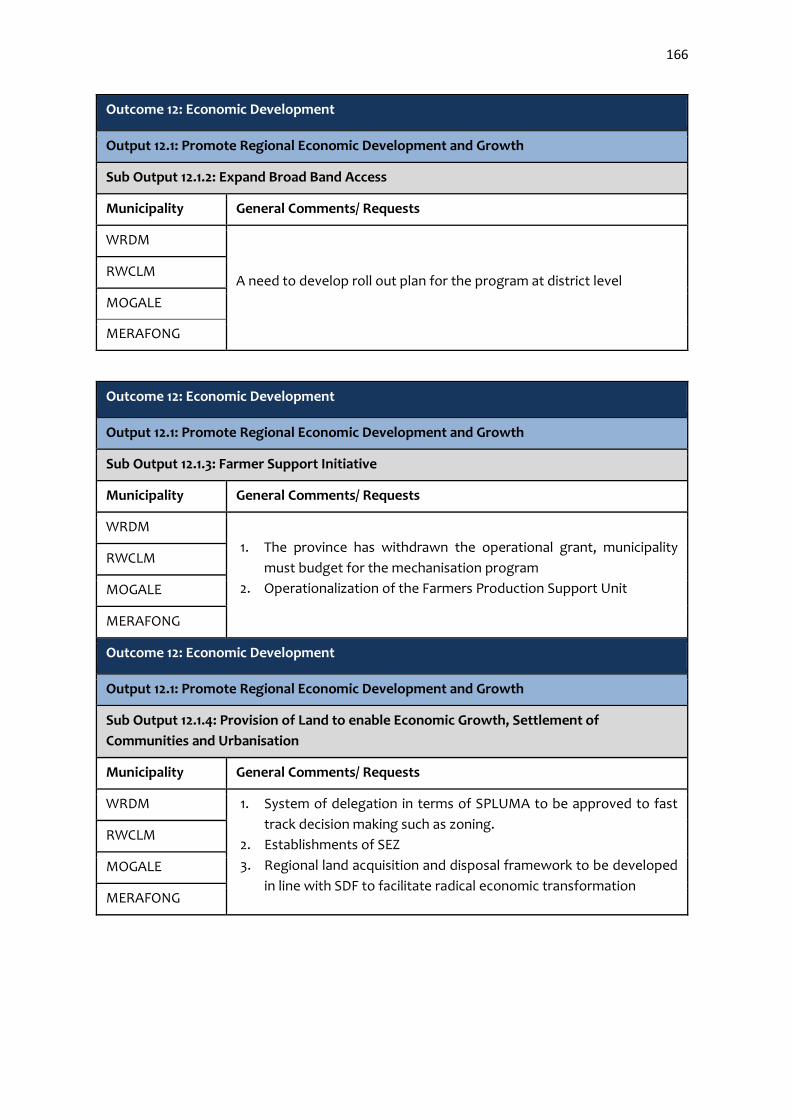
166
Outcome 12: Economic Development
Output 12.1: Promote Regional Economic Development and Growth
Sub Output 12.1.2: Expand Broad Band Access
Municipality General Comments/ Requests
WRDM
A need to develop roll out plan for the program at district level
RWCLM
MOGALE
MERAFONG
Outcome 12: Economic Development
Output 12.1: Promote Regional Economic Development and Growth
Sub Output 12.1.3: Farmer Support Initiative
Municipality General Comments/ Requests
WRDM
1. The province has withdrawn the operational grant, municipality
must budget for the mechanisation program
2. Operationalization of the Farmers Production Support Unit
RWCLM
MOGALE
MERAFONG
Outcome 12: Economic Development
Output 12.1: Promote Regional Economic Development and Growth
Sub Output 12.1.4: Provision of Land to enable Economic Growth, Settlement of
Communities and Urbanisation
Municipality General Comments/ Requests
WRDM 1. System of delegation in terms of SPLUMA to be approved to fast
track decision making such as zoning.
2. Establishments of SEZ
3. Regional land acquisition and disposal framework to be developed
in line with SDF to facilitate radical economic transformation
RWCLM
MOGALE
MERAFONG

167
Outcome 12: Economic Development
Output 12.1: Promote Regional Economic Development and Growth
Sub Output 12.1.5: SMME Support Programmes
Municipality General Comments/ Requests
WRDM
Establish enterprise development centres ( one stop shop)
Lack of budget- maintenance of facilities not consistent RWCLM
MOGALE
MERAFONG
Outcome 12: Economic Development
Output 12.2: Stimulate Tourism, Township and Local Economy
Sub Output 12.2.1: Local Procurement of Goods and Services
Municipality General Comments/ Requests
WRDM Big contracts are not awarded to local service providers
Review of the procurement policy to drive radical economic
transformation within the legislation framework.
Economic Services officials to be represented in all 3BID
communities
RWCLM
MOGALE
MERAFONG
Outcome 12: Economic Development
Output 12.2: Stimulate Tourism, Township and Local Economy
Sub Output 12.2.2: LED Programmes
Municipality General Comments/ Requests
WRDM
Provision of budgets for led programmes
Establish strategic partnership
Capacitate LED in terms of finance and human capital
RWCLM
MOGALE
MERAFONG

168
Outcome 12: Economic Development
Output 12.2: Stimulate Tourism, Township and Local Economy
Sub Output 12.2.3: Sustainable Tourism Economy
Municipality General Comments/ Requests
WRDM
There is a need for provision of the marketing material
Feasibility studies needs to be conducted for identified mega
projects
RWCLM
MOGALE
MERAFONG
Outcome 12: Economic Development
Output 12.2: Stimulate Tourism, Township and Local Economy
Sub Output 12.2.4: Agri-parks Programme
Municipality General Comments/ Requests
WRDM
Funding for agri-parks programme should be transferred from
National government to the district.
Support and market exposure
RWCLM
MOGALE
MERAFONG
Plenary Comments / Feedback/ Recommendations
a) Updtae status quo on the appropriation of land.
b) No corridor profiling – how are we attracting investors?
c) Also consider Gauteng at work and what came through from the recent SOPA in terms of job
creation
d) Give due attention to the neighbourhood issues
e) Engage companies on potential for rebates fro employing the youth
f) Profile investment opportunities and investment scheme
g) Consider standardisation of policies at regional level
h) Consider management of EPWPs to be centralised at district level. Standardise in terms of
incentives
i) Introduce district wide LED strategies eg. LED Unit vs. Agency.
j) Nothing presented on clothing and textiles
k) Consider other opportunities eg. Abattoir in region not being supplied by locals yet we have
land that could be used for grazing
l) Consider opportunities in tourism marketing, leveraging on the international awareness of
Maropeng

169
m) What is the status quo of small projects and the revitalisation of the township economy as
well as the 30% procurement from local SMMEs. There is even possibilities for exporting
SMME’s goods.
n) Neighbourhood Development Plan Grant (NDPG) to Mogale reported at R73m but only aware
of R46m; apparently withdrawn by National Treasury because of lack NDP planning
o) Consider opportunities with steel companies.
p) Can the incubation system of small businesses in Mogale be shared across Municipalities?
q) How can we benefit from the bus company in the region?
1.12. Community Services Commission (Development Strategy – Community Services)
1.12.1 Public Safety
Public Safety focussed on the following Regional Outcomes, Outputs and Sub Outputs. Below is
the inputs as received from the Commission.
Regional Outcome 5: Safe Communities
o Regional Output 5.1: People in the West Rand are and Feel Safe
Regional Sub Output 5.1.1: Public and Community Safety
Regional Sub Output 5.1.2: Licensing
Regional Sub Output 5.1.3: Community Visibility: Street Lightings and Signs
Regional Sub Output 5.1.4: Law Enforcement: Illegal Dumping
Regional Sub Output 5.1.5: Law Enforcement: Illegal Trading
Regional Sub Output 5.1.6: End Violence against Women and Children
1.12.1.1. Service Delivery Backlogs (Public Safety)
Regional Outcome 5: Safe Communities
Regional Output 5.1: People in the West Rand are and Feel Safe
Regional Sub Output 5.1.1: Public and Community Safety
MUNI. CURRENT
STATUS QUO
CURRENT GAPS ESTIMATED
BUDGET
COMMENTS
Regional Functional Public
Safety/Community
Safety Function
(Fire & rescue
services, Disaster
Management,
Community Safety
services, Traffic
Management &
Licensing Services)
• Resources
Constraints
e.g. equipment,
human resources,
budget, etc.
Non receipt of
equitable funding
to provide fire
brigade services &
R250m Section 152 (d)
• Promotion of
safe living
environment
remains a
Constitutional
mandate and
therefore
cannot be
compromised.

170
disaster
management
• Need to lobby
national and
provincial
governments
for funding on
the provision of
the two
functions.
• Lobby for the
revision of
equitable share
on the fire
brigade
function
Multi sectoral and
Multi Discipline
Approach on Public
Safety Activities
Consistent
Commitment of all
Stakeholders
Internal
Resources
Opportunity to
render emergency
services training
academy and
increase revenue
enhancement
Formal
Accreditation with
relevant
authorities
R2,5m • Urgent
appointment of
Principal for the
training
academy to
facilitate
accreditation
processes and
ensure revenue
enhancement
Regional Regionally
coordinated Law
Enforcement
Programmes
Lack of Training of
Officers as Peace
Officers & crowd
control
R250,000 • Inclusion of
private security
companies to
participate.
• Provision of
robust training
of Officers.
• Share available
resources
across
government
sectors.
• 100%
Regionally
provided
Fire and
• Lack of
financial
support from
other spheres
of government
R350m • Need to
establish fire
houses and
reservist forces
for the

171
Rescue
Services
to sustain fire
and rescue
services
• Compromised
response times
(rural areas and
townships)
provision of
equitably
effective
services
especially in
rural areas
• Joint planning
for all new
developments
• Alignment of all
Municipal Bye-
laws
• Municipalities
to deal with the
functionality of
fire hydrant.
Regional Functional Traffic
Management
• Resources
Constraints
• Ineffective
back office
• Lack of
municipal
courts
• Low collection
rate on traffic
fines
• Disparities in
the structure of
traffic fines
• Non-functional
communication
system
• Non-functional
By-Law
Enforcement
Unit
• Non-existent
Warrants Unit
• Fragmented
Traffic
Management
Systems
R110m Traffic Standardization of
systems
• Lack of 24hrs
provision of
traffic services
R5,5m

172
Provision of
licencing and
vehicle registration
• Assignments of
licences
through MOA
not benefiting
municipality.
• By-laws
enforcement
R70m • Municipality
ring fence 20%
collection from
licences
• Function to be
devolved fully
to municipality
Regional Outcome 5: Safe Communities
Regional Output 5.1: People in the West Rand are and Feel Safe
Regional Sub Output 5.1.2: Licensing
MUNI. CURRENT
STATUS QUO
CURRENT GAPS ESTIMATED
BUDGET
COMMENTS
Regional
Functional
Licensing
Services
Non-compliance
to the SLA
-
Functional
Licensing
Services
Unfair
distribution/split
of income
generated
50/50 split
Functional
Licensing
Services
Inadequate
budget
allocation for
infrastructure
development
Increase SLA
Infrastructure
allocation to
15%
Regional Outcome 5: Safe Communities
Regional Output 5.1: People in the West Rand are and Feel Safe
Regional Sub Output 5.1.3: Community Visibility: Street Lightings and Signs
MUNI. CURRENT
STATUS QUO
CURRENT GAPS ESTIMATED
BUDGET
COMMENTS
Regional
Non-functional
of Social Crime
Prevention
Units in
Municipalities
Resources
Constraints
R9m Budget
commitment from
all municipalities
Delayed access
to emergencies
Lack of street
names &
effective lighting
(particularly in
Townships &
rural area)
An assessment
needs to be
conducted in this
regard
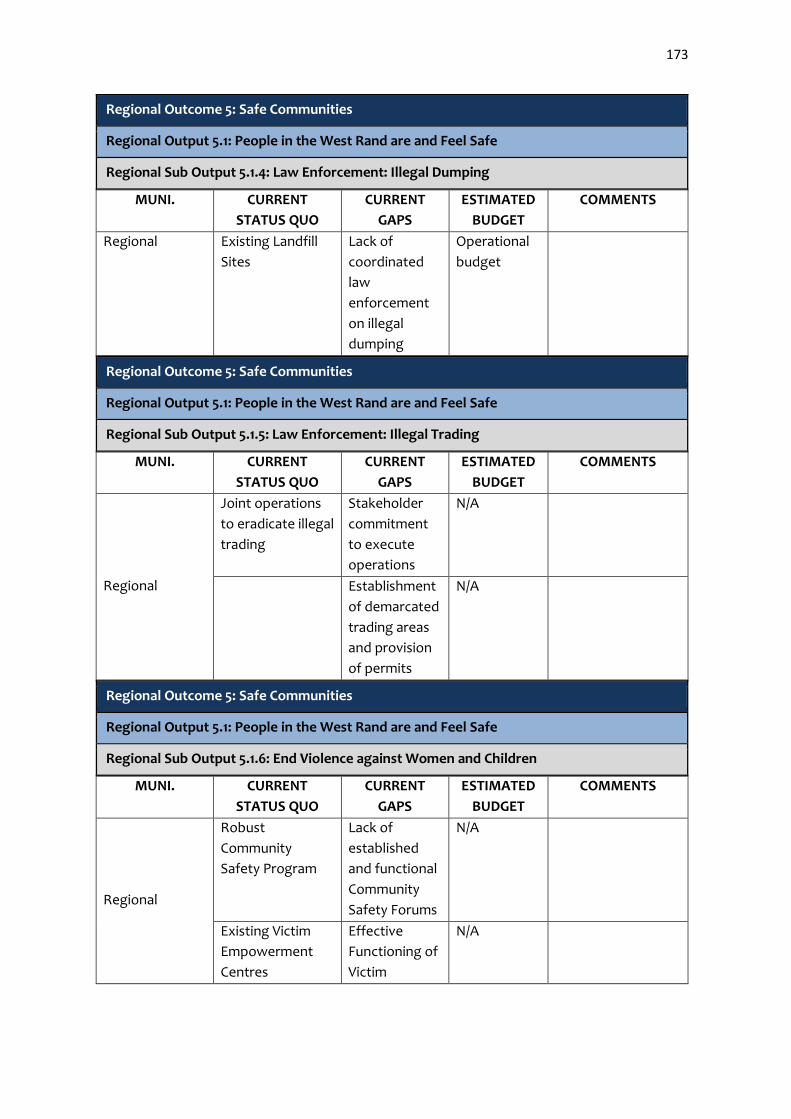
173
Regional Outcome 5: Safe Communities
Regional Output 5.1: People in the West Rand are and Feel Safe
Regional Sub Output 5.1.4: Law Enforcement: Illegal Dumping
MUNI. CURRENT
STATUS QUO
CURRENT
GAPS
ESTIMATED
BUDGET
COMMENTS
Regional Existing Landfill
Sites
Lack of
coordinated
law
enforcement
on illegal
dumping
Operational
budget
Regional Outcome 5: Safe Communities
Regional Output 5.1: People in the West Rand are and Feel Safe
Regional Sub Output 5.1.5: Law Enforcement: Illegal Trading
MUNI. CURRENT
STATUS QUO
CURRENT
GAPS
ESTIMATED
BUDGET
COMMENTS
Regional
Joint operations
to eradicate illegal
trading
Stakeholder
commitment
to execute
operations
N/A
Establishment
of demarcated
trading areas
and provision
of permits
N/A
Regional Outcome 5: Safe Communities
Regional Output 5.1: People in the West Rand are and Feel Safe
Regional Sub Output 5.1.6: End Violence against Women and Children
MUNI. CURRENT
STATUS QUO
CURRENT
GAPS
ESTIMATED
BUDGET
COMMENTS
Regional
Robust
Community
Safety Program
Lack of
established
and functional
Community
Safety Forums
N/A
Existing Victim
Empowerment
Centres
Effective
Functioning of
Victim
N/A

174
Empowerment
Centres
1.12.1.2. Target/measures to be achieved over the next 5 years (Public Safety)
Regional Outcome 5: Safe Communities
Regional Output 5.1: People in the West Rand are and Feel Safe
Regional Sub Output 5.1.1: Public and Community Safety
Municipality Year 1
2016/17
Year 2
2017/18
Year 3
2018/19
Year 4
2019/20
Year 5
2020/21
Regional
% compliance to
regional
Community
Safety Plan.
100 100 100 100 100
Regional %
Implementation
of Seamless
traffic
management
systems
2 60 80 100
Regional %
Revised,
Standardised and
Regionalised
By – laws
5 100
% Regionally
coordinated
sourcing and
standardization
of traffic
management
fleet
5 80 100
Regional %
Conducting of
security risk
assessment
100
Regional %
Regionalisation 5 20 45 75 100

175
of VIP Protection
Services
Regional %
Conducting of
joint operations
to eradicate
crime & social ill
100 100 100 100 100

176
Regional Outcome 5: Safe Communities
Regional Output 5.1: People in the West Rand are and Feel Safe
Regional Sub Output 5.1.2: Licensing
Municipality Year 1
2016/17
Year 2
2017/18
Year 3
2018/19
Year 4
2019/20
Year 5
2020/2
1
Regional
%
Regionalisati
on of
Licensing
Services
15% 30% 65% 100%
Revision of
the SLA with
GDR&T
100%
Implementati
on of the SLA 100% 100% 100% 100%
Regional Outcome 5: Safe Communities
Regional Output 5.1: People in the West Rand are and Feel Safe
Regional Sub Output 5.1.3: Community Visibility: Street Lightings and Signs
Municipality Year 1
2016/17
Year 2
2017/18
Year 3
2018/19
Year 4
2019/20
Year 5
2020/2
1
Regional Erection of
street names
Provision of
effective
street lighting
in townships
and rural
roads
Regional Outcome 5: Safe Communities
Regional Output 5.1: People in the West Rand are and Feel Safe
Regional Sub Output 5.1.5: Law Enforcement: Illegal Trading
Municipalit
y
Year 1
2016/17
Year 2
2017/18
Year 3
2018/19
Year 4
2019/20
Year 5
2020/21
Regional Implementation
of the
Community
Implementatio
n of the
Community
Implementatio
n of the
Community
Implementatio
n of the
Community
Implementat
ion of the
Community

177
Safety Plan and
relevant By
laws
Safety Plan and
relevant By
laws
Safety Plan and
relevant By
laws
Safety Plan and
relevant By
laws
Safety Plan
and relevant
By laws
Regional Outcome 5: Safe Communities
Regional Output 5.1: People in the West Rand are and Feel Safe
Regional Sub Output 5.1.6: End Violence against Women and Children
Municip
ality
Year 1
2016/17
Year 2
2017/18
Year 3
2018/19
Year 4
2019/20
Year 5
2020/21
Regiona
l
Effective
implementati
on of the 16
day of
activism on
violence
against
women and
children
Effective
implementati
on of the 16
day of
activism on
violence
against
women and
children
Effective
implementati
on of the 16
day of
activism on
violence
against
women and
children
Effective
implementati
on of the 16
day of
activism on
violence
against
women and
children
Effective
implementati
on of the 16
day of
activism on
violence
against
women and
children
1.12.1.3. Game Changer / Strategic Projects (Public Safety)
Regional Outcome 5: Safe Communities
Regional Output 5.1: People in the West Rand are and Feel Safe
Regional Sub Output 5.1.1: Public and Community Safety
Municipality Year 1
2016/17
Year 2
2017/18
Year 3
2018/19
Year 4
2019/20
Year 5
2020/21
Regional
Expansion of
CCTV to
townships
and suburbs
5% 35% 75% 100%
Establishment
of Fire houses
in townships
and rural
areas
30% 75% 100%
Establishment
of municipal
courts
25% 45% 75% 100%

178
Provision of a
24hrs traffic
services
20% 30% 50% 100%
Recruitment
of skilled
workforce
100% 100% 100% 100%
Regional Outcome 5: Safe Communities
Regional Output 5.1: People in the West Rand are and Feel Safe
Regional Sub Output 5.1.2: Licensing
Municipality Year 1
2016/17
Year 2
2017/18
Year 3
2018/19
Year 4
2019/20
Year 5
2020/21
Regional Establishment
of satellite
licensing
Offices in
respective
townships
Regional Outcome 5: Safe Communities
Regional Output 5.1: People in the West Rand are and Feel Safe
Regional Sub Output 5.1.4: Law Enforcement: Illegal Dumping
Municipality Year 1
2016/17
Year 2
2017/18
Year 3
2018/19
Year 4
2019/20
Year 5
2020/21
Regional Identify
possible
areas of
illegal
dumping &
enforce the
applicable
by-laws
By law
enforcement
By law
enforcement
By law
enforcement
By law
enforcement

179
1.12.1.4. Key Risks & Challenges (Public Safety)
Regional Outcome 5: Safe Communities
Regional Output 5.1: People in the West Rand are and Feel Safe
Regional Sub Output 5.1.1: Public and Community Safety
Municipality Key Risks and Challenges
Regional
Legislative constraints,
Resources constraints (funding, personnel, equipment, etc.),
Administrative continuity, (erosion of institutional memory)
Commitment by all stakeholders
Unfunded mandates
Regional Outcome 5: Safe Communities
Regional Output 5.1: People in the West Rand are and Feel Safe
Regional Sub Output 5.1.2: Licensing
Municipality Key Risks and Challenges
Regional
Fraud & Corruption (issuing of licenses)
Ineffective, continued supervision/supervision over licensing activities by
Provincial Inspectorate
Regional Outcome 5: Safe Communities
Regional Output 5.1: People in the West Rand are and Feel Safe
Regional Sub Output 5.1.3: Community Visibility: Street Lightings and Signs
Municipality Key Risks and Challenges
Regional
Community protests
Attack to political leaders and officers as a result of delayed
responses
Damage to property
Regional Outcome 5: Safe Communities
Regional Output 5.1: People in the West Rand are and Feel Safe

180
Regional Sub Output 5.1.4: Law Enforcement: Illegal Dumping
Municipality Key Risks and Challenges
Regional Resources constraints
Lack cooperation from other stakeholders
Regional Outcome 5: Safe Communities
Regional Output 5.1: People in the West Rand are and Feel Safe
Regional Sub Output 5.1.5: Law Enforcement: Illegal Trading
Municipality Key Risks and Challenges
Regional Threat to formal traders
Regional Outcome 5: Safe Communities
Regional Output 5.1: People in the West Rand are and Feel Safe
Regional Sub Output 5.1.6: End Violence against Women and Children
Municipality Key Risks and Challenges
Regional Lack incident reporting
Adequate and effective response to incidents of similar nature
1.12.1.5General Comments / Requests (Public Safety)
Outcome 5: Safe Communities
Output 5.1: People in the West Rand are and Feel Safe
Sub Output 5.1.1: Public and Community Safety
Municipality General Comments/ Requests
Regional
More resources, establishment of Satellite offices
Initiating engagement with an endeavour to establish a Metro Police
Department in 2021
Regionalization of all procurements processes of traffic fleet, traffic
uniforms to be facilitated by the WRDM for all municipalities in the
region
Municipalities are encouraged to contribute towards the strengthening
of the rendering of fire brigade services in the region

181
Outcome 5: Safe Communities
Output 5.1: People in the West Rand are and Feel Safe
Sub Output 5.1.2: Licensing
Municipality General Comments/ Requests
Regional Revision of agreement between province and municipalities
Outcome 5: Safe Communities
Output 5.1: People in the West Rand are and Feel Safe
Sub Output 5.1.3: Community Visibility: Street Lightings and Signs
Municipality General Comments/ Requests
Regional Engagement with relevant department to address the identified
shortfalls
Outcome 5: Safe Communities
Output 5.1: People in the West Rand are and Feel Safe
Sub Output 5.1.4: Law Enforcement: Illegal Dumping
Municipality General Comments/ Requests
Regional Courts not considering illegal dumping as a priority crime therefore
little if no attention is given
Outcome 5: Safe Communities
Output 5.1: People in the West Rand are and Feel Safe
Sub Output 5.1.6: End Violence against Women and Children
Municipality General Comments/ Requests
Regional The programme on 16 days of activism on violence against women and
children be conducted throughout the year
Plenary Comments / Feedback/ Recommendations
a) How do you intend to mobilise resources?
b) Report on the establishment of a training academy based on our renowned disaster
management expertise nationally and internationally
c) Report on fighting crime, fraud and corruption with emphasis on joint operations on drug
syndicates and human trafficking

182
1.12.2. Community Services: Health & Social Development
The Health and Social Development Commission focussed on the following Regional Outcomes,
Outputs and Sub-Outputs.
Regional Outcome 6: Educated Communities
o Regional Output 6.1: Improved Basic Education in the West Rand
Regional Sub Output 6.1.1: Early Childhood Development Programmes
Regional Sub Output 6.1.2: Community Based Learning and Teaching Campaigns
Regional Sub Output 6.1.3: Resourced Learning Centres (Libraries)
Regional Sub Output 6.1.4: Initiatives to enable Community Owned
Infrastructure
Regional Outcome 7: Healthy Communities
o Regional Output 7.1: Improved Basic Education in the West Rand
Regional Sub Output 7.1.1: Coordinate Health Infrastructure Establishments and
Maintenance
Regional Sub Output 7.1.2: Promote Health Check Campaigns and Participation
Regional Sub Output 7.1.3: Strengthen Health Programme: HIV, TB, and Dread
Diseases
Regional Sub Output 7.1.4: Municipal Health Services
Regional Outcome 10: Healthy Communities
o Regional Output 10.1: Establish a Socially Cohesive West Rand Community
Regional Sub Output 10.1.1: Implement Social Cohesion Initiatives / Programmes
Regional Sub Output 10.1.2: Establish Shared Community Centres & Promotion of
Social Cohesion
1.12.2.1. Service Delivery Backlogs (Health and Social Development)
Regional Outcome 6: Educated Communities
Regional Output 6.1: Improved Basic Education in the West Rand
Regional Sub Output 6.1.1: Early Childhood Development Programmes
MUNI. CURRENT
STATUS QUO
CURRENT GAPS ESTIMATED
BUDGET
COMMENTS
WRDM • General
compliance
across the
region remains
at 38%
• Insufficient and
old Educational
Toys at the 10
libraries.
• No municipal
social
workers in
Merafong
City and
WRDM;
• Shortage of
EHPs per area
(need extra
Operational
• Budget allocation
to resource
libraries without
Ed Toys and;
• To increase and
replace warn out
Ed toys at
libraries.

183
• Small number of
trained ECDCs
managers
• 24 EHPs for the
whole region
36 EHPs per
SANS);
• Support ECDCs
institutions with
capacity building
on Child
Development
Mogale 49%
9 Social workers, 8
Assistant social
workers
9 social workers
insufficient for
the job to be
done.
• High number
of
unregistered
ECD Centres
due to
compliance.
• Three
approved
Social
Auxiliary
social
workers
post vacant
Operational • Government build
more ECD
Centres.
• Increase number
of EHP to assist in
monitoring the
ECD Centres for
compliance.
RWCLM 41% 3 Social
Workers
No allocation Operational
Merafong 24% No social worker Nil
Regional Outcome 6: Educated Communities
Regional Output 6.1: Improved Basic Education in the West Rand
Regional Sub Output 6.1.2: Community Based Learning and Teaching Campaigns
MUNI. CURRENT
STATUS QUO
CURRENT
GAPS
ESTIMATED
BUDGET
COMMENTS

184
WRDM Reading clubs
at selected
schools
Story reading
at ECDCs
Prevention of
teenage
pregnancy to
ensure
uninterrupted
education;
Insufficient
books for
distribution
to clubs
due
budgetary
constraints;
No
dedicated
person for
driving the
programme
No
scientific
research
done to
measure
success in
reducing
the no of
learners
falling
pregnant
Operational There is a need for
reading competition
to encourage
learners;
There is a need for a
research to measure
impact of
prevention of
teenage pregnancy
in learners
There is a need to
look at those
orphans with regard
to bursary
RWCLM Open application
for bursary to
needy learners
Insufficient
funds
MERAFONG Source Bursary
from mining
and
From own
funds assist
with first year
tertiary
registration
high
performers
and learners
from indigent
households
Insufficient
funds
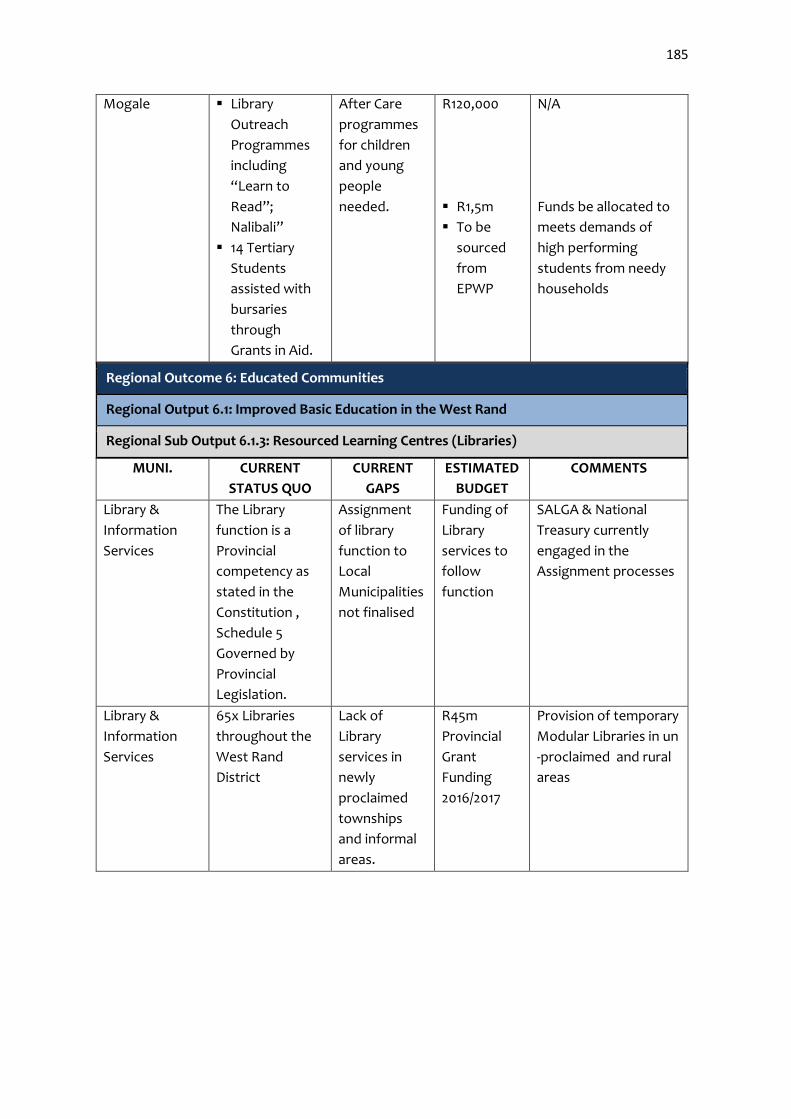
185
Mogale Library
Outreach
Programmes
including
“Learn to
Read”;
Nalibali”
14 Tertiary
Students
assisted with
bursaries
through
Grants in Aid.
After Care
programmes
for children
and young
people
needed.
R120,000
R1,5m
To be
sourced
from
EPWP
N/A
Funds be allocated to
meets demands of
high performing
students from needy
households
Regional Outcome 6: Educated Communities
Regional Output 6.1: Improved Basic Education in the West Rand
Regional Sub Output 6.1.3: Resourced Learning Centres (Libraries)
MUNI. CURRENT
STATUS QUO
CURRENT
GAPS
ESTIMATED
BUDGET
COMMENTS
Library &
Information
Services
The Library
function is a
Provincial
competency as
stated in the
Constitution ,
Schedule 5
Governed by
Provincial
Legislation.
Assignment
of library
function to
Local
Municipalities
not finalised
Funding of
Library
services to
follow
function
SALGA & National
Treasury currently
engaged in the
Assignment processes
Library &
Information
Services
65x Libraries
throughout the
West Rand
District
Lack of
Library
services in
newly
proclaimed
townships
and informal
areas.
R45m
Provincial
Grant
Funding
2016/2017
Provision of temporary
Modular Libraries in un
-proclaimed and rural
areas

186
Library &
Information
Services
Procurement of
new books &
resources
Insufficient
study material
for secondary
and tertiary
students
Provincial
Grant Fund
New books and
resources procured
annually
Library &
Information
Services
Insufficient
Staffing
Shortfall of
staff in new
Libraries.
Contractual
status of
some staff
members
Provincial
Grant Fund
Alignment and
approval of District
wide Municipal
Organograms
Library &
Information
Services
Community
access to ICT
resources
Insufficient
number of
computers in
all Libraries
Provincial
Grant
New computers
procured annually for
all Libraries
Regional Outcome 6: Educated Communities
Regional Output 6.1: Improved Basic Education in the West Rand
Regional Sub Output 6.1.4: Initiatives to enable Community Owned Infrastructure
MUNI. CURRENT
STATUS QUO
CURRENT
GAPS
ESTIMATED
BUDGET
COMMENTS
West Rand There are a
number of
registered
ECDCs and a
number of
informal ECDCs
within all
municipalities
Dept. of Social
Development
has
infrastructure
The ratio
currently of
registered vs
informal is
around 40/60
Non-
compliance to
infrastructure
requirements
as per the
MHS norms
and standards
and Town
Provincial
Budget
• Delay in
implementation
by the depts.
• Non-alignment
of budget
allocation by
province for
projects at local
municipalities
to the zoning
and all other
Library &
Information
Services
2x New Library`s
earmarked for
Rand West City
2017/2018
1x New Library in
Merafong
2017/2018
Additional
areas and
communities
needing
Libraries
earmarked for
outer years.
Provincial
Grant Fund
All Capital projects to
be implemented jointly
with Provincial
Department Sports
Arts & Culture

187
projects for West
Rand
planning
regulations
studies relevant
for the project.
Regional Outcome 7: Healthy Communities
Regional Output 7.1: Promotion of Health Services within West Rand Communities
Regional Sub Output 7.1.1: Co-ordinate Health Infrastructure Establishments and
Maintenance
MUNI. CURRENT
STATUS QUO
CURRENT
GAPS
ESTIMATED
BUDGET
COMMENTS
West Rand
region
There are
number of
planned new
clinics and those
scheduled for
maintenance or
upgrading
Rural areas in
Merafong and
Rand West
have less
clinics
Provincial
Budget
Engagement with
province through DHC
are continuous
Regional Outcome 7: Healthy Communities
Regional Output 7.1: Promotion of Health Services within West Rand Communities
Regional Sub Output 7.1.2: Promote Health Check Campaigns and Participation
MUNI. CURRENT
STATUS QUO
CURRENT GAPS ESTIMATED
BUDGET
COMMENTS
West Rand
Regional
All
municipalities
provide the
HCT through
the HIV and
AIDs
programme
Grant funded
(budgetary
contrainsts);
Stipends of
volunteers
remain at R1 500
since 2005 and
yet those paid by
province are at
R2 200 per
month
R7,17m Municipalities to look at
covering the shortfall as
the bulk is paid through
grant;
Provision of
identification clothing
to all volunteers
Regional Outcome 7: Healthy Communities
Regional Output 7.1: Promotion of Health Services within West Rand Communities
Regional Sub Output 7.1.3: Strengthen Health Programmes: HIV, TB, and Dread Diseases
MUNI. CURRENT
STATUS QUO
CURRENT
GAPS
ESTIMATED
BUDGET
COMMENTS

188
West Rand All municipalities
provide the HCT
through the HIV
and AIDs
programme
Grant funded;
Stipends of
volunteers
remain at R1
500 since
2005 and yet
those paid by
province are
at R2 200 per
month
R7,17m Municipalities to look at
covering the shortfall as
the bulk is paid through
grant;
Provision of
identification clothing
to all volunteers
Regional Outcome 7: Healthy Communities
Regional Output 7.1: Promotion of Health Services within West Rand Communities
Regional Sub Output 7.1.4: Municipal Health Services
MUNI. CURRENT
STATUS QUO
CURRENT
GAPS
ESTIMATED
BUDGET
COMMENTS
Regional
services
All 9 functions
are implemented
Staff shortage
(36 per norm)
Equipment
e.g. sound
meters etc.
R30m
(for
equipment
and
additional
personnel)
MHS is one of the
district function under
Section 84 (i)
Regional Outcome 10: Socially Cohesive Communities
Regional Output 10.1: Establish a Socially Cohesive West Rand Community
Regional Sub Output 10.1.1: Implement Social Cohesion Initiatives / Programmes
MUNI. CURRENT
STATUS QUO
CURRENT GAPS ESTIMATED
BUDGET
COMMENTS
Mogale Programmes
facilitated to
support
vulnerable
groups; indigent
households,
children, youth,
elderly, people
with disabilities
and gender
empowerment.
Insufficient
space for
accommodation
of programmes.
Funding for
programmes.
R5m
Programme based
budgeting to be
explored.

189
Regional Outcome 10: Socially Cohesive Communities
Regional Output 10.1: Establish a Socially Cohesive West Rand Community
Regional Sub Output 10.1.1: Implement Social Cohesion Initiatives / Programmes
MUNI. CURRENT
STATUS QUO
CURRENT
GAPS
ESTIMATED
BUDGET
COMMENTS
Municipal Area Status Quo Current
Gaps/shortfalls
Budget
Estimates
comments
RWCLM 2 stadiums
1 Sports ground
5 Community
halls
1Ne.ll court
1 sports complex
Incomplete
sports
complex in
Toekomsrus
Stadium at
Bekkersdal/
Simunye
No theatre
No Film/Music
studio
No community
hall at
Bekkersdal
Not stated There is a need for
maintenance of
facilities once province
has built them;
Communities don’t
own facilities thus
vandalize them
Mogale City 9 community
halls
3 stadiums
Sports grounds
in most
community areas
3 sports
complexes
Planned
• Burgershoop
MPCC
upgrading;
• Kagiso
Thusong
Centre
upgrading
• Kagiso and
Azaadville
swimming
pools
upgrading;
• Lewisham
tennis court
Sports
complexes at
informal
settlement
areas
R24,223,205

190
• Kagiso,
Munsieville
and
Coronation
Parks
Merafong City 7 Community
halls
2 stadiums
5 sports grounds
1 theatre
Sports
complexes to
accommodate
various
sporting codes
Maintenance of the
community facilities
1.12.2.2. Target/measures to be achieved over the next 5 years (Health and Social Development)
Regional Outcome 6: Safe Communities
Regional Output 6.1: Improved Basic Education in the West Rand
Regional Sub Output 6.1.1: Early Childhood Development Programmes
Municipality Year 1
2016/17
Year 2
2017/18
Year 3
2018/19
Year 4
2019/20
Year 5
2020/21
WRDM
• Focused
capacity
building of
ECDCs
Institutions;
• Budget
allocation
to ECDC
training
WRDM
• Engagement
of the ECDC
Institute of
Education
for training
support;
• All
municipalitie
s include
ECDC
trainings in
their IDP and
budget
_ _ 120 180
WRDM
• Budget
allocation
for
purchase of
educational
toys and
replacemen
WRDM
• Inclusion
ECDCs
training and
purchase of
Educational
toys in
review of
Purchase of
Ed Toys for
2 libraries
and
replacemen
t of warn
out toys
2 libraries
and
replacemen
t
2 libraries
and
replacemen
t
2 libraries
and
replacemen
t
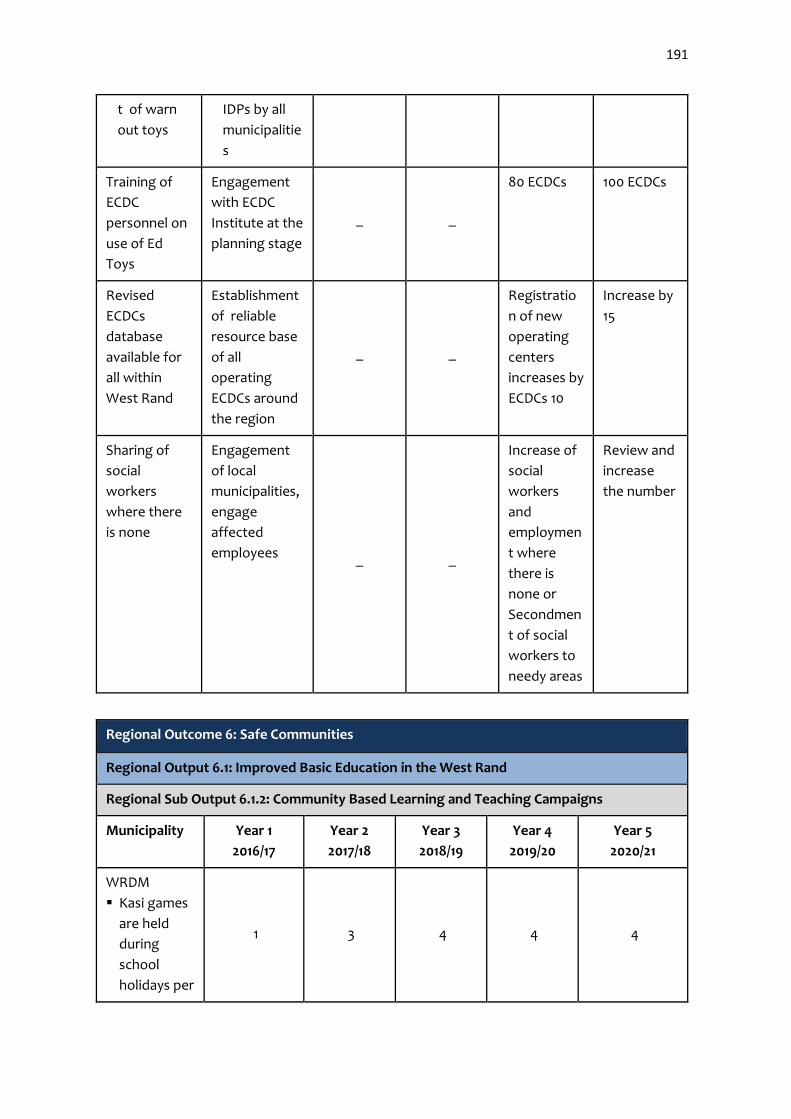
191
t of warn
out toys
IDPs by all
municipalitie
s
Training of
ECDC
personnel on
use of Ed
Toys
Engagement
with ECDC
Institute at the
planning stage
_ _
80 ECDCs 100 ECDCs
Revised
ECDCs
database
available for
all within
West Rand
Establishment
of reliable
resource base
of all
operating
ECDCs around
the region
_ _
Registratio
n of new
operating
centers
increases by
ECDCs 10
Increase by
15
Sharing of
social
workers
where there
is none
Engagement
of local
municipalities,
engage
affected
employees _ _
Increase of
social
workers
and
employmen
t where
there is
none or
Secondmen
t of social
workers to
needy areas
Review and
increase
the number
Regional Outcome 6: Safe Communities
Regional Output 6.1: Improved Basic Education in the West Rand
Regional Sub Output 6.1.2: Community Based Learning and Teaching Campaigns
Municipality Year 1
2016/17
Year 2
2017/18
Year 3
2018/19
Year 4
2019/20
Year 5
2020/21
WRDM
Kasi games
are held
during
school
holidays per
1 3 4 4 4

192
Regional Outcome 6: Safe Communities
Regional Output 6.1: Improved Basic Education in the West Rand
Regional Sub Output 6.1.3: Resourced Learning Centres (Libraries)
Municipality Year 1
2016/17
Year 2
2017/18
Year 3
2018/19
Year 4
2019/20
Year 5
2020/21
Mogale Start of 2
Modular
Libraries
(Manseville and
Smoke Down)
Extension of
Kagiso
Library
_ _ _
RWCLM Randfontein
Town Library
planning
started
June 2016
Concept
Design
finalisation,
Appointment
of contractor
Construction
to
commence
Project
complete
_ _
MERAFONG
Kokosi library
May 2016 _ _ _ October 2020
Khutsong
Modular library
June 2017 _ _ _
local
municipality
There is
allocated
budget to
support
such games

193
Regional Outcome 6: Safe Communities
Regional Output 6.1: Improved Basic Education in the West Rand
Regional Sub Output 6.1.4: Initiatives to enable Community Owned Infrastructure
Municipality Year 1
2016/17
Year 2
2017/18
Year 3
2018/19
Year 4
2019/20
Year 5
2020/21
Mogale Hekpoort
ECDC
July 2017
Completion
of Kagiso and
Burgershoop
ECDC
renovations
Upgrade
and
extension
of
Sinqobile
ECDC
Nov 2019
_
Merafong Khutsong
Social
Integrated
Facility
May 2015
_ _ _ July 2020
Regional Outcome 7: Healthy Communities
Regional Output 7.1: Promotion of Health Services within West Rand Communities
Regional Sub Output 7.1.1: Coordinate Health Infrastructure Establishments and
Maintenance
Municipality Year 1
2016/17
Year 2
2017/18
Year 3
2018/19
Year 4
2019/20
Year 5
2020/21
Mogale:
Kagiso CHC June 2017 Nov 2020
Rand West:
Randgate
Clinic
Nov 2011-
March 2017
Rand West:
Mohlakeng
CHC
May 2017 Feb 2020
Merafong:
Kokosi May 2015 July 2019
Merafong:
Khutsong
South Ext 2
May 2015 August
2018
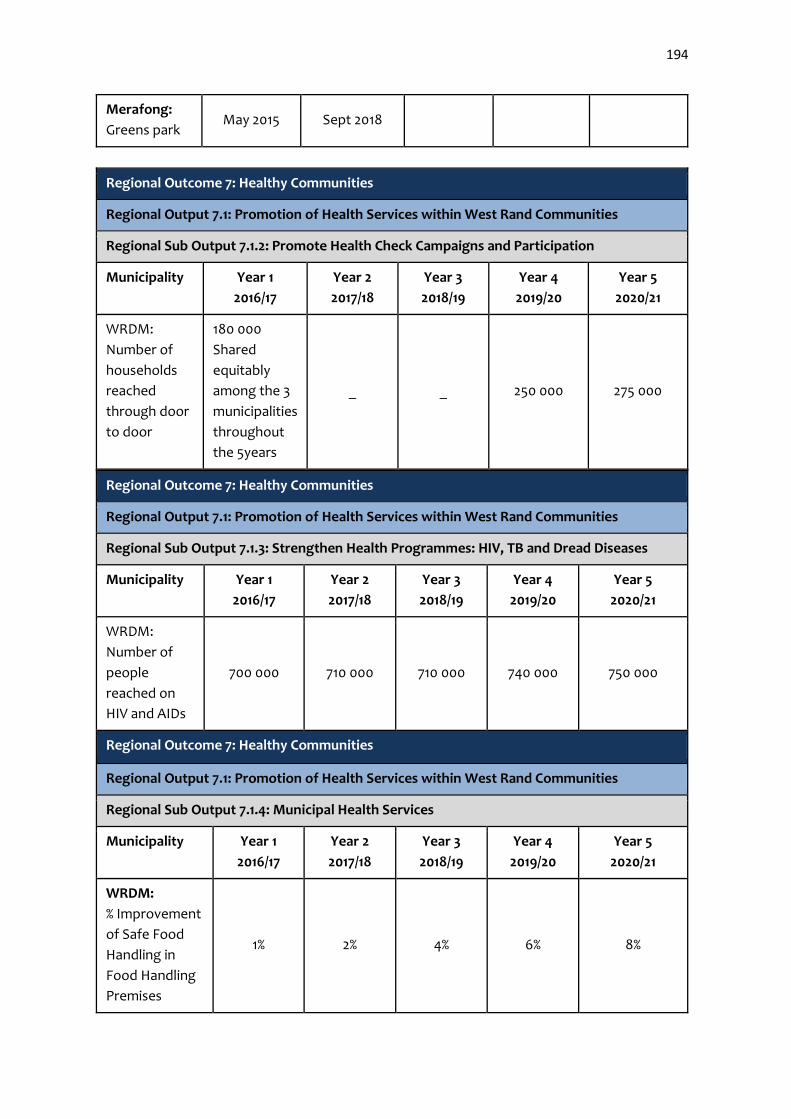
194
Merafong:
Greens park May 2015 Sept 2018
Regional Outcome 7: Healthy Communities
Regional Output 7.1: Promotion of Health Services within West Rand Communities
Regional Sub Output 7.1.3: Strengthen Health Programmes: HIV, TB and Dread Diseases
Municipality Year 1
2016/17
Year 2
2017/18
Year 3
2018/19
Year 4
2019/20
Year 5
2020/21
WRDM:
Number of
people
reached on
HIV and AIDs
700 000 710 000 710 000 740 000 750 000
Regional Outcome 7: Healthy Communities
Regional Output 7.1: Promotion of Health Services within West Rand Communities
Regional Sub Output 7.1.4: Municipal Health Services
Municipality Year 1
2016/17
Year 2
2017/18
Year 3
2018/19
Year 4
2019/20
Year 5
2020/21
WRDM:
% Improvement
of Safe Food
Handling in
Food Handling
Premises
1% 2% 4% 6% 8%
Regional Outcome 7: Healthy Communities
Regional Output 7.1: Promotion of Health Services within West Rand Communities
Regional Sub Output 7.1.2: Promote Health Check Campaigns and Participation
Municipality Year 1
2016/17
Year 2
2017/18
Year 3
2018/19
Year 4
2019/20
Year 5
2020/21
WRDM:
Number of
households
reached
through door
to door
180 000
Shared
equitably
among the 3
municipalities
throughout
the 5years
_ _ 250 000 275 000

195
WRDM:
% Improvement
in Safety of
Government
and Private
Sector
Institution
- 2% 4% 6% 8%
WRDM:
Number of
Water Samples
taken for
Analysis to
ensure
compliance to
SANS 249
600 600 600 600 600
WRDM:
Number of
Environmental
Promotion and
Community
empowerment
programmes
(sessions )
228 228 288 288 300
WRDM:
Number of
Food samples
taken for
Analysis
240 240 240 240 240
WRDM:
Number of
Health
Inspections
conducted at
Food Premises
4000 4000 4000 4000 4000
WRDM:
% Progress on
the
Implementation
of
Environmental
5% 30% 60% 90% 100%

196
Health, Hygiene
and Pest
Control
Strategy
Regional Outcome 10: Socially Cohesive Communities
Regional Output 10.1: Establish a Socially Cohesive West Rand Community
Regional Sub Output 10.1.1: Implement Social Cohesion Initiatives / Programme
Municipality Year 1
2016/17
Year 2
2017/18
Year 3
2018/19
Year 4
2019/20
Year 5
2020/21
MOGALE:
Number of Sports,
Arts and Culture
events organised
4 6 6 6 6
RANDWEST:
Number of Sports,
Arts and Culture
events organised
2 4 4 4 4
MERAFONG:
Number of Sports,
Arts and Culture
events organised
1 2 2 2 2
Regional Outcome 10: Socially Cohesive Communities
Regional Output 10.1: Establish a Socially Cohesive West Rand Community
Regional Sub Output 10.1.2: Establish Shared Community Centres & promotion of Social
Cohesion
Municipality Year 1
2016/17
Year 2
2017/18
Year 3
2018/19
Year 4
2019/20
Year 5
2020/21
Mogale CLM
Parks
Others
July 2016
June 2017
Finish June
2019 _ _
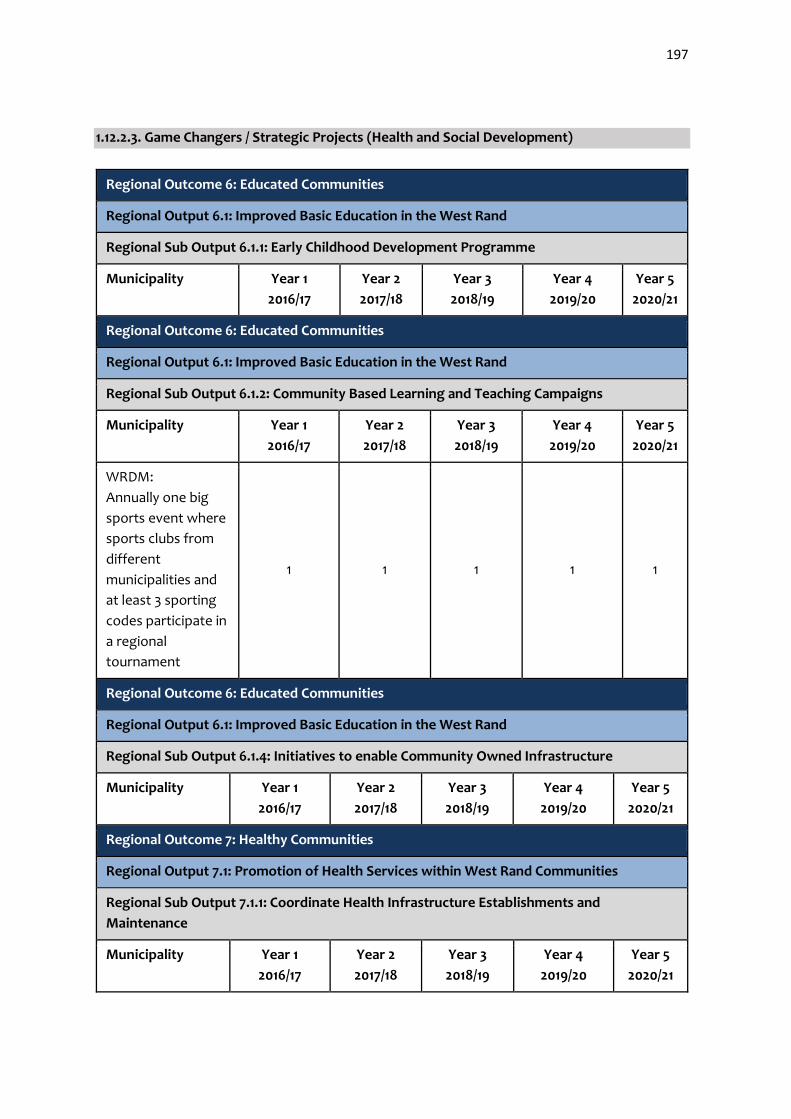
197
1.12.2.3. Game Changers / Strategic Projects (Health and Social Development)
Regional Outcome 6: Educated Communities
Regional Output 6.1: Improved Basic Education in the West Rand
Regional Sub Output 6.1.1: Early Childhood Development Programme
Municipality Year 1
2016/17
Year 2
2017/18
Year 3
2018/19
Year 4
2019/20
Year 5
2020/21
Regional Outcome 6: Educated Communities
Regional Output 6.1: Improved Basic Education in the West Rand
Regional Sub Output 6.1.2: Community Based Learning and Teaching Campaigns
Municipality Year 1
2016/17
Year 2
2017/18
Year 3
2018/19
Year 4
2019/20
Year 5
2020/21
WRDM:
Annually one big
sports event where
sports clubs from
different
municipalities and
at least 3 sporting
codes participate in
a regional
tournament
1 1 1 1 1
Regional Outcome 6: Educated Communities
Regional Output 6.1: Improved Basic Education in the West Rand
Regional Sub Output 6.1.4: Initiatives to enable Community Owned Infrastructure
Municipality Year 1
2016/17
Year 2
2017/18
Year 3
2018/19
Year 4
2019/20
Year 5
2020/21
Regional Outcome 7: Healthy Communities
Regional Output 7.1: Promotion of Health Services within West Rand Communities
Regional Sub Output 7.1.1: Coordinate Health Infrastructure Establishments and
Maintenance
Municipality Year 1
2016/17
Year 2
2017/18
Year 3
2018/19
Year 4
2019/20
Year 5
2020/21

198
Regional Outcome 7: Healthy Communities
Regional Output 7.1: Promotion of Health Services within West Rand Communities
Regional Sub Output 7.1.2: Promote Health Check Campaigns and Participation
Municipality Year 1
2016/17
Year 2
2017/18
Year 3
2018/19
Year 4
2019/20
Year 5
2020/21
Regional Outcome 7: Healthy Communities
Regional Output 7.1: Promotion of Health Services within West Rand Communities
Regional Sub Output 7.1.3: Strengthen Health Programmes: HIV, TB and Dread Disease
Municipality Year 1
2016/17
Year 2
2017/18
Year 3
2018/19
Year 4
2019/20
Year 5
2020/21
WRDM
NB: Increase of grant funding for parity in stipend MOGALE
RAND WEST
MERAFONG
Regional Outcome 7: Healthy Communities
Regional Output 7.1: Promotion of Health Services within West Rand Communities
Regional Sub Output 7.1.4: Municipal Health Services
Municipality Year 1
2016/17
Year 2
2017/18
Year 3
2018/19
Year 4
2019/20
Year 5
2020/21
WRDM:
Staffing according
to SANS _
Conduct
Section 78
assessment
done _
50%
increase of
level of
staffing
80%
increase
of staffing
to meet
services
demand
Regional Outcome 10: Socially Cohesive Communities
Regional Output 10.1: Establish a Socially Cohesive West Rand Community
Regional Sub Output 10.1.1: Implement Social Cohesion Initiatives / Programmes
Municipality Year 1
2016/17
Year 2
2017/18
Year 3
2018/19
Year 4
2019/20
Year 5
2020/21

199
Regional Outcome 10: Socially Cohesive Communities
Regional Output 10.1: Establish a Socially Cohesive West Rand Community
Regional Sub Output 10.1.2: Establish Shared Community Centres & Promotion of Social
Cohesion
Municipality Year 1
2016/17
Year 2
2017/18
Year 3
2018/19
Year 4
2019/20
Year 5
2020/21
WRDM Completion of all the funded projects as scheduled
1.12.2.4. Key Risks & Challenges (Health and Social Development)
Regional Outcome 6: Educated Communities
Regional Output 6.1: Improved Basic Education in the West Rand
Regional Sub Output 6.1.1: Early Childhood Development Programmes
Municipality Key Risks and Challenges
WRDM Shortage of EHPs that compromise frequency of inspections
and training on legislative prescripts;
Financial constraints to support the ECDCs
Mogale Financial constrains to support ECDC programmes and training
Randwest Financial constraints to appoint social workers
Merafong No social workers or assistance not in municipal structure
Regional Outcome 6: Educated Communities
Regional Output 6.1: Improved Basic Education in the West Rand
Regional Sub Output 6.1.2: Community Based Learning and Teaching Campaigns
Municipality Key Risks and Challenges
WRDM Financial constraints,
Capacity of the existing federations,
Absence of Federations in some municipalities
The different tariffs for use of municipal sports grounds by
different clubs
The distance from home to sports grounds for training.
Children are exposed to risks after school due to lack of
supervision hence the need for aftercare.

200
Regional Outcome 6: Educated Communities
Regional Output 6.1: Improved Basic Education in the West Rand
Regional Sub Output 6.1.3: Resourced Learning Centres (Libraries)
Municipality Key Risks and Challenges
WRDM Stealing of network cables
Regional Outcome 6: Educated Communities
Regional Output 6.1: Improved Basic Education in the West Rand
Regional Sub Output 6.1.4: Initiatives to enable Community Owned Infrastructure
Municipality Key Risks and Challenges
WRDM The delay in establishing management structures due to conflict
among ECDCs managers as to who is going to be the head of that
new institution, financial management etc.
All Municipalities Operational inefficiencies as a result of disputed ownership
between municipalities and DSD province regarding completed
facilities.
Social Services has no control of maintenance plan as the
budget within Infrastructure Services remains
Regional Outcome 7: Healthy Communities
Regional Output 7.1: Promotion of Health Services within West Rand Communities
Regional Sub Output 7.1.1: Coordinate Health Infrastructure Establishment and
Maintenance
Municipality Key Risks and Challenges
WRDM Delayed payments of contractors by government departments
Regional Outcome 7: Healthy Communities
Regional Output 7.1: Promotion of Health Services within West Rand Communities
Regional Sub Output 7.1.2: Promote Health Check Campaigns and Participation
Municipality Key Risks and Challenges
WRDM Different stipend to those paid by province
Community Health Care workers‘expectation to be absorbed as
permanent employees across all municipalities.
Province should advocate same stipends and provide grant
funding

201
Regional Outcome 7: Healthy Communities
Regional Output 7.1: Promotion of Health Services within West Rand Communities
Regional Sub Output 7.1.3: Strengthen Health Programmes: HIV, TB and Dread Diseases
Municipality Key Risks and Challenges
WRDM Substance abuse that affect thinking straight thus not protecting
themselves
Safety of the volunteers during door to door campaigns
Burden on health system leading to budget constraints.
Requires sufficient budgeting from province
Regional Outcome 7: Healthy Communities
Regional Output 7.1: Promotion of Health Services within West Rand Communities
Regional Sub Output 7.1.4: Municipal Health Services
Municipality Key Risks and Challenges
WRDM Non-compliance to SANS by institutions
Staff shortage to provide the level of services required.
Regional Outcome 10: Socially Cohesive Communities
Regional Output 10.1: Establish a Socially Cohesive West Rand Community
Regional Sub Output 10.1.1: Implement Social Cohesion
Municipality Key Risks and Challenges
WRDM and its
constituent
municipalities
Insufficient to none funding of all sports, art, culture, and
heritage programmes by all municipalities
Insufficient funding.
Poor maintenance of facilities for activities.
Community demand for utilization of facilities.
Regional Outcome 10: Socially Cohesive Communities
Regional Output 10.1: Establish a Socially Cohesive West Rand Community
Regional Sub Output 10.1.2: Establish Shared Community Centres & Promotion of Social
Cohesion
Municipality Key Risks and Challenges

202
WRDM and its
constituent
municipalities
Insufficient to none funding of all sports, art, culture, and
heritage programmes by all municipalities
Sustainability of the Heritage event due to non-contribution by
all municipalities
Insufficient funding
Poor maintenance of facilities for activities
Community demand for utilization of facilities
1.12.2.5. General Comments / Requests (Health and Social Development)
Outcome 6: Educated Communities
Output 6.1: Improved Basic Education in the West Rand
Sub Output 6.1.1: Early Childhood Development Programmes
Municipality General Comments/ Requests
WRDM Request for conducting the section 78 (MSA) assessment of MHS
and other services to inform budgets
Rand West City and Mogale City to be engaged on secondment of
their social workers to serve other areas of need
Review and increase of social workers be treated with urgency.
The current social work capacity in Mogale City is not adequate to
serve its own area. Therefore priority should be to ensure
employment of more social workers to serve the West Rand.
Outcome 6: Educated Communities
Output 6.1: Improved Basic Education in the West Rand
Sub Output 6.1.2: Community Based Learning and Teaching Campaigns
Municipality General Comments/ Requests
WRDM Allocation of budget for supporting clubs with training
(administration of a clubs) and for tournaments
Financial assistance if a club does well and has to travel outside the
province or country.
All municipalities support by allocating budget for aftercare
programmes for development and safety of children and young
people.
Increase budget provision for bursaries by all municipalities.
Establishment and sustainable support to community based reading
clubs

203
Outcome 6: Educated Communities
Output 6.1: Improved Basic Education in the West Rand
Sub Output 6.1.3: Resourced Learning Centres (Libraries)
Municipality General Comments/ Requests
WRDM Submission of business plan to Department of Sports, Arts, Culture
and Recreation for extension of the networks for Broadband by
WRDM;
Request 100% funding for library services.
Continued support from Department of Sports; Arts; Culture and
recreation for Library infrastructure and books for all constituent
municipality.
Finalisation of Assignment of Library & Information Services
Outcome 6: Educated Communities
Output 6.1: Improved Basic Education in the West Rand
Sub Output 6.1.4: Initiatives to enable Community Owned Infrastructure
Municipality General Comments/ Requests
WRDM The protection of those facilities by communities
Outcome 7: Healthy Communities
Output 7.1: Promotion of Health Services within West Rand Communities
Sub Output 7.1.1: Coordinate Health Infrastructure Establishments and Maintenance
Municipality General Comments/ Requests
WRDM Department of Health provides updates of all construction phases of all
clinics and maintenance planned quarterly during the District Health
Council meetings
All Municipalities Primary Healthcare has been provincialized however the buildings still
belong to municipalities. It has been a challenge since 2010 for all
municipalities to get the department of Health to sign lease or transfer
agreements on the utilization of clinics.

204
Outcome 7: Healthy Communities
Output 7.1: Promotion of Health Services within West Rand Communities
Sub Output 7.1.2: Promote Health Check Campaigns and Participation
Municipality General Comments/ Requests
WRDM The District Health Council uses its powers to advocate for the same
stipend across the province
Outcome 7: Healthy Communities
Output 7.1: Promotion of Health Services within West Rand Communities
Sub Output 7.1.3: Strengthen Health Programmes: HIV, TB and Dread Diseases
Municipality General Comments/ Requests
WRDM HIV, TB, send other dreaded diseases is everybody’s business
Increase of volunteers stipend to sustain community empowerment
on all health issues
Outcome 7: Healthy Communities
Output 7.1: Promotion of Health Services within West Rand Communities
Sub Output 7.1.4: Municipal Health Services
Municipality General Comments/ Requests
WRDM Appointment of a service provider to conduct the Section 78
assessment of services for budgeting purposes
Outcome 10: Socially Cohesive Communities
Output 10.1: Establish a Socially Cohesive West Rand Community
Sub Output 10.1.1: Implement Social Cohesion Initiatives / Programmes
Municipality General Comments/ Requests
WRDM and its
constituent
municipalities
Request that all municipalities supports financially all sports, art,
culture and heritage programmes.
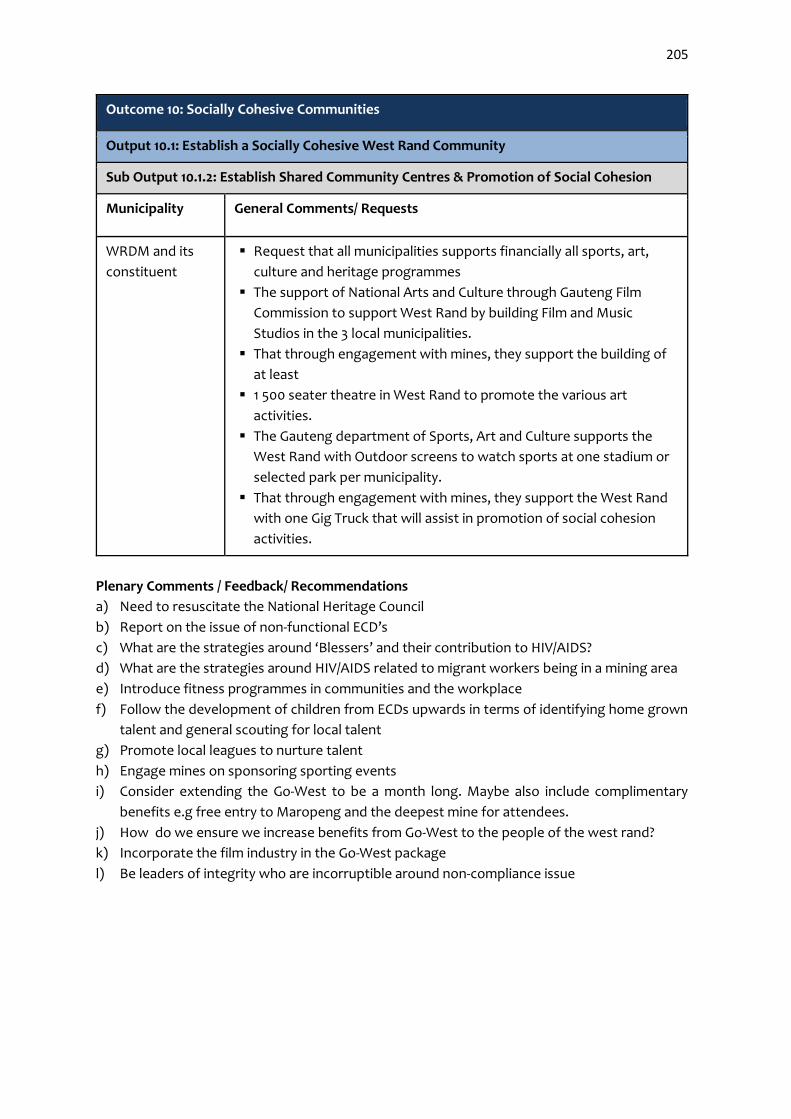
205
Outcome 10: Socially Cohesive Communities
Output 10.1: Establish a Socially Cohesive West Rand Community
Sub Output 10.1.2: Establish Shared Community Centres & Promotion of Social Cohesion
Municipality General Comments/ Requests
WRDM and its
constituent
Request that all municipalities supports financially all sports, art,
culture and heritage programmes
The support of National Arts and Culture through Gauteng Film
Commission to support West Rand by building Film and Music
Studios in the 3 local municipalities.
That through engagement with mines, they support the building of
at least
1 500 seater theatre in West Rand to promote the various art
activities.
The Gauteng department of Sports, Art and Culture supports the
West Rand with Outdoor screens to watch sports at one stadium or
selected park per municipality.
That through engagement with mines, they support the West Rand
with one Gig Truck that will assist in promotion of social cohesion
activities.
Plenary Comments / Feedback/ Recommendations
a) Need to resuscitate the National Heritage Council
b) Report on the issue of non-functional ECD’s
c) What are the strategies around ‘Blessers’ and their contribution to HIV/AIDS?
d) What are the strategies around HIV/AIDS related to migrant workers being in a mining area
e) Introduce fitness programmes in communities and the workplace
f) Follow the development of children from ECDs upwards in terms of identifying home grown
talent and general scouting for local talent
g) Promote local leagues to nurture talent
h) Engage mines on sponsoring sporting events
i) Consider extending the Go-West to be a month long. Maybe also include complimentary
benefits e.g free entry to Maropeng and the deepest mine for attendees.
j) How do we ensure we increase benefits from Go-West to the people of the west rand?
k) Incorporate the film industry in the Go-West package
l) Be leaders of integrity who are incorruptible around non-compliance issue

206
1.13. Environment Management Commission (Development Strategy – Environmental
Management)
The Environment Management Commission focussed on the following Regional Outcomes,
Outputs and Sub-Outputs. Below are the outputs as received from the Commission.
Regional Outcome 1: Basic Service Delivery Improvement
o Regional Output 1.6: Embed Green IQ Strategic Blueprint
Regional Sub Output 1.6.1: Develop and Implement Climate Change Strategy
Regional Outcome 8: Sustainable Environment
o Regional Output 8.1: Embed Green IQ Strategic Blueprint
Regional Sub Output 8.1.1: Develop and Implement Climate Change Strategy
Regional Sub Output 8.1.2: Build Capability to Manage Climate Change
Disasters
Regional Sub Output 8.1.3: Develop and Implement Innovative Technologies
and Renewable Energy Sources
Regional Sub Output 8.1.4: Air Quality and Environmental Compliance
Regional Sub Output 8.1.5: Open Space Management
.13.1. Service Delivery Backlog (Environmental Management)
Regional Outcome 1: Basic Service Delivery Improvement
Regional Output 1.6: Provision of Quality and Reliable Sanitation and Waste Management
Regional Sub Output 1.6.1: Waste Management
MUNI. CURRENT
STATUS QUO
CURRENT GAPS ESTIMATED
BUDGET
COMMENTS
Merafong
30 514 Households in
the Formal areas
have access to
weekly kerbside
waste collection
±2 138
households
(New
Developments)
R3m is required
for acquisition
of Wheelie bins.
Wheelie Bins should
be purchased.
18 000 Households in
the Informal areas
have no access to
waste collection.
Waste Collection
Strategy for the
Informal Areas has
been developed and
approved by Council.
Strategy not
implemented
due to lack of
funding.
Insufficient
funds for
trucks & landfill
compactors
R35m for
implementation
of the Strategy
for a three year
period.
Target/measure as
set in the National
Waste Management
Strategy couldn’t be
achieved.
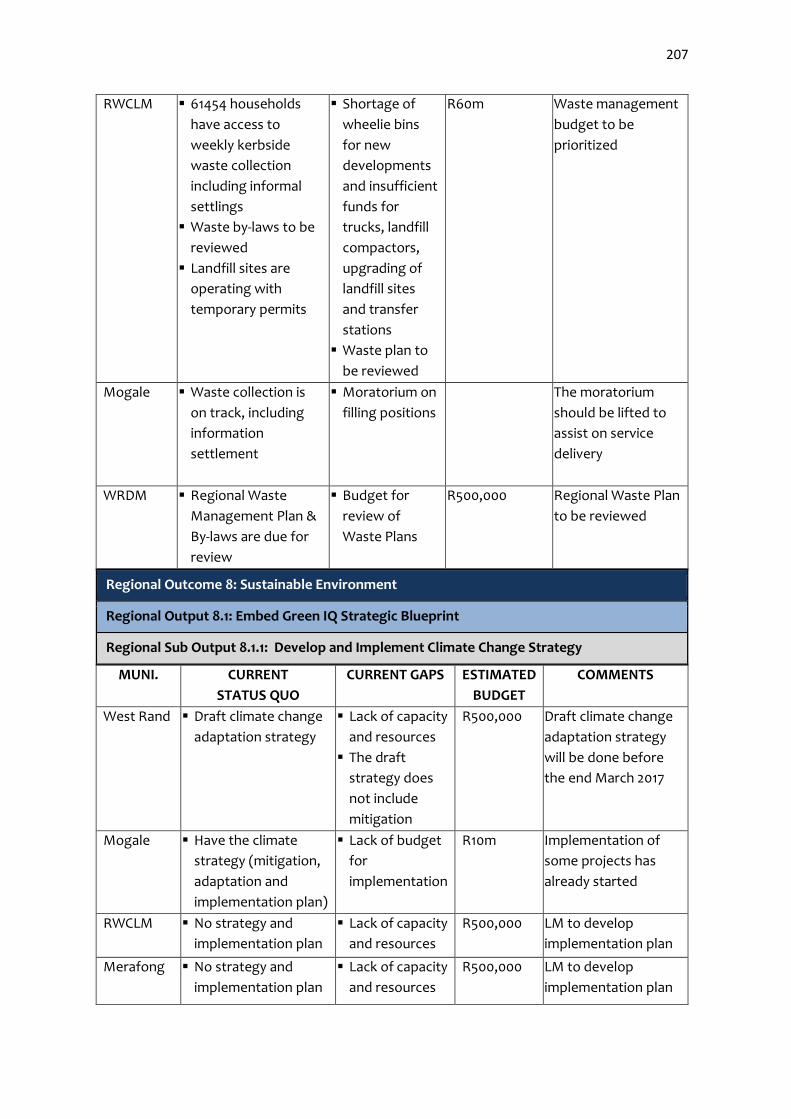
207
RWCLM 61454 households
have access to
weekly kerbside
waste collection
including informal
settlings
Waste by-laws to be
reviewed
Landfill sites are
operating with
temporary permits
Shortage of
wheelie bins
for new
developments
and insufficient
funds for
trucks, landfill
compactors,
upgrading of
landfill sites
and transfer
stations
Waste plan to
be reviewed
R60m Waste management
budget to be
prioritized
Mogale
Waste collection is
on track, including
information
settlement
Moratorium on
filling positions
The moratorium
should be lifted to
assist on service
delivery
WRDM Regional Waste
Management Plan &
By-laws are due for
review
Budget for
review of
Waste Plans
R500,000 Regional Waste Plan
to be reviewed
Regional Outcome 8: Sustainable Environment
Regional Output 8.1: Embed Green IQ Strategic Blueprint
Regional Sub Output 8.1.1: Develop and Implement Climate Change Strategy
MUNI. CURRENT
STATUS QUO
CURRENT GAPS ESTIMATED
BUDGET
COMMENTS
West Rand Draft climate change
adaptation strategy
Lack of capacity
and resources
The draft
strategy does
not include
mitigation
R500,000 Draft climate change
adaptation strategy
will be done before
the end March 2017
Mogale Have the climate
strategy (mitigation,
adaptation and
implementation plan)
Lack of budget
for
implementation
R10m Implementation of
some projects has
already started
RWCLM No strategy and
implementation plan
Lack of capacity
and resources
R500,000 LM to develop
implementation plan
Merafong No strategy and
implementation plan
Lack of capacity
and resources
R500,000 LM to develop
implementation plan
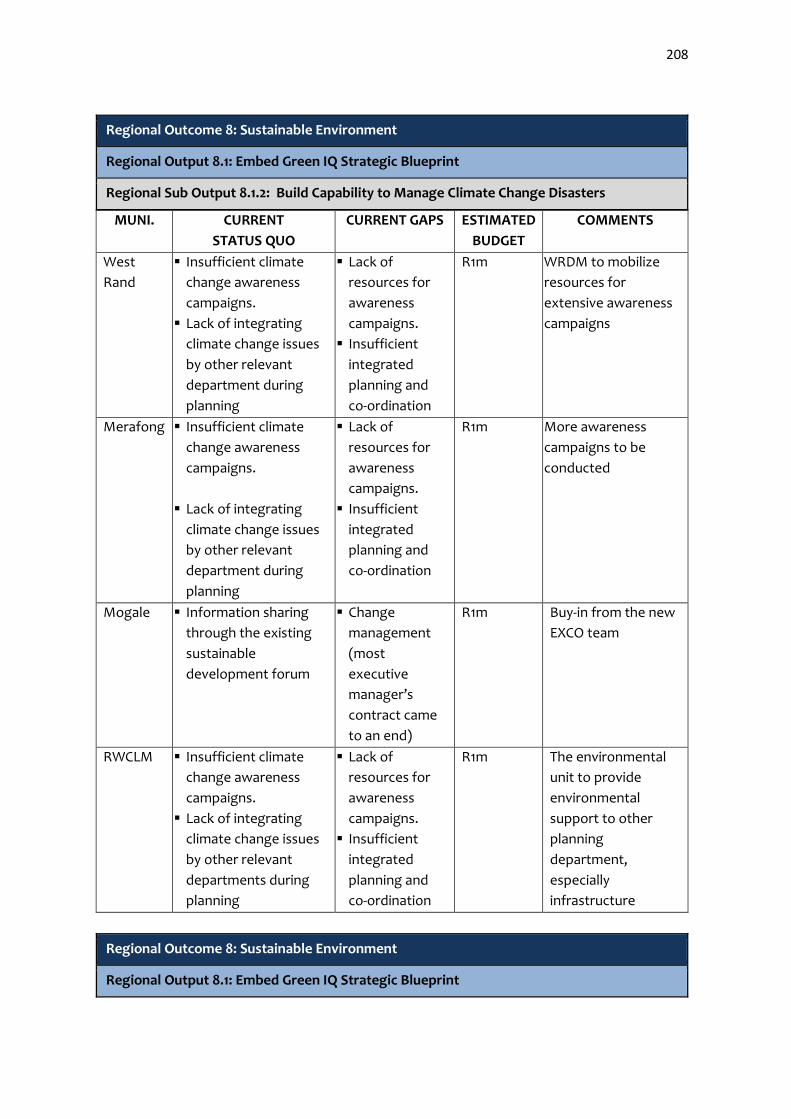
208
Regional Outcome 8: Sustainable Environment
Regional Output 8.1: Embed Green IQ Strategic Blueprint
Regional Sub Output 8.1.2: Build Capability to Manage Climate Change Disasters
MUNI. CURRENT
STATUS QUO
CURRENT GAPS ESTIMATED
BUDGET
COMMENTS
West
Rand
Insufficient climate
change awareness
campaigns.
Lack of integrating
climate change issues
by other relevant
department during
planning
Lack of
resources for
awareness
campaigns.
Insufficient
integrated
planning and
co-ordination
R1m WRDM to mobilize
resources for
extensive awareness
campaigns
Merafong Insufficient climate
change awareness
campaigns.
Lack of integrating
climate change issues
by other relevant
department during
planning
Lack of
resources for
awareness
campaigns.
Insufficient
integrated
planning and
co-ordination
R1m More awareness
campaigns to be
conducted
Mogale Information sharing
through the existing
sustainable
development forum
Change
management
(most
executive
manager’s
contract came
to an end)
R1m Buy-in from the new
EXCO team
RWCLM Insufficient climate
change awareness
campaigns.
Lack of integrating
climate change issues
by other relevant
departments during
planning
Lack of
resources for
awareness
campaigns.
Insufficient
integrated
planning and
co-ordination
R1m The environmental
unit to provide
environmental
support to other
planning
department,
especially
infrastructure
Regional Outcome 8: Sustainable Environment
Regional Output 8.1: Embed Green IQ Strategic Blueprint

209
MUNI. CURRENT STATUS
QUO
CURRENT GAPS ESTIMATED
BUDGET
COMMENTS
WRDM Green IQ Strategy in
place
Lack of
capacity and
resources
R1m
Projects from the
Green IQ Strategy
should be identified
for implementation
Mogale Implementation of
some waste to energy
projects (Biogas) has
commenced
Delay in
obtaining
permits/
authorisations
R10m Implementation of
some projects has
already started
RWCLM Waste to energy
projects (Biogas) at
Waste Water
Treatment Plant
through GIFA is
planned for 2018/19
financial year
Lack of
capacity and
resources
Delay in
obtaining
permits/
authorisations
R20m Finalization of these
projects should be
prioritised
Merafong Solar park through
GIFA is planned for
2018/19 financial year
Lack of
capacity and
resources
R10m Finalization of these
projects should be
prioritized
Regional Outcome 8: Sustainable Environment
Regional Output 8.1: Embed Green IQ Strategic Blueprint
Regional Sub Output 8.1.4: Air Quality and Environmental Compliance
MUNI. CURRENT
STATUS QUO
CURRENT GAPS ESTIMATED
BUDGET
COMMENTS
WRDM Air Quality
Management Plan
(AQMP) & By-laws
should be reviewed
Air Quality Stations
are operational
Inspection of facilities
for compliance
Issuing of
Atmospheric Emission
Licences
Regional Bioregional
& Gauteng EMF to be
implemented
Outdated
AQPM & By-
laws
Vehicle
emissions are
not monitored
R800,000 Mobile air quality
station will be
needed for remote
areas
Regional Sub Output 8.1.3: Develop and Implement Innovative Technologies and
Renewable Energy Sources

210
Mogale Inspection of facilities
for compliance
Air Quality Stations
are operational
No AQMP
Vehicle
emissions are
not monitored
Regional Air
Quality By-laws
not adopted
R150,000 Measuring device for
vehicle emissions will
be needed
RWCLM Inspection of facilities
for compliance
Air Quality Stations
are operational
No AQMP
Vehicle
emissions are
not monitored
Regional Air
Quality By-laws
not adopted
R150,000 Measuring device for
vehicle emissions will
be needed
Merafong Inspection of facilities
for compliance
No AQMP
Permanent Air Quality
Monitoring station
not needed based on
the assessment
conducted
Vehicle
emissions are
not monitored
Regional Air
Quality By-laws
not adopted
R300,000 Measuring device for
vehicle emissions will
be needed
Mobile Air Quality
monitoring station
will be needed
Regional Outcome 8: Sustainable Environment
Regional Output 8.1: Embed Green IQ Strategic Blueprint
Regional Sub Output 8.1.5: Open Space Management
MUNI. CURRENT
STATUS QUO
CURRENT GAPS ESTIMATED
BUDGET
COMMENTS
Mogale Parks development,
grass cutting, tree
planting & cemeteries
management
None R25m Vandalism by
communities is an
issue
Merafong Parks development,
grass cutting, tree
planting & cemeteries
management
Resources &
budget
R1m Vandalism by
communities is an
issue
RWCLM Parks development,
grass cutting, tree
planting & cemeteries
management
Resources &
budget
R1m Vandalism by
communities is an
issue
WRDM Tree planting & parks
developments
Resources &
budget
R20m To mobilise resources
for parks
development

211
1.13.2. Target/measures to be achieved over the next 5 years (Environmental Management)
Regional Outcome 1: Basic Service Delivery Improvement
Regional Output 1.6: Provision of Quality and Reliable Sanitation and Waste Management
Regional Sub Output 1.6.1: Waste Management
MUNI. Year 1
2016/17
Year 2
2017/18
Year 3
2018/19
Year 4
2019/20
Year 5
2020/21
WRD
M
• Eradication
of illegal
dumping
and
installation
of signage
boards
• Review
Regional
Waste
Management
Plan & By-
laws
• By-Laws
Gazetted
and fine
schedule
approved
by all
magistrates
• Implementation
of the Waste
Management
plan and
• enforcement of
the by-laws
• Implementation
of the Waste
Management
plan and
enforcement of
the by-laws
• Waste recycling
bins
• Implementation
of the Waste
Management
plan and
enforcement of
the by-laws
• Waste recycling
bins
RWCLM • Upgrading of
landfill sites
• Procurement
of wheelie
bins
• Completion of
Mohlakeng
buyback
centre
• Application
for landfill
licence for
Libanon
• Development
of Waste
Management
plan
• Upgrading of
landfill sites
• Procurement
of wheelie
bins
• Extension of
waste
collection to
unserviced
areas
• Application
for landfill
licence for
Uitvalfontein
• Upgrading of
landfill sites
• Procurement
of storage
bins (wheelie,
skip & roller
bins)
• Construction
of waste
transfer
stations &
drop off
centres
• Procurement
of wheelie
bins
• Construction
of waste
transfer
stations
• Procurement
of wheelie
bins
• Construction
of waste
transfer
stations
Merafong • Waste
collection
• Upgrading
and landfill
• Construction
of waste
transfer
• Extension of
waste
collection to
• Extension of
waste
collection to
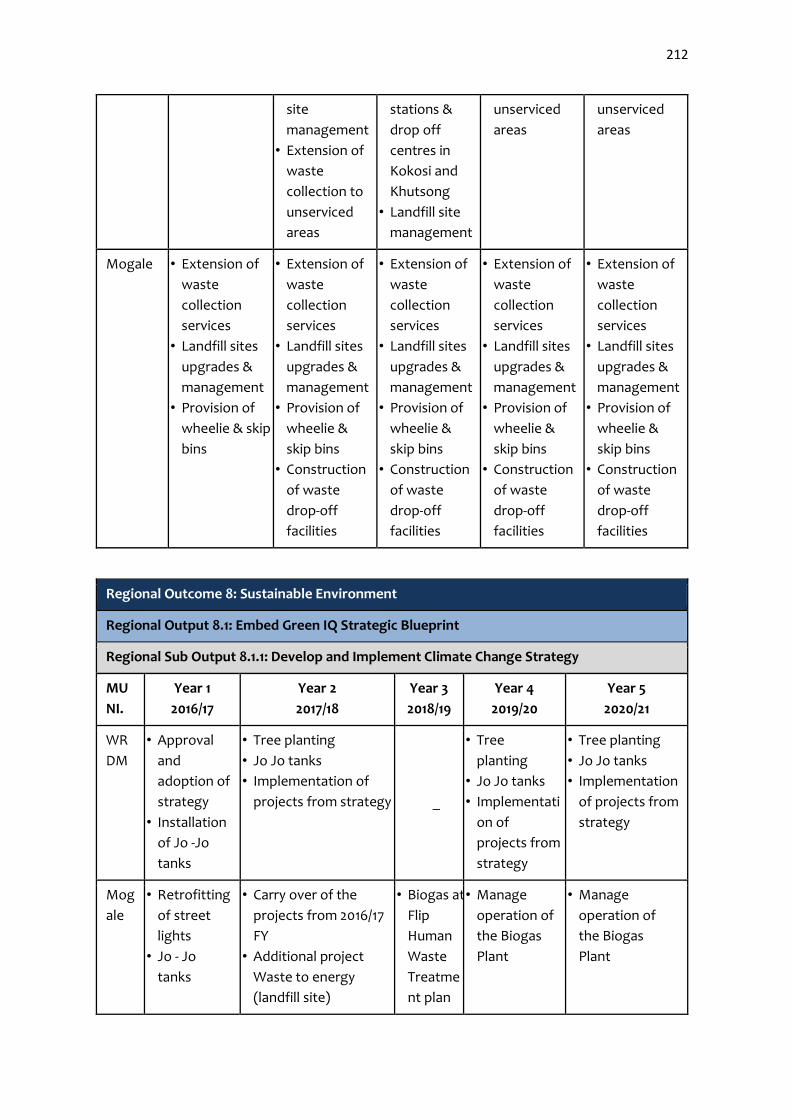
212
site
management
• Extension of
waste
collection to
unserviced
areas
stations &
drop off
centres in
Kokosi and
Khutsong
• Landfill site
management
unserviced
areas
unserviced
areas
Mogale • Extension of
waste
collection
services
• Landfill sites
upgrades &
management
• Provision of
wheelie & skip
bins
• Extension of
waste
collection
services
• Landfill sites
upgrades &
management
• Provision of
wheelie &
skip bins
• Construction
of waste
drop-off
facilities
• Extension of
waste
collection
services
• Landfill sites
upgrades &
management
• Provision of
wheelie &
skip bins
• Construction
of waste
drop-off
facilities
• Extension of
waste
collection
services
• Landfill sites
upgrades &
management
• Provision of
wheelie &
skip bins
• Construction
of waste
drop-off
facilities
• Extension of
waste
collection
services
• Landfill sites
upgrades &
management
• Provision of
wheelie &
skip bins
• Construction
of waste
drop-off
facilities
Regional Outcome 8: Sustainable Environment
Regional Output 8.1: Embed Green IQ Strategic Blueprint
Regional Sub Output 8.1.1: Develop and Implement Climate Change Strategy
MU
NI.
Year 1
2016/17
Year 2
2017/18
Year 3
2018/19
Year 4
2019/20
Year 5
2020/21
WR
DM
• Approval
and
adoption of
strategy
• Installation
of Jo -Jo
tanks
• Tree planting
• Jo Jo tanks
• Implementation of
projects from strategy _
• Tree
planting
• Jo Jo tanks
• Implementati
on of
projects from
strategy
• Tree planting
• Jo Jo tanks
• Implementation
of projects from
strategy
Mog
ale
• Retrofitting
of street
lights
• Jo - Jo
tanks
• Carry over of the
projects from 2016/17
FY
• Additional project
Waste to energy
(landfill site)
• Biogas at
Flip
Human
Waste
Treatme
nt plan
• Manage
operation of
the Biogas
Plant
• Manage
operation of
the Biogas
Plant

213
• Tree
planting
RW
CLM
• Tree
planting
• Jo - Jo
tanks
• Rehabilitati
on of
wetlands
• Completion
of buy back
centre and
bird
sanctuary
• Waste
recycling
facility at
Libanon
landfill site
• Develop and adopt
implementation plan.
• Implementation of
projects from the
Climate Change
strategy
• Obtain
all
authoris
ation/
permits
for the
Biogas
Plan at
Waste
Water
Treatme
nt Plan
• Biogas at
Randfontein
Waste
treatment
plant
• Manage
operation of
the Biogas
plant
Mer
afon
g
• Tree
planting
• Waste
recycling in
Fochville
• Merafong
waste
recycling
project
• Develop and adopt
implementation plan.
• Implementation of
projects from the
strategy
• Waste recycling in
Fochville
• Waste
recycli
ng in
Fochvil
le
• Merafong
solar farm
clusters
• Merafong
Bio- energy
park
• Waste
recycling in
Fochville
• Waste recycling
in Fochville
Regional Outcome 8: Sustainable Environment
Regional Output 8.1: Embed Green IQ Strategic Blueprint
Regional Sub Output 8.1.2: Build Capability to Manage Climate Change Disasters
MUNI. Year 1
2016/17
Year 2
2017/18
Year 3
2018/19
Year 4
2019/20
Year 5
2020/2
1
WRDM • Co-ordinate
and support
the rolling
out of
climate
change
• Co-ordinate
and support
the rolling out
of climate
change
campaigns to
• Co-
ordinate
and
support
the rolling
out of
• Co-ordinate and
support the
rolling out of
climate change
campaigns to all
municipalities.
• Co-
ordin
ate
and
suppo
rt the

214
campaigns
to all
municipalitie
s
• Support
infrastructur
e planning
Department
s on climate
change
issues.
all
municipalities.
• Support
infrastructure
planning
Departments
on climate
change issues.
climate
change
campaign
s to all
municipali
ties.
• Support
infrastruc
ture
planning
Departme
nts on
climate
change
issues.
• Support
infrastructure
planning
Departments on
climate change
issues.
rolling
out of
climat
e
chang
e
camp
aigns
to all
munic
ipaliti
es.
• Supp
ort
infras
tructu
re
planni
ng on
climat
e
chang
e
issues
.
Mogale • Rolling out of
climate
change
campaigns to
all
municipalities
• Support
infrastructur
e planning
on climate
change
issues.
• Rolling out of
climate
change
campaigns to
all
municipalities.
• Support
infrastructure
planning on
climate
change issues.
• Rolling
out of
climate
change
campaign
s to all
municipali
ties.
• Support
infrastruc
ture
planning
on
climate
change
issues.
• Rolling out of
climate change
campaigns to all
municipalities.
• Support
infrastructure
planning on
climate change
issues.
• Rollin
g out
of
climat
e
chang
e
camp
aigns
to all
munic
ipaliti
es.
• Supp
ort
infras
tructu
re
planni

215
ng on
climat
e
chang
e
issues
.
RWCLM • Rolling out of
climate
change
campaigns to
all
municipalities
.
• Support
infrastructure
planning on
climate
change
issues.
• Rolling out of
climate change
campaigns to
all
municipalities.
• Support
infrastructure
planning on
climate change
issues.
• Rolling out
of climate
change
campaigns
to all
municipalit
ies.
• Support
infrastruct
ure
planning
on climate
change
issues.
• Rolling out of
climate change
campaigns to all
municipalities.
• Support
infrastructure
planning on
climate change
issues.
• Rolling
out of
climate
change
campai
gns to
all
munici
palities
.
• Suppor
t
infrastr
ucture
planni
ng on
climate
change
issues.
Merafong • Rolling out of
climate
change
campaigns to
all
municipalities
.
• Support
infrastructure
planning on
climate
change
issues.
• Rolling out of
climate change
campaigns to
all
municipalities.
• Support
infrastructure
planning on
climate change
issues.
• Rolling out
of climate
change
campaigns
to all
municipalit
ies.
• Support
infrastruct
ure
planning
on climate
change
issues.
• Rolling out of
climate change
campaigns to all
municipalities.
• Support
infrastructure
planning on
climate change
issues.
• Rolling
out of
climate
change
campai
gns to
all
munici
palities
.
• Suppor
t
infrastr
ucture
planni
ng on
climate

216
change
issues.
Regional Outcome 8: Sustainable Environment
Regional Output 8.1: Embed Green IQ Strategic Blueprint
Regional Sub Output 8.1.3: Develop and Implement Innovative Technologies and
Renewable Energy Sources
MUNI. Year 1
2016/17
Year 2
2017/18
Year 3
2018/19
Year 4
2019/20
Year 5
2020/21
WRDM • Ensure
proper
coordinatio
n, support
and
reporting
• Ensure
proper
coordinat
ion,
support
and
reporting
• Ensure proper
coordination, support
and reporting
• Ensure
proper
coordinati
on,
support
and
reporting
• Ensure
proper
coordinati
on,
support
and
reporting
Mogale • Authorizatio
n process
for
implementa
tion to
Waste to
energy
• Authoriza
tion
process
for
impleme
ntation
to Waste
to energy
• Biogas at Flip Human
Waste Treatment plan
• Phase 1 of
• Waste to
energy
project(la
ndfill site)
• Phase 2 of
waste to
energy
project
(landfill
site)
RWCLM • Ensure
completion
of the
Mohlakeng
Buy Back
Centre
• Manage
ment of
the
Mohlake
ng Buy
Back
Centre
• Obtain
authorisations/permits
for Biogas Plant
• Biogas at
Randfonte
in Waste
treatment
plant
• Manage
implemen
tation of
the
Biogas
Plant
Merafong • Implementa
tion of
Merafong
Waste
Recycling
project
• Impleme
ntation
of
Merafon
g Waste
Recycling
project
• Implementation of
Merafong Waste
Recycling project
• Merafong
solar farm
clusters
• Merafong
Bio-
energy
park
• Implemen
tation of
Merafong
Waste
Recycling
project
Regional Outcome 8: Sustainable Environment
Regional Output 8.1: Embed Green IQ Strategic Blueprint
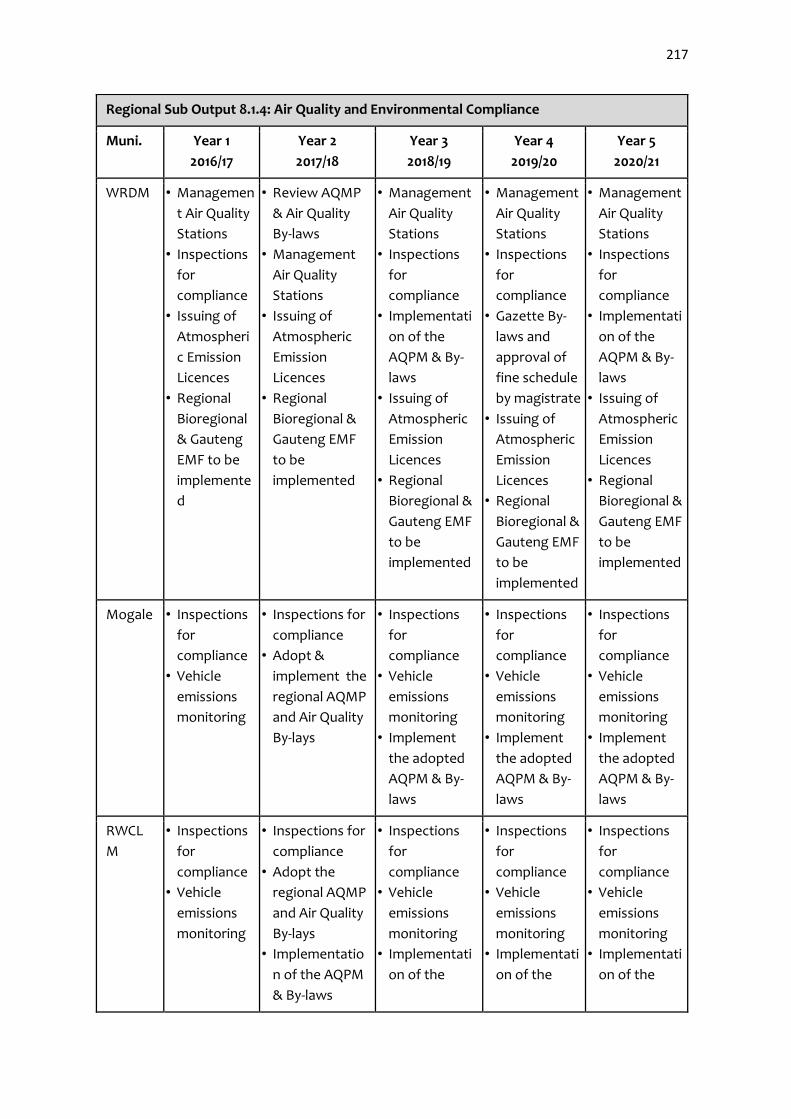
217
Regional Sub Output 8.1.4: Air Quality and Environmental Compliance
Muni. Year 1
2016/17
Year 2
2017/18
Year 3
2018/19
Year 4
2019/20
Year 5
2020/21
WRDM • Managemen
t Air Quality
Stations
• Inspections
for
compliance
• Issuing of
Atmospheri
c Emission
Licences
• Regional
Bioregional
& Gauteng
EMF to be
implemente
d
• Review AQMP
& Air Quality
By-laws
• Management
Air Quality
Stations
• Issuing of
Atmospheric
Emission
Licences
• Regional
Bioregional &
Gauteng EMF
to be
implemented
• Management
Air Quality
Stations
• Inspections
for
compliance
• Implementati
on of the
AQPM & By-
laws
• Issuing of
Atmospheric
Emission
Licences
• Regional
Bioregional &
Gauteng EMF
to be
implemented
• Management
Air Quality
Stations
• Inspections
for
compliance
• Gazette By-
laws and
approval of
fine schedule
by magistrate
• Issuing of
Atmospheric
Emission
Licences
• Regional
Bioregional &
Gauteng EMF
to be
implemented
• Management
Air Quality
Stations
• Inspections
for
compliance
• Implementati
on of the
AQPM & By-
laws
• Issuing of
Atmospheric
Emission
Licences
• Regional
Bioregional &
Gauteng EMF
to be
implemented
Mogale • Inspections
for
compliance
• Vehicle
emissions
monitoring
• Inspections for
compliance
• Adopt &
implement the
regional AQMP
and Air Quality
By-lays
• Inspections
for
compliance
• Vehicle
emissions
monitoring
• Implement
the adopted
AQPM & By-
laws
• Inspections
for
compliance
• Vehicle
emissions
monitoring
• Implement
the adopted
AQPM & By-
laws
• Inspections
for
compliance
• Vehicle
emissions
monitoring
• Implement
the adopted
AQPM & By-
laws
RWCL
M
• Inspections
for
compliance
• Vehicle
emissions
monitoring
• Inspections for
compliance
• Adopt the
regional AQMP
and Air Quality
By-lays
• Implementatio
n of the AQPM
& By-laws
• Inspections
for
compliance
• Vehicle
emissions
monitoring
• Implementati
on of the
• Inspections
for
compliance
• Vehicle
emissions
monitoring
• Implementati
on of the
• Inspections
for
compliance
• Vehicle
emissions
monitoring
• Implementati
on of the
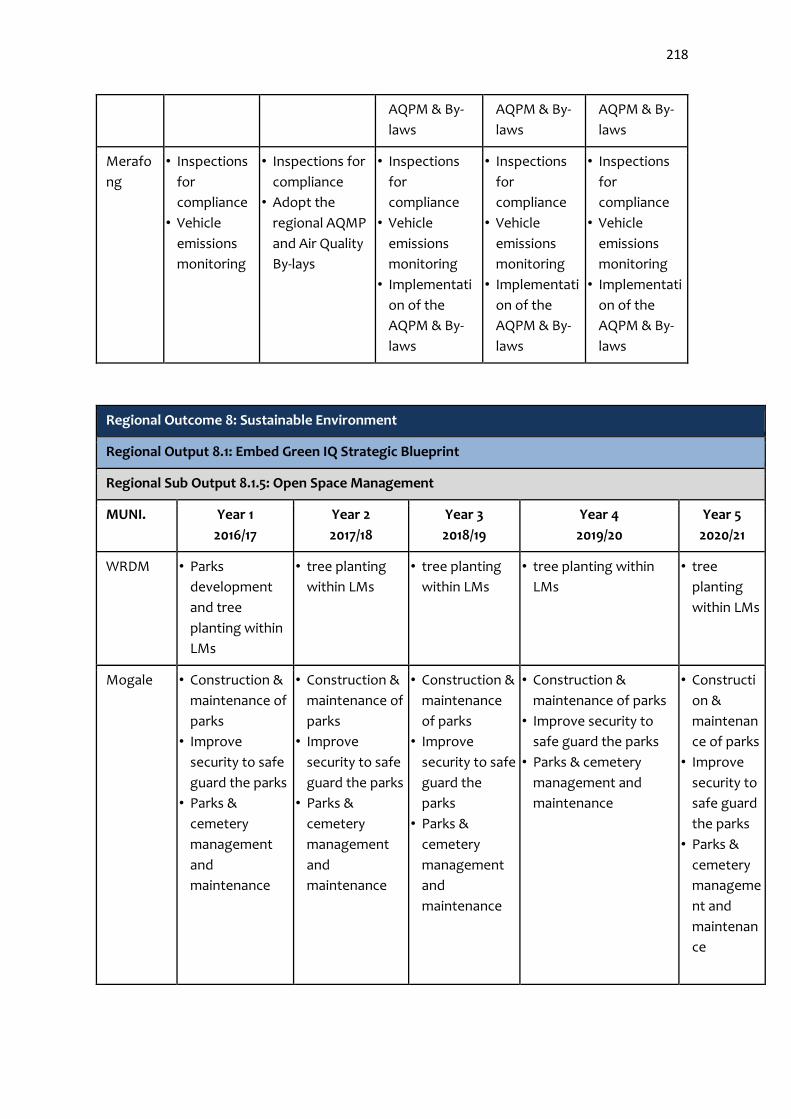
218
AQPM & By-
laws
AQPM & By-
laws
AQPM & By-
laws
Merafo
ng
• Inspections
for
compliance
• Vehicle
emissions
monitoring
• Inspections for
compliance
• Adopt the
regional AQMP
and Air Quality
By-lays
• Inspections
for
compliance
• Vehicle
emissions
monitoring
• Implementati
on of the
AQPM & By-
laws
• Inspections
for
compliance
• Vehicle
emissions
monitoring
• Implementati
on of the
AQPM & By-
laws
• Inspections
for
compliance
• Vehicle
emissions
monitoring
• Implementati
on of the
AQPM & By-
laws
Regional Outcome 8: Sustainable Environment
Regional Output 8.1: Embed Green IQ Strategic Blueprint
Regional Sub Output 8.1.5: Open Space Management
MUNI. Year 1
2016/17
Year 2
2017/18
Year 3
2018/19
Year 4
2019/20
Year 5
2020/21
WRDM • Parks
development
and tree
planting within
LMs
• tree planting
within LMs
• tree planting
within LMs
• tree planting within
LMs
• tree
planting
within LMs
Mogale • Construction &
maintenance of
parks
• Improve
security to safe
guard the parks
• Parks &
cemetery
management
and
maintenance
• Construction &
maintenance of
parks
• Improve
security to safe
guard the parks
• Parks &
cemetery
management
and
maintenance
• Construction &
maintenance
of parks
• Improve
security to safe
guard the
parks
• Parks &
cemetery
management
and
maintenance
• Construction &
maintenance of parks
• Improve security to
safe guard the parks
• Parks & cemetery
management and
maintenance
• Constructi
on &
maintenan
ce of parks
• Improve
security to
safe guard
the parks
• Parks &
cemetery
manageme
nt and
maintenan
ce

219
RWCLM • Upgrading of 5
parks in
Westonaria
area
• Purchase of
equipment for
Bird Sanctuary
and
Environmental
Education
Centre
• Commissioning
of Bird
Sanctuary and
Environmental
Education
Centre
• Refurbishment
of vandalised
Park in Ext 4
Mohlakeng
• Upgrading of
Cemeteries
(Randfontein
South and
Greenhills)
• Complete the
planning phase
for the
development
of New
Cemetery in
Greenhills
(EIAs, Designs)
• Development
of New
Cemetery in
Greenhills
(Phase 1)
• Upgrading of
Cemeteries
(Randfontein
South and
Greenhills)
• Development
of new and
refurbishment
of existing
community
parks
• Development of New
Cemetery in Greenhills
( Phase 2)
• Refurbishment/Repair
of Cemeteries
Infrastructure
(Mohlakeng and
Toekomsrus)
• Upgrading of
cemeteries
• Developm
ent of new
and
refurbishm
ent of
existing
communit
y parks
Merafong • Construction &
maintenance of
parks
• Improve
security to safe
guard the parks
• Management
and
maintenance of
cemeteries
• Construction &
maintenance of
parks
• Improve
security to safe
guard the parks
• Management
and
maintenance of
cemeteries
• Construction &
maintenance
of parks
• Improve
security to safe
guard the
parks
• Management
and
maintenance
of cemeteries
• Construction &
maintenance of parks
• Improve security to
safe guard the parks
• Management and
maintenance of
cemeteries
• Constructi
on &
maintenan
ce of parks
• Improve
security to
safe guard
the parks
• Managem
ent and
maintenan
ce of
cemeteries
1.13.3. Game Changers / Strategic Projects (Environmental Management)
Regional Outcome 8: Sustainable Environment
Regional Output 8.1: Embed Green IQ Strategic Blueprint
Regional Sub Output 8.1.1: Develop and Implement Climate Change Strategy
MUNI. Year 1
2016/17
Year 2
2017/18
Year 3
2018/19
Year 4
2019/20
Year 5
2020/21

220
WRDM Ensure
proper
coordination
, support
and
reporting
Ensure
proper
coordination,
support and
reporting
Ensure proper
coordination,
support and
reporting
Ensure
proper
coordinatio
n, support
and
reporting
Ensure
proper
coordinati
on,
support
and
reporting
Mogale Authorisatio
n process
for
implementat
ion to Waste
to energy
Authorizatio
n process for
implementati
on to Waste
to energy
Biogas at Flip
Human Waste
Treatment plan
Phase 1 of
Waste to
energy
project
(landfill
site)
Phase 2 of
waste to
energy
project
(landfill
site)
RWCL
M
Ensure
completion
of the
Mohlakeng
Buy Back
Centre
Management
of the
Mohlakeng
Buy Back
Centre
Obtain
authorisations/pe
rmits for Biogas
Plant
Biogas at
Randfontei
n Waste
treatment
plant
Merafo
ng
Merafong
Waste
Recycling
project
Merafong
Waste
Recycling
project
Merafong Waste
recycling project
Merafong
solar farm
clusters
Merafong
Bio- energy
park
Merafong
Waste
recycling
project
Regional Outcome 8: Sustainable Environment
Regional Output 8.1: Embed Green IQ Strategic Blueprint
Regional Sub Output 8.1.2: Build Capability to Manage Climate Change Disasters
MUNI. Year 1
2016/17
Year 2
2017/18
Year 3
2018/19
Year 4
2019/20
Year 5
2020/21
WRDM Rollout of
extensive
awareness
campaigns
on climate
change
issues
Rollout of
extensive
awareness
campaigns
on climate
change
issues
Rollout of
extensive
awareness
campaigns on
climate change
issues
Rollout
of
extensive
awarenes
s
campaign
s on
climate
change
issues
Rollout of
extensive
awareness
campaigns
on climate
change
issues

221
Mogale Rollout of
extensive
awareness
campaigns
on climate
change
issues
Rollout of
extensive
awareness
campaigns
on climate
change
issues
Rollout of
extensive
awareness
campaigns on
climate change
issues
Rollout
of
extensive
awarenes
s
campaign
s on
climate
change
issues
Rollout of
extensive
awareness
campaigns
on climate
change
issues
Randw
est
Rollout of
extensive
awareness
campaigns
on climate
change
issues
Rollout of
extensive
awareness
campaigns
on climate
change
issues
Rollout of
extensive
awareness
campaigns on
climate change
issues
Rollout
of
extensive
awarenes
s
campaign
s on
climate
change
issues
Rollout of
extensive
awareness
campaigns
on climate
change
issues
Merafo
ng
Rollout of
extensive
awareness
campaigns
on climate
change
issues
Rollout of
extensive
awareness
campaigns
on climate
change
issues
Rollout of
extensive
awareness
campaigns on
climate change
issues
Rollout
of
extensive
awarenes
s
campaign
s on
climate
change
issues
Rollout of
extensive
awareness
campaigns
on climate
change
issues
Regional Outcome 8: Sustainable Environment
Regional Output 8.1: Embed Green IQ Strategic Blueprint
Regional Sub Output 8.1.3: Develop and Implement Innovative Technologies and
Renewable Energy Sources
Muni. Year 1
2016/17
Year 2
2017/18
Year 3
2018/19
Year 4
2019/20
Year 5
2020/21

222
WRDM Ensure
proper
coordination
, support
and
reporting
Ensure
proper
coordination
, support
and
reporting
Ensure proper
coordination,
support and
reporting
Ensure
proper
coordinati
on,
support
and
reporting
Ensure
proper
coordination
, support
and
reporting
Mogale Authorizatio
n process for
implementat
ion to Waste
to energy
Authorizatio
n process for
implementat
ion to Waste
to energy
Biogas at Flip
Human Waste
Treatment plan
Phase 1 of
Waste to
energy
project
(landfill
site)
Phase 2 of
waste to
energy
project
(landfill site)
RWCL
M
Ensure
completion
of the
Mohlakeng
Buy Back
Centre
Managemen
t of the
Mohlakeng
Buy Back
Centre
Obtain
authorisations/per
mits for Biogas
Plant
Biogas at
Randfonte
in Waste
treatment
plant
Manage
implementat
ion of the
Biogas Plant
Merafo
ng
Implementat
ion of
Merafong
Waste
Recycling
project
Implementat
ion of
Merafong
Waste
Recycling
project
Implementation
of Merafong
Waste Recycling
project
Merafong
solar farm
clusters
Merafong
Bio-
energy
park
Implementat
ion of
Merafong
Waste
Recycling
project

223
Regional Outcome 8: Sustainable Environment
Regional Output 8.1: Embed Green IQ Strategic Blueprint
Regional Sub Output 8.1.4: Air Quality and Environmental Compliance
Muni. Year 1
2016/17
Year 2
2017/18
Year 3
2018/19
Year 4
2019/20
Year 5
2020/21
WRDM Enforcemen
t of By-laws
&
Legislation
Community
awareness
Enforcement
of By-laws &
Legislation
Community
awareness
Gazette by-
laws and
approve fine
schedule by
magistrate
Enforcement
of By-laws &
Legislation
Community
awareness
Enforcement
of By-laws &
Legislation
Community
awareness
Mogale Enforcement
of By-laws &
Legislation
Community
awareness
Enforcement
of By-laws &
Legislation
Community
awareness
Gazette by-
laws and
approve fine
schedule by
magistrate
Enforcement
of By-laws &
Legislation
Community
awareness
Enforcement
of By-laws &
Legislation
Community
awareness
RWCLM Enforcement
of By-laws &
Legislation
Community
awareness
Enforcement
of By-laws &
Legislation
Community
awareness
Gazette by-
laws and
approve fine
schedule by
magistrate
Enforcement
of By-laws &
Legislation
Community
awareness
Enforcement
of By-laws &
Legislation
Community
awareness
Merafon
g
Enforcement
of By-laws &
Legislation
Community
awareness
Enforcement
of By-laws &
Legislation
Community
awareness
Gazette by-
laws and
approve fine
schedule by
magistrate
Enforcement
of By-laws &
Legislation
Community
awareness
Enforcement
of By-laws &
Legislation
Community
awareness
Regional Outcome 8: Sustainable Environment
Regional Output 8.1: Embed Green IQ Strategic Blueprint
Regional Sub Output 8.1.5: Open Space Management
Muni. Year 1
2016/17
Year 2
2017/18
Year 3
2018/19
Year 4
2019/20
Year 5
2020/21
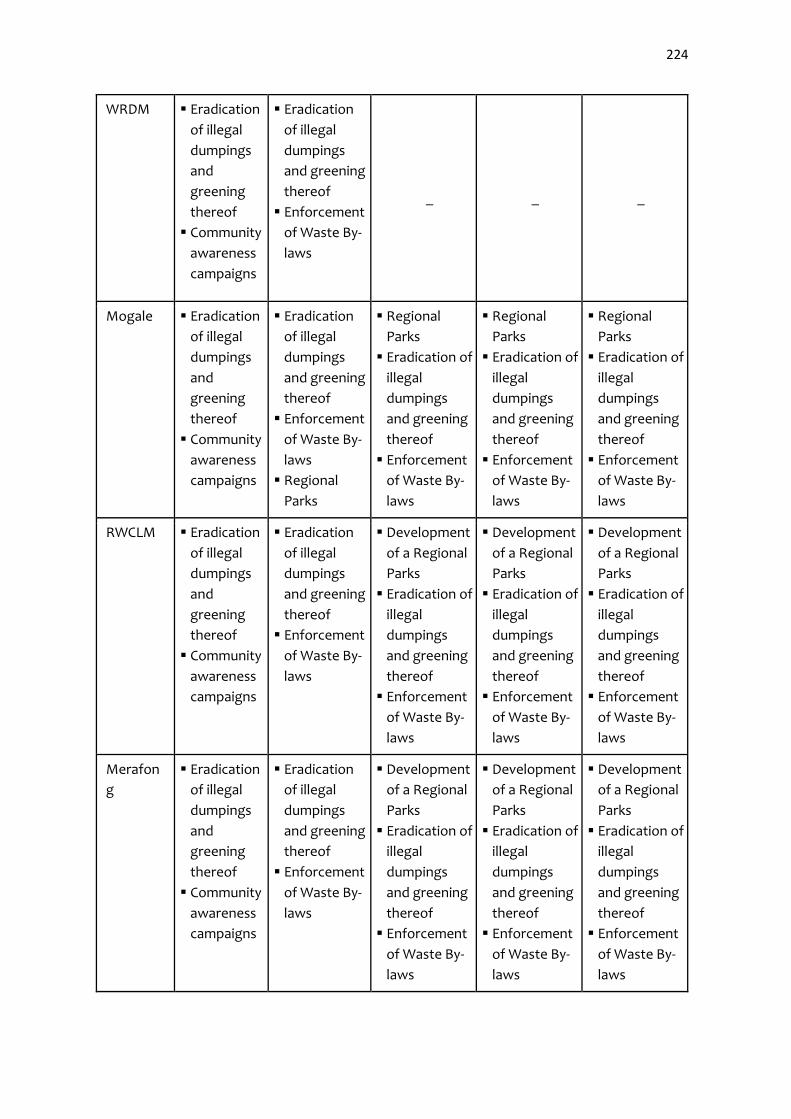
224
WRDM Eradication
of illegal
dumpings
and
greening
thereof
Community
awareness
campaigns
Eradication
of illegal
dumpings
and greening
thereof
Enforcement
of Waste By-
laws
_ _ _
Mogale Eradication
of illegal
dumpings
and
greening
thereof
Community
awareness
campaigns
Eradication
of illegal
dumpings
and greening
thereof
Enforcement
of Waste By-
laws
Regional
Parks
Regional
Parks
Eradication of
illegal
dumpings
and greening
thereof
Enforcement
of Waste By-
laws
Regional
Parks
Eradication of
illegal
dumpings
and greening
thereof
Enforcement
of Waste By-
laws
Regional
Parks
Eradication of
illegal
dumpings
and greening
thereof
Enforcement
of Waste By-
laws
RWCLM Eradication
of illegal
dumpings
and
greening
thereof
Community
awareness
campaigns
Eradication
of illegal
dumpings
and greening
thereof
Enforcement
of Waste By-
laws
Development
of a Regional
Parks
Eradication of
illegal
dumpings
and greening
thereof
Enforcement
of Waste By-
laws
Development
of a Regional
Parks
Eradication of
illegal
dumpings
and greening
thereof
Enforcement
of Waste By-
laws
Development
of a Regional
Parks
Eradication of
illegal
dumpings
and greening
thereof
Enforcement
of Waste By-
laws
Merafon
g
Eradication
of illegal
dumpings
and
greening
thereof
Community
awareness
campaigns
Eradication
of illegal
dumpings
and greening
thereof
Enforcement
of Waste By-
laws
Development
of a Regional
Parks
Eradication of
illegal
dumpings
and greening
thereof
Enforcement
of Waste By-
laws
Development
of a Regional
Parks
Eradication of
illegal
dumpings
and greening
thereof
Enforcement
of Waste By-
laws
Development
of a Regional
Parks
Eradication of
illegal
dumpings
and greening
thereof
Enforcement
of Waste By-
laws

225
1.13.4. Key Risks & Challenges (Environmental Management)
Regional Outcome 1: Basic Service Delivery Improvement
Regional Output 1.6: Provision of Quality and Reliable Sanitation and Waste Management
Regional Sub Output 1.6.1: Waste Management
Municipality Key Risks and Challenges
WRDM Lack of budget and skilled personnel
Merafong Insufficient budget for procurement of storage bins, construction of
transfer stations and development & management of landfill sites
RWCLM Over population of back yard dwellings in Bekkersdal
Insufficient budget for procurement of storage bins and construction
of transfer stations
Shortage of fleet
Excess to informal settlings for waste collection
Mogale City Upliftment of the moratorium for filling of vacancies
Regional Outcome 8: Sustainable Environment
Regional Output 8.1: Embed Green IQ Strategic Blueprint
Regional Sub Output 8.1.1: Develop and Implement Climate Change Strategy
Municipality Key Risks and Challenges
WRDM Key projects/programmes may not be implemented if the draft Climate
Change Strategy is not finalized.
Lack of co-ordination and integrated reporting.
Lack of communication.
Mogale Delay in obtaining internal and external authorizations for waste to energy
projects
RWCLM Shortage of skilled personnel.
Lack of internal and external resources for rand west projects.
Vandalism and theft at waste recycling facilities.
Land availability for projects.
Lack of communication.
Non-compliance with supply chain regulations.
Merafong Market fluctuations for Merafong waste recycling project.
Negative outcomes of the feasibility study for Merafong Solar and Bio
energy.
Land availability for projects.
Lack of communication.
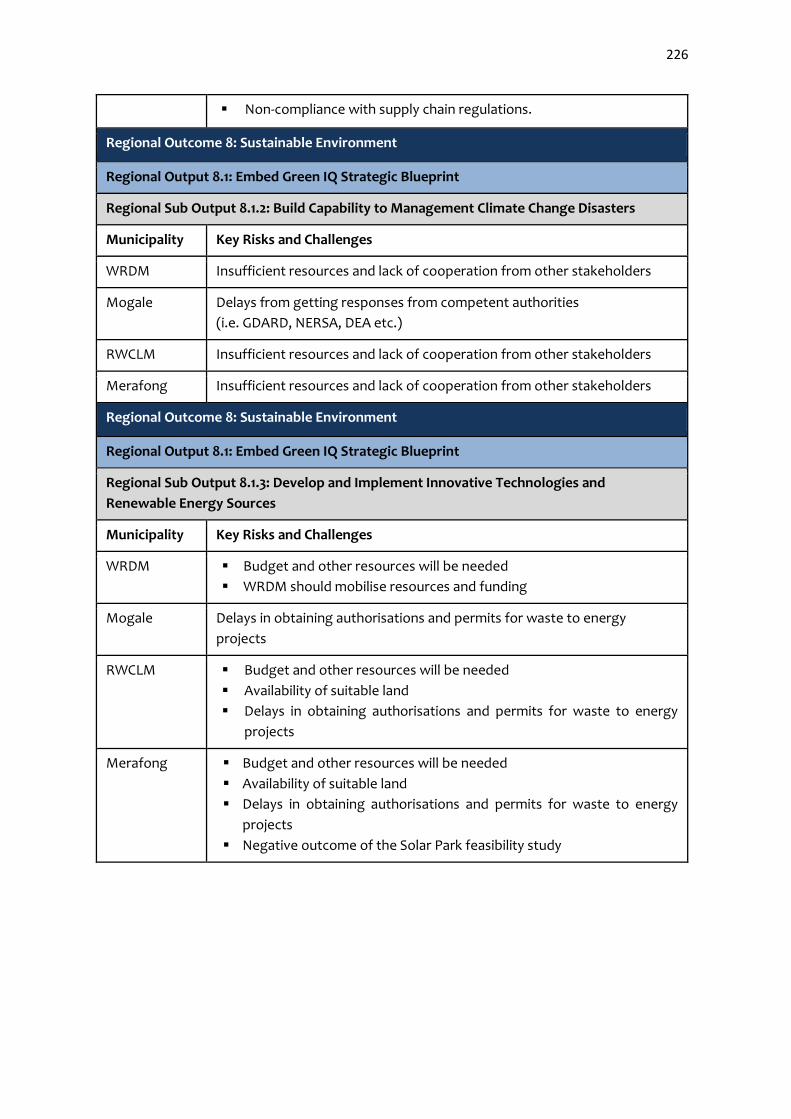
226
Non-compliance with supply chain regulations.
Regional Outcome 8: Sustainable Environment
Regional Output 8.1: Embed Green IQ Strategic Blueprint
Regional Sub Output 8.1.2: Build Capability to Management Climate Change Disasters
Municipality Key Risks and Challenges
WRDM Insufficient resources and lack of cooperation from other stakeholders
Mogale Delays from getting responses from competent authorities
(i.e. GDARD, NERSA, DEA etc.)
RWCLM Insufficient resources and lack of cooperation from other stakeholders
Merafong Insufficient resources and lack of cooperation from other stakeholders
Regional Outcome 8: Sustainable Environment
Regional Output 8.1: Embed Green IQ Strategic Blueprint
Regional Sub Output 8.1.3: Develop and Implement Innovative Technologies and
Renewable Energy Sources
Municipality Key Risks and Challenges
WRDM Budget and other resources will be needed
WRDM should mobilise resources and funding
Mogale Delays in obtaining authorisations and permits for waste to energy
projects
RWCLM Budget and other resources will be needed
Availability of suitable land
Delays in obtaining authorisations and permits for waste to energy
projects
Merafong Budget and other resources will be needed
Availability of suitable land
Delays in obtaining authorisations and permits for waste to energy
projects
Negative outcome of the Solar Park feasibility study

227
Regional Outcome 8: Sustainable Environment
Regional Output 8.1: Embed Green IQ Strategic Blueprint
Regional Sub Output 8.1.4: Air Quality and Environmental Compliance
Municipality Key Risks and Challenges
WRDM
Lack of resources, IGR support and cooperation from key stakeholders Mogale
RWCLM
Merafong
Regional Outcome 8: Sustainable Environment
Regional Output 8.1: Embed Green IQ Strategic Blueprint
Regional Sub Output 8.1.5: Open Space Management
Municipality Key Risks and Challenges
WRDM Budget & resources
Mogale None
RWCLM Budget & resources
Merafong Budget & resources
1.13.5. General Comments / Requests (Environmental Management)
Regional Outcome 1: Basic Service Delivery Improvement
Regional Output 1.6: Provision of Quality and Reliable Sanitation and Waste Management
Regional Sub Output 1.6.1: Waste Management
WRDM WRDM to mobilize resources for LMs
Mogale Intensify awareness campaigns to address illegal dumpings
RWCLM Provision of support (i.e. funding, processing of permits/authorisations)
Merafong Provision of support (i.e. funding, processing of permits/authorisations)

228
Outcome 8: Sustainable Environment
Output 8.1: Embed Green IQ Strategic Blueprint
Sub Output 8.1.1: Develop and Implement Climate Change Strategy
Municipality General Comments/ Requests
WRDM Mobilization of resources for the Region (technical and financial)
Mogale Provided technical support across the region.
RWCLM Funding for capital projects and development of strategies.
Merafong Funding for capital projects and development of strategies.
Outcome 8: Sustainable Environment
Output 8.1: Embed Green IQ Strategic Blueprint
Sub Output 8.1.2: Build Capability to Manage Climate Change Disasters
Municipality General Comments/ Requests
WRDM Budget and other resources will be needed
WRDM should mobilise resources and funding
Mogale Budget and other resources will be needed
RWCLM Budget and other resources will be needed
Merafong Budget and other resources will be needed
Outcome 8: Sustainable Environment
Output 8.1: Embed Green IQ Strategic Blueprint
Sub Output 8.1.3: Develop and Implement Innovative Technologies and Renewable Energy
Sources
Municipality General Comments/ Requests
WRDM Budget and resources will be needed
RWCLM Budget and resources will be needed
Merafong Budget and resources will be needed
Outcome 8: Sustainable Environment
Output 8.1: Embed Green IQ Strategic Blueprint
Sub Output 8.1.4: Air Quality and Environmental Compliance

229
Municipality General Comments/ Requests
WRDM Funding, technical support and partnerships with other stakeholders
Ensure synergy in IGR planning
Mogale Funding, technical support and partnerships with other stakeholders
Ensure synergy in IGR planning
RWCLM Funding, technical support and partnerships with other stakeholders
Ensure synergy in IGR planning
Merafong Funding, technical support and partnerships with other stakeholders
Ensure synergy in IGR planning
Outcome 8: Sustainable Environment
Output 8.1: Embed Green IQ Strategic Blueprint
Sub Output 8.1.5: Open Space Management
Municipality General Comments/ Requests
WRDM Resources will be needed
Mogale Budget
Randwest Resources will be needed
Merafong Resources will be needed
Plenary Comments / Feedback/ Recommendations
a) What are the strategies around problem of mine dumps?
b) What are the strategies around pollution levels in dams?
c) Consider alternative burial methods around District cemeteries
1.14. Consolidated Support Services Dashboard (Development Strategy – Support Services)
Regional Outcome 2: Accountable Municipal Administration
What is the level of effectiveness and efficiency of our Governance Systems and Processes? (H,M,L)
WRDM Mogale Randwest Merafong
Commission 1: Electricity Low Medium Medium
Commission 2: Water and Sanitation Medium Low Low
Commission 3: Roads, Transport and Storm
water Medium Medium Medium Medium
Commission 4: Human Settlement High High High High
Commission 5: Regional Re-Industrialisation Medium Medium Medium Medium
Commission 6: Community Services: Public
Safety Medium

230
Commission 6: Community Services: Health and
Social Development High High Medium Medium
Commission 7: Environment Management Medium Medium Medium Medium
Regional Outcome 3: Skilled, Capacitated, Competent and Motivated Workforce
What is the level of skills gaps (H, M, L)?
WRDM Mogale Randwest Merafong
Commission 1: Electricity High Medium High
Commission 2: Water and Sanitation High High High High
Commission 3: Roads, Transport and Storm
water High High High High
Commission 4: Human Settlement Medium Medium Medium Medium
Commission 5: Regional Re-Industrialisation Low Low Medium Medium
Commission 6: Community Services: Public
Safety Low
Commission 6: Community Services: Health and
Social Development Low
Commission 7: Environment Management Medium Medium Low Low
What is the level of employee morale within the function? (H,M, L)
WRDM Mogale Randwest Merafong
Commission 1: Electricity Medium Medium
Commission 2: Water and Sanitation Low Low Low Low
Commission 3: Roads, Transport and Storm
water Low Low Low Low
Commission 4: Human Settlement Medium Medium Medium Medium
Commission 5: Regional Re-Industrialisation Medium Medium Low Medium
Commission 6: Community Services: Public
Safety Low
Commission 6: Community Services: Health and
Social Development Medium Low Low Medium
Commission 7: Environment Management Medium Low Low
Regional Outcome 4: Ethical Administration & Good Governance
What is the level of Ethical Administration? (H,M,L)
WRDM Mogale Randwest Merafong
Commission 1: Electricity Medium Medium Medium
Commission 2: Water and Sanitation High Medium Medium Low
Commission 3: Roads, Transport and Storm
water High Medium Medium Medium
Commission 4: Human Settlement Medium Medium Medium Medium
Commission 5: Regional Re- Industrialisation Medium Medium Medium Medium
Commission 6: Community Services: Public
Safety Medium
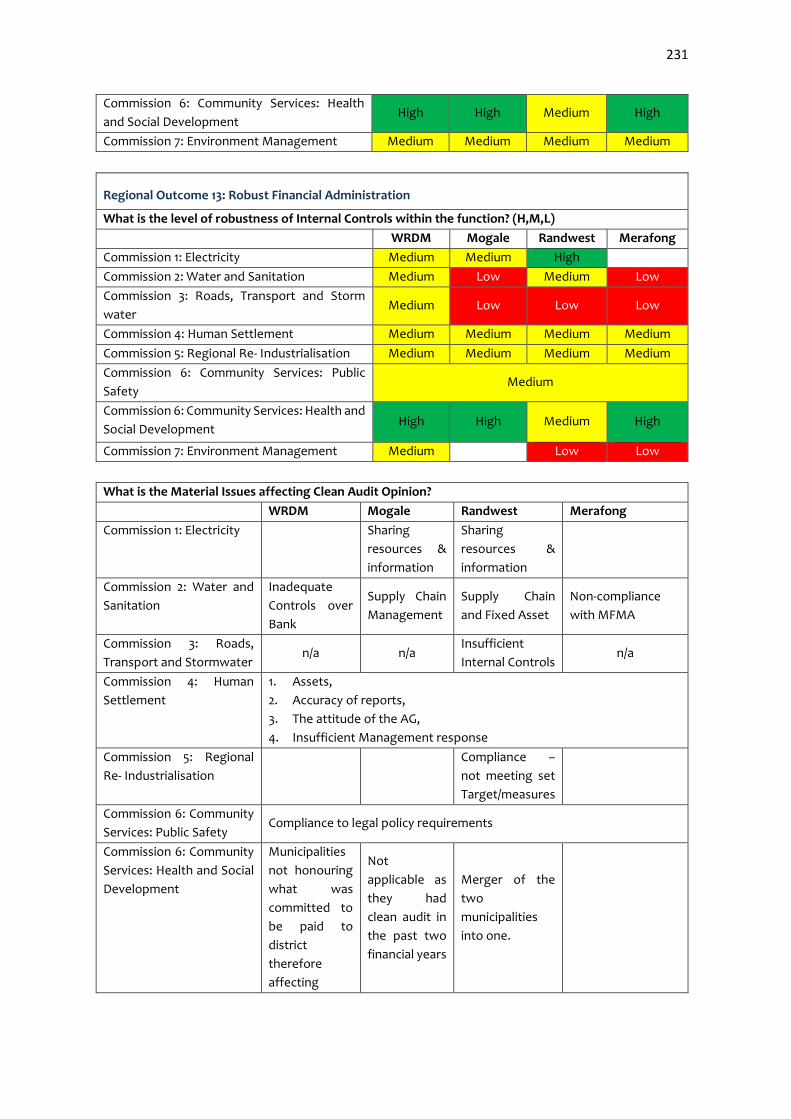
231
Commission 6: Community Services: Health
and Social Development High High Medium High
Commission 7: Environment Management Medium Medium Medium Medium
Regional Outcome 13: Robust Financial Administration
What is the level of robustness of Internal Controls within the function? (H,M,L)
WRDM Mogale Randwest Merafong
Commission 1: Electricity Medium Medium High
Commission 2: Water and Sanitation Medium Low Medium Low
Commission 3: Roads, Transport and Storm
water Medium Low Low Low
Commission 4: Human Settlement Medium Medium Medium Medium
Commission 5: Regional Re- Industrialisation Medium Medium Medium Medium
Commission 6: Community Services: Public
Safety Medium
Commission 6: Community Services: Health and
Social Development High High Medium High
Commission 7: Environment Management Medium Low Low
What is the Material Issues affecting Clean Audit Opinion?
WRDM Mogale Randwest Merafong
Commission 1: Electricity
Sharing
resources &
information
Sharing
resources &
information
Commission 2: Water and
Sanitation
Inadequate
Controls over
Bank
Supply Chain
Management
Supply Chain
and Fixed Asset
Non-compliance
with MFMA
Commission 3: Roads,
Transport and Stormwater n/a n/a
Insufficient
Internal Controls n/a
Commission 4: Human
Settlement
1. Assets,
2. Accuracy of reports,
3. The attitude of the AG,
4. Insufficient Management response
Commission 5: Regional
Re- Industrialisation
Compliance –
not meeting set
Target/measures
Commission 6: Community
Services: Public Safety Compliance to legal policy requirements
Commission 6: Community
Services: Health and Social
Development
Municipalities
not honouring
what was
committed to
be paid to
district
therefore
affecting
Not
applicable as
they had
clean audit in
the past two
financial years
Merger of the
two
municipalities
into one.
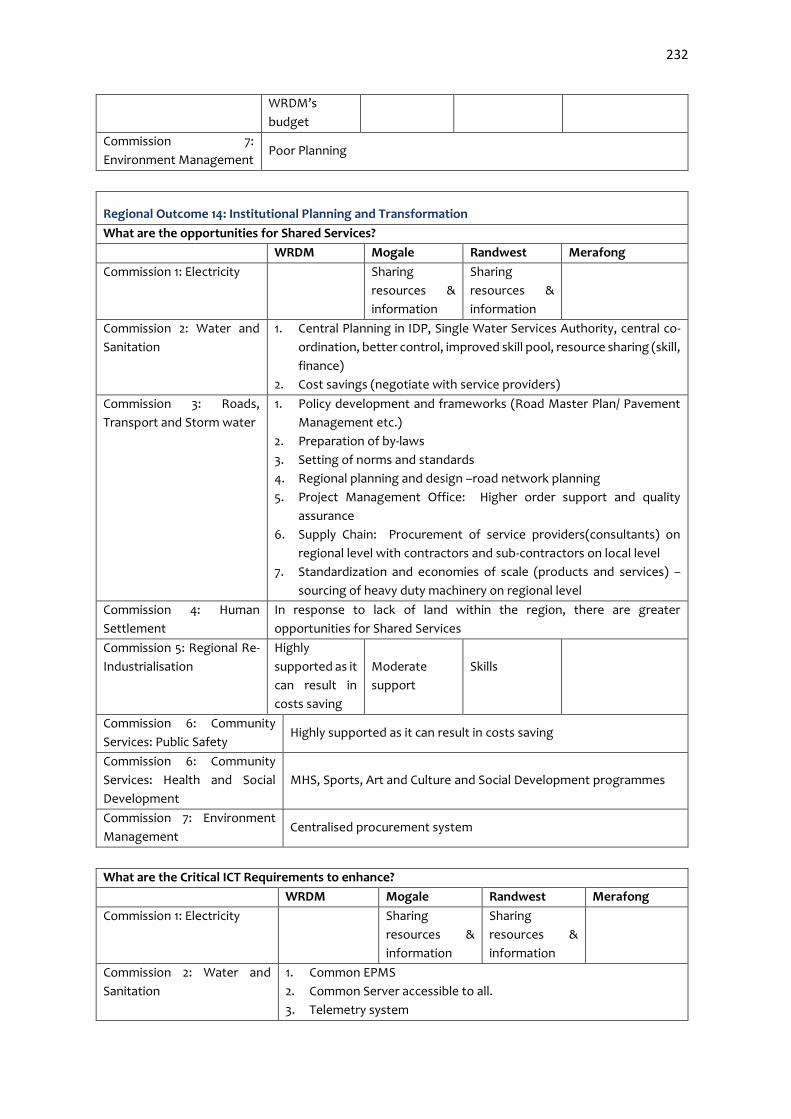
232
WRDM’s
budget
Commission 7:
Environment Management Poor Planning
Regional Outcome 14: Institutional Planning and Transformation
What are the opportunities for Shared Services?
WRDM Mogale Randwest Merafong
Commission 1: Electricity
Sharing
resources &
information
Sharing
resources &
information
Commission 2: Water and
Sanitation
1. Central Planning in IDP, Single Water Services Authority, central co-
ordination, better control, improved skill pool, resource sharing (skill,
finance)
2. Cost savings (negotiate with service providers)
Commission 3: Roads,
Transport and Storm water
1. Policy development and frameworks (Road Master Plan/ Pavement
Management etc.)
2. Preparation of by-laws
3. Setting of norms and standards
4. Regional planning and design –road network planning
5. Project Management Office: Higher order support and quality
assurance
6. Supply Chain: Procurement of service providers(consultants) on
regional level with contractors and sub-contractors on local level
7. Standardization and economies of scale (products and services) –
sourcing of heavy duty machinery on regional level
Commission 4: Human
Settlement
In response to lack of land within the region, there are greater
opportunities for Shared Services
Commission 5: Regional Re-
Industrialisation
Highly
supported as it
can result in
costs saving
Moderate
support
Skills
Commission 6: Community
Services: Public Safety Highly supported as it can result in costs saving
Commission 6: Community
Services: Health and Social
Development
MHS, Sports, Art and Culture and Social Development programmes
Commission 7: Environment
Management Centralised procurement system
What are the Critical ICT Requirements to enhance?
WRDM Mogale Randwest Merafong
Commission 1: Electricity
Sharing
resources &
information
Sharing
resources &
information
Commission 2: Water and
Sanitation
1. Common EPMS
2. Common Server accessible to all.
3. Telemetry system

233
4. Leak detection,
5. Early warning system
6. GIS
What are the Critical ICT Requirements to enhance?
WRDM Mogale Randwest Merafong
Commission 3: Roads,
Transport and Storm water
Integrated GIS System (To be
inclusive of all relevant sector
departments / institutions
information e.g., housing
developments, clinics, NMT
infrastructure, environmental
policies / constraints,
geotechnical information,
population densities, game
changer projects and other
flag projects, BRT routes of
neighbouring municipalities,
etc.)
Integrated GIS System
(Full civil design office systems)
What are the Critical ICT Requirements to enhance?
WRDM Mogale Randwest Merafong
Commission 4: Human
Settlement
There is greater need to have functional GIS within the District as
whole. Gauteng province is in the process of rolling out GIS for the
entire province inclusive of municipalities and sector departments
Commission 5: Regional Re-
Industrialisation
Regional broad
band which will
reduce the cost
doing business
Capacity
needed
Commission 6: Community
Services: Public Safety More than 80% of the Public Safety function is already a shared services
Commission 6: Community
Services: Health and Social
Development
Integrated ICT system across the region
Commission 7: Environment
Management Regional Waste Information System
Recommendations to Implement the New Powers and Functions?
Commission 1: Electricity 1. All necessary issues to be resolved i.e. NERSA, ESKOM, etc.
2. Transition period required for few months before implementation
3. Action plan to be in place i.e. consultation, assets etc.
Commission 2: Water and
Sanitation
1. WSA function - District could appoint LM’s as Water Service
Providers, would ensure seamless co-ordination.

234
Commissions’ inputs towards New Functions and Powers
2. WRDM would be in a position to provide better service at
discounted rates
3. Due diligence is required
4. Change management must be properly planned for correct
implementation
5. Powers and functions shall be assumed together with staff,
responsibilities and liabilities
6. 1,5 years estimated for the transition
7. Specialised Service Provider to undertake Feasibility Study with
realistic time frames.
8. Asses which functions can be implemented within and / or external.
9. The process to be facilitated by COGTA / DWS / Treasury and other
key role players

235
Commission 3: Roads,
Transport and Storm water
1. Regional infrastructure, road network and transport planning
2. Policy development
3. Preparation of by-laws
4. Setting of norms and standards
5. Road network design
6. Centralised GIS and Information Archive
7. Project Management Office (Project Engineers): Higher order
support and quality assurance
8. Supply Chain: Procurement of service providers(consultants) on
regional level with contractors and sub-contractors on local level
9. Standardisation and economies of scale (products and services) –
sourcing of heavy duty machinery on regional level
Commission 4: Human
Settlement
District municipality is obligated in terms of section 83 (3) to seek to
achieve the integrated, sustainable and equitable social and economic
development of its area as a whole by –
1. Ensuring integrated development planning for the district as a
whole;
2. Promoting bulk infrastructure development and services for
the district as a whole;
3. Building the capacity of Local Municipalities in its area to
perform their functions and exercise their powers where such
capacity is lacking; and
4. Promoting the equitable distribution of resources between the
Local Municipalities in its area to ensure appropriate levels of
municipal services within the area.
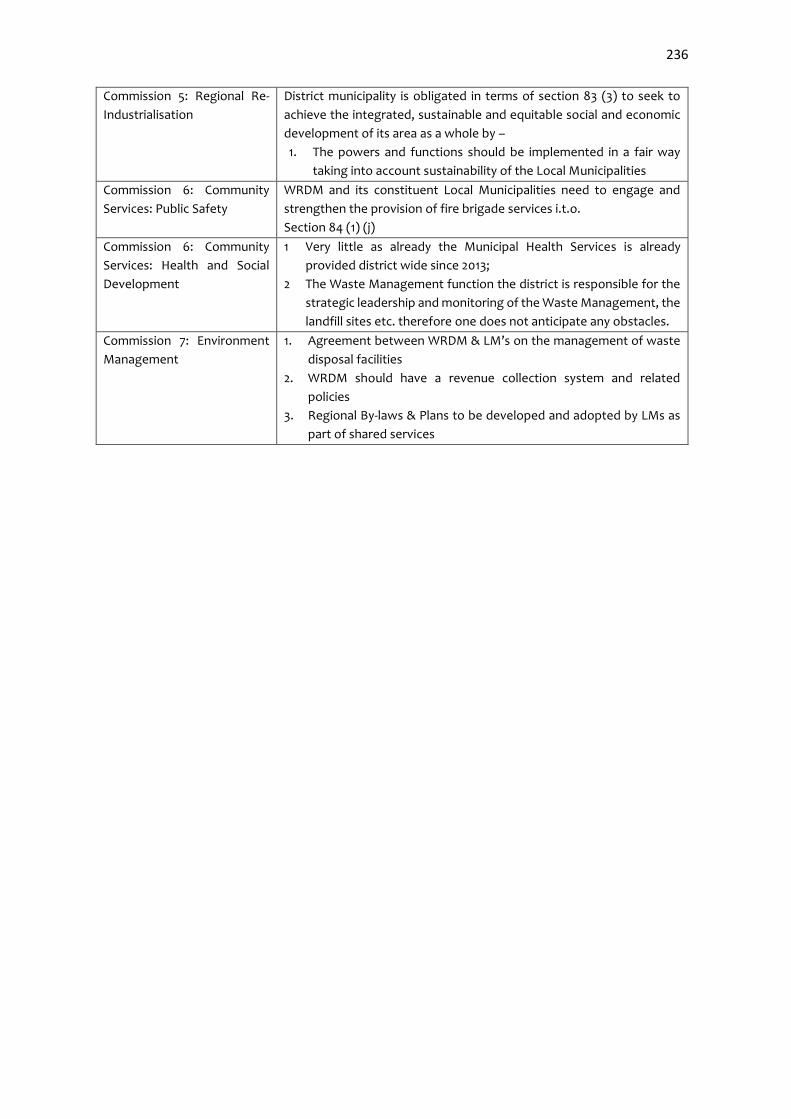
236
Commission 5: Regional Re-
Industrialisation
District municipality is obligated in terms of section 83 (3) to seek to
achieve the integrated, sustainable and equitable social and economic
development of its area as a whole by –
1. The powers and functions should be implemented in a fair way
taking into account sustainability of the Local Municipalities
Commission 6: Community
Services: Public Safety
WRDM and its constituent Local Municipalities need to engage and
strengthen the provision of fire brigade services i.t.o.
Section 84 (1) (j)
Commission 6: Community
Services: Health and Social
Development
1 Very little as already the Municipal Health Services is already
provided district wide since 2013;
2 The Waste Management function the district is responsible for the
strategic leadership and monitoring of the Waste Management, the
landfill sites etc. therefore one does not anticipate any obstacles.
Commission 7: Environment
Management
1. Agreement between WRDM & LM’s on the management of waste
disposal facilities
2. WRDM should have a revenue collection system and related
policies
3. Regional By-laws & Plans to be developed and adopted by LMs as
part of shared services

237
OUTCOME 1
IMPLEMENTATION PLANS ARE SEQUENCED AS FOLLOWS:

238
Regional Outcome 1: Basic Service Delivery Improvement
Part 1: National and Provincial Alignment
National Outcomes
6. An efficient, competitive and responsive economic infrastructure network; 8. Sustainable human settlements and improved quality of household life; 9. A responsive, accountable, effective and efficient local government system;
Provincial 10 Pillars 2. Decisive spatial transformation 3. Accelerating social transformation 4. Transformation of the State and governance 5. Modernisation of the economy 7.Modernisation of human settlements and urban development. 8. Modernisation of public transport and other infrastructure 10.Taking a lead in Africa’s new industrial revolution.
Back to Basics Goals 1. Put People & Their Concerns First: Listen and Communicate 2. Deliver Municipal Services to Right Quality & Standard 3. Good Governance & Sound Administration 4. Sound Financial Management & Accounting
COGTA KPA's KPA 1 : Basic Service Delivery and Infrastructure
Part 2: Regional Five Year Game Changer Projects
Muni. Year 1
PROJECTS/ PROGRAMMES
Year 2 PROJECTS/
PROGRAMMES
Year 3 PROJECTS/
PROGRAMMES
Year 4 PROJECTS/
PROGRAMMES
Year 5 PROJECTS/
PROGRAMMES Refer to section G

239
MUNI. PLANNING
LEVEL PLANNING
STATEMENT INDICATOR TYPE UOM
Year 1
2016/ 17
Year 2 2017/
18
Year 3 2018/
19
Year 4 2019/
20
Year 5
2020/ 21
Administrative Political
DEPT RESP
PERSON OVER-SIGHT
Regional Outcome 1.0: Basic Service Delivery Improvement
REGION-AL
REGIONAL OUTCOME
T-O-1.0
Basic Service Delivery Improvement
Develop Infrastructure Master Plan
Target/measure % 0 0 0 100 0
RPR WRDM
HOD
WRDM Executive
Mayor
Capital N/A 0 0 0 0 0
Operating Yes 0 Opex Opex Opex 0
Number of project milestones achieved in line with the implementation of the NDPG project implementation
Target/measure Number 0 17 0 0 0
Capital Yes 0 R53 M 0 0 0
Operating N/A 0 0 0 0 0
WRDM OUTCOME
W-O-1.0
Basic Service Delivery Improvement
Develop Infrastructure Master Plan
Target/measure % . 0 0 100 0
RPR WRDM
HOD
WRDM Executive
Mayor
Capital N/A 0 0 0 0 0
Operating Yes 0 Opex Opex Opex 0
Number of project milestones achieved in line with the implementation of the NDPG project implementation
Target/measure Number 0 17 0 0 0
Capital Yes 0 R53 M 0 0 0
Operating N/A 0 0 0 0 0
MCLM OUTCOME
M-O-1.0
Basic Service Delivery Improvement
Adoption of Infrastructure Master Plan
Target/measure % 0 0 0 100 0
Infra LM
HOD
MCLM Executive
Mayor Capital N/A 0 0 0 0 0
Operating Yes 0 0 0 Opex 0
RWCLM Target/measure % 0 0 0 100 0 Infra

240
OUTCOME R-O-1.0
Basic Service Delivery Improvement
Adoption of Infrastructure Master Plan
Capital N/A 0 0 0 0 0 LM
HOD
RWCLM Executive
Mayor Operating Yes 0 0 0 Opex 0
MFCLM OUTCOME
F-O-1.0
Basic Service Delivery Improvement
Adoption of Infrastructure Master Plan
Target/measure % 0 0 0 100 0
Infra LM
HOD
MFCLM Executive
Mayor Capital N/A 0 0 0 0 0
Operating Yes 0 0 0 Opex 0
Regional Output 1.1: Maintain Good Quality Reliable Roads and Stormwater Network
REGIONAL REGIONAL
OUTPUT T-OP-1.1
Maintain Good Quality Reliable Roads and Stormwater Network
Develop Regional Roads & Stormwater Network Plan
Target/measure No 0 1 0 0 0
RPR WRDM
HOD
WRDM Executive
Mayor
Capital N/A 0 0 0 0 0
Operating Yes 0 Opex 0 0 0
WRDM OUTPUT W-OP-1.1
Maintain Good Quality Reliable Roads and Stormwater Network
Develop Regional Roads & Stormwater Network Plan
Target/measure No 0 3 0 0 0
RPR WRDM
HOD
WRDM Executive
Mayor
Capital N/A 0 0 0 0 0
Operating Yes 0 Opex 0 0 0
MCLM OUTPUT M-OP-1.1
Maintain Good Quality Reliable Roads and Stormwater Network
Develop Local Roads & Stormwater Network Plan
Target/measure No 0 1 0 0 0
Infra LM
HOD
MCLM Executive
Mayor
Capital N/A 0 0 0 0 0
Operating Yes 0 Opex 0 0 0
RWCLM OUTPUT R-OP-1.1
Maintain Good Quality Reliable Roads and Stormwater Network
Develop Local Roads & Stormwater Network Plan
Target/measure . 0 1 0 0 0
Infra LM
HOD
RWCLM Executive
Mayor
Capital N/A 0 0 0 0 0
Operating Yes 0 Opex 0 0 0
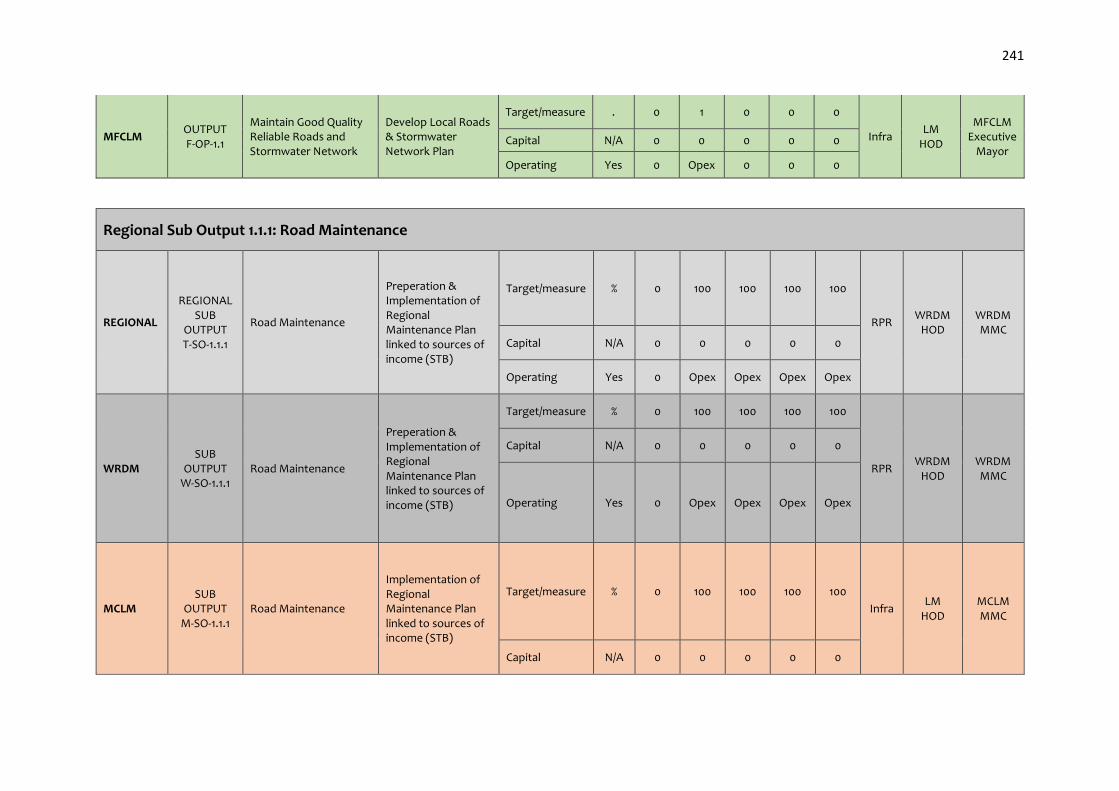
241
MFCLM OUTPUT F-OP-1.1
Maintain Good Quality Reliable Roads and Stormwater Network
Develop Local Roads & Stormwater Network Plan
Target/measure . 0 1 0 0 0
Infra LM
HOD
MFCLM Executive
Mayor Capital N/A 0 0 0 0 0
Operating Yes 0 Opex 0 0 0
Regional Sub Output 1.1.1: Road Maintenance
REGIONAL
REGIONAL SUB
OUTPUT T-SO-1.1.1
Road Maintenance
Preperation & Implementation of Regional Maintenance Plan linked to sources of income (STB)
Target/measure % 0 100 100 100 100
RPR WRDM
HOD WRDM MMC
Capital N/A 0 0 0 0 0
Operating Yes 0 Opex Opex Opex Opex
WRDM SUB
OUTPUT W-SO-1.1.1
Road Maintenance
Preperation & Implementation of Regional Maintenance Plan linked to sources of income (STB)
Target/measure % 0 100 100 100 100
RPR WRDM
HOD WRDM MMC
Capital N/A 0 0 0 0 0
Operating Yes 0 Opex Opex Opex Opex
MCLM SUB
OUTPUT M-SO-1.1.1
Road Maintenance
Implementation of Regional Maintenance Plan linked to sources of income (STB)
Target/measure % 0 100 100 100 100
Infra LM
HOD MCLM MMC
Capital N/A 0 0 0 0 0

242
Operating Yes 0 Opex Opex Opex Opex
RWCLM SUB
OUTPUT R-SO-1.1.1
Road Maintenance
Implementation of Regional Maintenance Plan linked to sources of income (STB)
Target/measure % 0 100 100 100 100
Infra LM
HOD RWCLM
MMC
Capital N/A 0 0 0 0 0
Operating Yes 0 Opex Opex Opex Opex
MFCLM SUB
OUTPUT M-SO-1.1.1
Road Maintenance
Implementation of Regional Maintenance Plan linked to sources of income (STB)
Target/measure % 0 100 100 100 100
Infra LM
HOD MFCLM
MMC
Capital N/A 0 0 0 0 0
Operating Yes 0 Opex Opex Opex Opex

243
Regional Activity 1.1.1.1: Implement Rural Roads Administrative Management System
REGIONAL REGIONAL ACTIVITY T-A-1.1.1.1
Coordiate & Monitor Rural Roads Administrative Management System
Quarterly Reports on Implementation
of RAMS
Target/measure No 0 4 4 4 4
RPR WRDM
HOD WRDM MMC
Capital N/A 0 0 0 0 0
Operating Yes 0 Opex Opex Opex Opex
WRDM ACTIVITY W-A-1.1.1.1
Coordiate & Monitor Rural Roads Administrative Management System
Target/measure No 0 4 4 4 4
RPR WRDM
HOD WRDM MMC
Capital N/A 0 0 0 0 0
Operating yes Opex Opex Opex Opex
MCLM ACTIVITY M-A-1.1.1.1
Implement Rural Roads Administrative Management System
Target/measure No 0 4 4 4 4
Infra LM
HOD MCLM MMC Capital N/A 0 0 0 0 0
Operating Yes 0 Opex Opex Opex Opex
RWCLM ACTIVITY R-A-1.1.1.1
Implement Rural Roads Administrative Management System
Target/measure No 0 4 4 4 4
Infra LM
HOD RWCLM
MMC Capital N/A 0 0 0 0 0
Operating Yes 0 Opex Opex Opex Opex
MFCLM ACTIVITY F-A-1.1.1.1
Implement Rural Roads Administrative Management System
Target/measure No 0 4 4 4 4
Infra LM
HOD MFCLM
MMC Capital N/A 0 0 0 0 0
Operating Yes 0 Opex Opex Opex Opex

244
Regional Sub Output 1.1.2: Stormwater
REGIONAL
REGIONAL SUB
OUTPUT T-SO-1.1.2
Reliable Stormwatee Infrastructure
% Development & Implementation of
Regional Framework for reliable
Stormwater Infrastructure
Target/measure % 0 100 100 100 100
RPR WRDM
HOD WRDM MMC Capital N/A 0 0 0 0 0
Operating Yes 0 Opex Opex Opex Opex
WRDM SUB
OUTPUT W-SO-1.1.2
Reliable Stormwatee Infrastructure
Target/measure % 0 100 100 100 100
RPR WRDM
HOD WRDM MMC
Capital N/A 0 0 0 0 0
Operating Yes 0 Opex Opex Opex Opex
MCLM SUB
OUTPUT M-SO-1.1.2
Reliable Stormwatee Infrastructure
Target/measure % 0 100 100 100 100
Infra LM
HOD MCLM MMC
Capital N/A 0 0 0 0 0
Operating Yes 0 Opex Opex Opex Opex
RWCLM SUB
OUTPUT R-SO-1.1.2
Reliable Stormwatee Infrastructure
Target/measure % 0 100 100 100 100
Infra LM
HOD RWCLM
MMC Capital N/A 0 0 0 0 0
Operating Yes 0 Opex Opex Opex Opex
MFCLM SUB
OUTPUT M-SO-1.1.2
Reliable Stormwatee Infrastructure
Target/measure % 0 100 100 100 100
Infra LM
HOD MFCLM
MMC Capital N/A 0 0 0 0 0
Operating Yes 0 Opex Opex Opex Opex

245
Regional Sub Output 1.1.2: Transport Planning
REGIONAL
REGIONAL SUB
OUTPUT T-SO-1.1.2
Integrated Transport Planning
% Revision & Implimentation of
Regional ITP Projects
Target/measure % 0 100 100 100 100
RPR WRDM
HOD WRDM MMC
Capital N/A 0 0 0 0 0
Operating Yes 0 Opex Opex Opex Opex
WRDM SUB
OUTPUT W-SO-1.1.2
Integrated Transport Planning
Target/measure % 0 100 100 100 100
RPR WRDM
HOD WRDM MMC
Capital N/A 0 0 0 0 0
Operating Yes 0 Opex Opex Opex Opex
MCLM SUB
OUTPUT M-SO-1.1.2
Integrated Transport Planning
Target/measure % 0 100 100 100 100
Infra LM
HOD MCLM MMC
Capital N/A 0 0 0 0 0
Operating Yes 0 Opex Opex Opex Opex
RWCLM SUB
OUTPUT R-SO-1.1.2
Integrated Transport Planning
Target/measure % 0 100 100 100 100
Infra LM
HOD RWCLM
MMC Capital N/A 0 0 0 0 0
Operating Yes 0 Opex Opex Opex Opex
MFCLM SUB
OUTPUT M-SO-1.1.2
Integrated Transport Planning
Target/measure % 0 100 100 100 100
Infra LM
HOD MFCLM
MMC Capital N/A 0 0 0 0 0
Operating Yes 0 Opex Opex Opex Opex

246
Regional Output 1.2: Secure Strategic Source of Water Supply (dams & reservoirs)
REGIONAL REGIONAL
OUTPUT T-OP-1.2
Secure Strategic Source of Water Supply (dams & reservoirs)
Statistical profililing & Auditing of existing water sources in the
Region
Target/measure % 0 100 100 100 100
RPR WRDM
HOD
WRDM Executive
Mayor Capital N/A 0 0 0 0 0
Operating Yes 0 Opex Opex Opex Opex
WRDM OUTPUT W-OP-1.2
Secure Strategic Source of Water Supply (dams & reservoirs)
Target/measure % 0 100 100 100 100
RPR WRDM
HOD
WRDM Executive
Mayor Capital N/A 0 0 0 0 0
Operating Yes 0 Opex Opex Opex Opex
MCLM OUTPUT M-OP-1.2
Secure Strategic Source of Water Supply (dams & reservoirs)
Target/measure % 0 100 100 100 100
Infra LM
HOD
MCLM Executive
Mayor
Capital N/A 0 0 0 0 0
Operating Yes 0 Opex Opex Opex Opex
RWCLM OUTPUT R-OP-1.2
Secure Strategic Source of Water Supply (dams & reservoirs)
Target/measure % 0 100 100 100 100
Infra LM
HOD
RWCLM Executive
Mayor
Capital N/A 0 0 0 0 0
Operating Yes 0 Opex Opex Opex Opex
MFCLM OUTPUT F-OP-1.2
Secure Strategic Source of Water Supply (dams & reservoirs)
Target/measure % 0 100 100 100 100
Infra LM
HOD
MFCLM Executive
Mayor
Capital N/A 0 0 0 0 0
Operating Yes 0 Opex Opex Opex Opex

247
Regional Sub Output 1.2.1: Bulk Water
REGIONAL
REGIONAL SUB
OUTPUT T-SO-1.2.1
Establishment of Regional Water Services Authority
Formalisation of WRDM as Regional Water Services Authority, Compilation & Implimentation of Water Services Development Plan
Target/measure % 0 0 0 100 100
RPR WRDM
HOD WRDM MMC
Capital N/A 0 0 0 0 0
Operating Yes 0 Opex Opex Opex Opex
WRDM SUB
OUTPUT W-SO-1.2.1
Establishment of Regional Water Services Authority
Formalisation of WRDM as Regional Water Services Authority, Compilation & Implimentation of Water Services Development Plan
Target/measure % 0 0 0 100 100
RPR WRDM
HOD WRDM MMC
Capital N/A 0 0 0 0 0
Operating Yes 0 Opex Opex Opex Opex
MCLM SUB
OUTPUT M-SO-1.2.1
Establishment of Regional Water Services Authority
Implementation of Regional Water Services Development Plan (STB)
Target/measure % 0 100 100 100 100
Infra LM
HOD MCLM MMC
Capital N/A 0 0 0 0 0
Operating Yes 0 Opex Opex Opex Opex
RWCLM SUB
OUTPUT R-SO-1.2.1
Establishment of Regional Water Services Authority
Implementation of Regional Water Services Development Plan (STB)
Target/measure % 0 100 100 100 100
Infra LM
HOD RWCLM
MMC Capital N/A 0 0 0 0 0
Operating Yes 0 Opex Opex Opex Opex
MFCLM SUB
OUTPUT M-SO-1.2.1
Establishment of Regional Water Services Authority
Implementation of Regional Water Services Development Plan (STB)
Target/measure % 0 100 100 100 100
Infra LM
HOD MFCLM
MMC Capital N/A 0 0 0 0 0
Operating Yes 0 Opex Opex Opex Opex

248
Regional Output 1.3: Maintain Efficient Water Treatment Infrastructures
REGIONAL REGIONAL
OUTPUT T-OP-1.3
Maintain Efficient Water Treatment Infrastructures
Implimentation of Efficient Water Treatment Infrastructure Programmes
Target/measure % 0 100 100 100 100
RPR WRDM
HOD
WRDM Executive
Mayor
Capital N/A 0 0 0 0 0
Operating Yes 0 Opex Opex Opex Opex
WRDM OUTPUT W-OP-1.3
Maintain Efficient Water Treatment Infrastructures
Coordinate and Monitor Water Treatment Infrastructure Programmes
Target/measure % 0 100 100 100 100
RPR WRDM
HOD
WRDM Executive
Mayor Capital N/A 0 0 0 0 0
Operating Yes 0 Opex Opex Opex Opex
MCLM OUTPUT R-OP-1.3
Maintain Efficient Water Treatment Infrastructures
Implimentation of Efficient Water Treatment Infrastructure Programmes
Target/measure % 0 100 100 100 100
Infra LM
HOD
RWCLM Executive
Mayor Capital N/A 0 0 0 0 0
Operating Yes 0 Opex Opex Opex Opex
RWCLM OUTPUT R-OP-1.3
Maintain Efficient Water Treatment Infrastructures
Implimentation of Efficient Water Treatment Infrastructure Programmes
Target/measure % 0 100 100 100 100
Infra LM
HOD
RWCLM Executive
Mayor Capital N/A 0 0 0 0 0
Operating Yes 0 Opex Opex Opex Opex
MFCLM OUTPUT F-OP-1.3
Maintain Efficient Water Treatment Infrastructures
Implimentation of Efficient Water Treatment Infrastructure Programmes
Target/measure % 0 100 100 100 100
Infra LM
HOD
MFCLM Executive
Mayor Capital N/A 0 0 0 0 0
Operating Yes 0 Opex Opex Opex Opex

249
Regional Output 1.4: Enhance the Effectiveness and Efficiency of the Indigent Programme
REGIONAL REGIONAL
OUTPUT T-OP-1.4
Enhance the Effectiveness and Efficiency of the Indigent Programme
% Implementation of Indigent
Programmes
Target/measure % 0 100 100 100 100
RPR WRDM
HOD
WRDM Executive
Mayor Capital N/A 0 0 0 0 0
Operating Yes 0 Opex Opex Opex Opex
WRDM OUTPUT W-OP-1.4
Enhance the Effectiveness and Efficiency of the Indigent Programme
Target/measure % 0 100 100 100 100
RPR WRDM
HOD
WRDM Executive
Mayor
Capital N/A 0 0 0 0 0
Operating Yes 0 Opex Opex Opex Opex
MCLM OUTPUT M-OP-1.4
Enhance the Effectiveness and Efficiency of the Indigent Programme
Target/measure % 0 100 100 100 100
Infra LM
HOD
MCLM Executive
Mayor
Capital N/A 0 0 0 0 0
Operating Yes 0 Opex Opex Opex Opex
RWCLM OUTPUT R-OP-1.4
Enhance the Effectiveness and Efficiency of the Indigent Programme
Target/measure % 0 100 100 100 100
Infra LM
HOD
RWCLM Executive
Mayor
Capital N/A 0 0 0 0 0
Operating Yes 0 Opex Opex Opex Opex
MFCLM OUTPUT F-OP-1.4
Enhance the Effectiveness and Efficiency of the Indigent Programme
Target/measure % 0 100 100 100 100
Infra LM
HOD
MFCLM Executive
Mayor Capital N/A 0 0 0 0 0

250
Operating Yes 0 Opex Opex Opex Opex
Regional Output 1.5: Provision of Reliable Electrical Supply
REGIONAL REGIONAL
OUTPUT T-OP-1.5
Provision of Reliable Electrical Supply
% Development and Implimentation of Electricity Master
Plan
Target/measure % 0 100 100 100 100
RPR WRDM
HOD
WRDM Executive
Mayor Capital N/A 0 0 0 0 0
Operating Yes 0 Opex Opex Opex Opex
WRDM OUTPUT W-OP-1.5
Provision of Reliable Electrical Supply
Target/measure % 0 100 100 100 100
RPR WRDM
HOD
WRDM Executive
Mayor Capital N/A 0 0 0 0 0
Operating Yes 0 Opex Opex Opex Opex
MCLM OUTPUT M-OP-1.5
Provision of Reliable Electrical Supply
Target/measure % 0 100 100 100 100
Infra LM
HOD
MCLM Executive
Mayor Capital N/A 0 0 0 0 0
Operating Yes 0 Opex Opex Opex Opex
RWCLM OUTPUT R-OP-1.5
Provision of Reliable Electrical Supply
Target/measure % 0 100 100 100 100
Infra LM
HOD
RWCLM Executive
Mayor Capital N/A 0 0 0 0 0
Operating Yes 0 Opex Opex Opex Opex
MFCLM OUTPUT F-OP-1.5
Provision of Reliable Electrical Supply
Target/measure % 0 100 100 100 100
Infra LM
HOD
MFCLM Executive
Mayor Capital N/A 0 0 0 0 0
Operating Yes 0 Opex Opex Opex Opex
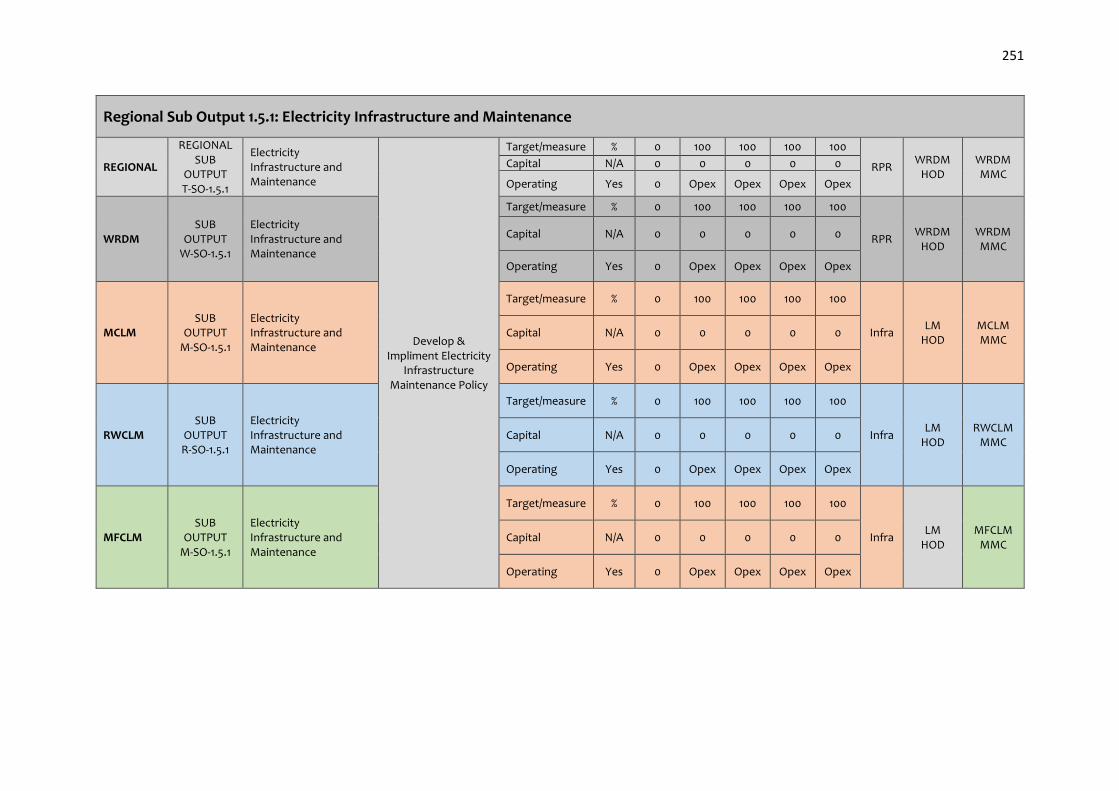
251
Regional Sub Output 1.5.1: Electricity Infrastructure and Maintenance
REGIONAL
REGIONAL SUB
OUTPUT T-SO-1.5.1
Electricity Infrastructure and Maintenance
Develop & Impliment Electricity
Infrastructure Maintenance Policy
Target/measure % 0 100 100 100 100
RPR WRDM
HOD WRDM MMC
Capital N/A 0 0 0 0 0
Operating Yes 0 Opex Opex Opex Opex
WRDM SUB
OUTPUT W-SO-1.5.1
Electricity Infrastructure and Maintenance
Target/measure % 0 100 100 100 100
RPR WRDM
HOD WRDM MMC
Capital N/A 0 0 0 0 0
Operating Yes 0 Opex Opex Opex Opex
MCLM SUB
OUTPUT M-SO-1.5.1
Electricity Infrastructure and Maintenance
Target/measure % 0 100 100 100 100
Infra LM
HOD MCLM MMC
Capital N/A 0 0 0 0 0
Operating Yes 0 Opex Opex Opex Opex
RWCLM SUB
OUTPUT R-SO-1.5.1
Electricity Infrastructure and Maintenance
Target/measure % 0 100 100 100 100
Infra LM
HOD RWCLM
MMC Capital N/A 0 0 0 0 0
Operating Yes 0 Opex Opex Opex Opex
MFCLM SUB
OUTPUT M-SO-1.5.1
Electricity Infrastructure and Maintenance
Target/measure % 0 100 100 100 100
Infra LM
HOD MFCLM
MMC Capital N/A 0 0 0 0 0
Operating Yes 0 Opex Opex Opex Opex

252
Regional Sub Output 1.5.2: Electricity Losses
REGIONAL
REGIONAL SUB
OUTPUT T-SO-1.5.2
Reduction of Electricity Losses
Develop and Impliment a Regional Electricity Loss Strategy
Target/measure % 0 100 100 100 100
RPR WRDM
HOD WRDM MMC
Capital N/A 0 0 0 0 0
Operating Yes 0 Opex Opex Opex Opex
WRDM SUB
OUTPUT W-SO-1.5.2
Reduction of Electricity Losses
Develop Regional Strategy to kerb Electricity Losses
Target/measure % 0 100 100 100 100
RPR WRDM
HOD WRDM MMC
Capital N/A 0 0 0 0 0
Operating Yes 0 Opex Opex Opex Opex
MCLM SUB
OUTPUT M-SO-1.5.2
Reduction of Electricity Losses
Implement Regional Strategy to kerb Electricity Losses
Target/measure % 0 100 100 100 100
Infra LM
HOD MCLM MMC
Capital N/A 0 0 0 0 0
Operating Yes 0 Opex Opex Opex Opex
RWCLM SUB
OUTPUT R-SO-1.5.2
Reduction of Electricity Losses
Implement Regional Strategy to kerb Electricity Losses
Target/measure % 0 100 100 100 100
Infra LM
HOD RWCLM
MMC Capital N/A 0 0 0 0 0
Operating Yes 0 Opex Opex Opex Opex
MFCLM SUB
OUTPUT M-SO-1.5.2
Reduction of Electricity Losses
Implement Regional Strategy to kerb Electricity Losses
Target/measure % 0 100 100 100 100
Infra LM
HOD MFCLM
MMC Capital N/A 0 0 0 0 0
Operating Yes 0 Opex Opex Opex Opex

253
Regional Output 1.6: Provision of Quality and Reliable Sanitation and Waste Management
REGIONAL REGIONAL
OUTPUT T-OP-1.6
Provision of Quality and Reliable Sanitation and Waste Management
Development & Implementation of
Sanitation and Waste Management
Framework Plan
Target/measure % 0 100 100 100 100
RPR WRDM
HOD
WRDM Executive
Mayor
Capital N/A 0 0 0 0 0
Operating Yes 0 Opex Opex Opex Opex
WRDM OUTPUT W-OP-1.6
Provision of Quality and Reliable Sanitation and Waste Management
Target/measure % 0 100 100 100 100
RPR WRDM
HOD
WRDM Executive
Mayor
Capital N/A 0 0 0 0 0
Operating Yes 0 Opex Opex Opex Opex
MCLM OUTPUT M-OP-1.6
Provision of Quality and Reliable Sanitation and Waste Management
Target/measure % 0 100 100 100 100
Infra LM
HOD
MCLM Executive
Mayor
Capital N/A 0 0 0 0 0
Operating Yes 0 Opex Opex Opex Opex
RWCLM OUTPUT R-OP-1.6
Provision of Quality and Reliable Sanitation and Waste Management
Target/measure % 0 100 100 100 100
Infra LM
HOD
RWCLM Executive
Mayor
Capital N/A 0 0 0 0 0
Operating Yes 0 Opex Opex Opex Opex
MFCLM OUTPUT F-OP-1.6
Provision of Quality and Reliable Sanitation and Waste Management
Target/measure % 0 100 100 100 100
Infra LM
HOD
MFCLM Executive
Mayor Capital N/A 0 0 0 0 0
Operating Yes 0 Opex Opex Opex Opex
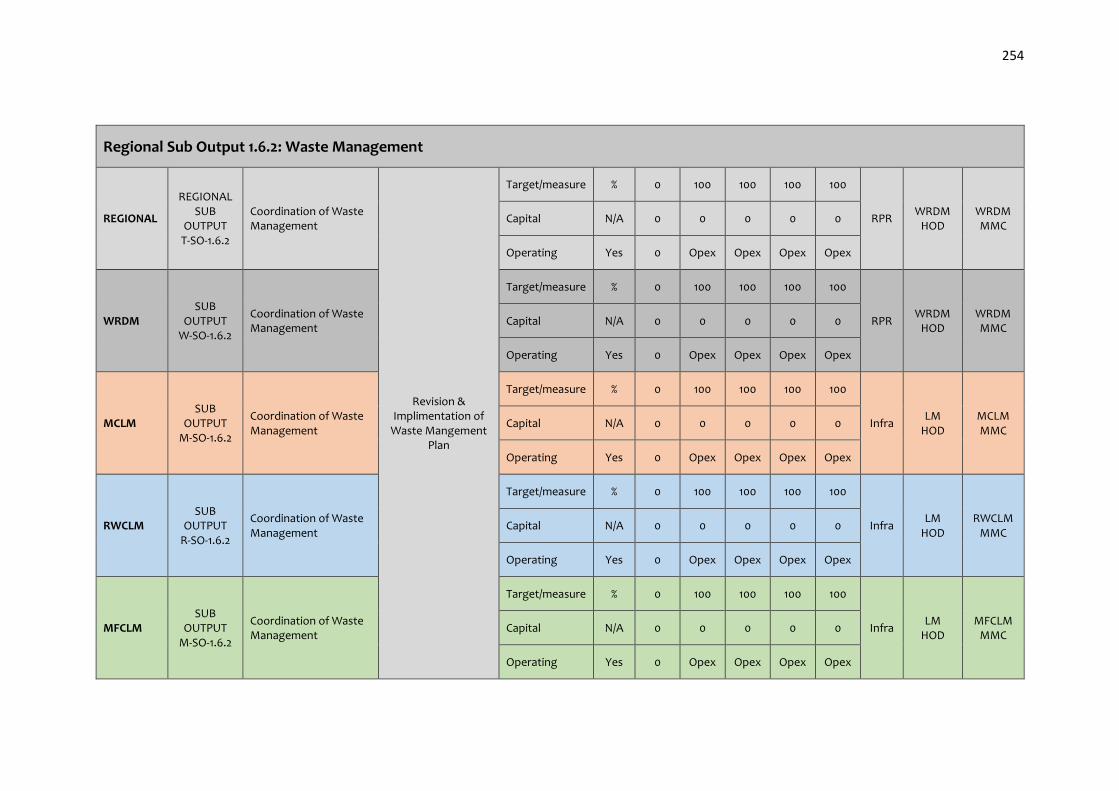
254
Regional Sub Output 1.6.2: Waste Management
REGIONAL
REGIONAL SUB
OUTPUT T-SO-1.6.2
Coordination of Waste Management
Revision & Implimentation of
Waste Mangement Plan
Target/measure % 0 100 100 100 100
RPR WRDM
HOD WRDM MMC
Capital N/A 0 0 0 0 0
Operating Yes 0 Opex Opex Opex Opex
WRDM SUB
OUTPUT W-SO-1.6.2
Coordination of Waste Management
Target/measure % 0 100 100 100 100
RPR WRDM
HOD WRDM MMC
Capital N/A 0 0 0 0 0
Operating Yes 0 Opex Opex Opex Opex
MCLM SUB
OUTPUT M-SO-1.6.2
Coordination of Waste Management
Target/measure % 0 100 100 100 100
Infra LM
HOD MCLM MMC
Capital N/A 0 0 0 0 0
Operating Yes 0 Opex Opex Opex Opex
RWCLM SUB
OUTPUT R-SO-1.6.2
Coordination of Waste Management
Target/measure % 0 100 100 100 100
Infra LM
HOD RWCLM
MMC Capital N/A 0 0 0 0 0
Operating Yes 0 Opex Opex Opex Opex
MFCLM SUB
OUTPUT M-SO-1.6.2
Coordination of Waste Management
Target/measure % 0 100 100 100 100
Infra LM
HOD MFCLM
MMC Capital N/A 0 0 0 0 0
Operating Yes 0 Opex Opex Opex Opex
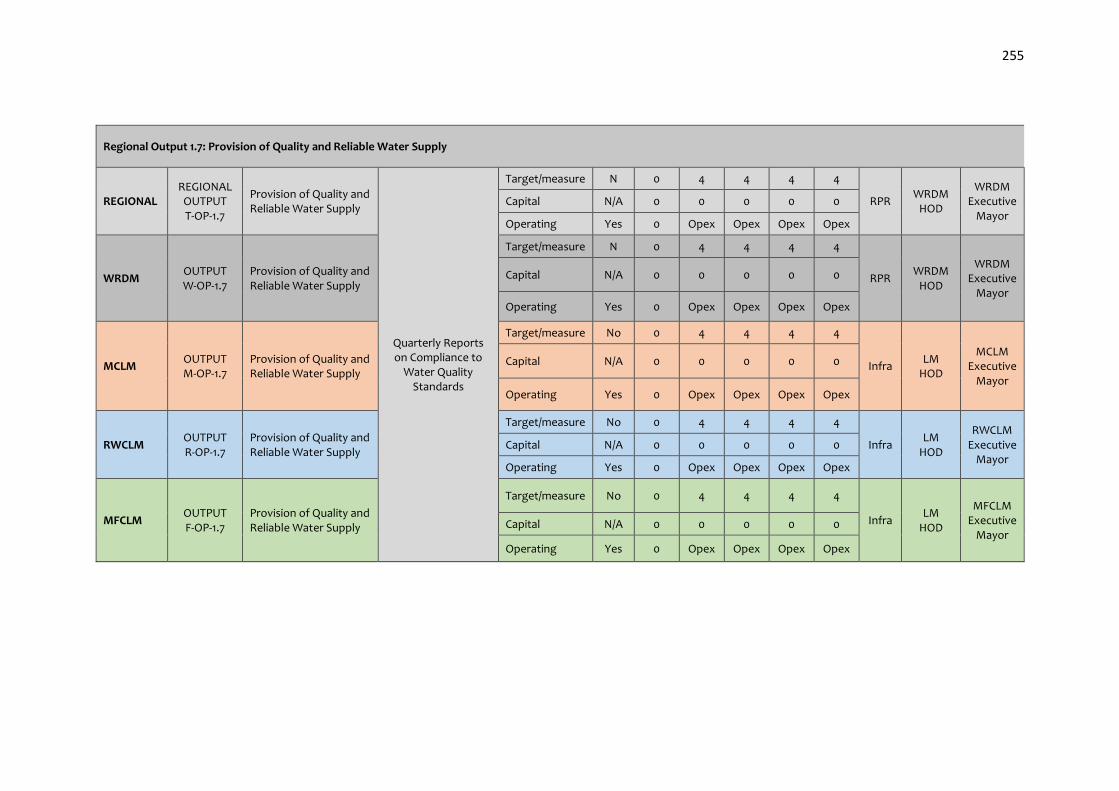
255
Regional Output 1.7: Provision of Quality and Reliable Water Supply
REGIONAL REGIONAL
OUTPUT T-OP-1.7
Provision of Quality and Reliable Water Supply
Quarterly Reports on Compliance to
Water Quality Standards
Target/measure N 0 4 4 4 4
RPR WRDM
HOD
WRDM Executive
Mayor Capital N/A 0 0 0 0 0
Operating Yes 0 Opex Opex Opex Opex
WRDM OUTPUT W-OP-1.7
Provision of Quality and Reliable Water Supply
Target/measure N 0 4 4 4 4
RPR WRDM
HOD
WRDM Executive
Mayor
Capital N/A 0 0 0 0 0
Operating Yes 0 Opex Opex Opex Opex
MCLM OUTPUT M-OP-1.7
Provision of Quality and Reliable Water Supply
Target/measure No 0 4 4 4 4
Infra LM
HOD
MCLM Executive
Mayor
Capital N/A 0 0 0 0 0
Operating Yes 0 Opex Opex Opex Opex
RWCLM OUTPUT R-OP-1.7
Provision of Quality and Reliable Water Supply
Target/measure No 0 4 4 4 4
Infra LM
HOD
RWCLM Executive
Mayor Capital N/A 0 0 0 0 0
Operating Yes 0 Opex Opex Opex Opex
MFCLM OUTPUT F-OP-1.7
Provision of Quality and Reliable Water Supply
Target/measure No 0 4 4 4 4
Infra LM
HOD
MFCLM Executive
Mayor Capital N/A 0 0 0 0 0
Operating Yes 0 Opex Opex Opex Opex

256
Regional Sub Output 1.7.3: Water Losses
REGIONAL
REGIONAL SUB
OUTPUT T-SO-1.7.3
Kerbing of Water Losses
Develop and Impliment a Regional Water Loss Strategy
Target/measure % 0 100 100 100 100
RPR WRDM
HOD WRDM MMC
Capital N/A 0 0 0 0 0
Operating Yes 0 Opex Opex Opex Opex
WRDM SUB
OUTPUT W-SO-1.7.3
Kerbing of Water Losses
Develop Regional Strategy to kerb Water Losses
Target/measure % 0 100 100 100 100
RPR WRDM
HOD WRDM MMC
Capital N/A 0 0 0 0 0
Operating Yes 0 Opex Opex Opex Opex
MCLM SUB
OUTPUT M-SO-1.7.3
Kerbing of Water Losses
Implement Regional Strategy to kerb Water Losses
Target/measure % 0 100 100 100 100
Infra LM
HOD MCLM MMC
Capital N/A 0 0 0 0 0
Operating Yes 0 Opex Opex Opex Opex
RWCLM SUB
OUTPUT R-SO-1.7.3
Kerbing of Water Losses
Implement Regional Strategy to kerb Water Losses
Target/measure % 0 100 100 100 100
Infra LM
HOD RWCLM
MMC Capital N/A 0 0 0 0 0
Operating Yes 0 Opex Opex Opex Opex
MFCLM SUB
OUTPUT M-SO-1.7.3
Kerbing of Water Losses
Implement Regional Strategy to kerb Water Losses
Target/measure % 0 100 100 100 100
Infra LM
HOD MFCLM
MMC Capital N/A 0 0 0 0 0
Operating Yes 0 Opex Opex Opex Opex

257
Regional Output 1.9: Reduce Outsourced Municipal Services
REGIONAL REGIONAL
OUTPUT T-OP-1.9
Reduce Outsourced Municipal Services
Audit on Municipal Capacity & Develop Strategy to Reduce
Outsourced Services
Target/measure % 0 0 0 100 100
RPR WRDM
HOD
WRDM Executive
Mayor
Capital N/A 0 0 0 0 0
Operating Yes 0 Opex Opex Opex Opex
WRDM OUTPUT W-OP-1.9
Reduce Outsourced Municipal Services
Target/measure % 0 0 0 100 100
RPR WRDM
HOD
WRDM Executive
Mayor
Capital N/A 0 0 0 0 0
Operating Yes 0 Opex Opex Opex Opex
MCLM OUTPUT M-OP-1.9
Reduce Outsourced Municipal Services
Target/measure % 0 100 100 100 100
Infra LM
HOD
MCLM Executive
Mayor
Capital N/A 0 0 0 0 0
Operating Yes 0 Opex Opex Opex Opex
RWCLM OUTPUT R-OP-1.9
Reduce Outsourced Municipal Services
Target/measure % 0 100 100 100 100
Infra LM
HOD
RWCLM Executive
Mayor
Capital N/A 0 0 0 0 0
Operating Yes 0 Opex Opex Opex Opex
MFCLM OUTPUT F-OP-1.9
Reduce Outsourced Municipal Services
Target/measure % 0 100 100 100 100
Infra LM
HOD
MFCLM Executive
Mayor Capital N/A 0 0 0 0 0
Operating Yes 0 Opex Opex Opex Opex

258
Regional Output 1.10: Service Delivery Master Plans
REGIONAL REGIONAL
OUTPUT T-OP-1.10
Master Planning
Review of Service Delivery Master
Plans
Target/measure % 0 0 0 100 100
RPR WRDM
HOD
WRDM Executive
Mayor
Capital N/A 0 0 0 0 0
Operating Yes 0 Opex Opex Opex Opex
WRDM OUTPUT
W-OP-1.10 Master Planning
Target/measure % 0 0 0 100 100
RPR WRDM
HOD
WRDM Executive
Mayor
Capital N/A 0 0 0 0 0
Operating Yes 0 Opex Opex Opex Opex
MCLM OUTPUT
M-OP-1.10 Master Planning
Target/measure % 0 100 100 100 100
Infra LM
HOD
MCLM Executive
Mayor
Capital N/A 0 0 0 0 0
Operating Yes 0 Opex Opex Opex Opex
RWCLM OUTPUT R-OP-1.10
Master Planning
Target/measure % 0 100 100 100 100
Infra LM
HOD
RWCLM Executive
Mayor
Capital N/A 0 0 0 0 0
Operating Yes 0 Opex Opex Opex Opex
MFCLM OUTPUT F-OP-1.10
Master Planning
Target/measure % 0 100 100 100 100
Infra LM
HOD
MFCLM Executive
Mayor Capital N/A 0 0 0 0 0
Operating Yes 0 Opex Opex Opex Opex

259
OUTCOME 2

260
Regional Outcome 2: Accountable Municipal Administration
Part 1: National and Provincial Alignment National Outcomes 9. A responsive, accountable, effective and efficient local government system;
Provincial 10 Pillars
1. Radical economic transformation 2. Decisive spatial transformation 3. Accelerating social transformation 4. Transformation of the State and governance 5. Modernisation of the economy 6.Modernisation of the public service and the state 7.Modernisation of human settlements and urban development. 8. Modernisation of public transport and other infrastructure 9.Re-industrialising Gauteng as our country’s economic hub 10.Taking a lead in Africa’s new industrial revolution.
Back to Basics Goals 1. Put People & Their Concerns First: Listen and Communicate 2. Deliver Municipal Services to Right Quality & Standard 3. Good Governance & Sound Administration 4. Sound Financial Management & Accounting
COGTA KPA's Good Governance and Public Participation
Part 2: Regional Five Year Game Changer Projects
Muni. Year 1
PROJECTS/ PROGRAMMES
Year 2 PROJECTS/
PROGRAMMES
Year 3 PROJECTS/
PROGRAMMES
Year 4 PROJECTS/
PROGRAMMES
Year 5 PROJECTS/
PROGRAMMES REFER TO SECTION G

261
Part 3: West Rand Regional Five Year Plan
MUNI. PLANNING
LEVEL PLANNING
STATEMENT INDICATOR TYPE UOM
Year 1
2016/ 17
Year 2 2017/
18
Year 3 2018/
19
Year 4 2019/
20
Year 5
2020/ 21
Administrative Political
DEPT RESP
PERSON OVER-SIGHT
Regional Outcome 2.0: Accountable Municipal Administration
REGION-AL
REGIONAL OUTCOME
T-O-2.0
Conduct initiatives to ensure accountable Municipal Administration within the West Rand Region
2.0 Number of initiatives conducted to ensure Accountable Municipal Administration
Target/measure Number 3 3 3 3 3
OMM WRDM
Executive Mayor
WRDM Executive
Mayor Capital N/A R - R - R - R - R -
Operating Yes Opex Opex Opex Opex Opex
WRDM OUTCOME
W-O-2.0
Target/measure Number 3 3 3 3 3
Office of Exec Mayor
WRDM Executive
Mayor
WRDM Executive
Mayor Capital N/A R - R - R - R - R -
Operating Yes Opex Opex Opex Opex Opex
MCLM OUTCOME
M-O-2.0
Target/measure Number 3 3 3 3 3
Office of Exec Mayor
MCLM Executive
Mayor
MCLM Executive
Mayor Capital N/A R - R - R - R - R -
Operating Yes Opex Opex Opex Opex Opex
RWCLM OUTCOME
R-O-2.0
Target/measure Number 3 3 3 3 3
Office of Exec Mayor
RWCLM Executive
Mayor
RWCLM Executive
Mayor Capital N/A R - R - R - R - R -
Operating Yes Opex Opex Opex Opex Opex
MFCLM OUTCOME
F-O-2.0
Target/measure Number 3 3 3 3 3
Office of Exec Mayor
MFCLM Executive
Mayor
MFCLM Executive
Mayor Capital N/A R - R - R - R - R -
Operating Yes Opex Opex Opex Opex Opex

262
Regional Output 2.1: Maintain Active Citizenry
REGIONAL REGIONAL
OUTPUT T-OP-2.1
Implement programmes to Maintain Active Citizenry
% Implementation of programmes to promote and maintain active citizenry
Target/measure
Percentag
e 100 100 100 100 100
OMM WRDM
MM
WRDM Executive
Mayor Capital N/A R - R - R - R - R -
Operating
Yes Opex Opex Opex Opex Opex
WRDM OUTPUT W-OP-2.1
Target/measure
Percentag
e 100 100 100 100 100 OMM
WRDM MM
WRDM Executive
Mayor
Capital N/A R - R - R - R - R -
Operating
Yes Opex Opex Opex Opex Opex
MCLM OUTPUT M-OP-2.1
Target/measure
Percentag
e 100 100 100 100 100 OMM
MCLM MM
MCLM Executive
Mayor
Capital N/A R - R - R - R - R -
Operating
Yes Opex Opex Opex Opex Opex
RWCLM OUTPUT R-OP-2.1
Target/measure
Percentag
e 100 100 100 100 100 OMM
RWCLM MM
RWCLM Executive
Mayor
Capital N/A R - R - R - R - R -
Operating
Yes Opex Opex Opex Opex Opex
MFCLM
OUTPUT F-OP-2.1
Target/measure
Percentag
e 100 100 100 100 100
OMM MFCLM
MM
MFCLM Executive
Mayor Capital N/A R - R - R - R - R -
Operating
Yes Opex Opex Opex Opex Opex

263
Regional Sub Output 2.1.1: Promote Sustainable Governance for Local Communities
REGIONAL
REGIONAL SUB
OUTPUT T-SO-2.1.1
Implement programmes to promote Sustainable Governance for Local Communities
% Implementation of programmes to promote Sustainable Governance for Local Communities
Target/measure Percentage 100 100 100 100 100
OMM WRDM
HOD WRDM MMC
Capital N/A R - R - R - R - R -
Operating Yes Opex Opex Opex Opex Opex
WRDM SUB
OUTPUT W-SO-2.1.1
Target/measure Percentage 100 100 100 100 100
OMM WRDM
HOD WRDM MMC
Capital N/A R - R - R - R - R -
Operating Yes Opex Opex Opex Opex Opex
MCLM SUB
OUTPUT M-SO-2.1.1
Target/measure Percentage 100 100 100 100 100
DEPT MCLM HOD
MCLM MMC
Capital N/A R - R - R - R - R -
Operating Yes Opex Opex Opex Opex Opex
RWCLM SUB
OUTPUT R-SO-2.1.1
Target/measure Percentage 100 100 100 100 100
DEPT RWCLM
HOD RWCLM
MMC
Capital N/A R - R - R - R - R -
Operating Yes Opex Opex Opex Opex Opex
MFCLM SUB
OUTPUT M-SO-2.1.1
Target/measure Percentage 100 100 100 100 100
DEPT MFCLM
HOD MFCLM
MMC Capital N/A R - R - R - R - R -
Operating Yes Opex Opex Opex Opex Opex

264
Regional Output 2.2: Strengthen Councillor Accountability
REGIONAL REGIONAL
OUTPUT T-OP-2.2
Implement programmes to Strengthen Councillor Accountability
% implementation of programmes to Strengthen Councillor Accountability
Target/measure Percentage 100 100 100 100 100
OMM WRDM
MM
WRDM Executive
Mayor Capital N/A R - R - R - R - R -
Operating Yes Opex Opex Opex Opex Opex
WRDM OUTPUT W-OP-2.2
Target/measure Percentage 100 100 100 100 100
OMM WRDM
MM
WRDM Executive
Mayor Capital N/A R - R - R - R - R -
Operating Yes Opex Opex Opex Opex Opex
MCLM OUTPUT M-OP-2.2
Target/measure Percentage 100 100 100 100 100
OMM MCLM
MM
MCLM Executive
Mayor
Capital N/A
R - R - R - R - R -
Operating Yes Opex Opex Opex Opex Opex
RWCLM OUTPUT R-OP-2.2
Target/measure Percentage 100 100 100 100 100
OMM RWCLM
MM
RWCLM Executive
Mayor
Capital N/A R - R - R - R - R -
Operating Yes Opex Opex Opex Opex Opex
MFCLM OUTPUT F-OP-2.2
Target/measure Percentage 100 100 100 100 100
OMM MFCLM
MM
MFCLM Executive
Mayor
Capital N/A R - R - R - R - R -
Operating Yes Opex Opex Opex Opex Opex
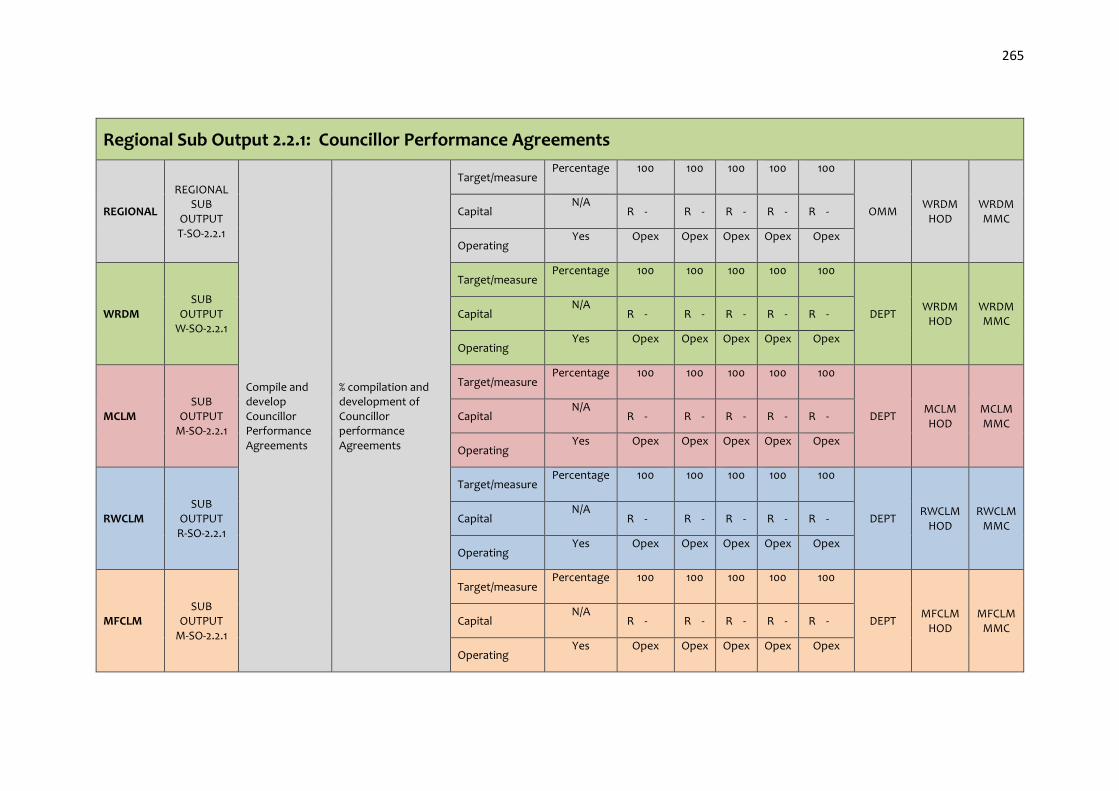
265
Regional Sub Output 2.2.1: Councillor Performance Agreements
REGIONAL
REGIONAL SUB
OUTPUT T-SO-2.2.1
Compile and develop Councillor Performance Agreements
% compilation and development of Councillor performance Agreements
Target/measure Percentage 100 100 100 100 100
OMM WRDM
HOD WRDM MMC
Capital N/A
R - R - R - R - R -
Operating Yes Opex Opex Opex Opex Opex
WRDM SUB
OUTPUT W-SO-2.2.1
Target/measure Percentage 100 100 100 100 100
DEPT WRDM
HOD WRDM MMC
Capital N/A
R - R - R - R - R -
Operating Yes Opex Opex Opex Opex Opex
MCLM SUB
OUTPUT M-SO-2.2.1
Target/measure Percentage 100 100 100 100 100
DEPT MCLM HOD
MCLM MMC
Capital N/A
R - R - R - R - R -
Operating Yes Opex Opex Opex Opex Opex
RWCLM SUB
OUTPUT R-SO-2.2.1
Target/measure Percentage 100 100 100 100 100
DEPT RWCLM
HOD RWCLM
MMC Capital
N/A R - R - R - R - R -
Operating Yes Opex Opex Opex Opex Opex
MFCLM SUB
OUTPUT M-SO-2.2.1
Target/measure Percentage 100 100 100 100 100
DEPT MFCLM
HOD MFCLM
MMC Capital
N/A R - R - R - R - R -
Operating Yes Opex Opex Opex Opex Opex

266
Regional Sub Output 2.2.3: Functional and Robust Section 79 Committees (Performance Audit Committee, Risk Committee, Audit Committee, MPAC, etc.)
REGIONAL
REGIONAL SUB
OUTPUT T-SO-2.2.3
Functional and Robust Section 79 Committees (Performance Audit Committee, Risk Committee, Audit Committee, MPAC, etc.)
1. Quarterly AC/PAC/RMC meetings held. 2. % Implementation of resolutions.
Target/measure Number 16 16 16 16 16
OMM WRDM
Manager IA
WRDM Exec
Mayor
% 100 100 100 100 100
Capital N/A R - R - R - R - R -
Operating Yes Opex Opex Opex Opex Opex
WRDM SUB
OUTPUT W-SO-2.2.3
Target/measure Number 16 16 16 16 16
OMM Manager
IA Exec
Mayor
% 100 100 100 100 100
Capital N/A R - R - R - R - R -
Operating Yes Opex Opex Opex Opex Opex
MCLM SUB
OUTPUT M-SO-2.2.3
Target/measure Number 16 16 16 16 16
OMM CAE Exec
Mayor % 100 100 100 100 100
Capital N/A R - R - R - R - R -
Operating Yes Opex Opex Opex Opex Opex
RWCLM SUB
OUTPUT R-SO-2.2.3
Target/measure Number 16 16 16 16 16
OMM CAE Exec
Mayor % 100 100 100 100 100
Capital N/A R - R - R - R - R -
Operating Yes Opex Opex Opex Opex Opex
MFCLM SUB
OUTPUT M-SO-2.2.3
Target/measure Number 16 16 16 16 16
OMM Manager
IA Exec
Mayor
% 100 100 100 100 100
Capital N/A R - R - R - R - R -
Operating Yes Opex Opex Opex Opex Opex

267
Regional Sub Output 2.3.1: Legislative Compliance & Governance
REGIONAL
REGIONAL SUB
OUTPUT T-SO-2.3.1
Legislative Compliance & Governance
No of Compliance reports submitted
Target/measure Number 4 4 4 4 4
OMM WRDM
HOD WRDM MMC
Capital N/A R - R - R - R - R -
Operating Yes Opex Opex Opex Opex Opex
WRDM SUB
OUTPUT W-SO-2.3.1
Target/measure No 4 4 4 4 4
CS WRDM
HOD WRDM MMC
Capital N/A R - R - R - R - R -
Operating Yes Opex Opex Opex Opex Opex
MCLM SUB
OUTPUT M-SO-2.3.1
Target/measure No 4 4 4 4 4
CS MCLM HOD
MCLM MMC
Capital N/A R - R - R - R - R -
Operating Yes Opex Opex Opex Opex Opex
RWCLM SUB
OUTPUT R-SO-2.3.1
Target/measure No 4 4 4 4 4
CS RWCLM
HOD RWCLM
MMC Capital N/A R - R - R - R - R -
Operating Yes Opex Opex Opex Opex Opex
MFCLM SUB
OUTPUT M-SO-2.3.1
Target/measure No 4 4 4 4 4
CS MFCLM
HOD MFCLM
MMC Capital N/A R - R - R - R - R -
Operating Yes Opex Opex Opex Opex Opex

268
OUTCOME 3

269
Regional Outcome 3: Skilled, Capacitated , Competent and Motivated Workforce
Part 1: National and Provincial Alignment
National Outcomes 5. A skilled and capable workforce to support an inclusive growth path; 9. A responsive, accountable, effective and efficient local government system;
Provincial 10 Pillars
1. Radical economic transformation 2. Decisive spatial transformation 3. Accelerating social transformation 4. Transformation of the State and governance 5. Modernisation of the economy 6.Modernisation of the public service and the state 7.Modernisation of human settlements and urban development 8. Modernisation of public transport and other infrastructure 9.Re-industrialising Gauteng as our country’s economic hub 10.Taking a lead in Africa’s new industrial revolution.
Back to Basics Goals 1. Put People & Their Concerns First: Listen and Communicate 2. Deliver Municipal Services to Right Quality & Standard 3. Good Governance & Sound Administration 4. Sound Financial Management & Accounting
COGTA KPA's Institutional Transformation & Organisational Development
Strategic Goal Business Excellence within the WRDM
Part 2: Regional Five Year Game Changer Projects
Year 1 PROJECTS/ PROGRAMMES
Year 2 PROJECTS/ PROGRAMMES
Year 3 PROJECTS/
PROGRAMMES
Year 4 PROJECTS/
PROGRAMMES
Year 5 PROJECTS/
PROGRAMMES
REFER TO SECTION G
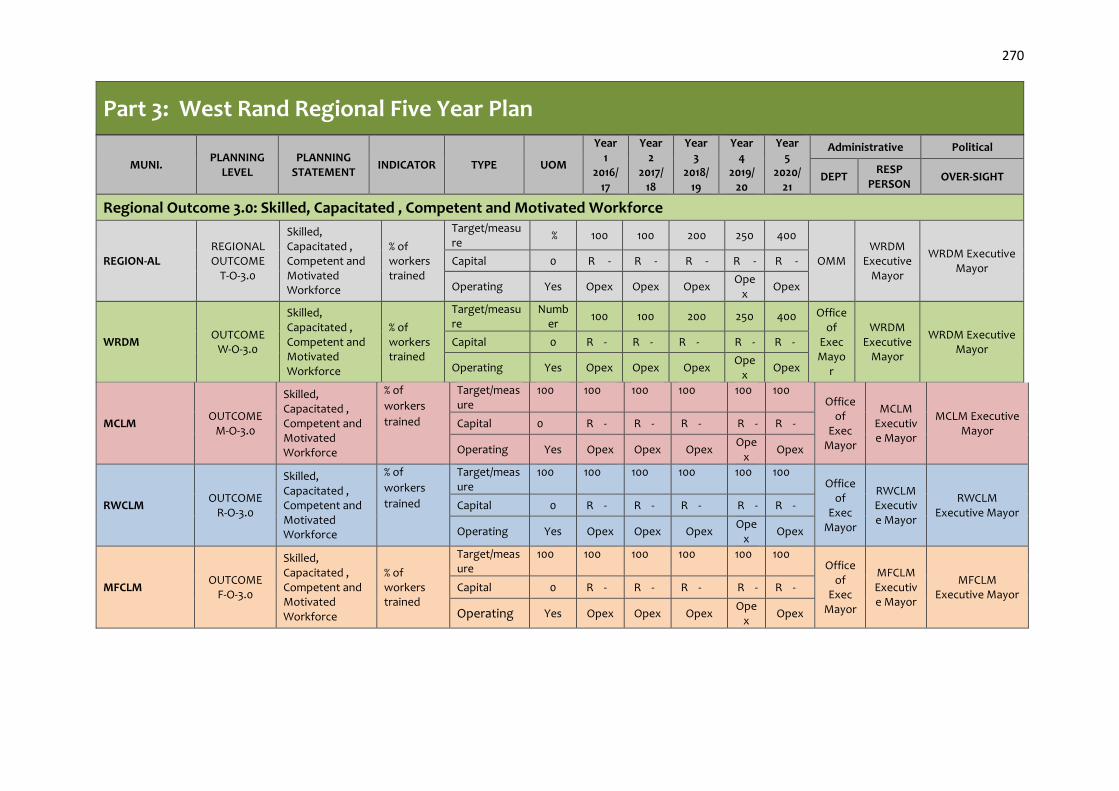
270
Part 3: West Rand Regional Five Year Plan
MUNI. PLANNING
LEVEL PLANNING
STATEMENT INDICATOR TYPE UOM
Year 1
2016/ 17
Year 2
2017/ 18
Year 3
2018/ 19
Year 4
2019/ 20
Year 5
2020/ 21
Administrative Political
DEPT RESP
PERSON OVER-SIGHT
Regional Outcome 3.0: Skilled, Capacitated , Competent and Motivated Workforce
REGION-AL REGIONAL OUTCOME
T-O-3.0
Skilled, Capacitated , Competent and Motivated Workforce
% of workers trained
Target/measure
% 100 100 200 250 400
OMM WRDM
Executive Mayor
WRDM Executive Mayor
Capital 0 R - R - R - R - R -
Operating Yes Opex Opex Opex Ope
x Opex
WRDM OUTCOME
W-O-3.0
Skilled, Capacitated , Competent and Motivated Workforce
% of workers trained
Target/measure
Number
100 100 200 250 400 Office of
Exec Mayo
r
WRDM Executive
Mayor
WRDM Executive Mayor
Capital 0 R - R - R - R - R -
Operating Yes Opex Opex Opex Ope
x Opex
MCLM OUTCOME
M-O-3.0
Skilled, Capacitated , Competent and Motivated Workforce
% of
workers
trained
Target/measure
100 100 100 100 100 100 Office
of Exec
Mayor
MCLM Executive Mayor
MCLM Executive Mayor
Capital 0 R - R - R - R - R -
Operating Yes Opex Opex Opex Ope
x Opex
RWCLM OUTCOME
R-O-3.0
Skilled, Capacitated , Competent and Motivated Workforce
% of
workers
trained
Target/measure
100 100 100 100 100 100 Office
of Exec
Mayor
RWCLM Executive Mayor
RWCLM Executive Mayor
Capital 0 R - R - R - R - R -
Operating Yes Opex Opex Opex Ope
x Opex
MFCLM OUTCOME
F-O-3.0
Skilled, Capacitated , Competent and Motivated Workforce
% of workers trained
Target/measure
100 100 100 100 100 100 Office
of Exec
Mayor
MFCLM Executive Mayor
MFCLM Executive Mayor
Capital 0 R - R - R - R - R -
Operating Yes Opex Opex Opex Ope
x Opex
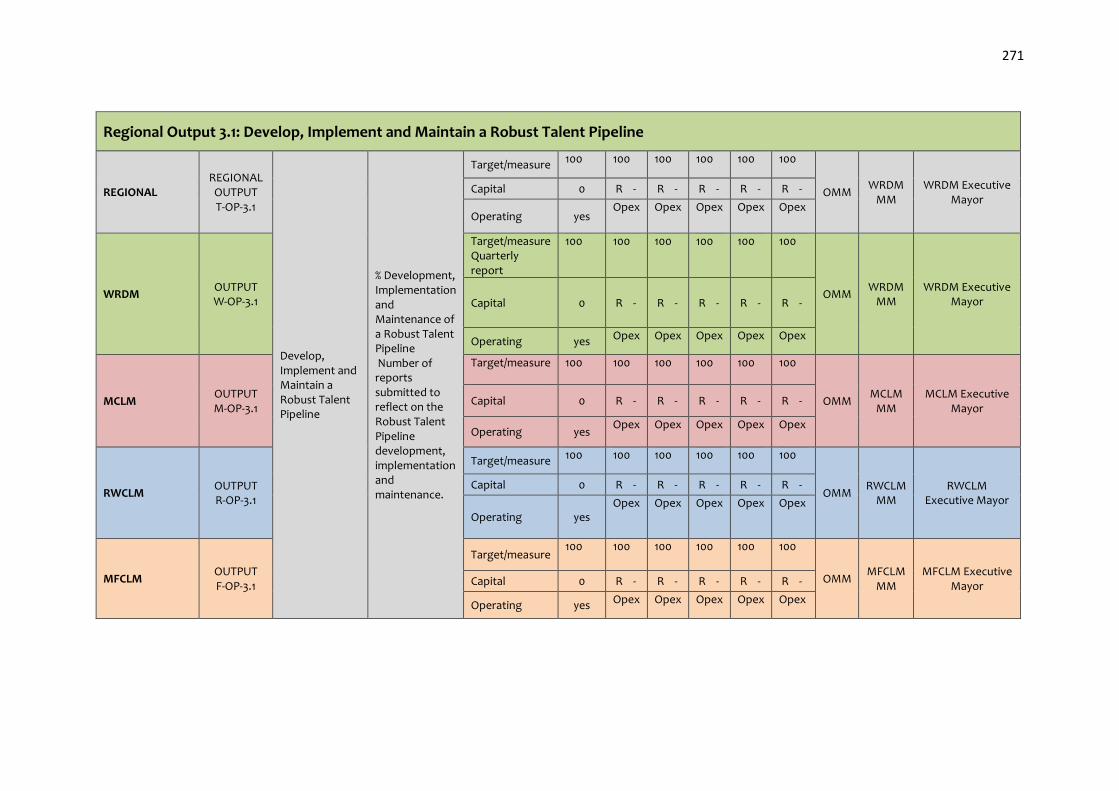
271
Regional Output 3.1: Develop, Implement and Maintain a Robust Talent Pipeline
REGIONAL REGIONAL
OUTPUT T-OP-3.1
Develop, Implement and Maintain a Robust Talent Pipeline
% Development, Implementation and Maintenance of a Robust Talent Pipeline Number of reports submitted to reflect on the Robust Talent Pipeline development, implementation and maintenance.
Target/measure 100 100 100 100 100 100
OMM WRDM
MM WRDM Executive
Mayor Capital 0 R - R - R - R - R -
Operating yes Opex Opex Opex Opex Opex
WRDM OUTPUT W-OP-3.1
Target/measure Quarterly report
100 100 100 100 100 100
OMM WRDM
MM WRDM Executive
Mayor Capital 0 R - R - R - R - R -
Operating yes Opex Opex Opex Opex Opex
MCLM OUTPUT M-OP-3.1
Target/measure
100 100 100 100 100 100
OMM MCLM
MM MCLM Executive
Mayor Capital 0 R - R - R - R - R -
Operating yes Opex Opex Opex Opex Opex
RWCLM OUTPUT R-OP-3.1
Target/measure 100 100 100 100 100 100
OMM RWCLM
MM RWCLM
Executive Mayor
Capital 0 R - R - R - R - R -
Operating yes Opex Opex Opex Opex Opex
MFCLM OUTPUT F-OP-3.1
Target/measure 100 100 100 100 100 100
OMM MFCLM
MM MFCLM Executive
Mayor Capital 0 R - R - R - R - R -
Operating yes Opex Opex Opex Opex Opex

272
Regional Sub Output 3.1.1: Lean Organisational Structure
REGIONAL
REGIONAL SUB
OUTPUT T-SO-3.1.1
Lean Organisational Structure aligned to the strategy
Annual review of the structure
Target/measure Number 1 1 1 1 1
OMM WRDM
HOD WRDM MMC
Capital N/A R - R - R - R - R -
Operating Yes Opex Opex Opex Opex Opex
WRDM SUB
OUTPUT W-SO-3.1.1
Lean Organisational Structure aligned to the strategy
Annual review of the structure
Target/measure Number 1 1 1 1 1
OMM/ CS
WRDM HOD
WRDM MMC
Capital 0 R - R - R - R - R -
Operating Yes Opex Opex Opex Opex Opex
MCLM SUB
OUTPUT M-SO-3.1.1
Lean Organisational Structure aligned to the strategy
Annual review of the structure
Target/measure Number 1 1 1 1 1
OMM/ CS
MCLM HOD
MCLM MMC
Capital 0 R - R - R - R - R -
Operating Yes Opex Opex Opex Opex Opex
RWCLM SUB
OUTPUT R-SO-3.1.1
Lean Organisational Structure aligned to the strategy
Annual review of the structure
Target/measure 1 1 1 1 1 1
OMM/ CS
RWCLM HOD
RWCLM MMC
Capital 0 R - R - R - R - R -
Operating Yes Opex Opex Opex Opex Opex
MFCLM SUB
OUTPUT M-SO-3.1.1
Lean Organisational Structure aligned to the strategy
Annual review of the structure
Target/measure Number 1 1 1 1 1
OMM/ CS
MFCLM HOD
MFCLM MMC
Capital 0 R - R - R - R - R -
Operating Yes Opex Opex Opex Opex Opex

273
Regional Sub Output 3.1.2: Job Descriptions
REGIONAL
REGIONAL SUB
OUTPUT T-SO-3.1.2
Completion of Regional Job Profile project
% development of job profiles
Target/measure Percentage 100 100 100 100 100
OMM WRDM
HOD WRDM MMC
Capital 0 R - R - R - R - R -
Operating Yes Opex Opex Opex Opex Opex
WRDM SUB
OUTPUT W-SO-3.1.2
Completion of Regional Job Profile project
% development of job profiles
Target/measure Percentage 100 100 100 100 100
CS WRDM
HOD WRDM MMC
Capital 0 R - R - R - R - R -
Operating Yes Opex Opex Opex Opex Opex
MCLM SUB
OUTPUT M-SO-3.1.2
Completion of Regional Job Profile project
% development of job profiles Number of reports on job profile competent.
Target/measure Quarterly report
Percentage 100 100 100 100 100
CS MCLM HOD
MCLM MMC Capital 0 R - R - R - R - R -
Operating Yes Opex Opex Opex Opex Opex
RWCLM SUB
OUTPUT R-SO-3.1.2
Completion of Regional Job Profile project
% development of job profiles
Target/measure Percentage 100 100 100 100 100
CS RWCLM
HOD RWCLM
MMC Capital 0 R - R - R - R - R -
Operating Yes Opex Opex Opex Opex Opex
MFCLM SUB
OUTPUT M-SO-3.1.2
Completion of Regional Job Profile project
% development of job profiles
Target/measure Percentage 100 100 100 100 100
HC MFCLM
HOD MFCLM
MMC Capital 0 R - R - R - R - R -
Operating Yes Opex Opex Opex Opex Opex

274
Regional Sub Output 3.1.3: Attraction, Recruitment, Deployment and Retention
REGIONAL
REGIONAL SUB
OUTPUT T-SO-3.1.3
Attraction, Recruitment, Deployment and Retention
% funded positions filled
Target/measure Percentage 100 100 100 100 100
OMM WRDM
HOD WRDM MMC
Capital 0 R - R - R - R - R -
Operating Yes Opex Opex Opex Opex Opex
WRDM SUB
OUTPUT W-SO-3.1.3
Attraction, Recruitment, Deployment and Retention
% funded positions filled Number of reports reflecting of funded positions filled.
Target/measure Quarterly report
% 100 100 100 100 100
CS WRDM
HOD WRDM MMC Capital 0 R - R - R - R - R -
Operating Yes Opex Opex Opex Opex Opex
MCLM SUB
OUTPUT M-SO-3.1.3
Attraction, Recruitment, Deployment and Retention
% funded positions filled
Target/measure Percentage 100 100 100 100 100
CS MCLM HOD
MCLM MMC
Capital 0 R - R - R - R - R -
Operating Yes Opex Opex Opex Opex Opex
RWCLM SUB
OUTPUT R-SO-3.1.3
Attraction, Recruitment, Deployment and Retention
% funded positions filled
Target/measure Percentage 100 100 100 100 100
CS RWCLM
HOD RWCLM
MMC Capital 0 R - R - R - R - R -
Operating Yes Opex Opex Opex Opex Opex
MFCLM SUB
OUTPUT M-SO-3.1.3
Attraction, Recruitment, Deployment and Retention
% funded positions filled
Target/measure Percentage 100 100 100 100 100
HC MFCLM
HOD MFCLM
MMC Capital 0 R - R - R - R - R -
Operating Yes Opex Opex Opex Opex Opex

275
Regional Sub Output 3.1.4: Attraction, Recruitment, Deployment and Retention
REGIONAL
REGIONAL SUB
OUTPUT T-SO-3.1.3
Development of a Regional Retention Strategy
% Development and Implementation of Regional Retention Strategy
Target/measure Percentage 100 100 100 100 100
OMM WRDM
HOD WRDM MMC
Capital 0 R - R - R - R - R -
Operating yes Opex Opex Opex Opex Opex
WRDM SUB
OUTPUT W-SO-3.1.3
Development of a Regional Retention Strategy
% Development and Implementation of Regional Retention Strategy Number of reports on the implementation of the Retention Strategy.
Target/measure Quarterly report
Percentage
100 100 100 100 100
CS WRDM
HOD WRDM MMC
Capital 0 R - R - R - R - R -
Operating yes Opex Opex Opex Opex Opex
MCLM SUB
OUTPUT M-SO-3.1.3
Development of a Regional Retention Strategy
% Development and Implementation of Regional Retention Strategy
Target/measure Percentage
100 100 100 100 100
CS MCLM HOD
MCLM MMC Capital 0 R - R - R - R - R -
Operating yes Opex Opex Opex Opex Opex
RWCLM SUB
OUTPUT R-SO-3.1.3
Development of a Regional Retention Strategy
% Development and Implementation of Regional Retention Strategy
Target/measure Percentage
100 100 100 100 100
CS RWCLM
HOD RWCLM
MMC Capital 0 R - R - R - R - R -
Operating yes Opex Opex Opex Opex Opex
MFCLM SUB
OUTPUT M-SO-3.1.3
Development of a Regional Retention Strategy
% Development and Implementation of Regional
Target/measure Percentage 100 100 100 100 100
HC MFCLM
HOD MFCLM
MMC Capital 0 R - R - R - R - R -

276
Retention Strategy
Operating yes Opex Opex Opex Opex Opex
Regional Sub Output 3.1.4: Employees skilled on Core competencies
REGIONAL
REGIONAL SUB
OUTPUT T-SO-3.1.4
Employees skilled on Core competencies
% of staff meeting competency requirements
Target/measure Percentage 100 100 100 100
100
OMM WRDM
HOD WRDM MMC Capital 0 R - R - R - R - R -
Operating Yes Opex Opex Opex Opex Opex
WRDM SUB
OUTPUT W-SO-3.1.4
Employees skilled on Core competencies
% of staff meeting competency requirements Number of Finance and Supply Chain staff meeting competency requirements.
Target/measure Quarterly report
Percentage 100 100 100 100
100
CS WRDM
HOD WRDM MMC
Capital 0 R - R - R - R - R -
Operating Yes Opex Opex Opex Opex Opex
MCLM SUB
OUTPUT M-SO-3.1.4
Employees skilled on Core competencies
% of staff meeting competency requirements
Target/measure Percentage 100 100 100 100
100
CS MCLM HOD
MCLM MMC Capital 0 R - R - R - R - R -
Operating Yes Opex Opex Opex Opex Opex
RWCLM SUB
OUTPUT R-SO-3.1.4
Employees skilled on Core competencies
% of staff meeting competency requirements
Target/measure Percentage 100 100 100 100
100
CS RWCLM
HOD RWCLM
MMC Capital 0 R - R - R - R - R -
Operating Yes Opex Opex Opex Opex Opex
MFCLM SUB
OUTPUT M-SO-3.1.4
Employees skilled on Core competencies
% of staff meeting competency requirements
Target/measure Percentage 100 100 100 100
100
CS MFCLM
HOD MFCLM
MMC Capital 0 R - R - R - R - R -
Operating Yes Opex Opex Opex Opex Opex

277
Regional Sub Output 3.1.5: Employee Performance Management
REGIONAL
REGIONAL SUB
OUTPUT T-SO-3.1.5
Employee Performance Management
Number of employee performance dashboards developed
Target/measure Number 1 1 1 1 1
OMM WRDM
HOD
WRDM MMC
Capital 0 R - R - R - R - R -
Operating Yes Opex Opex Opex Opex Opex
WRDM SUB
OUTPUT W-SO-3.1.5
Target/measure Number 1 1 1 1 1
.
WRDM Manager:
IDP & PMS
WRDM MMC
Capital 0 R - R - R - R - R -
Operating Yes Opex Opex Opex Opex Opex
MCLM SUB
OUTPUT M-SO-3.1.5
Target/measure Number 1 1 1 1 1
. MCLM HOD
MCLM MMC
Capital 0 R - R - R - R - R -
Operating Yes Opex Opex Opex Opex Opex
RWCLM SUB
OUTPUT R-SO-3.1.5
Target/measure Number 1 1 1 1 1
. RWCLM
HOD RWCLM
MMC Capital 0 R - R - R - R - R -
Operating Yes Opex Opex Opex Opex Opex
MFCLM SUB
OUTPUT M-SO-3.1.5
Target/measure Number 1 1 1 1 1
. MFCLM
HOD MFCLM
MMC
Capital 0 R - R - R - R - R -
Operating Yes Opex Opex Opex Opex Opex
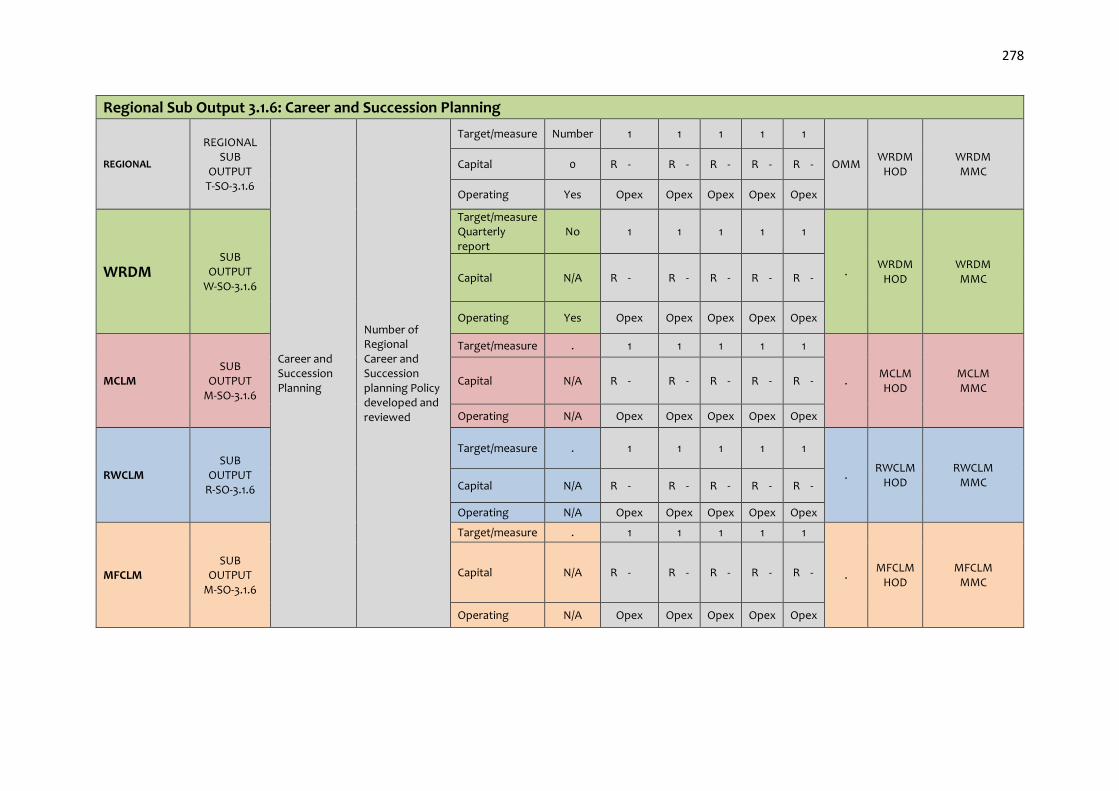
278
Regional Sub Output 3.1.6: Career and Succession Planning
REGIONAL
REGIONAL SUB
OUTPUT T-SO-3.1.6
Career and Succession Planning
Number of Regional Career and Succession planning Policy developed and reviewed
Target/measure Number 1 1 1 1 1
OMM WRDM
HOD WRDM MMC
Capital 0 R - R - R - R - R -
Operating Yes Opex Opex Opex Opex Opex
WRDM SUB
OUTPUT W-SO-3.1.6
Target/measure Quarterly report
No 1 1 1 1 1
. WRDM
HOD WRDM MMC Capital N/A R - R - R - R - R -
Operating Yes Opex Opex Opex Opex Opex
MCLM SUB
OUTPUT M-SO-3.1.6
Target/measure . 1 1 1 1 1
. MCLM HOD
MCLM MMC
Capital N/A R - R - R - R - R -
Operating N/A Opex Opex Opex Opex Opex
RWCLM SUB
OUTPUT R-SO-3.1.6
Target/measure . 1 1 1 1 1
. RWCLM
HOD RWCLM
MMC Capital N/A R - R - R - R - R -
Operating N/A Opex Opex Opex Opex Opex
MFCLM SUB
OUTPUT M-SO-3.1.6
Target/measure . 1 1 1 1 1
. MFCLM
HOD MFCLM
MMC Capital N/A R - R - R - R - R -
Operating N/A Opex Opex Opex Opex Opex

279
Regional Sub Output 3.1.7: Sound Labour Relations Management
REGIONAL REGIONAL
SUB OUTPUT T-SO-3.1.7
Improved Labour Relations Management
No of reports on Employee relations produced
Target/measure Number 12 12 12 12 12
OMM WRDM
HOD WRDM MMC
Capital N/A R - R - R - R - R -
Operating Yes Opex Opex Opex Opex Opex
WRDM SUB OUTPUT
W-SO-3.1.7
Improved Labour Relations Management
No of reports on Employee relations.
Target/measure Quarterly report on employee relations
Number 12 12 12 12 12
CS WRDM
HOD WRDM MMC
Capital N/A R - R - R - R - R -
Operating Yea Opex Opex Opex Opex Opex
MCLM SUB OUTPUT
M-SO-3.1.7
Improved Labour Relations Management
No of reports on Employee relations produced
Target/measure Number 12 12 12 12 12
CS MCLM HOD
MCLM MMC
Capital N/A R - R - R - R - R -
Operating Yes Opex Opex Opex Opex Opex
RWCLM SUB OUTPUT
R-SO-3.1.7
Improved Labour Relations Management
No of reports on Employee relations produced
Target/measure Number 12 12 12 12 12
CS RWCLM
HOD RWCLM
MMC Capital N/A R - R - R - R - R -
Operating Yes Opex Opex Opex Opex Opex
MFCLM SUB OUTPUT
M-SO-3.1.7
Improved Labour Relations Management
No of reports on Employee relations produced
Target/measure Number 12 12 12 12 12
CS MFCLM
HOD MFCLM
MMC Capital N/A R - R - R - R - R -
Operating Yes Opex Opex Opex Opex Opex
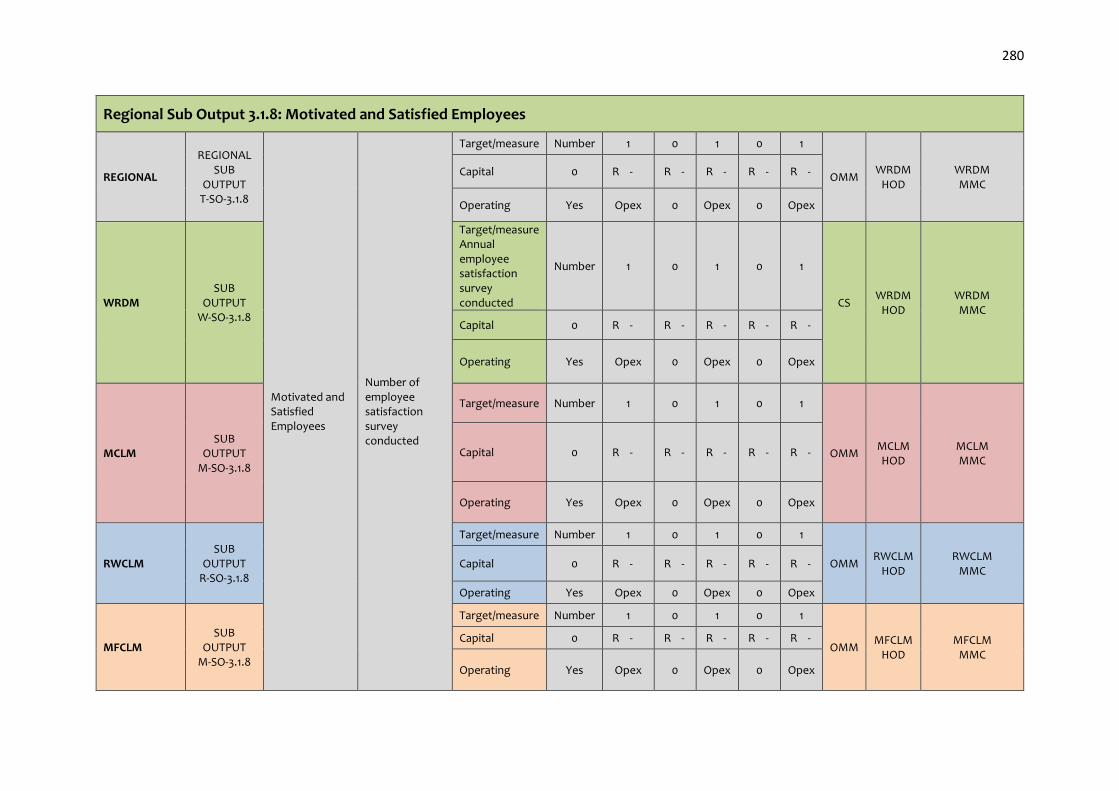
280
Regional Sub Output 3.1.8: Motivated and Satisfied Employees
REGIONAL
REGIONAL SUB
OUTPUT T-SO-3.1.8
Motivated and Satisfied Employees
Number of employee satisfaction survey conducted
Target/measure Number 1 0 1 0 1
OMM WRDM
HOD WRDM MMC
Capital 0 R - R - R - R - R -
Operating Yes Opex 0 Opex 0 Opex
WRDM SUB
OUTPUT W-SO-3.1.8
Target/measure Annual employee satisfaction survey conducted
Number 1 0 1 0 1
CS WRDM
HOD WRDM MMC
Capital 0 R - R - R - R - R -
Operating Yes Opex 0 Opex 0 Opex
MCLM SUB
OUTPUT M-SO-3.1.8
Target/measure Number 1 0 1 0 1
OMM MCLM HOD
MCLM MMC
Capital 0 R - R - R - R - R -
Operating Yes Opex 0 Opex 0 Opex
RWCLM SUB
OUTPUT R-SO-3.1.8
Target/measure Number 1 0 1 0 1
OMM RWCLM
HOD RWCLM
MMC Capital 0 R - R - R - R - R -
Operating Yes Opex 0 Opex 0 Opex
MFCLM SUB
OUTPUT M-SO-3.1.8
Target/measure Number 1 0 1 0 1
OMM MFCLM
HOD MFCLM
MMC
Capital 0 R - R - R - R - R -
Operating Yes Opex 0 Opex 0 Opex

281
Regional Sub Output 3.1.9: Employee Safety and Wellness
REGIONAL REGIONAL
SUB OUTPUT T-SO-3.1.9
Employee Safety and Wellness
No of OHS Compliance audits conducted
Target/measure Number 4 4 4 4 4
OMM
WRDM HOD
WRDM MMC Capital N/A R - R - R - R - R -
Operating Yes Opex Opex Opex Opex Opex
WRDM SUB OUTPUT
W-SO-3.1.9
Employee Safety and Wellness
No of OHS Compliance audits conducted
Target/measure Quarterly OHS compliance audit report
Number 4 4 4 4 4
CS WRDM
HOD WRDM MMC
Capital N/A R - R - R - R - R -
Operating Yes Opex Opex Opex Opex Opex
MCLM SUB OUTPUT
M-SO-3.1.9
Employee Safety and Wellness
No of OHS Compliance audits conducted
Target/measure Number 4 4 4 4 4
CS MCLM HOD
MCLM MMC Capital N/A R - R - R - R - R -
Operating Yes Opex Opex Opex Opex Opex
RWCLM SUB OUTPUT
R-SO-3.1.9
Employee Safety and Wellness
No of OHS Compliance audits conducted
Target/measure Number 4 4 4 4 4
CS RWCL
M HOD
RWCLM MMC Capital N/A R - R - R - R - R -
Operating Yes Opex Opex Opex Opex Opex
MFCLM SUB OUTPUT
M-SO-3.1.9
Employee Safety and Wellness
No of OHS Compliance audits conducted
Target/measure Number 4 4 4 4 4
HC MFCLM
HOD MFCLM
MMC Capital N/A R - R - R - R - R -
Operating Yes Opex Opex Opex Opex Opex

282
Regional Sub Output 3.1.10: Employment Equity Compliance
REGIONAL REGIONAL
SUB OUTPUT T-SO-3.1.10
Employment Equity Compliance
% Implementation of the Employment Equity Plan
Target/measure Percentage 100 100 100 100 100
OMM WRDM
HOD WRDM MMC Capital 0 R - R - R - R - R -
Operating Yes Opex Opex Opex Opex Opex
WRDM SUB OUTPUT W-SO-3.1.10
Employment Equity Compliance
Number of reports on the Implementation of the Employment Equity Plan
Target/measure Quarterly report on implementation of employment equity
Percentage 100 100 100 100 100
CS WRDM
HOD WRDM MMC
Capital 0 R - R - R - R - R -
Operating Yes Opex Opex Opex Opex Opex
MCLM SUB OUTPUT M-SO-3.1.10
Employment Equity Compliance
% Equity Plan Target/measures met
Target/measure Percentage 100 100 100 100 100
CS MCLM HOD
MCLM MMC Capital 0 R - R - R - R - R -
Operating Yes Opex Opex Opex Opex Opex
RWCLM SUB OUTPUT
R-SO-3.1.10
Employment Equity Compliance
% Equity Plan Target/measures met
Target/measure Percentage 100 100 100 100 100
CS RWCLM
HOD RWCLM
MMC Capital 0 R - R - R - R - R -
Operating Yes Opex Opex Opex Opex Opex
MFCLM SUB OUTPUT M-SO-3.1.10
Employment Equity Compliance
% Equity Plan Target/measures met
Target/measure Percentage 100 100 100 100 100
CS MFCLM
HOD MFCLM
MMC Capital 0 R - R - R - R - R -
Operating Yes Opex Opex Opex Opex Opex

283
Regional Sub Output 3.1.11: Strategic Human Resources Leadership
REGIONAL
REGIONAL ACTIVITY T-A-3.1.11.1
Compliant Human Resources
No of reports on HR Governance submitted
Target/measure Number 4 4 4 4 4
OMM WRDM
MGR WRDM MMC
Capital 0 R - R - R - R - R -
Operating Yes Opex Opex Opex Opex Opex
WRDM ACTIVITY
W-A-3.1.11.1
Target/measure Quarterly HR governance report
Number 4 4 4 4 .
Corporate WRDM
MGR WRDM MMC
Capital 0 R - R - R - R - R -
Operating Yes Opex Opex Opex Opex _
MCLM ACTIVITY
M-A-3.1.11.1
Target/measure Number 4 4 4 4 4
Corporate MCLM MGR
MCLM MMC
Capital 0 R - R - R - R - R -
Operating Yes Opex Opex Opex Opex Opex
RWCLM ACTIVITY
R-A-3.1.11.1
Target/measure Number 4 4 4 4 4
Corporate RWCLM
MGR RWCLM
MMC Capital 0 R - R - R - R - R -
Operating Yes Opex Opex Opex Opex Opex
MFCLM ACTIVITY F-A-3.1.11.1
Target/measure Number 4 4 4 4 4
HR MFCLM
MGR MFCLM
MGR Capital 0 R - R - R - R - R -
Operating Yes Opex Opex Opex Opex Opex

284
OUTCOME 4

285
Regional Outcome 4: Ethical Administration and Good Governance
Part 1: National and Provincial Alignment National Outcomes 9. A responsive, accountable, effective and efficient local government system
Provincial 10 Pillars 4. Transformation of the State and governance
Back to Basics Goals 3. Good Governance & Sound Administration 4. Sound Financial Management & Accounting
COGTA KPA's KPA 5 : Good Governance and Public Participation
Part 2: Regional Five Year Game Changer Projects
Muni. Year 1
PROJECTS/ PROGRAMMES
Year 2 PROJECTS/
PROGRAMMES
Year 3 PROJECTS/
PROGRAMMES
Year 4 PROJECTS/
PROGRAMMES
Year 5 PROJECTS/
PROGRAMMES
REFER TO SECTION G
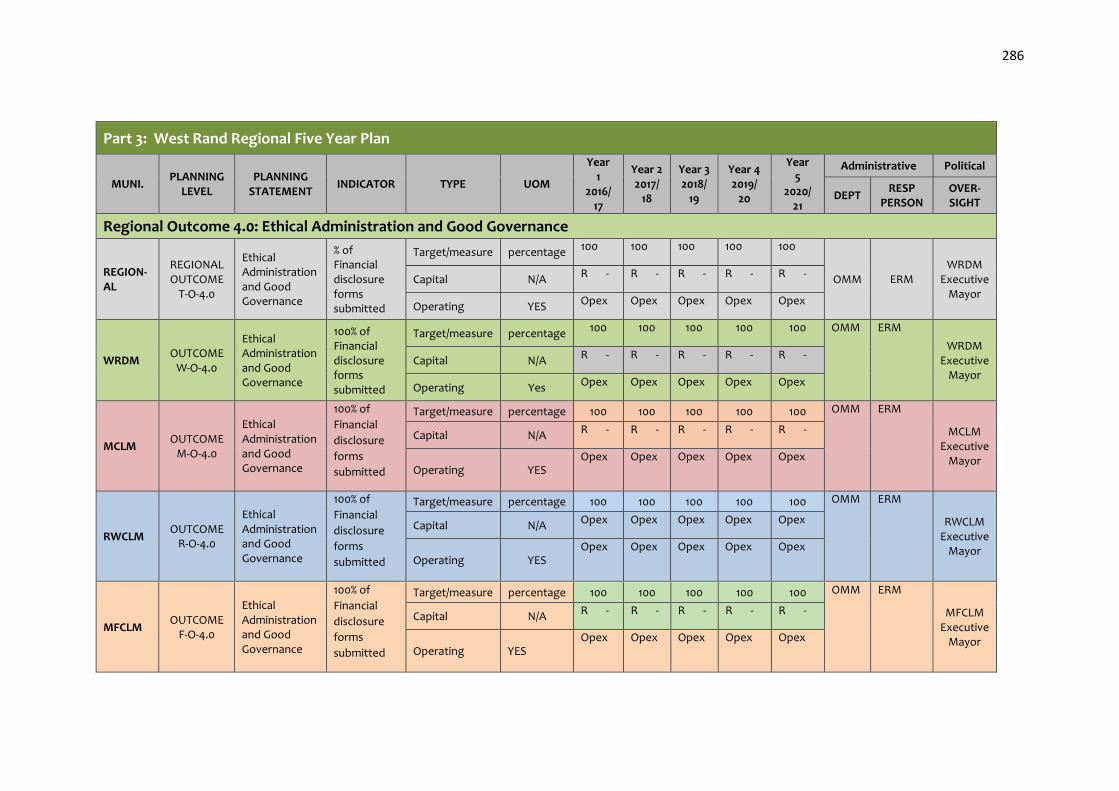
286
Part 3: West Rand Regional Five Year Plan
MUNI. PLANNING
LEVEL PLANNING
STATEMENT INDICATOR TYPE UOM
Year 1
2016/ 17
Year 2 2017/
18
Year 3 2018/
19
Year 4 2019/
20
Year 5
2020/ 21
Administrative Political
DEPT RESP
PERSON OVER-SIGHT
Regional Outcome 4.0: Ethical Administration and Good Governance
REGION-AL
REGIONAL OUTCOME
T-O-4.0
Ethical Administration and Good Governance
% of Financial disclosure forms submitted
Target/measure percentage 100 100 100 100 100
OMM ERM WRDM
Executive Mayor
Capital N/A R - R - R - R - R -
Operating YES Opex Opex Opex Opex Opex
WRDM OUTCOME
W-O-4.0
Ethical Administration and Good Governance
100% of Financial disclosure forms submitted
Target/measure percentage 100 100 100 100 100 OMM ERM
WRDM Executive
Mayor Capital N/A R - R - R - R - R -
Operating Yes Opex Opex Opex Opex Opex
MCLM OUTCOME
M-O-4.0
Ethical Administration and Good Governance
100% of
Financial
disclosure
forms
submitted
Target/measure percentage 100 100 100 100 100 OMM ERM
MCLM Executive
Mayor
Capital N/A R - R - R - R - R -
Operating YES Opex Opex Opex Opex Opex
RWCLM OUTCOME
R-O-4.0
Ethical Administration and Good Governance
100% of
Financial
disclosure
forms
submitted
Target/measure percentage 100 100 100 100 100 OMM ERM
RWCLM Executive
Mayor
Capital N/A Opex Opex Opex Opex Opex
Operating YES Opex Opex Opex Opex Opex
MFCLM OUTCOME
F-O-4.0
Ethical Administration and Good Governance
100% of
Financial
disclosure
forms
submitted
Target/measure percentage 100 100 100 100 100 OMM ERM
MFCLM Executive
Mayor
Capital N/A R - R - R - R - R -
Operating YES Opex Opex Opex Opex Opex

287
Regional Output 4.1: Corruption Free Municipal Environment
REGIONAL REGIONAL
OUTPUT T-OP-4.1
Corruption Free Municipal Environment
% of alleged cases of corruption investigated
Target/measure Percentage 100 100 100 100 100
OMM ERM WRDM
Executive Mayor
Capital N/A R - R - R - R - R -
Operating Yes Opex Opex Opex Opex Opex
WRDM OUTPUT W-OP-4.1
Target/measure Percentage 100 100 100 100 100 OMM ERM WRDM
Executive Mayor
Capital N/A R - R - R - R - R -
Operating Yes Opex Opex Opex Opex Opex
MCLM OUTPUT M-OP-4.1
Target/measure Percentage 100 100 100 100 100 OMM ERM
MCLM Executive
Mayor
Capital N/A R - R - R - R - R -
Operating Yes Opex Opex Opex Opex Opex
RWCLM OUTPUT R-OP-4.1
Target/measure Percentage 100 100 100 100 100 OMM ERM RWCLM
Executive Mayor
Capital N/A R - R - R - R - R -
Operating Yes Opex Opex Opex Opex Opex
MFCLM OUTPUT F-OP-4.1
Target/measure Percentage 100 100 100 100 100 OMM ERM
MFCLM Executive
Mayor Capital N/A R - R - R - R - R -
Operating Yes Opex Opex Opex Opex Opex

288
Regional Sub Output 4.1.1: Anti-Corruption Programmes
REGIONAL
REGIONAL SUB
OUTPUT T-SO-4.1.1
Anti-Corruption Programmes
% implementation of Anti-corruption framework
Target/measure percentage 100 100 100 100 100
OMM ERM WRDM MMC
Capital N/A R - R - R - R - R -
Operating Yes Opex Opex Opex Opex Opex
WRDM SUB
OUTPUT W-SO-4.1.1
Target/measure percentage 100 100 100 100 100 OMM ERM
WRDM MMC
Capital N/A R - R - R - R - R -
Operating Yes Opex Opex Opex Opex Opex
MCLM SUB
OUTPUT M-SO-4.1.1
Target/measure percentage 100 100 100 100 100 OMM ERM
MCLM MMC
Capital N/A R - R - R - R - R -
Operating Yes Opex Opex Opex Opex Opex
RWCLM SUB
OUTPUT R-SO-4.1.1
Target/measure percentage 100 100 100 100 100 OMM ERM
RWCLM MMC
Capital N/A R - R - R - R - R -
Operating Yes Opex Opex Opex Opex Opex
MFCLM SUB
OUTPUT M-SO-4.1.1
Target/measure percentage 100 100 100 100 100 OMM ERM
MFCLM MMC
Capital N/A R - R - R - R - R -
Operating Yes Opex Opex Opex Opex
Opex

289
Regional Sub Output 4.1.2: Code of Conduct Compliance
REGIONAL
REGIONAL SUB
OUTPUT T-SO-4.1.2
Code of Conduct Compliance
No of reports that outline misconduct cases within the Region
Target/measure number 4 4 4 4 4
OMM WRDM
HOD WRDM MMC
Capital N/A R - R - R - R - R -
Operating YES Opex Opex Opex Opex Opex
WRDM SUB
OUTPUT W-SO-4.1.2
No of reports that outline misconduct within the Municipality
Target/measure number 4 4 4 4 4
. WRDM
HOD WRDM MMC
Capital N/A R - R - R - R - R -
Operating YES Opex Opex Opex Opex Opex
MCLM SUB
OUTPUT M-SO-4.1.2
number percentage 4 4 4 4 4
. MCLM HOD
MCLM MMC
Capital N/A R - R - R - R - R -
Operating YES Opex Opex Opex Opex Opex
RWCLM SUB
OUTPUT R-SO-4.1.2
number percentage 4 4 4 4 4
. RWCLM
HOD RWCLM
MMC Capital N/A R - R - R - R - R -
Operating YES Opex Opex Opex Opex Opex
MFCLM SUB
OUTPUT M-SO-4.1.2
number percentage 4 4 4 4 4
. MFCLM
HOD MFCLM
MMC Capital N/A R - R - R - R - R -
Operating YES Opex Opex Opex Opex Opex

290
Regional Sub Output 4.1.3: Prohibition of Trading of the State with All Councillors
REGIONAL
REGIONAL SUB
OUTPUT T-SO-4.1.3
Prohibition of Trading of the State with All Councillors
% of financial disclosure forms scrutinised against the central tender database
Target/measure percentage 100 100 100 100 100
OMM ERM WRDM MMC
Capital N/A R - R - R - R - R -
Operating YES Opex Opex Opex Opex Opex
WRDM SUB
OUTPUT W-SO-4.1.3
Target/measure percentage 100 100 100 100 100
OMM ERM WRDM MMC
Capital N/A R - R - R - R - R -
Operating YES Opex Opex Opex Opex Opex
MCLM SUB
OUTPUT M-SO-4.1.3
Target/measure percentage 100 100 100 100 100
OMM ERM MCLM MMC
Capital N/A R - R - R - R - R -
Operating YES Opex Opex Opex Opex Opex
RWCLM SUB
OUTPUT R-SO-4.1.3
Target/measure percentage 100 100 100 100 100
OMM ERM RWCLM
MMC Capital N/A R - R - R - R - R -
Operating YES Opex Opex Opex Opex Opex
MFCLM SUB
OUTPUT M-SO-4.1.3
Target/measure percentage 100 100 100 100 100
OMM ERM MFCLM
MMC Capital N/A R - R - R - R - R -
Operating YES Opex Opex Opex Opex Opex

291
Regional Sub Output 4.1.4: Prohibition of Price Fixing and Bid Rigging
REGIONAL
REGIONAL SUB
OUTPUT T-SO-4.1.4
Prohibition of Prize Fixing and Bid Rigging
% compliance with SCM prescripts
Target/measure percentage 100 100 100 100 100
OMM ERM WRDM MMC Capital N/A 0 0 0 0 0
Operating YES Opex Opex Opex Opex Opex
WRDM SUB
OUTPUT W-SO-4.1.4
Target/measure percentage 100 100 100 100 100
OMM ERM WRDM MMC Capital N/A 0 0 0 0 0
Operating YES Opex Opex Opex Opex Opex
MCLM SUB
OUTPUT M-SO-4.1.4
Target/measure percentage 100 100 100 100 100
OMM ERM MCLM MMC Capital N/A 0 0 0 0 0
Operating YES Opex Opex Opex Opex Opex
RWCLM SUB
OUTPUT R-SO-4.1.4
Target/measure percentage 100 100 100 100 100
OMM ERM RWCLM
MMC Capital N/A 0 0 0 0 0
Operating YES Opex Opex Opex Opex Opex
MFCLM SUB
OUTPUT M-SO-4.1.4
Target/measure percentage 100 100 100 100 100
OMM ERM MFCLM
MMC Capital N/A 0 0 0 0 0
Operating YES Opex Opex Opex Opex Opex

292
Regional Sub Output 4.1.5: Forensic Audit Recommendation Implementation
REGIONAL
REGIONAL SUB
OUTPUT T-SO-4.1.5
Forensic Audit Recommendation Implementation
% Implementation of Forensic Audit recommendations
Target/measure percentage 100 100 100 100 100
OMM ERM WRDM MMC
Capital N/A R - R - R - R - R -
Operating YES Opex Opex Opex Opex Opex
WRDM SUB
OUTPUT W-SO-4.1.5
Target/measure percentage 100 100 100 100 100
OMM ERM WRDM MMC
Capital N/A R - R - R - R - R -
Operating YES Opex Opex Opex Opex Opex
MCLM SUB
OUTPUT M-SO-4.1.5
Target/measure percentage 100 100 100 100 100
OMM ERM MCLM MMC
Capital N/A R - R - R - R - R -
Operating YES Opex Opex Opex Opex Opex
RWCLM SUB
OUTPUT R-SO-4.1.5
Target/measure percentage 100 100 100 100 100
OMM ERM RWCLM
MMC Capital N/A R - R - R - R - R -
Operating YES Opex Opex Opex Opex Opex
MFCLM SUB
OUTPUT M-SO-4.1.5
Target/measure percentage 100 100 100 100 100
OMM ERM MFCLM
MMC Capital N/A R - R - R - R - R -
Operating YES Opex Opex Opex Opex Opex

293
Regional Output 4.2: Good Governance
REGIONAL REGIONAL
OUTPUT T-OP-4.2
Good Governance
Number of Internal Governance Documents developed and approved by Audit Committee & Council
Target/measure Number 4 4 4 4 4
OMM WRDM
MM
WRDM Executive
Mayor Capital N/A 0 0 0 0 0
Operating Yes Opex Opex Opex Opex Opex
WRDM OUTPUT W-OP-4.2
Target/measure Number 4 4 4 4 4
OMM WRDM
MM
WRDM Executive
Mayor Capital N/A 0 0 0 0 0
Operating Yes Opex Opex Opex Opex Opex
MCLM OUTPUT M-OP-4.2
Target/measure Number 4 4 4 4 4
OMM MCLM
MM
MCLM Executive
Mayor Capital N/A 0 0 0 0 0
Operating Yes Opex Opex Opex Opex Opex
RWCLM OUTPUT R-OP-4.2
Target/measure Number 4 4 4 4 4
OMM RWCLM
MM
RWCLM Executive
Mayor Capital N/A 0 0 0 0 0
Operating Yes Opex Opex Opex Opex Opex
MFCLM OUTPUT F-OP-4.2
Target/measure Number 4 4 4 4 4
OMM MFCLM
MM
MFCLM Executive
Mayor Capital N/A 0 0 0 0 0
Operating Yes Opex Opex Opex Opex Opex

294
Regional Sub Output 4.2.1: Robust Internal Controls
REGIONAL
REGIONAL SUB
OUTPUT T-SO-4.2.1
Provide assurance on the adequacy
and effectiveness
of the Internal Controls
3Y IA strategic plan and IA annual plan developed and approved by AC
Target/measure Number 8 8 8 8 8
OMM WRDM
Manager IA
WRDM Exec
Mayor
Capital N/A 0 0 0 0 0
Operating Yes Opex Opex Opex Opex Opex
% Implementation of the IA plan
Target/measure % 100 100 100 100 100
Capital N/A 0 0 0 0 0
Operating Yes Opex Opex Opex Opex Opex
WRDM SUB
OUTPUT W-SO-4.2.1
3Y IA strategic plan and IA annual plan developed and approved by AC
Target/measure Number 2 2 2 2 2
OMM Manager
IA Exec
Mayor
Capital N/A 0 0 0 0 0
Operating Yes Opex Opex Opex Opex Opex
% Implementation of the IA plan
Target/measure % 100 100 100 100 100
Capital N/A 0 0 0 0 0
Operating Yes Opex Opex Opex Opex Opex
MCLM SUB
OUTPUT M-SO-4.2.1
3Y IA strategic plan and IA annual plan developed and approved by AC
Target/measure Number 2 2 2 2 2
OMM CAE Exec
Mayor
Capital N/A 0 0 0 0 0
Operating Yes Opex Opex Opex Opex Opex
% Implementation of the IA plan
Target/measure % 100 100 100 100 100
Capital N/A 0 0 0 0 0
Operating Yes Opex Opex Opex Opex Opex

295
RWCLM SUB
OUTPUT R-SO-4.2.1
3Y IA strategic plan and IA annual plan developed and approved by AC
Target/measure Number 2 2 2 2 2
OMM CAE Exec
Mayor
Capital N/A 0 0 0 0 0
Operating Yes Opex Opex Opex Opex Opex
% Implementation of the IA plan
Target/measure % 100 100 100 100 100
Capital N/A 0 0 0 0 0
Operating Yes Opex Opex Opex Opex Opex
MFCLM SUB
OUTPUT M-SO-4.2.1
3Y IA strategic plan and IA annual plan developed and approved by AC
Target/measure Number 2 2 2 2 2
OMM Manager
IA Exec
Mayor
Capital N/A 0 0 0 0 0
Operating Yes Opex Opex Opex Opex Opex
% Implementation of the IA plan
Target/measure % 100 100 100 100 100
Capital N/A 0 0 0 0 0
Operating Yes Opex Opex Opex Opex Opex

296
Regional Sub Output 4.2.2: Effective Risk Management
REGIONAL
REGIONAL SUB
OUTPUT T-SO-4.2.2
Facilitate Effective Risk Management
Number of reports compiled on effectiveness of risk management
Target/measure number 4 4 4 4 4
OMM WRDM
HOD WRDM MMC
Capital N/A R - R - R - R - R -
Operating Yes Opex Opex Opex Opex Opex
WRDM
SUB OUTPUT
W-SO-4.2.2
Target/measure number 4 4 4 4 4
WRDM
HOD WRDM MMC
Capital N/A R - R - R - R - R -
Operating Yes Opex Opex Opex Opex Opex
MCLM
SUB OUTPUT
M-SO-4.2.2
Target/measure number 4 4 4 4 4
MCLM HOD
MCLM MMC
Capital N/A R - R - R - R - R -
Operating Yes Opex Opex Opex Opex Opex
RWCLM SUB
OUTPUT R-SO-4.2.2
Target/measure number 4 4 4 4 4
RWCLM
HOD RWCLM
MMC Capital N/A R - R - R - R - R -
Operating Yes Opex Opex Opex Opex Opex
MFCLM
SUB OUTPUT
M-SO-4.2.2
Target/measure number 4 4 4 4 4
MFCLM
HOD MFCLM
MMC Capital N/A R - R - R - R - R -
Operating Yes Opex Opex Opex Opex Opex

297
OUTCOME 5
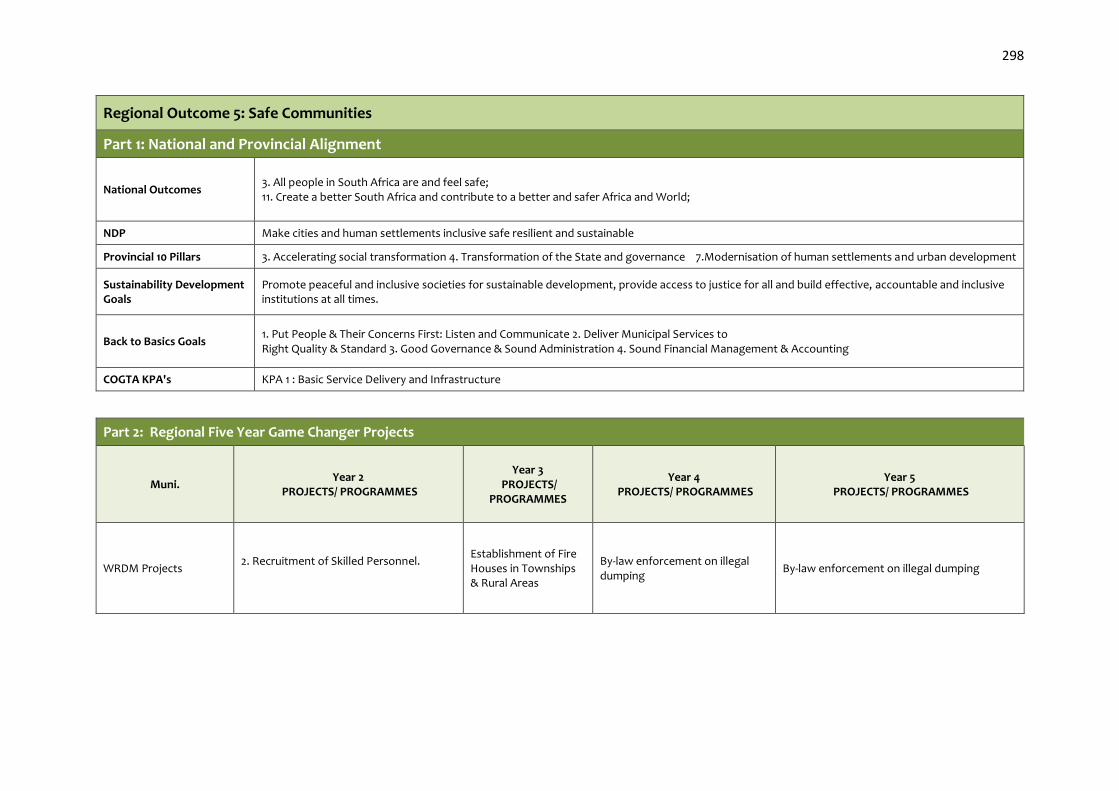
298
Regional Outcome 5: Safe Communities
Part 1: National and Provincial Alignment
National Outcomes 3. All people in South Africa are and feel safe; 11. Create a better South Africa and contribute to a better and safer Africa and World;
NDP Make cities and human settlements inclusive safe resilient and sustainable
Provincial 10 Pillars 3. Accelerating social transformation 4. Transformation of the State and governance 7.Modernisation of human settlements and urban development
Sustainability Development Goals
Promote peaceful and inclusive societies for sustainable development, provide access to justice for all and build effective, accountable and inclusive institutions at all times.
Back to Basics Goals 1. Put People & Their Concerns First: Listen and Communicate 2. Deliver Municipal Services to Right Quality & Standard 3. Good Governance & Sound Administration 4. Sound Financial Management & Accounting
COGTA KPA's KPA 1 : Basic Service Delivery and Infrastructure
Part 2: Regional Five Year Game Changer Projects
Muni. Year 2
PROJECTS/ PROGRAMMES
Year 3 PROJECTS/
PROGRAMMES
Year 4 PROJECTS/ PROGRAMMES
Year 5 PROJECTS/ PROGRAMMES
WRDM Projects 2. Recruitment of Skilled Personnel.
Establishment of Fire Houses in Townships & Rural Areas
By-law enforcement on illegal dumping
By-law enforcement on illegal dumping

299
Mogale Projects 1. Provision of a 24hr Traffic Service 2. Recruitment of skilled workforce 3. By-law enforcement on illegal dumping
Establishment of Satellite Licensing Services 3.By-law enforcement on illegal dumping
By-law enforcement on illegal dumping
By-law enforcement on illegal dumping
Randwest Projects
1. Establishment of Municipal Courts. 2. Provision of a 24hr Traffic Services 3. Recruitment of skilled workforce 4. By-law enforcement on illegal dumping
Establishment of Satellite Licensing Services. 2. By-law enforcement on illegal dumping
By-law enforcement on illegal dumping
By-law enforcement on illegal dumping
Merafong Projects
1. Establishment of Municipal Court 2. Provision of a 24hr Traffic Services 3. Recruitment of skilled workforce 4. By-law enforcement on illegal dumping
Establishment of Satellite Licensing Services. 2. By-law enforcement on illegal dumping
By-law enforcement on illegal dumping
By-law enforcement on illegal dumping

300
Part 3: West Rand Regional Five Year Plan
MUNI. PLANNING
LEVEL PLANNING
STATEMENT INDICATOR TYPE UOM
Year 1
2016/ 17
Year 2 2017/
18
Year 3 2018/
19
Year 4 2019/
20
Year 5
2020/ 21
Administrative Political
DEPT RESP
PERSON OVER-SIGHT
Regional Outcome 5.0: Safe Communities
REGION-AL
REGIONAL OUTCOME
T-O-5.0
To ensure safer
communities within West Rand Region
Number of reports on compliance to the regional safety plan submitted to MayCom
Target/measure number 4 4 4 4 4
OMM WRDM
Executive Mayor
WRDM Executive
Mayor
Capital 0 R - R - R - R - R -
Operating yes opex opex opex opex opex
WRDM OUTCOME
W-O-5.0
Target/measure number 4 4 4 4 4 Office
of Exec
Mayor
WRDM Executive
Mayor
WRDM Executive
Mayor
Capital 0 R - R - R - R - R -
Operating yes opex opex opex opex opex
MCLM OUTCOME
M-O-5.0
Target/measure number 4 4 4 4 4 Office of
Exec Mayor
MCLM Executive
Mayor
MCLM Executive
Mayor
Capital 0 R - R - R - R - R -
Operating yes opex opex opex opex opex
RWCLM OUTCOME
R-O-5.0
Target/measure number 4 4 4 4 4 Office
of Exec
Mayor
RWCLM Executive
Mayor
RWCLM Executive
Mayor
Capital 0 R - R - R - R - R -
Operating yes opex opex opex opex opex
MFCLM OUTCOME
F-O-5.0
Target/measure percentage 4 4 4 4 4 Office of
Exec Mayor
MFCLM Executive
Mayor
MFCLM Executive
Mayor
Capital 0 R - R - R - R - R -
Operating yes opex opex opex opex opex

301
Regional Output 5.1: People in the West Rand are and Feel Safe
REGIONAL REGIONAL
OUTPUT T-OP-5.1
People in the West Rand are and Feel Safe
Number of regional traffic management forum established for standardisation of traffic management Services
Target/measure Number 1 1 1 1 1
OMM WRDM
MM
WRDM Executive
Mayor Capital 0 0 0 0 0 0
Operating yes opex opex opex opex opex
WRDM OUTPUT W-OP-5.1
Target/measure Number 1 1 1 1 1
WRDM
MM
WRDM Executive
Mayor
Capital N/A 0 0 0 0 0
Operating yes opex opex opex opex opex
MCLM OUTPUT M-OP-5.1
Target/measure Number 1 1 1 1 1
MCLM
MM
MCLM Executive
Mayor
Capital N/A 0 0 0 0 0
Operating yes opex opex opex opex opex
RWCLM OUTPUT R-OP-5.1
Target/measure Number 1 1 1 1 1
RWCLM
MM
RWCLM Executive
Mayor
Capital N/A 0 0 0 0 0
Operating yes opex opex opex opex opex
MFCLM OUTPUT F-OP-5.1
Target/measure Number 1 1 1 1 1
MFCLM
MM
MFCLM Executive
Mayor
Capital N/A 0 0 0 0 0
Operating N/A yes opex opex opex opex
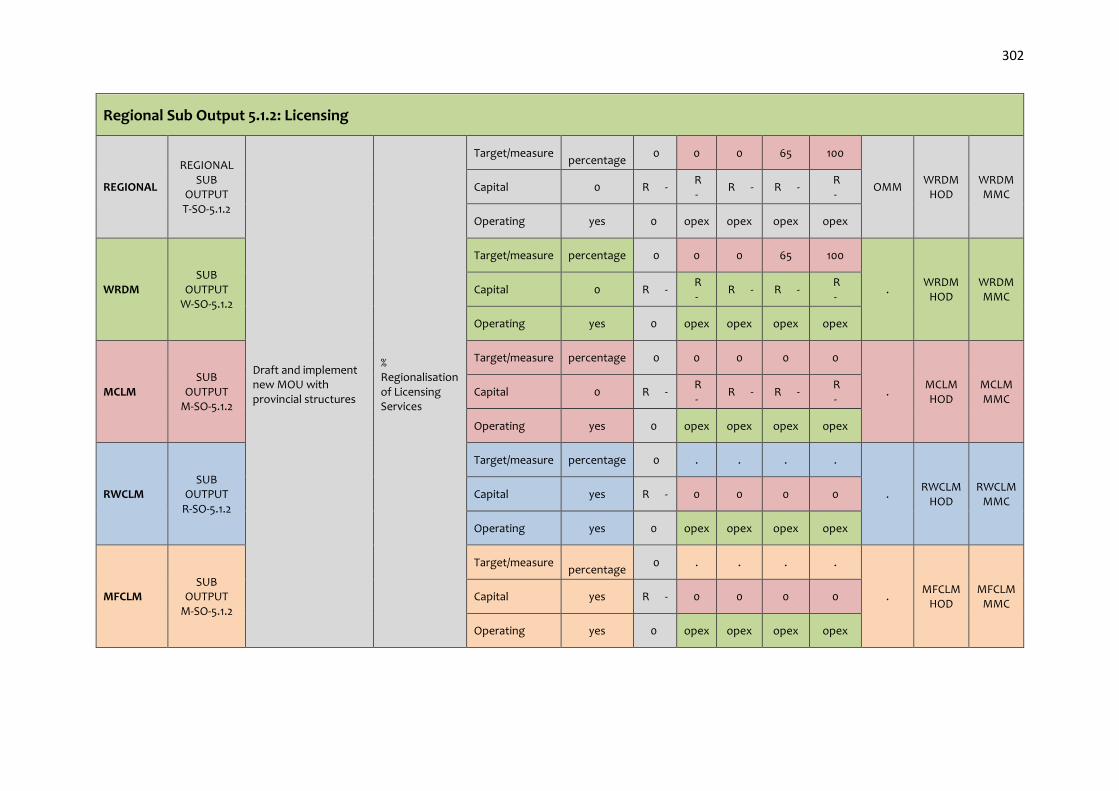
302
Regional Sub Output 5.1.2: Licensing
REGIONAL
REGIONAL SUB
OUTPUT T-SO-5.1.2
Draft and implement new MOU with provincial structures
% Regionalisation of Licensing Services
Target/measure
percentage 0 0 0 65 100
OMM WRDM
HOD WRDM MMC
Capital 0 R - R -
R - R - R -
Operating yes 0 opex opex opex opex
WRDM SUB
OUTPUT W-SO-5.1.2
Target/measure percentage 0 0 0 65 100
. WRDM
HOD WRDM MMC
Capital 0 R - R -
R - R - R -
Operating yes 0 opex opex opex opex
MCLM SUB
OUTPUT M-SO-5.1.2
Target/measure percentage 0 0 0 0 0
. MCLM HOD
MCLM MMC
Capital 0 R - R -
R - R - R -
Operating yes 0 opex opex opex opex
RWCLM SUB
OUTPUT R-SO-5.1.2
Target/measure percentage 0 . . . .
. RWCLM
HOD RWCLM
MMC Capital yes R - 0 0 0 0
Operating yes 0 opex opex opex opex
MFCLM SUB
OUTPUT M-SO-5.1.2
Target/measure
percentage 0 . . . .
. MFCLM
HOD MFCLM
MMC Capital yes R - 0 0 0 0
Operating yes 0 opex opex opex opex

303
Regional Sub Output 5.1.5: Law Enforcement : Illegal Trading
REGIONAL
REGIONAL SUB
OUTPUT T-SO-5.1.5
Law Enforcement : Illegal Trading
Number of joint operations conducted to enforce By-laws on illegal trading
Target/measure number 0 2 2 2 2
OMM WRDM
HOD WRDM MMC
Capital N/A R - R - R - R - R -
Operating yes opex opex opex opex opex
WRDM SUB
OUTPUT W-SO-5.1.5
Target/measure number 0 2 2 2 2 OMM
WRDM HOD
WRDM MMC
Capital N/A R - R - R - R - R -
Operating yes opex opex opex opex opex
MCLM SUB
OUTPUT M-SO-5.1.5
Target/measure number 0 2 2 2 2 OMM
MCLM HOD
MCLM MMC
Capital N/A R - R - R - R - R -
Operating yes opex opex opex opex opex
RWCLM SUB
OUTPUT R-SO-5.1.5
Law Enforcement : Illegal Trading
Number of joint operations conducted to enforce By-laws on illegal trading
Target/measure number 0 2 2 2 2
. RWCLM
HOD RWCLM
MMC Capital N/A R - R -
R -
R -
R -
Operating yes opex opex opex opex opex
MFCLM SUB
OUTPUT M-SO-5.1.5
Target/measure number 0 2 2 2 2
. MFCLM
HOD MFCLM
MMC Capital N/A R - R - R -
R -
R -
Operating yes opex opex opex opex opex

304
Regional Sub Output 5.1.6: Social crime Prevention
REGIONAL
REGIONAL SUB
OUTPUT T-SO-5.1.6
End Violence against Women and Children
Number of campaigns held to curb violence against woman and children (16 Days of Activism)
Target/measure number 1 1 1 1 1
OMM WRDM
HOD WRDM MMC
Capital 0 R - R - R - R - R -
Operating yes Opex Opex Opex Opex Opex
WRDM SUB
OUTPUT W-SO-5.1.6
Target/measure number 1 1 1 1 1
. WRDM
HOD WRDM MMC
Capital 0 R - R - R - R - R -
Operating yes Opex Opex Opex Opex Opex
MCLM SUB
OUTPUT M-SO-5.1.6
End Violence against Women and Children
Number of campaigns held to curb violence against woman and children (16 Days of Activism)
Target/measure number 1 1 1 1 1
. MCLM HOD
MCLM MMC
Capital 0 R - R - R - R - R -
Operating yes Opex Opex Opex Opex Opex
RWCLM SUB
OUTPUT R-SO-5.1.6
Target/measure number 1 1 1 1 1
. RWCLM
HOD RWCLM
MMC Capital N/A R - R - R - R - R -
Operating yes Opex Opex Opex Opex Opex
MFCLM SUB
OUTPUT M-SO-5.1.6
Target/measure number 1 1 1 1 1
. MFCLM
HOD MFCLM
MMC Capital 0 R - R - R - R - R -
Operating yes Opex Opex Opex Opex Opex

305
OUTCOME 6

306
Regional Outcome 6: Educated Communities
Part 1: National and Provincial Alignment
National Outcomes 1. Improved quality of basic Education
2. A long and healthy life for all
NDP 6. Public Health system cannot meet the demand and sustain quality
7. Public services are uneven and often of poor quality
Provincial 10 Pillars
3. Accelerating social transformation 4. Transformation of the State and governance 8. Modernisation of public transport and other infrastructure 9.Re-industrialising Gauteng as our country’s economic hub 10. Taking a lead in Africa’s new industrial revolution.
6. Modernisation of the public service and the state
Sustainability Development Goals
1. End poverty in all its forms everywhere
3. Ensure healthy lives and promote well-being at all ages
4. Ensure inclusive and equitable education and promote lifelong learning opportunities for all
5. Achieve gender equality and empower all women and girls
7. Ensure available and sustainable management of water and sanitation for all
11. Make cities and human settlement inclusive, safe, resilient and sustainable
13. Take action to combat climate change and its impact (in line with United Nations Framework Convention on Climate Change
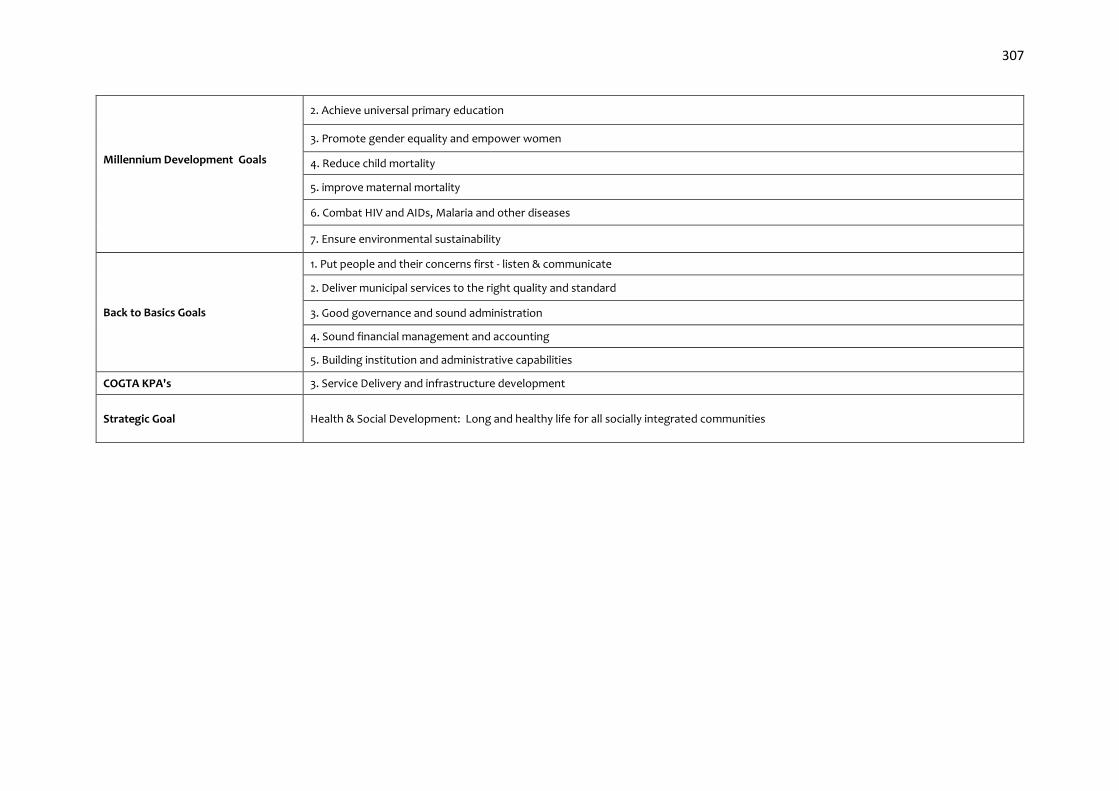
307
Millennium Development Goals
2. Achieve universal primary education
3. Promote gender equality and empower women
4. Reduce child mortality
5. improve maternal mortality
6. Combat HIV and AIDs, Malaria and other diseases
7. Ensure environmental sustainability
Back to Basics Goals
1. Put people and their concerns first - listen & communicate
2. Deliver municipal services to the right quality and standard
3. Good governance and sound administration
4. Sound financial management and accounting
5. Building institution and administrative capabilities
COGTA KPA's 3. Service Delivery and infrastructure development
Strategic Goal Health & Social Development: Long and healthy life for all socially integrated communities
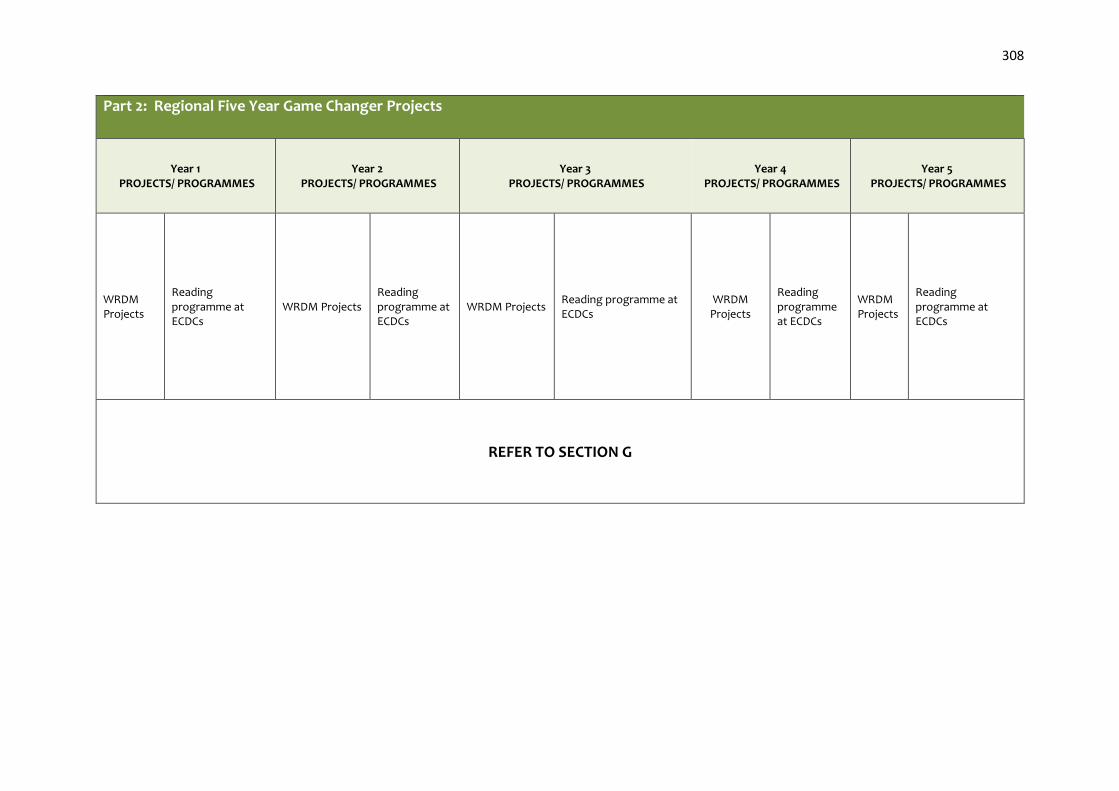
308
Part 2: Regional Five Year Game Changer Projects
Year 1 PROJECTS/ PROGRAMMES
Year 2 PROJECTS/ PROGRAMMES
Year 3 PROJECTS/ PROGRAMMES
Year 4 PROJECTS/ PROGRAMMES
Year 5 PROJECTS/ PROGRAMMES
WRDM Projects
Reading programme at ECDCs
WRDM Projects Reading programme at ECDCs
WRDM Projects Reading programme at ECDCs
WRDM Projects
Reading programme at ECDCs
WRDM Projects
Reading programme at ECDCs
REFER TO SECTION G
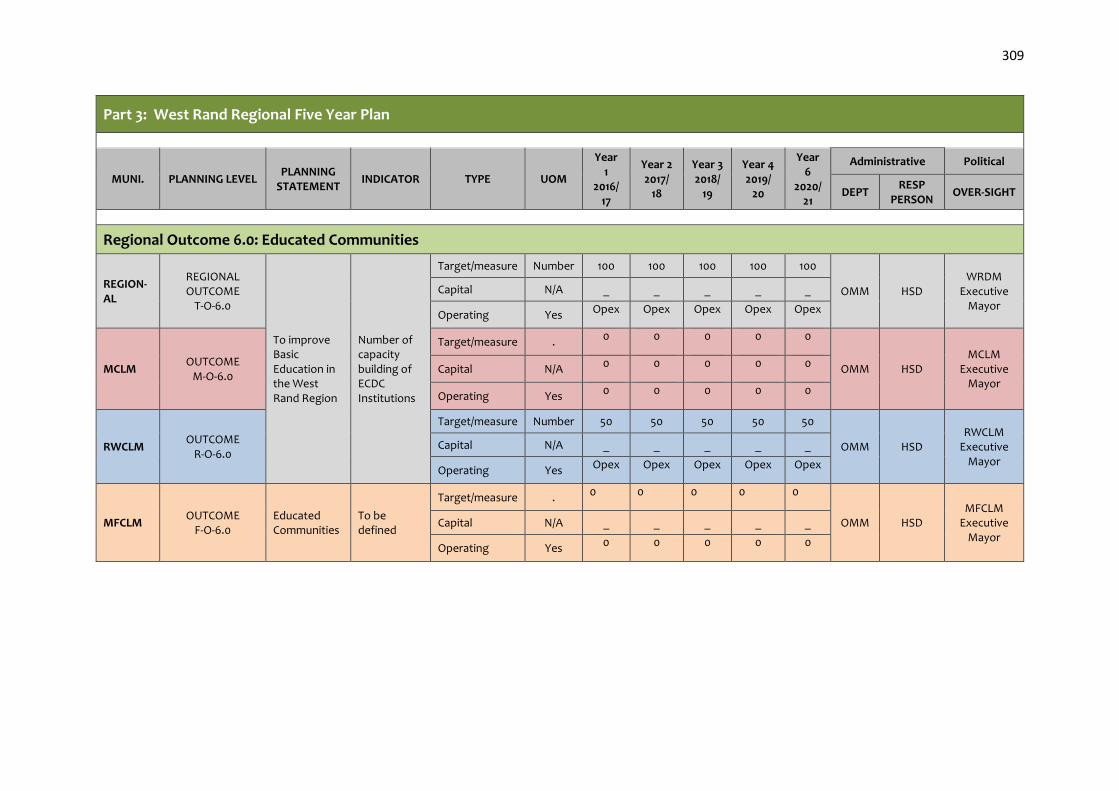
309
Part 3: West Rand Regional Five Year Plan
MUNI. PLANNING LEVEL PLANNING
STATEMENT INDICATOR TYPE UOM
Year 1
2016/ 17
Year 2 2017/
18
Year 3 2018/
19
Year 4 2019/
20
Year 6
2020/ 21
Administrative Political
DEPT RESP
PERSON OVER-SIGHT
Regional Outcome 6.0: Educated Communities
REGION-AL
REGIONAL OUTCOME
T-O-6.0
To improve Basic Education in the West Rand Region
Number of capacity building of ECDC Institutions
Target/measure Number 100 100 100 100 100
OMM HSD WRDM
Executive Mayor
Capital N/A _ _ _ _ _
Operating Yes Opex Opex Opex Opex Opex
MCLM OUTCOME
M-O-6.0
Target/measure . 0 0 0 0 0
OMM HSD MCLM
Executive Mayor
Capital N/A 0 0 0 0 0
Operating Yes 0 0 0 0 0
RWCLM OUTCOME
R-O-6.0
Target/measure Number 50 50 50 50 50
OMM HSD RWCLM
Executive Mayor
Capital N/A _ _ _ _ _
Operating Yes Opex Opex Opex Opex Opex
MFCLM OUTCOME
F-O-6.0 Educated Communities
To be defined
Target/measure . 0 0 0 0 0
OMM HSD MFCLM
Executive Mayor
Capital N/A _ _ _ _ _
Operating Yes 0 0 0 0 0

310
Regional Output 6.1: Improved Basic Education in the West Rand
REGIONAL REGIONAL
OUTPUT T-OP-6.1
Coordinate training ECDC personnel with Matthew Goniwe
number of ECDC personnel trained
Target/measure . 0 0 0 0 0
OMM HSD WRDM
Executive Mayor
Capital N/A _ _ _ _ _
Operating N/A 0 0 0 0 0
MCLM OUTPUT M-OP-6.1
Target/measure Number 23 23 23 23 23
OMM HSD MCLM
Executive Mayor
Capital N/A _ _ _ _ _
Operating Yes Opex Opex Opex Opex Opex
RWCLM OUTPUT R-OP-6.1
Target/measure Number 30 30 30 30 30
OMM HSD RWCLM
Executive Mayor
Capital N/A _ _ _ _ _
Operating Yes Opex Opex Opex Opex Opex
MFCLM OUTPUT F-OP-6.1
Target/measure . 0 0 0 0 0
OMM HSD MFCLM
Executive Mayor
Capital N/A _ _ _ _ _
Operating N/A 0 0 0 0 0
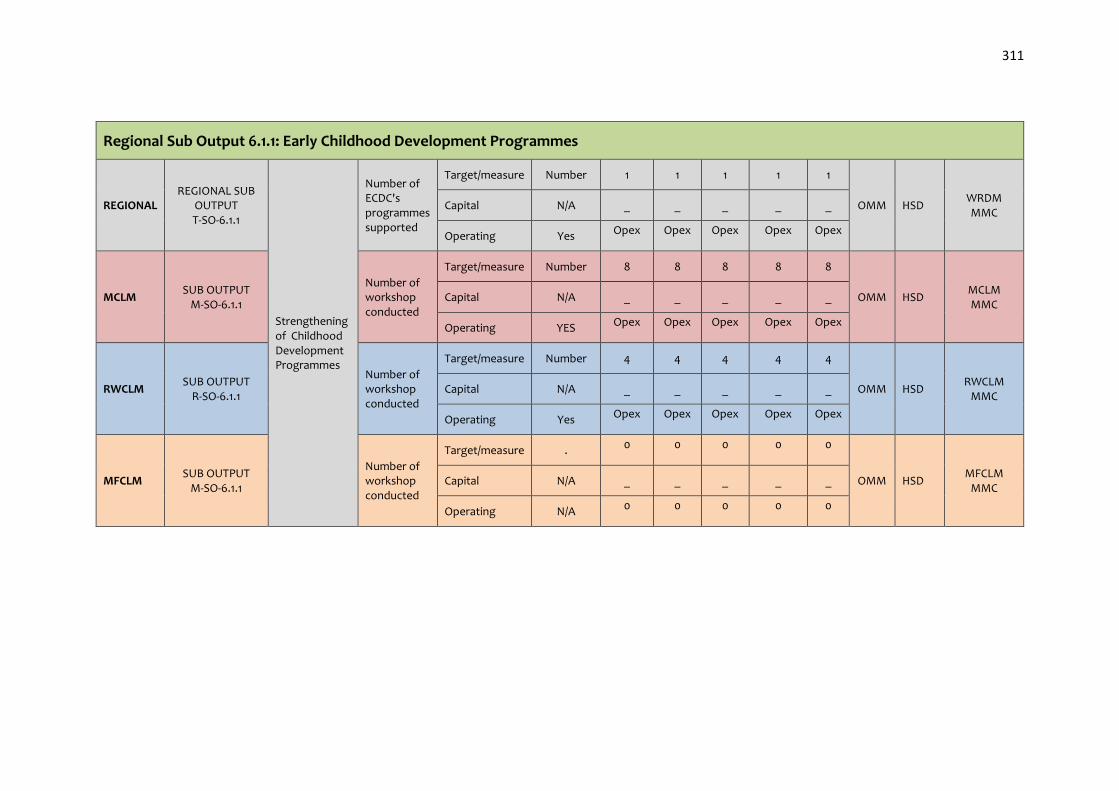
311
Regional Sub Output 6.1.1: Early Childhood Development Programmes
REGIONAL REGIONAL SUB
OUTPUT T-SO-6.1.1
Strengthening of Childhood Development Programmes
Number of ECDC's programmes supported
Target/measure Number 1 1 1 1 1
OMM HSD WRDM MMC
Capital N/A _ _ _ _ _
Operating Yes Opex Opex Opex Opex Opex
MCLM SUB OUTPUT
M-SO-6.1.1
Number of workshop conducted
Target/measure Number 8 8 8 8 8
OMM HSD MCLM MMC
Capital N/A _ _ _ _ _
Operating YES Opex Opex Opex Opex Opex
RWCLM SUB OUTPUT
R-SO-6.1.1
Number of workshop conducted
Target/measure Number 4 4 4 4 4
OMM HSD RWCLM
MMC Capital N/A _ _ _ _ _
Operating Yes Opex Opex Opex Opex Opex
MFCLM SUB OUTPUT
M-SO-6.1.1
Number of workshop conducted
Target/measure . 0 0 0 0 0
OMM HSD MFCLM
MMC Capital N/A _ _ _ _ _
Operating N/A 0 0 0 0 0

312
Regional Sub Output 6.1.2: Community Based Learning and Teaching Campaigns
REGIONAL
REGIONAL SUB
OUTPUT T-SO-6.1.2
Community Based Learning and Teaching Campaigns
Number of Community Based Learning and Teaching Campaigns conducted
Target/measure number 1 1 1 1 1
OMM HSD WRDM MMC Capital N/A _ _ _ _ _
Operating Yes Opex Opex Opex Opex Opex
MCLM SUB
OUTPUT M-SO-6.1.2
Target/measure . 0 0 0 0 0
OMM HSD MCLM MMC
Capital N/A _ _ _ _ _
Operating N/A 0 0 0 0 0
RWCLM SUB
OUTPUT R-SO-6.1.2
Target/measure . 0 0 0 0 0
OMM HSD RWCLM
MMC Capital N/A _ _ _ _ _
Operating N/A 0 0 0 0 0
MFCLM SUB
OUTPUT M-SO-6.1.2
Target/measure . 0 0 0 0 0
OMM HSD MFCLM
MMC Capital N/A _ _ _ _ _
Operating N/A 0 0 0 0 0

313
OUTCOME 7

314
Regional Outcome 7: Healthy Communities
Part 1: National and Provincial Alignment National Outcomes 1. Improved quality of basic Education
2. A long and healthy life for all
NDP 6. Public Health system cannot meet the demand and sustain quality
7. Public services are uneven and often of poor quality Provincial 10 Pillars 3. Accelerating transformation Sustainability Development Goals 1. End poverty in all its forms everywhere
3. Ensure healthy lives and promote well-being at all ages
4. Ensure inclusive and equitable education and promote lifelong learning opportunities for all
5. Achieve gender equality and empower all women and girls
7. Ensure available and sustainable management of water and sanitation for all
11. Make cities and human settlement inclusive, safe, resilient and sustainable
13. Take action to combat climate change and its impact (in line with United Nations framework Convention on Climate Change

315
Millennium Development Goals 2. Achieve universal primary education 3. Promote gender equality and empower women 4. Reduce child mortality 5. improve maternal mortality 6. Combat HIV and AIDs, Malaria and other diseases
7. Ensure environmental sustainability
Back to Basics Goals 1. Put people and their concerns first - listen & communicate
2. Deliver municipal services to the right quality and standard
3. Good governance and sound administration COGTA KPA's 3. Service Delivery and infrastructure development
Regional Goals Health & Social Development: Long and healthy life for all socially integrated communities
Strategic Goal 2. Health and Social Development
Part 2: Regional Five Year Game Changer Projects
Muni. Year 1
PROJECTS/ PROGRAMMES
Year 2 PROJECTS/
PROGRAMMES
Year 3 PROJECTS/
PROGRAMMES
Year 4 PROJECTS/
PROGRAMMES
Year 5 PROJECTS/
PROGRAMMES
REFER TO SECTION G
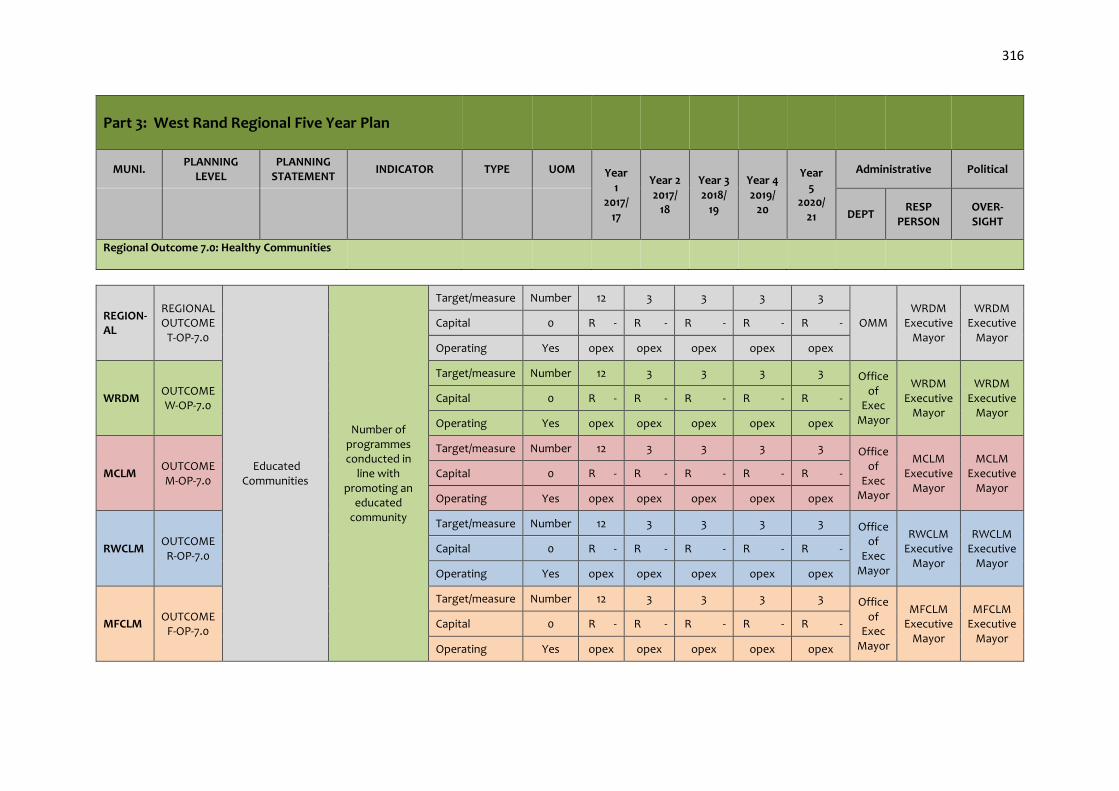
316
Part 3: West Rand Regional Five Year Plan
MUNI. PLANNING
LEVEL PLANNING
STATEMENT INDICATOR TYPE UOM Year
1 2017/
17
Year 2 2017/
18
Year 3 2018/
19
Year 4 2019/
20
Year 5
2020/ 21
Administrative Political
DEPT RESP
PERSON OVER-SIGHT
Regional Outcome 7.0: Healthy Communities
REGION-AL
REGIONAL OUTCOME
T-OP-7.0
Educated Communities
Number of programmes conducted in
line with promoting an
educated community
Target/measure Number 12 3 3 3 3
OMM WRDM
Executive Mayor
WRDM Executive
Mayor Capital 0 R - R - R - R - R -
Operating Yes opex opex opex opex opex
WRDM OUTCOME W-OP-7.0
Target/measure Number 12 3 3 3 3 Office of
Exec Mayor
WRDM Executive
Mayor
WRDM Executive
Mayor Capital 0 R - R - R - R - R -
Operating Yes opex opex opex opex opex
MCLM OUTCOME M-OP-7.0
Target/measure Number 12 3 3 3 3 Office of
Exec Mayor
MCLM Executive
Mayor
MCLM Executive
Mayor Capital 0 R - R - R - R - R -
Operating Yes opex opex opex opex opex
RWCLM OUTCOME
R-OP-7.0
Target/measure Number 12 3 3 3 3 Office of
Exec Mayor
RWCLM Executive
Mayor
RWCLM Executive
Mayor Capital 0 R - R - R - R - R -
Operating Yes opex opex opex opex opex
MFCLM OUTCOME
F-OP-7.0
Target/measure Number 12 3 3 3 3 Office of
Exec Mayor
MFCLM Executive
Mayor
MFCLM Executive
Mayor Capital 0 R - R - R - R - R -
Operating Yes opex opex opex opex opex

317
Regional Output 7.1: Promotion of Health Services within West Rand Communities
REGIONAL
REGIONAL OUTPUT T-OP-7.1
Improve healthy
lifestyles
Number of health programme reports compiled
Target/measure Percentage 4 4 4 4 4 OMM WRDM
MM WRDM Executive
Mayor
Capital 0 _ _ _ _ _
Operating Yes Opex Opex Opex Opex Opex
WRDM
OUTPUT W-OP-7.1
Target/measure Percentage 4 4 4 4 4
WRDM
MM WRDM Executive
Mayor
Capital 0 _ _ _ _ _
Operating Yes Opex Opex Opex Opex Opex
MCLM
OUTPUT M-OP-7.1
Target/measure Percentage 100 100 100 100 100 MCLM
MM MCLM Executive
Mayor
Capital 0 _ _ _ _ _
Operating Yes Opex Opex Opex Opex Opex
RWCLM
OUTPUT R-OP-7.1
Target/measure Percentage 100 100 100 100 100 RWCLM
MM RWCLM
Executive Mayor
Capital 0 _ _ _ _ _
Operating Yes Opex Opex Opex Opex Opex
MFCLM
OUTPUT F-OP-7.1
Target/measure Percentage 100 100 100 100 100 MFCLM
MM MFCLM Executive
Mayor
Capital 0 _ _ _ _ _
Operating Yes Opex Opex Opex Opex Opex
Regional Sub Output 7.1.2: Promote Health Check Campaigns and Participation
REGIONAL
REGIONAL SUB
Promote Health Check
Number of Health
Target/measure Number 4 4 4 4 4 OMM WRDM
HOD WRDM MMC
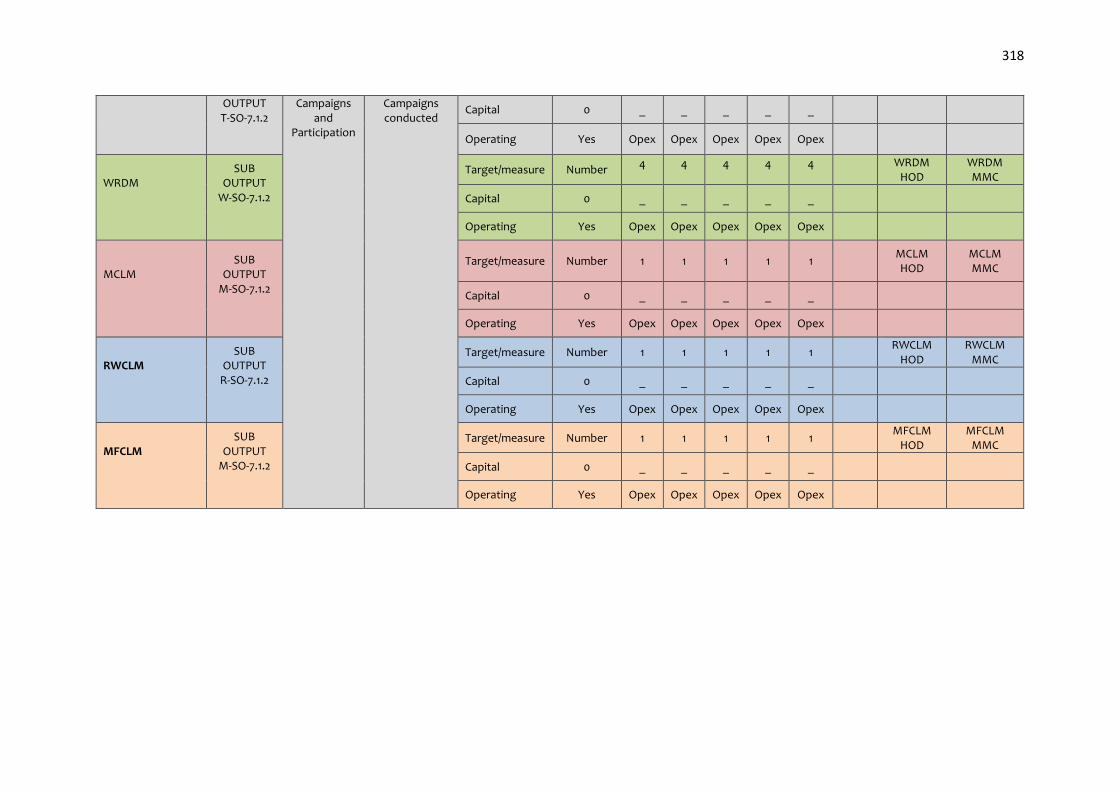
318
OUTPUT T-SO-7.1.2
Campaigns and
Participation
Campaigns conducted
Capital 0 _ _ _ _ _
Operating Yes Opex Opex Opex Opex Opex
WRDM
SUB OUTPUT
W-SO-7.1.2
Target/measure Number 4 4 4 4 4 WRDM
HOD WRDM MMC
Capital 0 _ _ _ _ _
Operating Yes Opex Opex Opex Opex Opex
MCLM
SUB OUTPUT
M-SO-7.1.2
Target/measure Number 1 1 1 1 1 MCLM HOD
MCLM MMC
Capital 0 _ _ _ _ _
Operating Yes Opex Opex Opex Opex Opex
RWCLM
SUB OUTPUT
R-SO-7.1.2
Target/measure Number 1 1 1 1 1 RWCLM
HOD RWCLM
MMC
Capital 0 _ _ _ _ _
Operating Yes Opex Opex Opex Opex Opex
MFCLM
SUB OUTPUT
M-SO-7.1.2
Target/measure Number 1 1 1 1 1 MFCLM
HOD MFCLM
MMC
Capital 0 _ _ _ _ _
Operating Yes Opex Opex Opex Opex Opex

319
Regional Sub Output 7.1.3: Strengthen Health Programmes : HIV, TB, and Dread Diseases
REGIONAL
REGIONAL SUB
OUTPUT T-SO-7.1.3
Strengthen Health
Programmes : HIV, TB,
and Dread Diseases
Number of report on implementation of HIV& AIDS Community based program as per grant funding
Target/measure Number 4 4 4 4 4 OMM WRDM
HOD WRDM MMC
Capital 0 _ _ _ _ _
Operating Yes Opex Opex Opex Opex Opex
WRDM
SUB OUTPUT
W-SO-7.1.3
Target/measure Number 4 4 4 4 4 WRDM
HOD WRDM MMC
Capital 0 _ _ _ _ _
Operating Yes Opex Opex Opex Opex Opex
MCLM
SUB OUTPUT
M-SO-7.1.3
Target/measure Percentage 100 100 100 100 100
MCLM HOD
MCLM MMC
Capital 0 _ _ _ _ _
Operating Yes Opex Opex Opex Opex Opex
RWCLM
SUB OUTPUT
R-SO-7.1.3
Target/measure Percentage 100 100 100 100 100
RWCLM
HOD RWCLM
MMC
Capital 0 _ _ _ _ _
Operating Yes Opex Opex Opex Opex Opex
MFCLM
SUB OUTPUT
M-SO-7.1.3
Target/measure Percentage
100 100 100 100 100
MFCLM HOD
MFCLM MMC
Capital 0 _ _ _ _ _
Operating Yes Opex Opex Opex Opex Opex
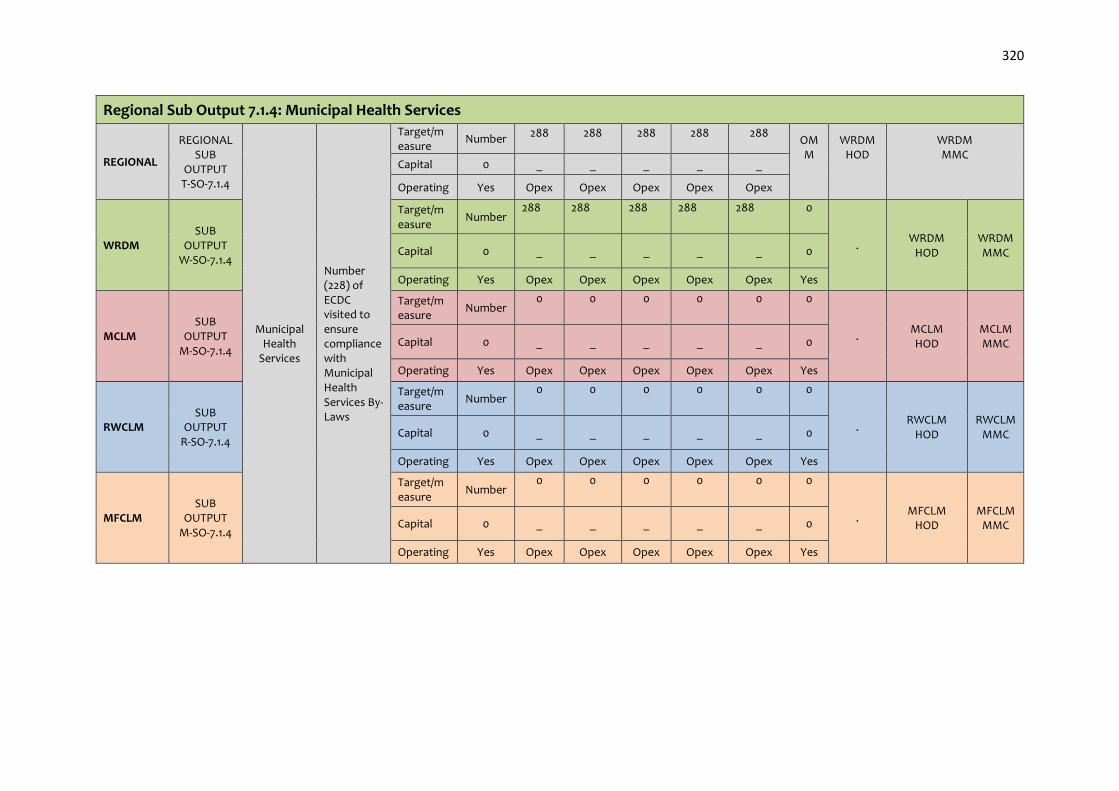
320
Regional Sub Output 7.1.4: Municipal Health Services
REGIONAL
REGIONAL SUB
OUTPUT T-SO-7.1.4
Municipal Health
Services
Number (228) of ECDC visited to ensure compliance with Municipal Health Services By-Laws
Target/measure
Number 288 288 288 288 288 OMM
WRDM HOD
WRDM MMC
Capital 0 _ _ _ _ _
Operating Yes Opex Opex Opex Opex Opex
WRDM SUB
OUTPUT W-SO-7.1.4
Target/measure
Number 288 288 288 288 288 0
. WRDM
HOD WRDM MMC Capital 0 _ _ _ _ _ 0
Operating Yes Opex Opex Opex Opex Opex Yes
MCLM SUB
OUTPUT M-SO-7.1.4
Target/measure
Number 0 0 0 0 0 0
. MCLM HOD
MCLM MMC Capital 0 _ _ _ _ _ 0
Operating Yes Opex Opex Opex Opex Opex Yes
RWCLM SUB
OUTPUT R-SO-7.1.4
Target/measure
Number 0 0 0 0 0 0
. RWCLM
HOD RWCLM
MMC Capital 0 _ _ _ _ _ 0
Operating Yes Opex Opex Opex Opex Opex Yes
MFCLM SUB
OUTPUT M-SO-7.1.4
Target/measure
Number 0 0 0 0 0 0
. MFCLM
HOD MFCLM
MMC Capital 0 _ _ _ _ _ 0
Operating Yes Opex Opex Opex Opex Opex Yes
321
OUTCOME 8
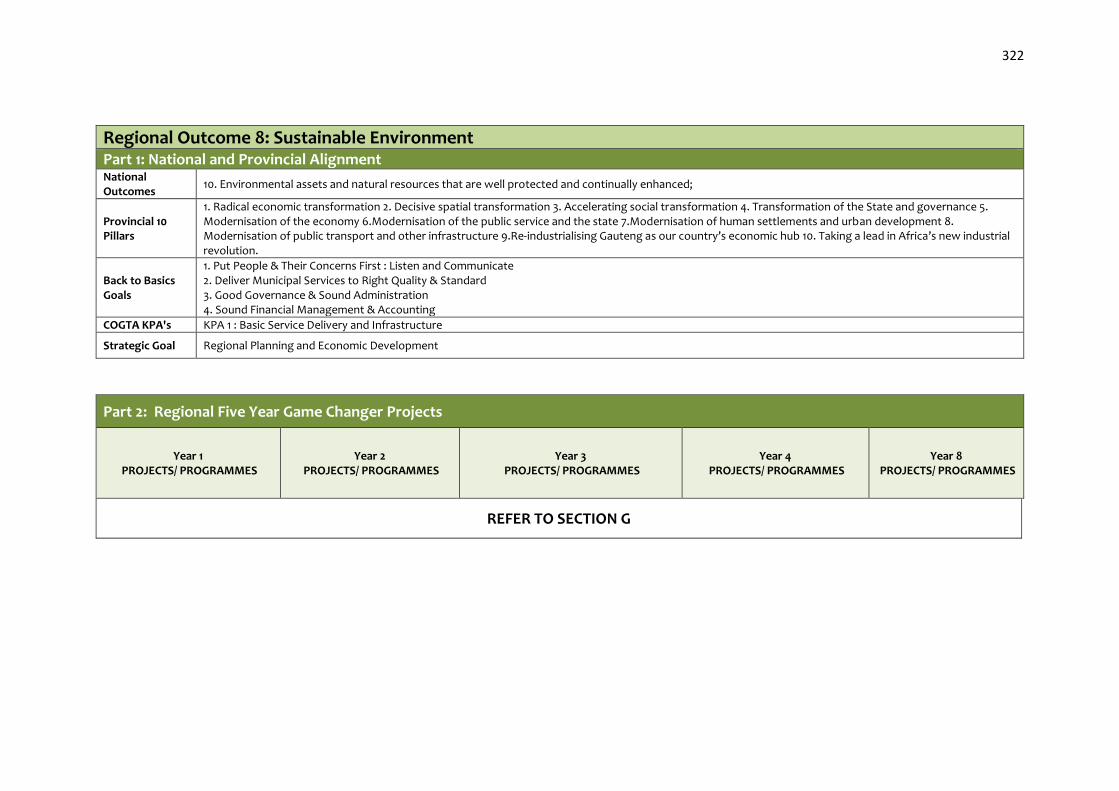
322
Regional Outcome 8: Sustainable Environment Part 1: National and Provincial Alignment National Outcomes
10. Environmental assets and natural resources that are well protected and continually enhanced;
Provincial 10 Pillars
1. Radical economic transformation 2. Decisive spatial transformation 3. Accelerating social transformation 4. Transformation of the State and governance 5. Modernisation of the economy 6.Modernisation of the public service and the state 7.Modernisation of human settlements and urban development 8. Modernisation of public transport and other infrastructure 9.Re-industrialising Gauteng as our country’s economic hub 10. Taking a lead in Africa’s new industrial revolution.
Back to Basics Goals
1. Put People & Their Concerns First : Listen and Communicate 2. Deliver Municipal Services to Right Quality & Standard 3. Good Governance & Sound Administration 4. Sound Financial Management & Accounting
COGTA KPA's KPA 1 : Basic Service Delivery and Infrastructure
Strategic Goal Regional Planning and Economic Development
Part 2: Regional Five Year Game Changer Projects
Year 1 PROJECTS/ PROGRAMMES
Year 2 PROJECTS/ PROGRAMMES
Year 3 PROJECTS/ PROGRAMMES
Year 4 PROJECTS/ PROGRAMMES
Year 8 PROJECTS/ PROGRAMMES
REFER TO SECTION G

323
Part 3: West Rand Regional Five Year Plan
MUNI. PLANNING
LEVEL PLANNING
STATEMENT INDICATOR TYPE UOM
AN
NU
AL
TA
RG
ET
/ME
AS
UR
E
Year 1
2016/ 17
Year 2 2017/
18
Year 3
2018/ 19
Year 4
2019/ 20
Year 8
2020/ 21
Administrative Political
DEPT RESP
PERSON OVER-SIGHT
Regional Outcome 8.0: Sustainable Environment
REGION-AL
REGIONAL OUTCOME
T-O-8.0
Sustainable Environment
Number (2) of Regional Air Quality & Waste By-laws reviewed
Target/measure
Number
1 – 2 2 0 0
OMM RPED WRDM
Executive Mayor
Capital R
- -
R
- R
- R
- R
-
Operating
Opex
–
Opex
Opex
Opex
Opex
WRDM OUTCOME
W-O-8.0 Sustainable Environment
Number (2) of Regional Air Quality & Waste By-laws reviewed
Target/measure
Number
1 – 2 2 0 0
OMM RPED WRDM
Executive Mayor
Capital R - -
R
- R
- R
- R
-
Operating R500
000.00 –
R 500 000
Opex
Opex
Opex

324
MCLM OUTCOME
M-O-8.0 Sustainable Environment
Review Air Quality and Waste Management By-laws
Target/measure . 0 0 0 0 0 0
OMM RPED MCLM
Executive Mayor
Capital N/A R
- R
- R
- R
- R
- R
-
Operating N/A 0 0 0 0 0 0
RWCLM OUTCOME
R-O-8.0
Sustainable Environment
Review Air Quality and Waste Management By-laws
Target/measure . 0 0 0 0 0 0
OMM RPED RWCLM
Executive Mayor
Capital N/A R
- R
- R
- R
- R
- R
-
Operating N/A 0 0 0 0 0 0
MFCLM OUTCOME
F-O-8.0
Target/measure . 0 0 0 0 0 0
OMM RPED MFCLM
Executive Mayor
Capital N/A R
- R
- R
- R
- R
- R
-
Operating N/A 0 0 0 0 0 0

325
Regional Output 8.1: Embed Green IQ Strategic Blueprint
REGIONAL REGIONAL
OUTPUT T-OP-8.1
Implementation of Green IQ Projects/ Initiatives.
Number of Climate Change Response Strategic Plan developed
Target/measure Percentage 1 0 0 1 0 0
OMM RPED WRDM
Executive Mayor
Capital Capex R -
R
- R
- R
- R
- R
-
Operating Opex Opex 0 Opex 0 0 0
WRDM OUTPUT W-OP-8.1
Target/measure Percentage 1 0 0 1 0 0
OMM RPED WRDM
Executive Mayor
Capital Capex R
- R
- R
- R
- R
- R
-
Operating Opex Opex 0 Opex 0 0 0
MCLM OUTPUT M-OP-8.1
Target/measure . 0 0 0 1 0 0
OMM RPED MCLM
Executive Mayor
Capital N/A R
- R
- R
- R
- R
- R
-
Operating N/A 0 0 0 0 0 0
RWCLM OUTPUT R-OP-8.1
Target/measure . 0 0 0 1 0 0
OMM RPED RWCLM
Executive Mayor
Capital N/A R
- R
- R
- R
- R
- R
-
Operating N/A 0 0 0 0 0 0
MFCLM OUTPUT F-OP-8.1
Target/measure . 0 0 0 1 0 0
OMM RPED MFCLM
Executive Mayor
Capital N/A R
- R
- R
- R
- R
- R
-
Operating N/A 0 0 0 0 0 0

326
Regional Sub Output 8.1.1: Develop and Implement Climate Change Response Strategic Plan
REGIONAL
REGIONAL SUB
OUTPUT T-SO-8.1.1
Implement Climate Change Response Strategic Plan
No. Climate Change Response Strategic Plan
Target/measure Number 1 0 1 0 0 0
OMM RPED WRDM MMC
Capital N/A R -
R
- R
- R
- R
- R
-
Operating Opex Opex Opex 0 0 0
WRDM SUB
OUTPUT W-SO-8.1.1
Target/measure Number 1 . 1 0 0 0
OMM RPED WRDM MMC
Capital N/A R -
R
- R
- R
- R
- R
-
Operating Opex R500
000.000 0
R 500 000
0 0 0
MCLM SUB
OUTPUT M-SO-8.1.1
Target/measure . 0 0 0 0 0 0
OMM RPED MCLM MMC
Capital N/A R
- R
- R
- R
- R
- R
-
Operating N/A 0 0 0 0 0 0
RWCLM SUB
OUTPUT R-SO-8.1.1
Target/measure . 0 0 0 0 0 0
OMM RPED RWCLM
MMC Capital N/A
R
- R
- R
- R
- R
- R
-
Operating N/A 0 0 0 0 0 0
MFCLM SUB
OUTPUT M-SO-8.1.1
Target/measure . 0 0 0 0 0 0
OMM RPED MFCLM
MMC Capital N/A
R
- R
- R
- R
- R
- R
-
Operating N/A 0 0 0 0 0 0
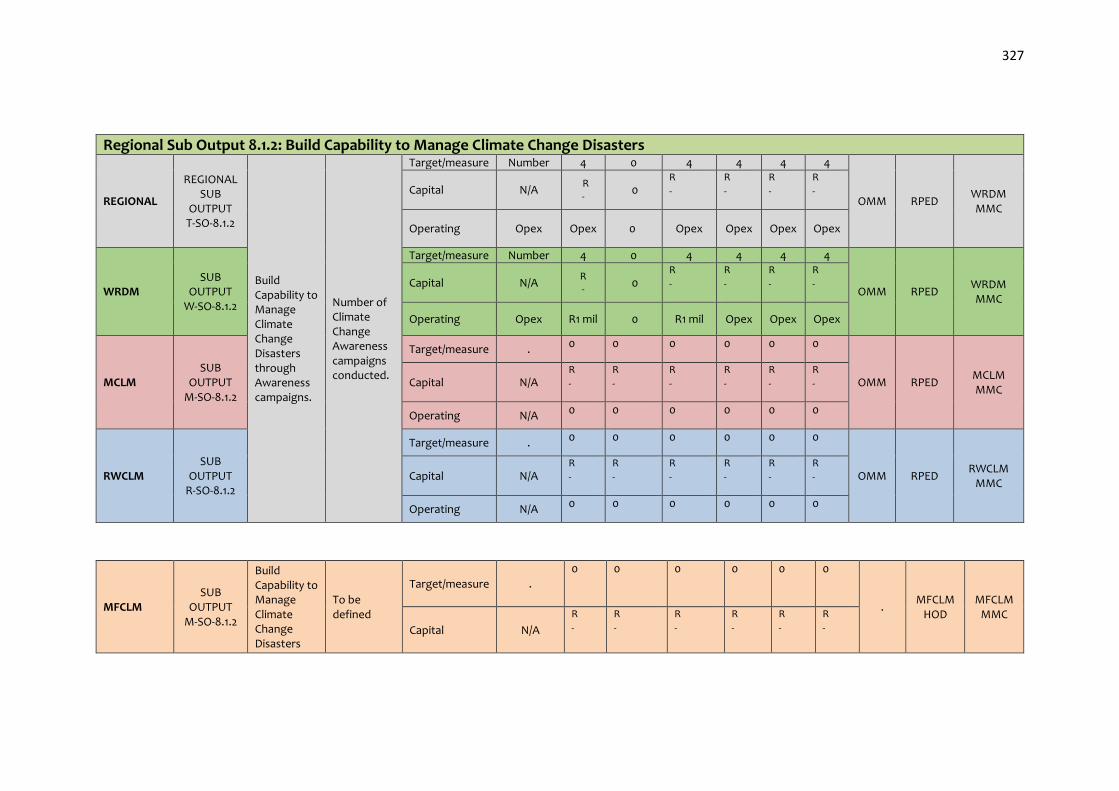
327
Regional Sub Output 8.1.2: Build Capability to Manage Climate Change Disasters
REGIONAL
REGIONAL SUB
OUTPUT T-SO-8.1.2
Build Capability to Manage Climate Change Disasters through Awareness campaigns.
Number of Climate Change Awareness campaigns conducted.
Target/measure Number 4 0 4 4 4 4
OMM RPED WRDM MMC
Capital N/A R -
0 R
- R
- R
- R
-
Operating Opex Opex 0 Opex Opex Opex Opex
WRDM SUB
OUTPUT W-SO-8.1.2
Target/measure Number 4 0 4 4 4 4
OMM RPED WRDM MMC
Capital N/A R - 0
R
- R
- R
- R
-
Operating Opex R1 mil 0 R1 mil Opex Opex Opex
MCLM SUB
OUTPUT M-SO-8.1.2
Target/measure . 0 0 0 0 0 0
OMM RPED MCLM MMC
Capital N/A R
- R
- R
- R
- R
- R
-
Operating N/A 0 0 0 0 0 0
RWCLM SUB
OUTPUT R-SO-8.1.2
Target/measure . 0 0 0 0 0 0
OMM RPED RWCLM
MMC Capital N/A
R
- R
- R
- R
- R
- R
-
Operating N/A 0 0 0 0 0 0
MFCLM SUB
OUTPUT M-SO-8.1.2
Build Capability to Manage Climate Change Disasters
To be defined
Target/measure .
0 0 0 0 0 0
. MFCLM
HOD MFCLM
MMC
Capital N/A
R
- R
- R
- R
- R
- R
-

328
Operating N/A
0 0 0 0 0 0
Regional Sub Output 8.1.3: Develop and Implement Innovative Technologies and Renewable Energy Sources
REGIONAL REGIONAL
SUB OUTPUT T-SO-8.1.3
Develop and Implement Innovative Technologies and Renewable Energy Sources
Number of programmes developed and implemented on innovation and technology in renewable energy sources
Target/measure . 0 0 0 0 0 0
OMM RPED WRDM MMC
Capital N/A R
- R
- R
- R
- R
- R
-
Operating N/A 0 0 0 0 0 0
WRDM SUB OUTPUT
W-SO-8.1.3
Target/measure . 0 0 0 0 0 0
OMM RPED WRDM MMC
Capital N/A R
- R
- R
- R
- R
- R
-
Operating N/A 0 0 0 0 0 0
MCLM SUB OUTPUT
M-SO-8.1.3
Target/measure . 0 0 0 0 0 0
OMM RPED MCLM MMC
Capital N/A R
- R
- R
- R
- R
- R
-
Operating N/A 0 0 0 0 0 0
RWCLM SUB OUTPUT
R-SO-8.1.3
Target/measure . 0 0 0 0 0 0
OMM RPED RWCLM
MMC Capital N/A
R
- R
- R
- R
- R
- R
-
Operating N/A 0 0 0 0 0 0
MFCLM SUB OUTPUT
M-SO-8.1.3
Target/measure . 0 0 0 0 0 0
OMM RPED MFCLM
MMC Capital
N/A
R
- R
- R
- R
- R
- R
-

329
Operating N/A 0 0 0 0 0 0

330
Regional Sub Output 8.1.4: Air Quality and Environmental Compliance
REGIONAL
REGIONAL SUB
OUTPUT T-SO-8.1.4
Ensure compliance to Air Quality and Environmental Legislations
Percentage (100%) compliance with Environmental legislations
Target/measure Percentage 100% 100% 100% 100% 100% 100%
OMM RPED WRDM MMC
Capital N/A R -
R
- R
- R
- R
- R
-
Operating Opex Opex Opex Opex Opex Opex Opex
WRDM SUB
OUTPUT W-SO-8.1.4
Target/measure Percentage 100% 100% 100% 100% 100% 100%
OMM RPED WRDM MMC
Capital N/A R -
R
- R
- R
- R
- R
-
Operating Opex R2,2 mil
Opex R2,2 mil
Opex Opex Opex
MCLM SUB
OUTPUT M-SO-8.1.4
Target/measure . 0 0 0 0 0 0
OMM RPED MCLM MMC
Capital N/A R -
R
- R
- R
- R
- R
-
Operating N/A 0 0 0 0 0 0
RWCLM SUB
OUTPUT R-SO-8.1.4
Target/measure . 0 0 0 0 0 0
OMM RPED RWCLM
MMC Capital N/A
R -
R
- R
- R
- R
- R
-
Operating N/A 0 0 0 0 0 0
MFCLM SUB
OUTPUT M-SO-8.1.4
Target/measure . 0 0 0 0 0 0
OMM RPED MFCLM
MMC Capital N/A
R -
R
- R
- R
- R
- R
-
Operating N/A 0 0 0 0 0 0
Regional Sub Output 8.1.5: Open Space Management
REGIONAL
REGIONAL SUB
OUTPUT T-SO-8.1.5
Ensure open Space Management through eradication of illegal dumping, greening and awareness campaigns.
Number of illegal dumping eradicated, in conjunction with, greening initiatives, and awareness campaigns conducted.
Target/measure Number 12 12 12 _ 12 12
OMM RPED WRDM MMC
Capital Capex R
- R
- R
- R
- R
- R
-
Operating Opex Opex Opex Opex Opex Opex Opex
MCLM SUB
OUTPUT M-SO-8.1.5
Target/measure . 0 0 0 0 0 0
OMM RPED MCLM MMC
Capital N/A R
- R
- R
- R
- R
- R
-
Operating N/A 0 0 0 0 0 0
RWCLM SUB
OUTPUT R-SO-8.1.5
Target/measure . 0 0 0 0 0 0
OMM RPED RWCLM
MMC Capital N/A
R
- R
- R
- R
- R
- R
-
Operating N/A 0 0 0 0 0 0
MFCLM SUB
OUTPUT M-SO-8.1.5
Target/measure . 0 0 0 0 0 0
OMM RPED MFCLM
MMC Capital N/A
R
- R
- R
- R
- R
- R
-
Operating N/A 0 0 0 0 0 0

331
OUTCOME 9

332
WEST RAND REGIONAL FIVE YEAR PLAN
Regional Outcome 9: Build Spatially Integrated Communities
Part 1: National and Provincial Alignment
National Outcomes 9. A responsive, accountable, effective and efficient local government system;
Provincial 10 Pillars 1. Radical economic transformation 2. Decisive spatial transformation 3. Accelerating social transformation 4. Transformation of the State and governance 5. Modernisation of the economy 7.Modernisation of human settlements and urban development. 9. Re-industrialising Gauteng as our country’s economic hub 10.Taking a lead in Africa’s new industrial revolution.
Back to Basics Goals 1. Put People & Their Concerns First: Listen and Communicate 2. Deliver Municipal Services to Right Quality & Standard 3. Good Governance & Sound Administration 4. Sound Financial Management & Accounting
COGTA KPA's KPA 6 : Spatial Development Framework
Strategic Goal Regional Planning and Economic Development
Part 2: Regional Five Year Game Changer Projects
Year 1 PROJECTS/
PROGRAMMES
Year 2 PROJECTS/ PROGRAMMES
Year 3 PROJECTS/
PROGRAMMES
Year 4 PROJECTS/ PROGRAMMES
Year 8 PROJECTS/ PROGRAMMES
REFER TO SECTION G

333
Part 3: West Rand Regional Five Year Plan
MUNI. PLANNING
LEVEL PLANNING
STATEMENT INDICATOR TYPE UOM
Year 1
2016/ 17
Year 2 2017/
18
Year 3 2018/
19
Year 4 2019/
20
Year 8
2020/ 21
Administrative Political
DEPT RESP
PERSON OVER-SIGHT
Regional Outcome 9.0: Build Spatially Integrated Communities
REGIONAL OUTCOME
T-O-9.0 Build Spatially Integrated Communities
Number (1) of framework plans
on spatially integrated
communities
Target/measure Number 0 1 0 0 0
RPR Manager
HS
WRDM Executive
Mayor
Capital R 0 R 0 R 0 R 0 R 0 R 0
Operating N/A Opex Opex Opex Opex Opex
WRDM OUTCOME
W-O-9.0
Target/measure Number 0 1 0 0 0
RPR Manager
HS
WRDM Executive
Mayor
Capital 0 0 0 0 0 0
Operating N/A Opex Opex Opex Opex Opex
MCLM OUTCOME
M-O-9.0
Build Spatially Integrated Communities
Number (1) of framework
plans on spatially
integrated communities
Target/measure Number 0 1 0 0 0
RPR Manager
HS
MCLM Executive
Mayor
Capital 0 0 0 0 0 0
Operating N/A Opex Opex Opex Opex Opex
RWCLM OUTCOME
R-O-9.0
Number Number 0 1 0 0 0
RPR Manager
HS
RWCLM Executive
Mayor
Capital 0 0 0 0 0 0
Operating N/A Opex Opex Opex Opex Opex
MFCLM OUTCOME
F-O-9.0
Target/measure Number 0 1 0 0 0
RPR Manager
HS
MFCLM Executive
Mayor
Capital 0 0 0 0 0 0
Operating N/A Opex Opex Opex Opex Opex

334
Regional Output 9.1: Regionally Integrated Spatial Planning
REGIONAL REGIONAL
OUTPUT T-OP-9.1
Regionally Integrated Spatial Planning
Number of approved
Integrated Spatial Development
Framework (SDF)
Target/measure Number 0 0 1 0 0
RPR Manager
HS
WRDM Executive
Mayor
Capital R 0 R 0 R 0 R 0 R 0 R 0
Operating Yes Opex Opex Opex Opex Opex
WRDM OUTPUT W-OP-9.1
Regionally Integrated Spatial Planning
Target/measure Number 0 0 1 0 0
RPR Manager
HS
WRDM Executive
Mayor Capital R 0 R 0 R 0 R 0 R 0 R 0
Operating Yes Opex Opex Opex Opex Opex
MCLM OUTPUT M-OP-9.1
Regionally Integrated Spatial Planning
Target/measure Number 1 1 1 1 1
RPR Manager
HS
MCLM Executive
Mayor Capital R 0 R 0 R 0 R 0 R 0 R 0
Operating Yes Opex Opex Opex opex Opex
RWCLM OUTPUT R-OP-9.1
Regionally Integrated Spatial Planning
Target/measure Number 1 1 1 1 1
RPR Manager
HS
RWCLM Executive
Mayor
Capital R 0 R 0 R 0 R 0 R 0 R 0
Operating Yes Opex Opex Opex Opex Opex
MFCLM OUTPUT F-OP-9.1
Regionally Integrated Spatial Planning
Target/measure Number 1 1 1 1 1
RPR Manager
HS
MFCLM Executive
Mayor
Capital R 0 R 0 R 0 R 0 R 0 R 0
Operating Yes Opex Opex Opex Opex Opex
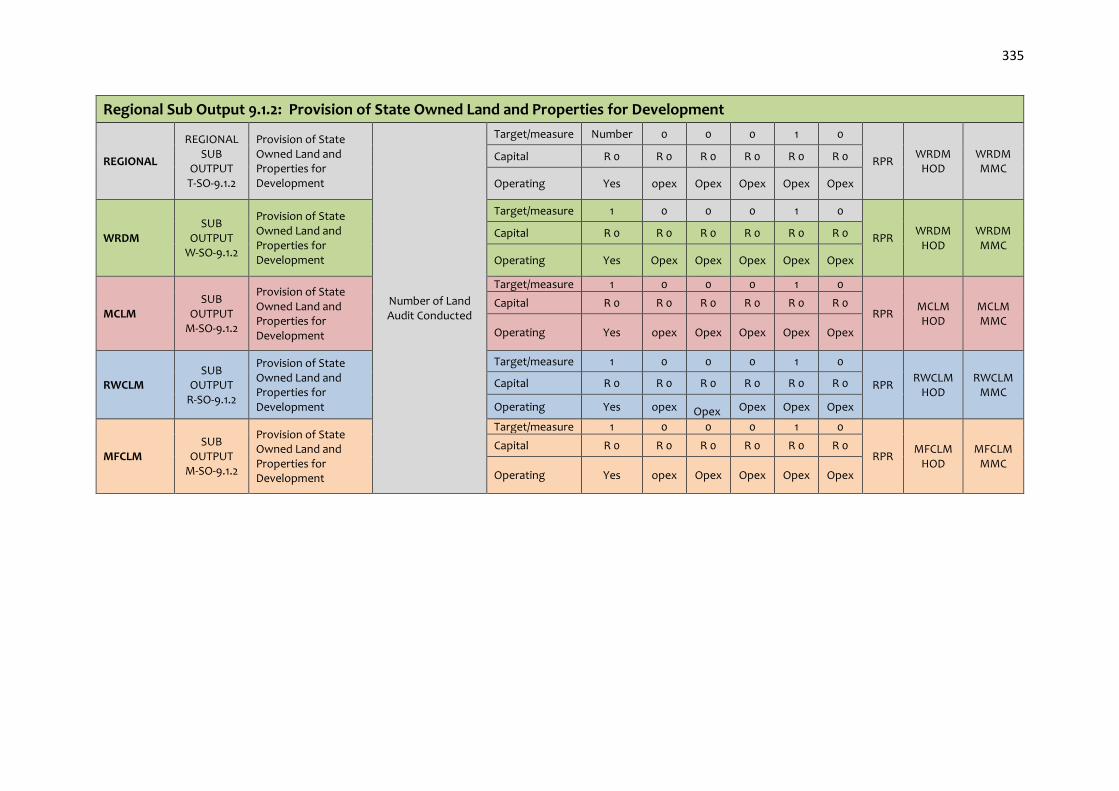
335
Regional Sub Output 9.1.2: Provision of State Owned Land and Properties for Development
REGIONAL
REGIONAL SUB
OUTPUT T-SO-9.1.2
Provision of State Owned Land and Properties for Development
Number of Land Audit Conducted
Target/measure Number 0 0 0 1 0
RPR WRDM
HOD WRDM MMC
Capital R 0 R 0 R 0 R 0 R 0 R 0
Operating Yes opex Opex Opex Opex Opex
WRDM SUB
OUTPUT W-SO-9.1.2
Provision of State Owned Land and Properties for Development
Target/measure 1 0 0 0 1 0
RPR WRDM
HOD WRDM MMC
Capital R 0 R 0 R 0 R 0 R 0 R 0
Operating Yes Opex Opex Opex Opex Opex
MCLM SUB
OUTPUT M-SO-9.1.2
Provision of State Owned Land and Properties for Development
Target/measure 1 0 0 0 1 0
RPR MCLM HOD
MCLM MMC
Capital R 0 R 0 R 0 R 0 R 0 R 0
Operating Yes opex Opex Opex Opex Opex
RWCLM SUB
OUTPUT R-SO-9.1.2
Provision of State Owned Land and Properties for Development
Target/measure 1 0 0 0 1 0
RPR RWCLM
HOD RWCLM
MMC Capital R 0 R 0 R 0 R 0 R 0 R 0
Operating Yes opex Opex Opex Opex Opex
MFCLM SUB
OUTPUT M-SO-9.1.2
Provision of State Owned Land and Properties for Development
Target/measure 1 0 0 0 1 0
RPR MFCLM
HOD MFCLM
MMC
Capital R 0 R 0 R 0 R 0 R 0 R 0
Operating Yes opex Opex Opex Opex Opex

336
Regional Sub Output 9.1.3: Law Enforcement : Illegal Land use
REGIONAL
REGIONAL SUB
OUTPUT T-SO-9.1.3
Law Enforcement : Illegal Land use
Number of Land Use Framework Developed and Implemented
Target/measure 0 0 0 0 1 0
RPR WRDM
HOD WRDM MMC
Capital R 0 R 0 R 0 R 0 R 0 R 0
Operating Yes Opex Opex Opex Opex Opex
WRDM SUB
OUTPUT W-SO-9.1.3
Law Enforcement : Illegal Land use
Development Land use Framework and implementation of the By Laws
Target/measure 0 0 0 0 1 0
RPR WRDM
HOD WRDM MMC Capital 0 0 0 0 0 0
Operating Yes Opex Opex Opex Opex Opex
MCLM SUB
OUTPUT M-SO-9.1.3
Law Enforcement : Illegal Land use
% Implementation of By Land use By Laws
Target/measure 100 100 100 100 100 100
RPR MCLM HOD
MCLM MMC
Capital 0 0 0 0 0 0
Operating Yes Opex Opex Opex Opex Opex
RWCLM SUB
OUTPUT R-SO-9.1.3
% Implementation of By Land use By Laws
Target/measure 100 100 100 100 100 100
RPR RWCLM
HOD RWCLM
MMC Capital 0 0 0 0 0 0
Operating Yes Opex Opex Opex Opex Opex
MFCLM SUB
OUTPUT M-SO-9.1.3
% Implementation of By Land use By Laws
Target/measure 100 100 100 100 100 100
RPR MFCLM
HOD MFCLM
MMC Capital 0 0 0 0 0 0
Operating Yes Opex Opex Opex Opex Opex

337
Regional Sub Output 9.1.4: Implementation of SPLUMA Regulatory Framework
REGIONAL
REGIONAL SUB
OUTPUT T-SO-9.1.4
Implementation of SPLUMA Regulatory Framework
Number (1) of District Planning
Tribunal established
Target/measure 1 0 1 0 0 0
RPR WRDM
HOD WRDM MMC Capital 0 0 0 0 0 0
Operating Yes Opex Opex Opex Opex Opex
WRDM SUB
OUTPUT W-SO-9.1.4
Implementation of SPLUMA Regulatory Framework
Target/measure 1 0 1 0 0 0
RPR WRDM
HOD WRDM MMC Capital 0 0 0 0 0 0
Operating Yes Opex Opex Opex Opex Opex
MCLM SUB
OUTPUT M-SO-9.1.4
Implementation of SPLUMA Regulatory Framework
Number of approved SPLUMA By-Laws
Target/measure 1 1 1 1 1 1
RPR MCLM HOD
MCLM MMC
Target/measure
Capital 0 0 0 0 0 0
Operating Yes Opex Opex Opex Opex Opex
RWCLM SUB
OUTPUT R-SO-9.1.4
Implementation of SPLUMA Regulatory Framework
Target/measure 1 1 1 1 1 1
RPR RWCLM
HOD RWCLM
MMC Capital 0 0 0 0 0 0
Operating Yes Opex Opex Opex Opex Opex
MFCLM SUB
OUTPUT M-SO-9.1.4
Implementation of SPLUMA Regulatory Framework
Target/measure 1 1 1 1 1 1
RPR MFCLM
HOD MFCLM
MMC Capital 0 0 0 0 0 0
Operating Yes Opex Opex Opex Opex Opex

338
Regional Sub Output 9.1.5: Building Controls
REGIONAL
REGIONAL SUB
OUTPUT T-SO-9.1.5
Building Controls
Number of Statistical Analysis
reports on approved building
plans
Target/measure 1 1 1 1 1 1
RPR WRDM
HOD WRDM MMC Capital 0 0 0 0 0 0
Operating Yes Opex Opex Opex Opex Opex
WRDM SUB
OUTPUT W-SO-9.1.5
Target/measure 1 1 1 1 1 1
RPR WRDM
HOD WRDM MMC Capital 0 0 0 0 0 0
Operating Yes Opex Opex Opex Opex Opex
MCLM SUB
OUTPUT M-SO-9.1.5
Target/measure 1 1 1 1 1 1
RPR MCLM HOD
MCLM MMC Capital 0 0 0 0 0 0
Operating Yes Opex Opex Opex Opex Opex
RWCLM SUB
OUTPUT R-SO-9.1.5
Target/measure 1 1 1 1 1 1
RPR RWCLM
HOD RWCLM
MMC Capital 0 0 0 0 0 0
Operating Yes Opex Opex Opex Opex Opex
MFCLM SUB
OUTPUT M-SO-9.1.5
Target/measure 1 1 1 1 1 1
RPR MFCLM
HOD MFCLM
MMC Capital 0 0 0 0 0 0
Operating Yes Opex Opex Opex Opex Opex

339
Regional Sub Output 9.1.6: Land Use Management
REGIONAL
REGIONAL SUB
OUTPUT T-SO-9.1.5
Development of Land Use Management System (starting with sourcing of funding)
Number of District Wide Development Tribunal Established
Target/measure Number 0 0 1 0 0
RPR WRDM
HOD WRDM MMC Capital Yes Capex Capex Capex Capex Capex
Operating R 0 R 0 R 0 R 0 R 0 R 0
WRDM SUB
OUTPUT W-SO-9.1.5
Target/measure Number 0 0 1 0 0
RPR WRDM
HOD WRDM MMC
Capital Yes Capex Capex Capex Capex Capex
Operating N/A
MCLM SUB
OUTPUT M-SO-9.1.5
Land Use Management (New Town Planning Scheme)
Number of town planning schemes
developed
Target/measure 1 1 1 1 1 1
RPR MCLM HOD
MCLM MMC
Capital Yes Capex Capex Capex Capex Capex
Operating R 0 R 0 R 0 R 0 R 0 R 0
RWCLM SUB
OUTPUT R-SO-9.1.5
Target/measure Number 1 1 1 1 1
RPR RWCLM
HOD RWCLM
MMC Capital Yes Capex Capex Capex Capex Capex
Operating N/A
MFCLM SUB
OUTPUT M-SO-9.1.5
Target/measure Number 1 1 1 1 1
RPR MFCLM
HOD MFCLM
MMC Capital Yes Capex Capex Capex Capex Capex
Operating N/A
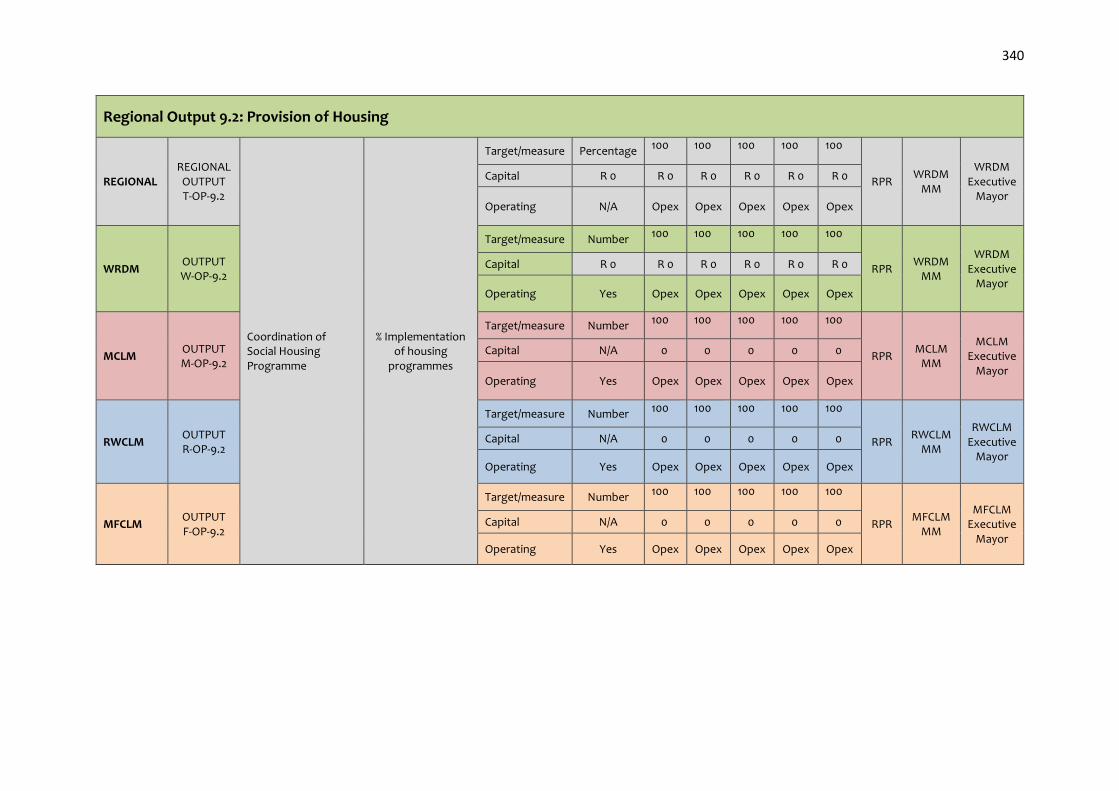
340
Regional Output 9.2: Provision of Housing
REGIONAL REGIONAL
OUTPUT T-OP-9.2
Coordination of Social Housing Programme
% Implementation of housing
programmes
Target/measure Percentage 100 100 100 100 100
RPR WRDM
MM
WRDM Executive
Mayor
Capital R 0 R 0 R 0 R 0 R 0 R 0
Operating N/A Opex Opex Opex Opex Opex
WRDM OUTPUT W-OP-9.2
Target/measure Number 100 100 100 100 100
RPR WRDM
MM
WRDM Executive
Mayor
Capital R 0 R 0 R 0 R 0 R 0 R 0
Operating Yes Opex Opex Opex Opex Opex
MCLM OUTPUT M-OP-9.2
Target/measure Number 100 100 100 100 100
RPR MCLM
MM
MCLM Executive
Mayor
Capital N/A 0 0 0 0 0
Operating Yes Opex Opex Opex Opex Opex
RWCLM OUTPUT R-OP-9.2
Target/measure Number 100 100 100 100 100
RPR RWCLM
MM
RWCLM Executive
Mayor
Capital N/A 0 0 0 0 0
Operating Yes Opex Opex Opex Opex Opex
MFCLM OUTPUT F-OP-9.2
Target/measure Number 100 100 100 100 100
RPR MFCLM
MM
MFCLM Executive
Mayor
Capital N/A 0 0 0 0 0
Operating Yes Opex Opex Opex Opex Opex

341
OUTCOME 10

342
. WEST RAND REGIONAL FIVE YEAR PLAN
Regional Outcome 10: Socially Cohesive Communities
Part 1: National and Provincial Alignment
National Outcomes 1. Improved quality of basic Education
2. A long and healthy life for all
NDP 6. Public Health system cannot meet the demand and sustain quality
7. Public services are uneven and often of poor quality
Provincial 10 Pillars
3. Accelerating transformation
6. Modernisation of the public service and the state
Sustainability Development Goals
1. End poverty in all its forms everywhere
3. Ensure healthy lives and promote well being at all ages
4. Ensure inclusive and equitable education and promote life long learning opportunities for all
5. Achieve gender equality and empower all women and girls
7. Ensure available and sustainable management of water and sanitation for all
11. Make cities and human settlement inclusive, safe, resilient and sustainable
13. Take action to combat climate change and its impact (in line with United Nations Framwork Convention on Climate Change

343
Millennium Development Goals
2. Achieve universal primary education
3. Promote gender equlity and empower women
4. Reduce child mortality
5. improve maternal mortality
6. Combat HIV and AIDs, Malaria and other diseases
7. Ensure environmental sustainability
Back to Basics Goals
1. Put people and their concerns first - listen & communicate
2. Deliver municipal services to the right quality and standard
3. Good governance and sound administration
4. Sound finacial management and accounting
5. Building institution and administrative capabilities
COGTA KPA's 3. Service Delivery and infrustructure development
Regional Goals Health & Social Development: Long and healthy life for all socially integrated communities

344
Part 2: Regional Five Year Game Changer Projects
Year 1 PROJECTS/ PROGRAMMES
Year 2 PROJECTS/ PROGRAMMES
Year 3 PROJECTS/
PROGRAMMES
Year 4 PROJECTS/ PROGRAMMES
Year 8 PROJECTS/ PROGRAMMES
WRDM Projects
Promote Social Cohesion through Sports Arts and Culture Programmes across the region
WRDM Projects
Promote Social Cohesion through Sports Arts and Culture Programmes across the region
WRDM Projects
Promote Social Cohesion through Sports Arts and Culture Programmes across the region
WRDM Projects
Promote Social Cohesion through Sports Arts and Culture Programmes across the region
WRDM Projects
Promote Social Cohesion through Sports Arts and Culture Programmes across the region
REFER TO SECTION G

345
Part 3: West Rand Regional Five Year Plan
MUNI. PLANNING
LEVEL PLANNING
STATEMENT INDICATOR TYPE UOM
Year 1
2016/ 17
Year 2 2017/
18
Year 3 2018/
19
Year 4 2019/
20
Year 8
2020/ 21
Administrative Political
DEPT RESP
PERSON OVER-SIGHT
Regional Outcome 10.0: Socially Cohesive Communities
REGION-AL
REGIONAL OUTCOME
T-O-10.0
Healthy and united social cohesive community
Number of social cohesion events conducted
Target/measure Number 3 3 3 3 3
OMM WRDM
Executive Mayor
WRDM Executive
Mayor Capital 0 0 0 0 0 0
Operating Yes opex opex opex opex opex
MCLM OUTCOME M-O-10.0
Target/measure 0 0 0 0 0 0 Office of
Exec Mayor
MCLM Executive
Mayor
MCLM Executive
Mayor Capital 0 0 0 0 0 0
Operating 0 0 0 0 0 0
RWCLM OUTCOME
R-O-10.0
Target/measure 0 0 0 0 0 0 Office of
Exec Mayor
RWCLM Executive
Mayor
RWCLM Executive
Mayor Capital 0 0 0 0 0 0
Operating 0 0 0 0 0 0
MFCLM OUTCOME
F-O-10.0
Target/measure 0 0 0 0 0 0 Office of
Exec Mayor
MFCLM Executive
Mayor
MFCLM Executive
Mayor Capital 0 0 0 0 0 0
Operating 0 0 0 0 0 0

346
Regional Output 10.1: Establish a Socially Cohesive West Rand Community
REGIONAL REGIONAL
OUTPUT T-OP-10.1
Establish a Socially Cohesive West Rand Community
Number (2) reports on Social Cohesion Programmes supported
Target/measure Number 1 1 1 1 1
OMM WRDM
MM
WRDM Executive
Mayor
Capital 0 0 0 0 0 0
Operating Yes Opex Opex Opex Opex Opex
MCLM OUTPUT
M-OP-10.1
Target/measure Percentage 100 100 100 100 100
MCLM
MM
MCLM Executive
Mayor
Capital 0 0 0 0 0 0
Operating Yes Opex Opex Opex Opex Opex
RWCLM OUTPUT R-OP-10.1
Target/measure Percentage 100 100 100 100 100
RWCLM
MM
RWCLM Executive
Mayor
Capital 0 0 0 0 0 0
Operating Yes Opex Opex Opex Opex Opex
MFCLM OUTPUT F-OP-10.1
Target/measure Percentage 100 100 100 100 100
MFCLM
MM
MFCLM Executive
Mayor
Capital 0 0 0 0 0 0
Operating Yes Opex Opex Opex Opex Opex
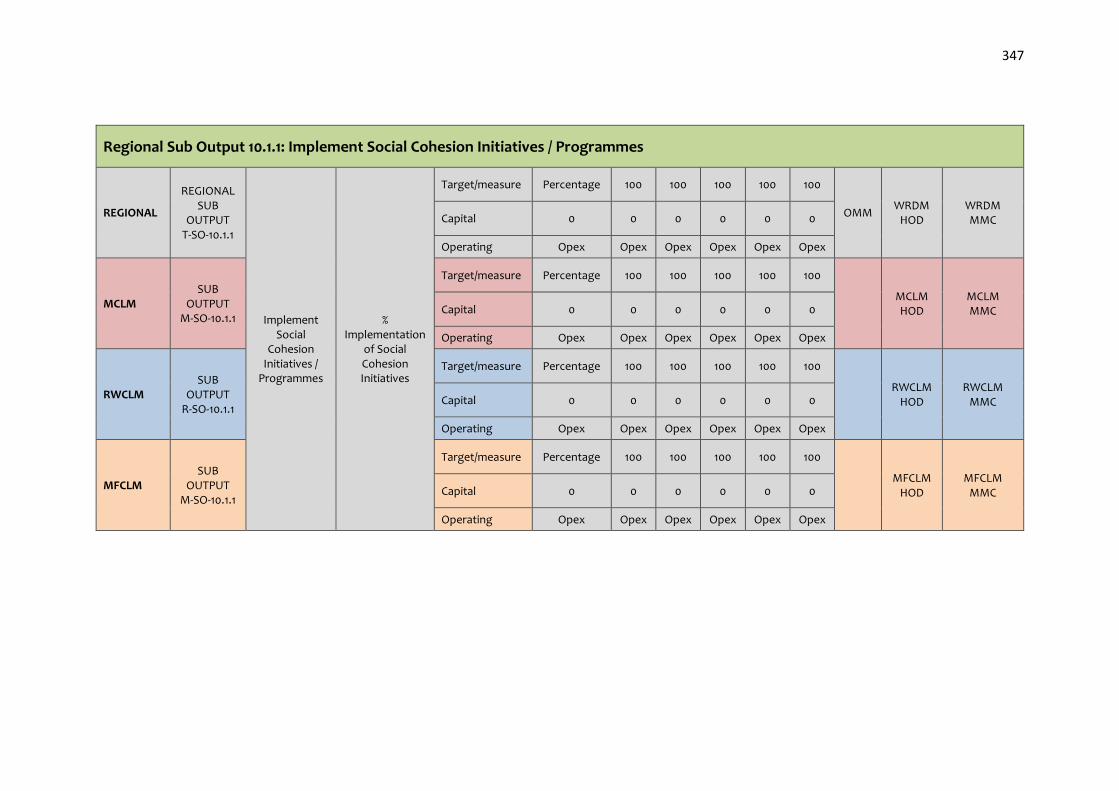
347
Regional Sub Output 10.1.1: Implement Social Cohesion Initiatives / Programmes
REGIONAL
REGIONAL SUB
OUTPUT T-SO-10.1.1
Implement Social
Cohesion Initiatives /
Programmes
% Implementation
of Social Cohesion Initiatives
Target/measure Percentage 100 100 100 100 100
OMM WRDM
HOD WRDM MMC Capital 0 0 0 0 0 0
Operating Opex Opex Opex Opex Opex Opex
MCLM SUB
OUTPUT M-SO-10.1.1
Target/measure Percentage 100 100 100 100 100
MCLM HOD
MCLM MMC Capital 0 0 0 0 0 0
Operating Opex Opex Opex Opex Opex Opex
RWCLM SUB
OUTPUT R-SO-10.1.1
Target/measure Percentage 100 100 100 100 100
RWCLM
HOD RWCLM
MMC Capital 0 0 0 0 0 0
Operating Opex Opex Opex Opex Opex Opex
MFCLM SUB
OUTPUT M-SO-10.1.1
Target/measure Percentage 100 100 100 100 100
MFCLM
HOD MFCLM
MMC Capital 0 0 0 0 0 0
Operating Opex Opex Opex Opex Opex Opex

348
OUTCOME 11

349
. WEST RAND REGIONAL FIVE YEAR PLAN
Regional Outcome 11: Reduced Unemployment
Part 1: National and Provincial Alignment
National Outcomes 4. Decent employment through inclusive economic growth;
NDP .
Provincial 10 Pillars 3. Accelerating social transformation 4. Transformation of the State and governance 5. Modernisation of the economy 9.Re-industrialising Gauteng as our country’s economic hub 10.Taking a lead in Africa’s new industrial revolution.
Back to Basics Goals 1. Put People & Their Concerns First: Listen and Communicate 2. Deliver Municipal Services to Right Quality & Standard 3. Good Governance & Sound Administration
COGTA KPA's KPA 2: Local Economic Development
Part 2: Regional Five Year Game Changer Projects
Year 1 PROJECTS/
PROGRAMMES
Year 2 PROJECTS/ PROGRAMMES
Year 3 PROJECTS/
PROGRAMMES
Year 4 PROJECTS/ PROGRAMMES
Year 8 PROJECTS/ PROGRAMMES
REFER TO SECTION G

350
Part 3: West Rand Regional Five Year Plan
MUNI. PLANNING
LEVEL PLANNING
STATEMENT INDICATOR TYPE UOM
Year 1
2018/ 18
Year 2 2018/
18
Year 3 2018/
19
Year 4
2019/ 20
Year 8
2020/ 21
Administrative Political
DEPT RESP
PERSON OVER-SIGHT
Regional Outcome 11.0: Reduced Unemployment
REGION-AL
REGIONAL OUTCOME
T-O-11.0
Reduced Unemployment
Number (4) of regional matrixes
developed on employment
iniatives (EPWP and NDPG)
Target/measure Number 4 4 4 4 4
OMM WRDM
Executive Mayor
WRDM Executive
Mayor Capital 0 0 0 0 0 0
Operating Yes Opex Opex Opex Opex Opex
WRDM OUTCOME
W-O-11.0
Target/measure Number 4 4 4 4 4 Office of
Exec Mayor
WRDM Executive
Mayor
WRDM Executive
Mayor Capital 0 0 0 0 0 0
Operating Yes Opex Opex Opex Opex Opex
MCLM OUTCOME
M-O-11.0
Target/measure Percentage 100 100 100 100 100 Office of
Exec Mayor
MCLM Executive
Mayor
MCLM Executive
Mayor Capital 0 0 0 0 0 0
Operating Yes Opex Opex Opex Opex Opex
RWCLM OUTCOME
R-O-11.0
Target/measure Percentage 100 100 100 100 100 Office of
Exec Mayor
RWCLM Executive
Mayor
RWCLM Executive
Mayor Capital 0 0 0 0 0 0
Operating Yes Opex Opex Opex Opex Opex
MFCLM OUTCOME
F-O-11.0
Target/measure Percentage 100 100 100 100 100 Office of
Exec Mayor
MFCLM Executive
Mayor
MFCLM Executive
Mayor Capital 0 0 0 0 0 0
Operating Yes Opex Opex Opex Opex Opex

351
Regional Output 11.1: Promote Job Creation Initiatives
REGIONAL REGIONAL
OUTPUT T-OP-11.1
Promote Job Creation Initiatives
Number (1) of regional strategies developed on local youth employment
initiatives
Target/measure Number 0 1 0 0 0
OMM WRDM
MM
WRDM Executive
Mayor
Capital 0 0 0 0 0 0
Operating Yes Opex Opex Opex Opex Opex
WRDM OUTPUT W-OP-11.1
Target/measure Number 0 1 0 0 0
WRDM
MM
WRDM Executive
Mayor
Capital 0 0 0 0 0 0
Operating Yes Opex Opex Opex Opex Opex
MCLM OUTPUT M-OP-11.1
Target/measure Percentage 100 100 100 100 100
MCLM
MM
MCLM Executive
Mayor
Capital 0 0 0 0 0 0
Operating Yes Opex Opex Opex Opex Opex
RWCLM OUTPUT R-OP-11.1
Target/measure Percentage 100 100 100 100 100
RWCLM
MM
RWCLM Executive
Mayor
Capital 0 0 0 0 0 0
Operating Yes Opex Opex Opex Opex Opex
MFCLM OUTPUT F-OP-11.1
Target/measure Percentage 100 100 100 100 100
MFCLM
MM
MFCLM Executive
Mayor
Capital 0 0 0 0 0 0
Operating Yes Opex Opex Opex Opex Opex
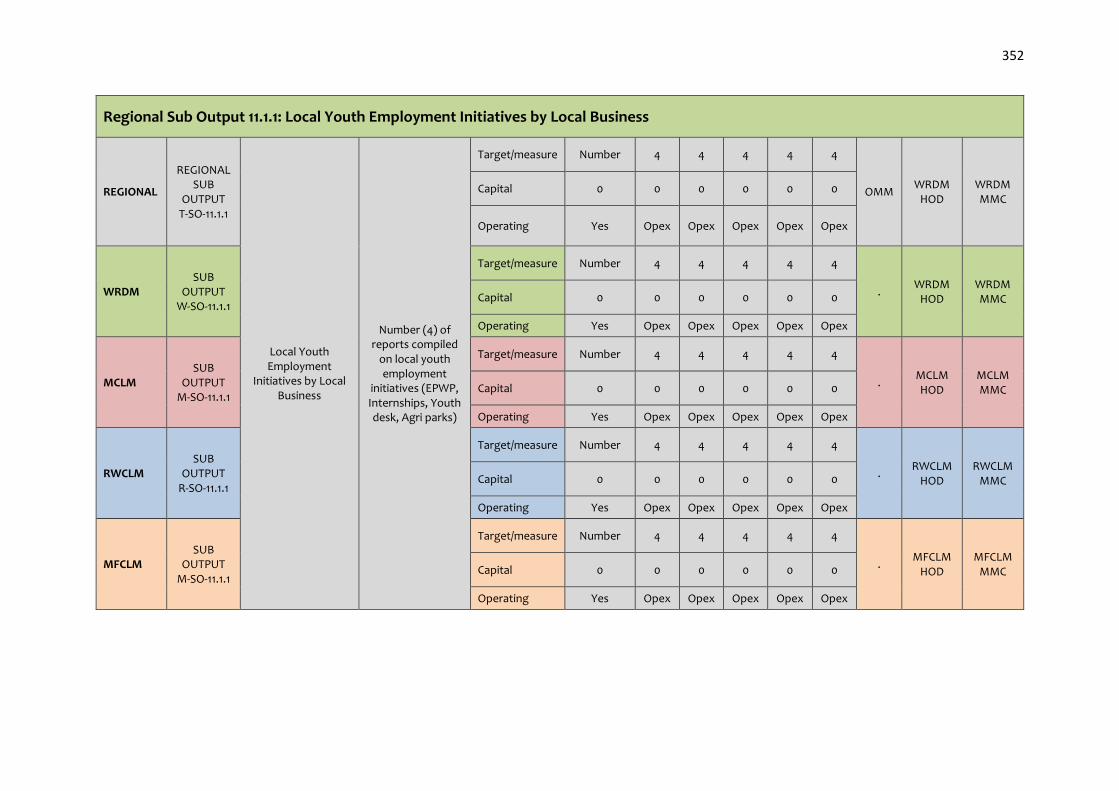
352
Regional Sub Output 11.1.1: Local Youth Employment Initiatives by Local Business
REGIONAL
REGIONAL SUB
OUTPUT T-SO-11.1.1
Local Youth Employment
Initiatives by Local Business
Number (4) of reports compiled
on local youth employment
initiatives (EPWP, Internships, Youth desk, Agri parks)
Target/measure Number 4 4 4 4 4
OMM WRDM
HOD WRDM MMC
Capital 0 0 0 0 0 0
Operating Yes Opex Opex Opex Opex Opex
WRDM SUB
OUTPUT W-SO-11.1.1
Target/measure Number 4 4 4 4 4
. WRDM
HOD WRDM MMC Capital 0 0 0 0 0 0
Operating Yes Opex Opex Opex Opex Opex
MCLM SUB
OUTPUT M-SO-11.1.1
Target/measure Number 4 4 4 4 4
. MCLM HOD
MCLM MMC Capital 0 0 0 0 0 0
Operating Yes Opex Opex Opex Opex Opex
RWCLM SUB
OUTPUT R-SO-11.1.1
Target/measure Number 4 4 4 4 4
. RWCLM
HOD RWCLM
MMC Capital 0 0 0 0 0 0
Operating Yes Opex Opex Opex Opex Opex
MFCLM SUB
OUTPUT M-SO-11.1.1
Target/measure Number 4 4 4 4 4
. MFCLM
HOD MFCLM
MMC Capital 0 0 0 0 0 0
Operating Yes Opex Opex Opex Opex Opex

353
Regional Sub Output 11.1.2: Expand Community Works Programme
REGIONAL
REGIONAL SUB
OUTPUT T-SO-11.1.2
Expand Community Works Programme
Number (4) of comparative schedules on
implementation of EPWP programmes
Target/measure Percentage 4 4 4 4 4
OMM WRDM
HOD WRDM MMC Capital 0 0 0 0 0 0
Operating Yes Opex Opex Opex Opex Opex
WRDM SUB
OUTPUT W-SO-11.1.2
Target/measure Percentage 4 4 4 4 4
. WRDM
HOD WRDM MMC Capital 0 0 0 0 0 0
Operating Yes Opex Opex Opex Opex Opex
MCLM SUB
OUTPUT M-SO-11.1.2
Target/measure Percentage 100 100 100 100 100
. MCLM HOD
MCLM MMC Capital 0 0 0 0 0 0
Operating Yes Opex Opex Opex Opex Opex
RWCLM SUB
OUTPUT R-SO-11.1.2
Target/measure Percentage 100 100 100 100 100
. RWCLM
HOD RWCLM
MMC Capital 0 0 0 0 0 0
Operating Yes Opex Opex Opex Opex Opex
MFCLM SUB
OUTPUT M-SO-11.1.2
Target/measure Percentage 100 100 100 100 100
. MFCLM
HOD MFCLM
MMC Capital 0 0 0 0 0 0
Operating Yes Opex Opex Opex Opex Opex
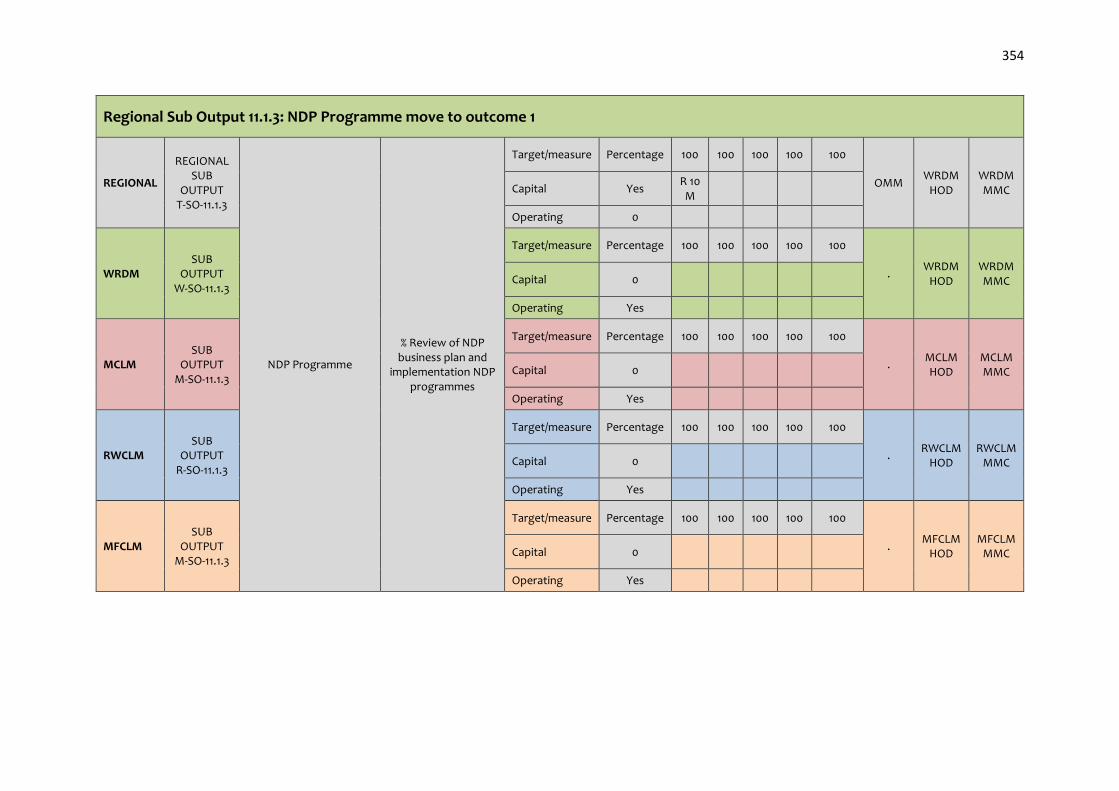
354
Regional Sub Output 11.1.3: NDP Programme move to outcome 1
REGIONAL
REGIONAL SUB
OUTPUT T-SO-11.1.3
NDP Programme
% Review of NDP business plan and
implementation NDP programmes
Target/measure Percentage 100 100 100 100 100
OMM WRDM
HOD WRDM MMC Capital Yes
R 10 M
Operating 0
WRDM SUB
OUTPUT W-SO-11.1.3
Target/measure Percentage 100 100 100 100 100
. WRDM
HOD WRDM MMC Capital 0
Operating Yes
MCLM SUB
OUTPUT M-SO-11.1.3
Target/measure Percentage 100 100 100 100 100
. MCLM HOD
MCLM MMC Capital 0
Operating Yes
RWCLM SUB
OUTPUT R-SO-11.1.3
Target/measure Percentage 100 100 100 100 100
. RWCLM
HOD RWCLM
MMC Capital 0
Operating Yes
MFCLM SUB
OUTPUT M-SO-11.1.3
Target/measure Percentage 100 100 100 100 100
. MFCLM
HOD MFCLM
MMC Capital 0
Operating Yes

355
Regional Sub Output 11.1.4: Job Creation through LED Initiatives
REGIONAL
REGIONAL SUB
OUTPUT T-SO-11.1.4
Job Creation through LED Initiatives
Number (1) of Regional Re-
Industrialisation Strategy developed in order to facilitate job creation through
LED initiatives
Target/measure Percentage 0 1 0 0 0
OMM WRDM
HOD WRDM MMC Capital Yes 0 0 0 0 0
Operating 0 Opex Opex Opex Opex Opex
WRDM SUB
OUTPUT W-SO-11.1.4
Target/measure Percentage 0 1 0 0 0
. WRDM
HOD WRDM MMC Capital Yes 0 0 0 0 0
Operating 0 Opex Opex Opex Opex Opex
MCLM SUB
OUTPUT M-SO-11.1.4
Target/measure Percentage 100 100 100 100 100
. MCLM HOD
MCLM MMC Capital Yes 0 0 0 0 0
Operating 0 Opex Opex Opex Opex Opex
RWCLM SUB
OUTPUT R-SO-11.1.4
Target/measure Percentage 100 100 100 100 100
. RWCLM
HOD RWCLM
MMC Capital Yes 0 0 0 0 0
Operating 0 Opex Opex Opex Opex Opex
MFCLM SUB
OUTPUT M-SO-11.1.4
Target/measure Percentage 100 100 100 100 100
. MFCLM
HOD MFCLM
MMC Capital Yes 0 0 0 0 0
Operating 0 Opex Opex Opex Opex Opex

356
OUTCOME 12
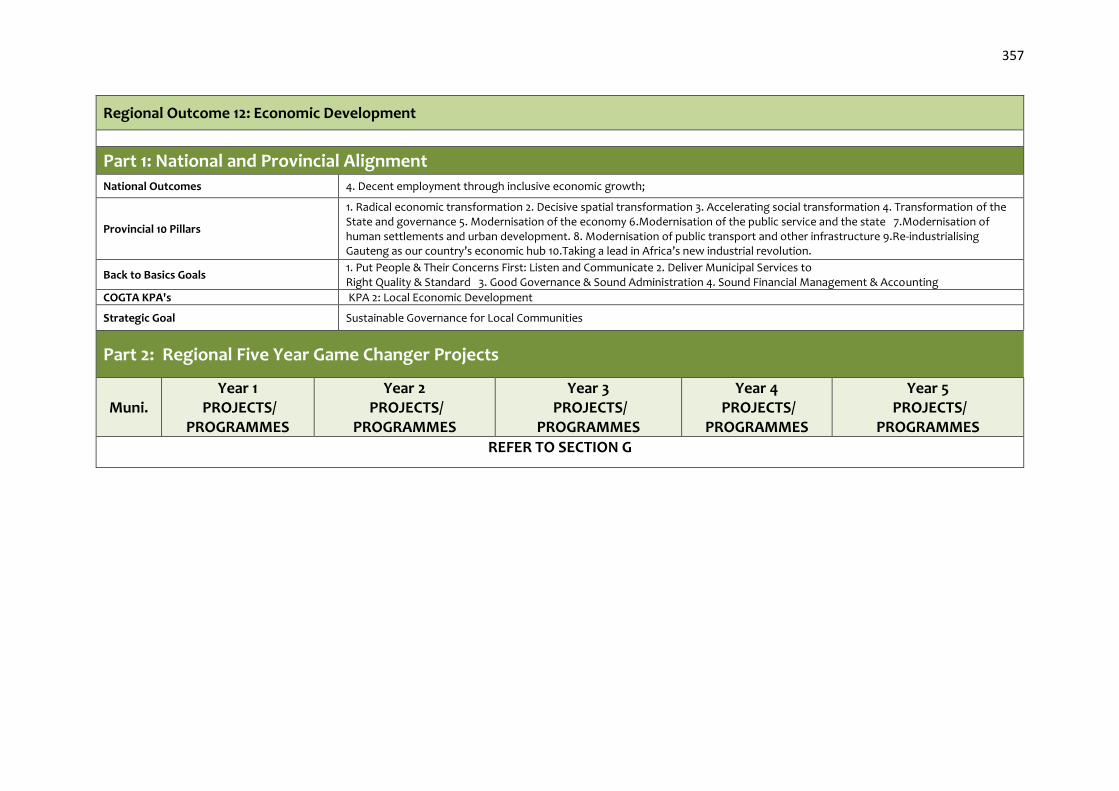
357
Regional Outcome 12: Economic Development
Part 1: National and Provincial Alignment National Outcomes 4. Decent employment through inclusive economic growth;
Provincial 10 Pillars
1. Radical economic transformation 2. Decisive spatial transformation 3. Accelerating social transformation 4. Transformation of the State and governance 5. Modernisation of the economy 6.Modernisation of the public service and the state 7.Modernisation of human settlements and urban development. 8. Modernisation of public transport and other infrastructure 9.Re-industrialising Gauteng as our country’s economic hub 10.Taking a lead in Africa’s new industrial revolution.
Back to Basics Goals 1. Put People & Their Concerns First: Listen and Communicate 2. Deliver Municipal Services to Right Quality & Standard 3. Good Governance & Sound Administration 4. Sound Financial Management & Accounting
COGTA KPA's KPA 2: Local Economic Development
Strategic Goal Sustainable Governance for Local Communities
Part 2: Regional Five Year Game Changer Projects
Muni. Year 1
PROJECTS/ PROGRAMMES
Year 2 PROJECTS/
PROGRAMMES
Year 3 PROJECTS/
PROGRAMMES
Year 4 PROJECTS/
PROGRAMMES
Year 5 PROJECTS/
PROGRAMMES
REFER TO SECTION G

358
Part 3: West Rand Regional Five Year Plan
MUNI. PLANNING
LEVEL PLANNING
STATEMENT INDICATOR TYPE UOM
Year 1
2018/ 18
Year 2
2018/ 18
Year 3
2018/ 19
Year 4
2019/ 20
Year 8
2020/ 21
Administrative Political
DEPT RESP
PERSON OVER-SIGHT
Regional Outcome 12.0: Economic Development
REGION-AL
REGIONAL OUTCOME
T-O-12.0
Economic Development
Number of reports on
implementation of Economic development programmes
Target/measure Number 4 4 4 4 4
OMM WRDM
Executive Mayor
WRDM Executive
Mayor Capital 0 0 0 0 0 0
Operating Opex Opex Opex Opex Opex Opex
WRDM OUTCOME W-O-12.0
Target/measure Number 4 4 4 4 4 Office of
Exec Mayor
WRDM Executive
Mayor
WRDM Executive
Mayor Capital 0 0 0 0 0 0
Operating Opex Opex Opex Opex Opex Opex
MCLM OUTCOME M-O-12.0
Target/measure Number 100 100 100 100 100 Office of
Exec Mayor
MCLM Executive
Mayor
MCLM Executive
Mayor Capital 0 0 0 0 0 0
Operating Opex Opex Opex Opex Opex Opex
RWCLM OUTCOME
R-O-12.0
Target/measure Number 100 100 100 100 100 Office of
Exec Mayor
RWCLM Executive
Mayor
RWCLM Executive
Mayor Capital 0 0 0 0 0 0
Operating Opex Opex Opex Opex Opex Opex
MFCLM OUTCOME
F-O-12.0
Target/measure Number 100 100 100 100 100 Office of
Exec Mayor
MFCLM Executive
Mayor
MFCLM Executive
Mayor Capital 0 0 0 0 0 0
Operating Opex Opex Opex Opex Opex Opex

359
Regional Output 12.1: Promote Regional Economic Development and Growth
REGIONAL REGIONAL
OUTPUT T-OP-12.1
Promote Regional Economic
Development and Growth
Number (2) of reports on
economic sectors identified and
promoted
number Number 2 2 2 2 2
OMM WRDM
MM
WRDM Executive
Mayor
Capital 0 0 0 0 0 0
Operating Yes Opex Opex Opex Opex Opex
WRDM OUTPUT W-OP-12.1
Target/measure Number 2 2 2 2 2
. WRDM
MM
WRDM Executive
Mayor
Capital 0 0 0 0 0 0
Operating Yes Opex Opex Opex Opex Opex
MCLM OUTPUT M-OP-12.1
Target/measure Number 3 3 3 3 3
. MCLM
MM
MCLM Executive
Mayor
Capital 0 0 0 0 0 0
Operating Yes Opex Opex Opex Opex Opex
RWCLM OUTPUT R-OP-12.1
Target/measure Number 3 3 3 3 3
. RWCLM
MM
RWCLM Executive
Mayor
Capital 0 0 0 0 0 0
Operating Yes Opex Opex Opex Opex Opex
MFCLM OUTPUT F-OP-12.1
Target/measure Number 3 3 3 3 3
. MFCLM
MM
MFCLM Executive
Mayor
Capital 0 0 0 0 0 0
Operating Yes Opex Opex Opex Opex Opex
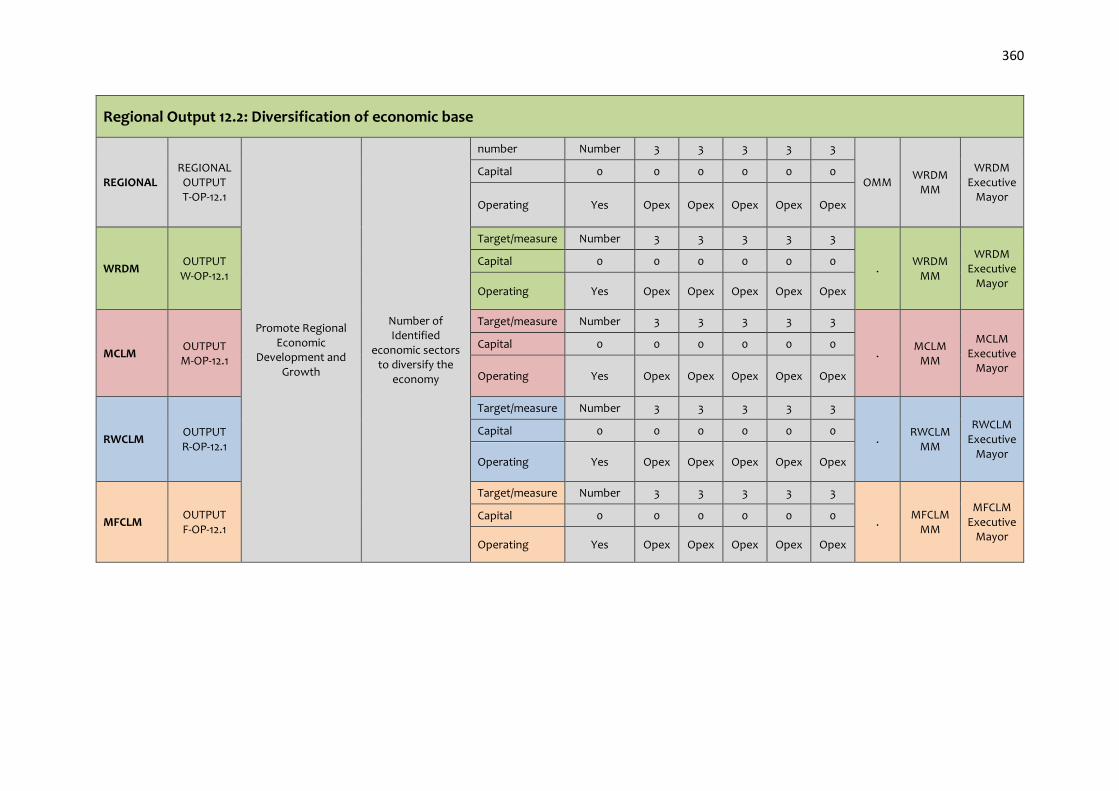
360
Regional Output 12.2: Diversification of economic base
REGIONAL REGIONAL
OUTPUT T-OP-12.1
Promote Regional Economic
Development and Growth
Number of Identified
economic sectors to diversify the
economy
number Number 3 3 3 3 3
OMM WRDM
MM
WRDM Executive
Mayor
Capital 0 0 0 0 0 0
Operating Yes Opex Opex Opex Opex Opex
WRDM OUTPUT W-OP-12.1
Target/measure Number 3 3 3 3 3
. WRDM
MM
WRDM Executive
Mayor
Capital 0 0 0 0 0 0
Operating Yes Opex Opex Opex Opex Opex
MCLM OUTPUT M-OP-12.1
Target/measure Number 3 3 3 3 3
. MCLM
MM
MCLM Executive
Mayor
Capital 0 0 0 0 0 0
Operating Yes Opex Opex Opex Opex Opex
RWCLM OUTPUT R-OP-12.1
Target/measure Number 3 3 3 3 3
. RWCLM
MM
RWCLM Executive
Mayor
Capital 0 0 0 0 0 0
Operating Yes Opex Opex Opex Opex Opex
MFCLM OUTPUT F-OP-12.1
Target/measure Number 3 3 3 3 3
. MFCLM
MM
MFCLM Executive
Mayor
Capital 0 0 0 0 0 0
Operating Yes Opex Opex Opex Opex Opex

361
Regional Sub Output 12.2.1: Diversification of economic base
REGIONAL
REGIONAL SUB
OUTPUT T-SO-12.1.1
Diversification of economic base
Number of Identified
economic sectors to diversify the
economy
Target/measure Number 3 3 3 3 3
OMM WRDM
HOD WRDM MMC Capital 0 0 0 0 0 0
Operating Yes Opex Opex Opex Opex Opex
WRDM SUB
OUTPUT W-SO-12.1.1
Target/measure Number 3 3 3 3 3
. WRDM
HOD WRDM MMC Capital 0 0 0 0 0 0
Operating Yes Opex Opex Opex Opex Opex
MCLM SUB
OUTPUT M-SO-12.1.1
Target/measure Number 3 3 3 3 3
. MCLM HOD
MCLM MMC Capital 0 0 0 0 0 0
Operating Yes Opex Opex Opex Opex Opex
RWCLM SUB
OUTPUT R-SO-12.1.1
Target/measure Number 3 3 3 3 3
. RWCLM
HOD RWCLM
MMC Capital 0 0 0 0 0 0
Operating Yes Opex Opex Opex Opex Opex
MFCLM SUB
OUTPUT M-SO-12.1.1
Target/measure Number 3 3 3 3 3
. MFCLM
HOD MFCLM
MMC Capital 0 0 0 0 0 0
Operating Yes Opex Opex Opex Opex Opex

362
Regional Sub Output 12.2.2: Expand Broad Band Access IT
REGIONAL
REGIONAL SUB
OUTPUT T-SO-12.1.2
Expand Broad Band Access
% Broadband policy developed and Implemented
Target/measure Percentage 100 100 100 100 100
OMM WRDM
HOD WRDM MMC Capital 0 0 0 0 0 0
Operating Yes Opex Opex Opex Opex Opex
WRDM SUB
OUTPUT W-SO-12.1.2
Target/measure Percentage 100 100 100 100 100
. WRDM
HOD WRDM MMC Capital 0 0 0 0 0 0
Operating Yes Opex Opex Opex Opex Opex
MCLM SUB
OUTPUT M-SO-12.1.2
Target/measure Percentage 100 100 100 100 100
. MCLM HOD
MCLM MMC Capital 0 0 0 0 0 0
Operating Yes Opex Opex Opex Opex Opex
RWCLM SUB
OUTPUT R-SO-12.1.2
Target/measure Percentage 100 100 100 100 100
. RWCLM
HOD RWCLM
MMC Capital 0 0 0 0 0 0
Operating Yes Opex Opex Opex Opex Opex
MFCLM SUB
OUTPUT M-SO-12.1.2
Target/measure Percentage 100 100 100 100 100
. MFCLM
HOD MFCLM
MMC Capital 0 0 0 0 0 0
Operating Yes Opex Opex Opex Opex Opex

363
Regional Sub Output 12.2.3: Farmer Support Initiatives
REGIONAL
REGIONAL SUB
OUTPUT T-SO-12.1.3
Farmer Support Initiatives
Framework Plan and Monitoring Tool developed for oversight on farmer initiatives
Target/measure 0 0 1 0 0 0
OMM WRDM
HOD WRDM MMC Capital N/A
Operating N/A
WRDM SUB
OUTPUT W-SO-12.1.3
Target/measure 0 0 1 0 0 0
. WRDM
HOD WRDM MMC Capital N/A
Operating N/A
MCLM SUB
OUTPUT M-SO-12.1.3
Hectare of land cultivated
Target/measure . 400 400 400 400 400
. MCLM HOD
MCLM MMC Capital N/A 0 0 0 0 0
Operating N/A Opex Opex Opex Opex Opex
RWCLM SUB
OUTPUT R-SO-12.1.3
Hectare of land cultivated
Target/measure . 400 400 400 400 400
. RWCLM
HOD RWCLM
MMC Capital N/A 0 0 0 0 0
Operating N/A Opex Opex Opex Opex Opex
MFCLM SUB
OUTPUT M-SO-12.1.3
Hectare of land cultivated
Target/measure . 400 400 400 400 400
. MFCLM
HOD MFCLM
MMC Capital N/A 0 0 0 0 0
Operating N/A Opex Opex Opex Opex Opex

364
Regional Sub Output 12.2.4: Provision of Land to enable Economic Growth, Settlement of Communities and Urbanisation
REGIONAL
REGIONAL SUB
OUTPUT T-SO-12.1.4
Provision of Land to enable Economic
Growth, Settlement of Communities and
Urbanisation
Number of lease agreements
entered into with mining houses
Number 0 0 0 0 2 0
OMM WRDM
HOD WRDM MMC
Capital 0 0 0 0 0 0
Operating Yes Opex 0 0 0 0
WRDM SUB
OUTPUT W-SO-12.1.4
Number 0 0 0 0 2 0
. WRDM
HOD WRDM MMC
Capital 0 0 0 0 0 0
Operating Yes Opex 0 0 0 0
MCLM SUB
OUTPUT M-SO-12.1.4
N/A 0 0 0 0 0 0
. MCLM HOD
MCLM MMC
N/A 0 0 0 0 0 0
Operating 0 0 0 0 0 0
RWCLM SUB
OUTPUT R-SO-12.1.4
N/A 0 0 0 0 0 0
. RWCLM
HOD RWCLM
MMC Capital 0 0 0 0 0 0
Operating 0 0 0 0 0 0
MFCLM SUB
OUTPUT M-SO-12.1.4
N/A 0 0 0 0 0 0
. MFCLM
HOD MFCLM
MMC Capital 0 0 0 0 0 0
Operating 0 0 0 0 0 0

365
Regional Sub Output 12.2.5: SMME Support Programmes
REGIONAL
REGIONAL SUB
OUTPUT T-SO-12.1.5
SMME Support Programmes
Number of SMME support
programmes implemented
Target/measure Percentage 4 4 4 4 4
OMM WRDM
HOD WRDM MMC Capital 0 0 0 0 0 0
Operating Opex Opex Opex Opex Opex Opex
WRDM SUB
OUTPUT W-SO-12.1.5
Target/measure Percentage 4 4 4 4 4
WRDM
HOD WRDM MMC Capital 0 0 0 0 0 0
Operating Opex Opex Opex Opex Opex Opex
MCLM SUB
OUTPUT M-SO-12.1.5
Target/measure Percentage 4 4 4 4 4
MCLM HOD
MCLM MMC
Capital 0 0 0 0 0 0
Operating Opex Opex Opex Opex Opex Opex
RWCLM SUB
OUTPUT R-SO-12.1.5
Target/measure Percentage 4 4 4 4 4
RWCLM
HOD RWCLM
MMC Capital 0 0 0 0 0 0
Operating Opex Opex Opex Opex Opex Opex
MFCLM SUB
OUTPUT M-SO-12.1.5
Target/measure Percentage 4 4 4 4 4
MFCLM
HOD MFCLM
MMC Capital 0 0 0 0 0 0
Operating Opex Opex Opex Opex Opex Opex

366
Regional Output 12.3: Stimulate Tourism, Township and Local Economy
REGIONAL REGIONAL
OUTPUT T-OP-12.2
Stimulate Tourism, Township and Local
Economy
Number (1) of Regional township
revitalisation policy
Target/measure Percentage 0 1 0 0 0
OMM WRDM
MM
WRDM Executive
Mayor
Capital 0 0 0 0 0 0
Operating Yes Opex Opex Opex Opex Opex
WRDM OUTPUT
W-OP-12.2
Target/measure Percentage 0 1 0 0 0
. WRDM
MM
WRDM Executive
Mayor
Capital 0 0 0 0 0 0
Operating Yes Opex Opex Opex Opex Opex
MCLM OUTPUT
M-OP-12.2
Target/measure Percentage 0 1 0 0 0
. MCLM
MM
MCLM Executive
Mayor
Capital 0 0 0 0 0 0
Operating Yes Opex Opex Opex Opex Opex
RWCLM OUTPUT R-OP-12.2
Target/measure Percentage 0 1 0 0 0
. RWCLM
MM
RWCLM Executive
Mayor
Capital 0 0 0 0 0 0
Operating Yes Opex Opex Opex Opex Opex
MFCLM OUTPUT F-OP-12.2
Target/measure Percentage 0 1 0 0 0
. MFCLM
MM
MFCLM Executive
Mayor
Capital 0 0 0 0 0 0
Operating Yes Opex Opex Opex Opex Opex

367
Regional Sub Output 12.3.1: Local Procurement of Goods and Services
REGIONAL
REGIONAL SUB
OUTPUT T-SO-12.2.1
Local Procurement of Goods and
Services
Percentage (30) of at least of the municipality
procurement are sourced from
Exempted Micro Enterprises (EME)
and Qualifying Small Enterprises(
QSE)
Target/measure Percent 30 30 30 30 30
OMM WRDM
HOD WRDM MMC Capital 0 0 0 0 0 0
Operating Yes Opex Opex Opex Opex Opex
WRDM SUB
OUTPUT W-SO-12.2.1
Target/measure Percent 30 30 30 30 30
. WRDM
HOD WRDM MMC Capital 0 0 0 0 0 0
Operating Yes Opex Opex Opex Opex Opex
MCLM SUB
OUTPUT M-SO-12.2.1
Target/measure Percent 30 30 30 30 30
. MCLM HOD
MCLM MMC Capital 0 0 0 0 0 0
Operating Yes Opex Opex Opex Opex Opex
RWCLM SUB
OUTPUT R-SO-12.2.1
Target/measure Percent 30 30 30 30 30
. RWCLM
HOD RWCLM
MMC Capital 0 0 0 0 0 0
Operating Yes Opex Opex Opex Opex Opex
MFCLM SUB
OUTPUT M-SO-12.2.1
Target/measure Percent 30 30 30 30 30
. MFCLM
HOD MFCLM
MMC Capital 0 0 0 0 0 0
Operating Yes Opex Opex Opex Opex Opex

368
Regional Sub Output 12.3.2: LED Programmes
REGIONAL
REGIONAL SUB
OUTPUT T-SO-12.2.2
LED Programmes
Number (1) of Regional Re-
Industrialisation Strategy
developed in order to facilitate
job creation through LED
initiatives
Target/measure Percentage 0 1 0 0 0
OMM WRDM
HOD WRDM MMC Capital 0 0 0 0 0 0
Operating Yes Opex Opex Opex Opex Opex
WRDM SUB
OUTPUT W-SO-12.2.2
Target/measure Percentage 0 1 0 0 0
. WRDM
HOD WRDM MMC Capital 0 0 0 0 0 0
Operating Yes Opex Opex Opex Opex Opex
MCLM SUB
OUTPUT M-SO-12.2.2
Target/measure Percentage 0 1 0 0 0
. MCLM HOD
MCLM MMC Capital 0 0 0 0 0 0
Operating Yes Opex Opex Opex Opex Opex
RWCLM SUB
OUTPUT R-SO-12.2.2
Target/measure Percentage 0 1 0 0 0
. RWCLM
HOD RWCLM
MMC Capital 0 0 0 0 0 0
Operating Yes Opex Opex Opex Opex Opex
MFCLM SUB
OUTPUT M-SO-12.2.2
Target/measure Percentage 0 1 0 0 0
. MFCLM
HOD MFCLM
MMC Capital 0 0 0 0 0 0
Operating Yes Opex Opex Opex Opex Opex
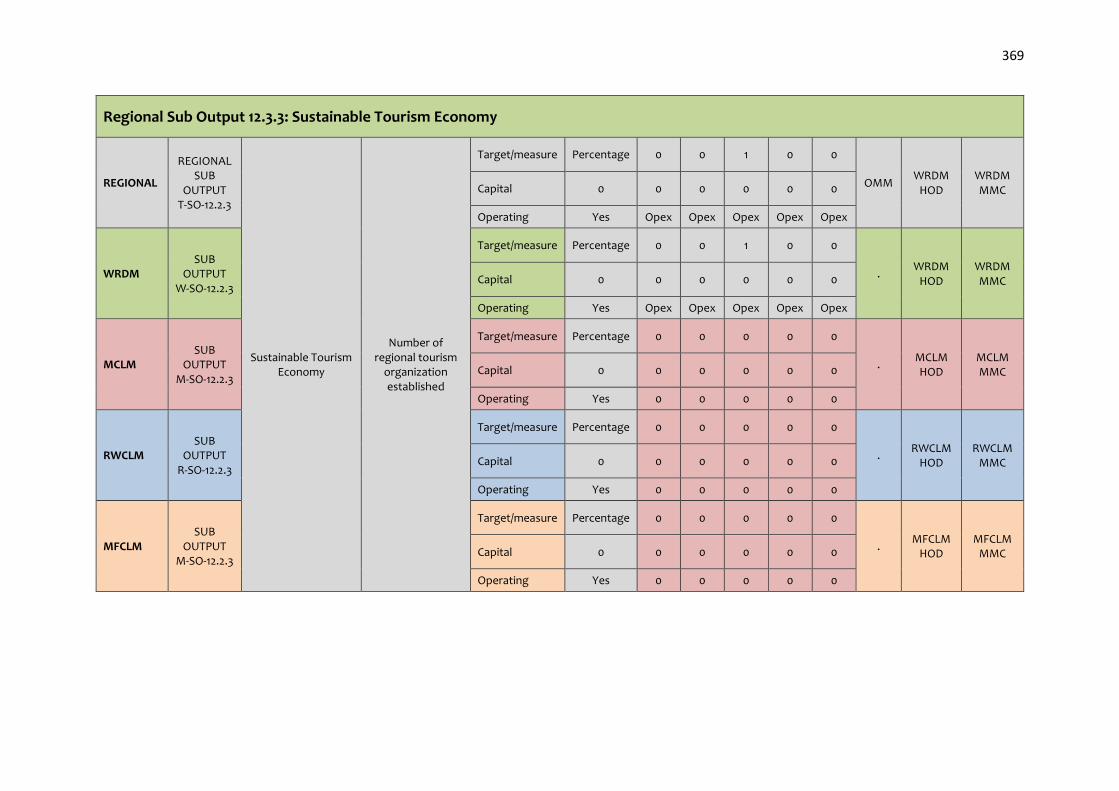
369
Regional Sub Output 12.3.3: Sustainable Tourism Economy
REGIONAL
REGIONAL SUB
OUTPUT T-SO-12.2.3
Sustainable Tourism Economy
Number of regional tourism
organization established
Target/measure Percentage 0 0 1 0 0
OMM WRDM
HOD WRDM MMC Capital 0 0 0 0 0 0
Operating Yes Opex Opex Opex Opex Opex
WRDM SUB
OUTPUT W-SO-12.2.3
Target/measure Percentage 0 0 1 0 0
. WRDM
HOD WRDM MMC Capital 0 0 0 0 0 0
Operating Yes Opex Opex Opex Opex Opex
MCLM SUB
OUTPUT M-SO-12.2.3
Target/measure Percentage 0 0 0 0 0
. MCLM HOD
MCLM MMC Capital 0 0 0 0 0 0
Operating Yes 0 0 0 0 0
RWCLM SUB
OUTPUT R-SO-12.2.3
Target/measure Percentage 0 0 0 0 0
. RWCLM
HOD RWCLM
MMC Capital 0 0 0 0 0 0
Operating Yes 0 0 0 0 0
MFCLM SUB
OUTPUT M-SO-12.2.3
Target/measure Percentage 0 0 0 0 0
. MFCLM
HOD MFCLM
MMC Capital 0 0 0 0 0 0
Operating Yes 0 0 0 0 0

370
Regional Sub Output 12.3.4: Agriparks Programme
REGIONAL
REGIONAL SUB
OUTPUT T-SO-12.2.4
Agriparks Programme
% Implementation of Agriparks Programmes
Target/measure Percentage 100 100 100 100 100
OMM WRDM
HOD WRDM MMC Capital 0 0 0 0 0 0
Operating Yes Opex Opex Opex Opex Opex
WRDM SUB
OUTPUT W-SO-12.2.4
Target/measure . 100 100 100 100 100
. WRDM
HOD WRDM MMC Capital N/A 0 0 0 0 0
Operating N/A Opex Opex Opex Opex Opex
MCLM SUB
OUTPUT M-SO-12.2.4
Target/measure . 100 100 100 100 100
. MCLM HOD
MCLM MMC Capital N/A 0 0 0 0 0
Operating N/A Opex Opex Opex Opex Opex
RWCLM SUB
OUTPUT R-SO-12.2.4
Target/measure . 100 100 100 100 100
. RWCLM
HOD RWCLM
MMC Capital N/A 0 0 0 0 0
Operating N/A Opex Opex Opex Opex Opex
MFCLM SUB
OUTPUT M-SO-12.2.4
Target/measure . 100 100 100 100 100
. MFCLM
HOD MFCLM
MMC Capital N/A 0 0 0 0 0
Operating N/A Opex Opex Opex Opex Opex

371
OUTCOME 13

372
Regional Outcome 13: Robust Financial Administration
Part 1: National and Provincial Alignment National Outcomes 9. A responsive, accountable, effective and efficient local government system;
Provincial 10 Pillars
1. Radical economic transformation 2. Decisive spatial transformation 3. Accelerating social transformation 4. Transformation of the State and governance 5. Modernisation of the economy 6.Modernisation of the public service and the state 7.Modernisation of human settlements and urban development 8. Modernisation of public transport and other infrastructure 9.Re-industrialising Gauteng as our country’s economic hub 10.Taking a lead in Africa’s new industrial revolution.
Back to Basics Goals 1. Put People & Their Concerns First: Listen and Communicate 2. Deliver Municipal Services to Right Quality & Standard 3. Good Governance & Sound Administration 4. Sound Financial Management & Accounting
COGTA KPA's KPA 4 : Institutional Transformation & Organisational Development
Strategic Goal 5. Business Excellence within the WRDM
Part 2: Regional Five Year Game Changer Projects
Year 1 PROJECTS/
PROGRAMMES
Year 2 PROJECTS/ PROGRAMMES
Year 3 PROJECTS/
PROGRAMMES
Year 4 PROJECTS/ PROGRAMMES
Year 8 PROJECTS/ PROGRAMMES
REFER TO SECTION G

373
Part 3: West Rand Regional Five Year Plan
MUNI. PLANNING
LEVEL PLANNING
STATEMENT INDICATOR TYPE UOM
Year 1
2018/ 18
Year 2 2018/
18
Year 3 2018/
19
Year 4 2019/
20
Year 8
2020/ 21
Administrative Political
DEPT RESP
PERSON OVER-SIGHT
Regional Outcome 13.0: Robust Financial Administration
REGION-AL
REGIONAL OUTCOME
T-O-13.0
Robust Financial Administration
Number of reports compiled on financial robustness
Target/measure . 1 1 1 1 1
OMM FINANCE WRDM
Executive Mayor
Capital N/A R - R - R - R - R -
Operating YES Opex Opex Opex Opex Opex
WRDM OUTCOME W-O-13.0
Target/measure . 1 1 1 1 1
OMM FINANCE WRDM
Executive Mayor
Capital N/A R - R - R - R - R -
Operating YES Opex Opex Opex Opex Opex
MCLM OUTCOME M-O-13.0
Target/measure . 1 1 1 1 1
OMM FINANCE MCLM
Executive Mayor
Capital N/A R - R - R - R - R -
Operating YES Opex Opex Opex Opex Opex
RWCLM OUTCOME
R-O-13.0
Target/measure . 1 1 1 1 1
OMM FINANCE RWCLM
Executive Mayor
Capital N/A R - R - R - R - R -
Operating YES Opex Opex Opex Opex Opex
MFCLM OUTCOME
F-O-13.0
Target/measure . 1 1 1 1 1
OMM FINANCE MFCLM
Executive Mayor
Capital N/A R - R - R - R - R -
Operating YES Opex Opex Opex Opex Opex

374
Regional Output 13.1: Clean Audit : Financial Performance
REGIONAL REGIONAL
OUTPUT T-OP-13.1
Clean Audit : Financial Performance
Submission of Financial Statements to AGSA and National Treasury by 31 August
Target/measure Number 4 4 4 4 4
OMM FINANCE WRDM
Executive Mayor
Capital R - R - R - R - R -
Operating YES opex opex opex opex opex
WRDM OUTPUT
W-OP-13.1
Target/measure Number 1 1 1 1 1
OMM FINANCE WRDM
Executive Mayor
Capital R - R - R - R - R -
Operating YES opex opex opex opex opex
MCLM OUTPUT M-OP-13.1
Target/measure Number 1 1 1 1 1
OMM FINANCE MCLM
Executive Mayor
Capital R - R - R - R - R -
Operating YES opex opex opex opex opex
RWCLM OUTPUT R-OP-13.1
Target/measure Number 1 1 1 1 1
OMM FINANCE RWCLM
Executive Mayor
Capital - R - R - R - R - R -
Operating YES opex opex opex opex opex
MFCLM OUTPUT F-OP-13.1
Target/measure Number 1 1 1 1 1
OMM FINANCE MFCLM
Executive Mayor
Capital R - R - R - R - R -
Operating YES opex opex opex opex opex

375
Regional Sub Output 13.1.1: Financial Controls and Reporting
REGIONAL
REGIONAL SUB
OUTPUT T-SO-13.1.1
Financial Controls and Reporting
Submission of section 71 reports to Moyor, National Treasury and Provincial Treasury
Target/measure Number 48 48 48 48 48
OMM FINANCE WRDM MMC Capital R - R - R - R - R -
Operating YES opex opex opex opex opex
WRDM SUB
OUTPUT W-SO-13.1.1
Target/measure Number 12 12 12 12 12
OMM FINANCE WRDM MMC Capital R - R - R - R - R -
Operating YES opex opex opex opex opex
MCLM SUB
OUTPUT M-SO-13.1.1
Target/measure Number 12 12 12 12 12
OMM FINANCE MCLM MMC Capital R - R - R - R - R -
Operating YES opex opex opex opex opex
RWCLM SUB
OUTPUT R-SO-13.1.1
Target/measure Number 12 12 12 12 12
OMM FINANCE RWCLM
MMC Capital R - R - R - R - R -
Operating YES opex opex opex opex opex
MFCLM SUB
OUTPUT M-SO-13.1.1
Target/measure Number 12 12 12 12 12
OMM FINANCE MFCLM
MMC Capital R - R - R - R - R -
Operating YES opex opex opex opex opex

376
Regional Output 13.2: Financial Viability
REGIONAL REGIONAL
OUTPUT T-OP-13.2
revenue levied v/s collected
Percentage increase in
Municipal Revenue
Target/measure % 100% 100% 100% 100% 100%
OMM FINANCE WRDM
Executive Mayor
Capital N/A R - R - R - R - R -
Operating YES opex opex opex opex opex
WRDM OUTPUT
W-OP-13.2
Target/measure % 100% 100% 100% 100% 100%
OMM FINANCE WRDM
Executive Mayor
Capital R - R - R - R - R -
Operating YES opex opex opex opex opex
MCLM OUTPUT
M-OP-13.2
Target/measure % 100% 100% 100% 100% 100%
OMM FINANCE MCLM
Executive Mayor
Capital N/A R - R - R - R - R -
Operating YES opex opex opex opex opex
RWCLM OUTPUT R-OP-13.2
Target/measure % 100% 100% 100% 100% 100%
OMM FINANCE RWCLM
Executive Mayor
Capital N/A R - R - R - R - R -
Operating YES opex opex opex opex opex
MFCLM OUTPUT F-OP-13.2
Target/measure % 100% 100% 100% 100% 100%
OMM FINANCE MFCLM
Executive Mayor
Capital N/A R - R - R - R - R -
Operating YES opex opex opex opex opex

377
Regional Sub Output 13.2.1: Maintain Robust Billing System
REGIONAL
REGIONAL SUB
OUTPUT T-SO-13.2.1
Implementation of Debt Collection
% of revenue collected v/s levied
Target/measure % 100% 100% 100% 100% 100%
OMM FINANCE WRDM MMC Capital N/A R - R - R - R - R -
Operating N/A opex opex opex opex opex
WRDM SUB
OUTPUT W-SO-13.2.1
Target/measure % 100% 100% 100% 100% 100%
OMM FINANCE WRDM MMC Capital N/A R - R - R - R - R -
Operating YES opex opex opex opex opex
MCLM SUB
OUTPUT M-SO-13.2.1
Target/measure % 100% 100% 100% 100% 100%
OMM FINANCE MCLM MMC Capital N/A R - R - R - R - R -
Operating YES opex opex opex opex opex
RWCLM SUB
OUTPUT R-SO-13.2.1
Target/measure % 100% 100% 100% 100% 100%
OMM FINANCE RWCLM
MMC Capital N/A R - R - R - R - R -
Operating YES opex opex opex opex opex
MFCLM SUB
OUTPUT M-SO-13.2.1
Target/measure % 100% 100% 100% 100% 100%
OMM FINANCE MFCLM
MMC Capital N/A R - R - R - R - R -
Operating YES opex opex opex opex opex

378
Regional Sub Output 13.2.2: Alternative Revenue Streams & Revenue Management
REGIONAL
REGIONAL SUB
OUTPUT T-SO-13.2.2
Expanding new revenue sources
Completion of a Regional Revenue Enhancement Strategy
Target/measure Number 1 1 1 1 1
OMM FINANCE WRDM MMC
Capital N/A R - R - R - R - R -
Operating YES opex opex opex opex opex
WRDM
SUB OUTPUT
W-SO-13.2.2
Target/measure Number 1 1 1 1 1
OMM FINANCE WRDM MMC
Capital N/A R - R - R - R - R -
Operating YES opex opex opex opex opex
MCLM
SUB OUTPUT
M-SO-13.2.2
Target/measure Number 1 1 1 1 1
OMM FINANCE MCLM MMC
Capital N/A R - R - R - R - R -
Operating YES opex opex opex opex opex
RWCLM SUB
OUTPUT R-SO-13.2.2
Target/measure Number 1 1 1 1 1
OMM FINANCE RWCLM
MMC
Capital N/A R - R - R - R - R -
Operating YES opex opex opex opex opex
MFCLM
SUB OUTPUT
M-SO-13.2.2
Target/measure Number 1 1 1 1 1
OMM FINANCE MFCLM
MMC
Capital N/A R - R - R - R - R -
Operating YES opex opex opex opex opex

379
Regional Sub Output 13.2.3: Cost Efficiencies
REGIONAL
REGIONAL SUB
OUTPUT T-SO-13.2.3
implementation of cost containment measures
adherence to circular 82
Target/measure % 100% 100% 100% 100% 100%
OMM FINANCE WRDM MMC
Capital N/A R - R - R - R - R -
Operating YES opex opex opex opex opex
WRDM SUB
OUTPUT W-SO-13.2.3
Target/measure % 100% 100% 100% 100% 100%
OMM FINANCE WRDM MMC
Capital N/A R - R - R - R - R -
Operating YES opex opex opex opex opex
MCLM SUB
OUTPUT M-SO-13.2.3
Target/measure % 100% 100% 100% 100% 100%
OMM FINANCE MCLM MMC
Capital N/A R - R - R - R - R -
Operating YES opex opex opex opex opex
RWCLM SUB
OUTPUT R-SO-13.2.3
Target/measure % 100% 100% 100% 100% 100%
OMM FINANCE RWCLM
MMC Capital N/A R - R - R - R - R -
Operating YES opex opex opex opex opex
MFCLM SUB
OUTPUT M-SO-13.2.3
Target/measure % 100% 100% 100% 100% 100%
OMM FINANCE MFCLM
MMC Capital N/A R - R - R - R - R -
Operating YES opex opex opex opex opex

380
Regional Sub Output 13.2.4: Bad Debts Written Off
REGIONAL
REGIONAL SUB
OUTPUT T-SO-13.2.4
Monthly reconciliation of debtors
No. of reports submiited to council for approval of bad debts write offs
Target/measure . 1 1 1 1 1
OMM FINANCE WRDM MMC Capital R - R - R - R - R -
Operating YES opex opex opex opex opex
WRDM
SUB OUTPUT
W-SO-13.2.4
Target/measure Number 1 1 1 1 1
OMM FINANCE WRDM MMC Capital R - R - R - R - R -
Operating YES opex opex opex opex opex
MCLM
SUB OUTPUT
M-SO-13.2.4
Target/measure Number 1 1 1 1 1
OMM FINANCE MCLM MMC Capital R - R - R - R - R -
Operating YES opex opex opex opex opex
RWCLM SUB
OUTPUT R-SO-13.2.4
Target/measure Number 1 1 1 1 1
OMM FINANCE RWCLM
MMC Capital R - R - R - R - R -
Operating YES opex opex opex opex opex
MFCLM
SUB OUTPUT
M-SO-13.2.4
Target/measure Number 1 1 1 1 1
OMM FINANCE MFCLM
MMC Capital R - R - R - R - R -
Operating YES opex opex opex opex opex

381
Regional Sub Output 13.2.5: Income and Expenditure Management
REGIONAL
REGIONAL SUB
OUTPUT T-SO-13.2.5
Ensure Efficient Expenditure Management within Rand West Region
Percentage Expenditure on Operational Expenditure across the region
Target/measure % 100% 100% 100% 100% 100%
OMM FINANCE WRDM MMC Capital N/A R - R - R - R - R -
Operating YES opex opex opex opex opex
WRDM SUB
OUTPUT W-SO-13.2.5
timeous payments to creditors
% of received creditors invoices paid within days
Target/measure % 100% 100% 100% 100% 100%
OMM FINANCE WRDM MMC Capital N/A R - R - R - R - R -
Operating YES opex opex opex opex opex
MCLM SUB
OUTPUT M-SO-13.2.5
Target/measure % 100% 100% 100% 100% 100%
OMM FINANCE MCLM MMC Capital N/A R - R - R - R - R -
Operating YES opex opex opex opex opex
RWCLM SUB
OUTPUT R-SO-13.2.5
Target/measure % 100% 100% 100% 100% 100%
OMM FINANCE RWCLM
MMC Capital N/A R - R - R - R - R -
Operating YES opex opex opex opex opex
MFCLM SUB
OUTPUT M-SO-13.2.5
Target/measure % 100% 100% 100% 100% 100%
OMM FINANCE MFCLM
MMC Capital N/A R - R - R - R - R -
Operating YES opex opex opex opex opex

382
Regional Sub Output 13.2.6: Financial Capability Maturity
REGIONAL
REGIONAL SUB
OUTPUT T-SO-13.2.6
Financial Capability Maturity
Number of reports compiled on financial capability maturity
Target/measure . 1 1 1 1 1
OMM FINANCE WRDM MMC Capital N/A R - R - R - R - R -
Operating YES opex opex opex opex opex
WRDM SUB
OUTPUT W-SO-13.2.6
Target/measure . 1 1 1 1 1
OMM FINANCE WRDM MMC Capital N/A R - R - R - R - R -
Operating YES opex opex opex opex opex
MCLM SUB
OUTPUT M-SO-13.2.6
Target/measure . 1 1 1 1 1
OMM FINANCE MCLM MMC Capital N/A R - R - R - R - R -
Operating YES opex opex opex opex opex
RWCLM SUB
OUTPUT R-SO-13.2.6
Target/measure . 1 1 1 1 1
OMM FINANCE RWCLM
MMC Capital N/A R - R - R - R - R -
Operating YES opex opex opex opex opex
MFCLM SUB
OUTPUT M-SO-13.2.6
Target/measure . 1 1 1 1 1
OMM FINANCE MFCLM
MMC Capital N/A R - R - R - R - R -
Operating YES opex opex opex opex opex
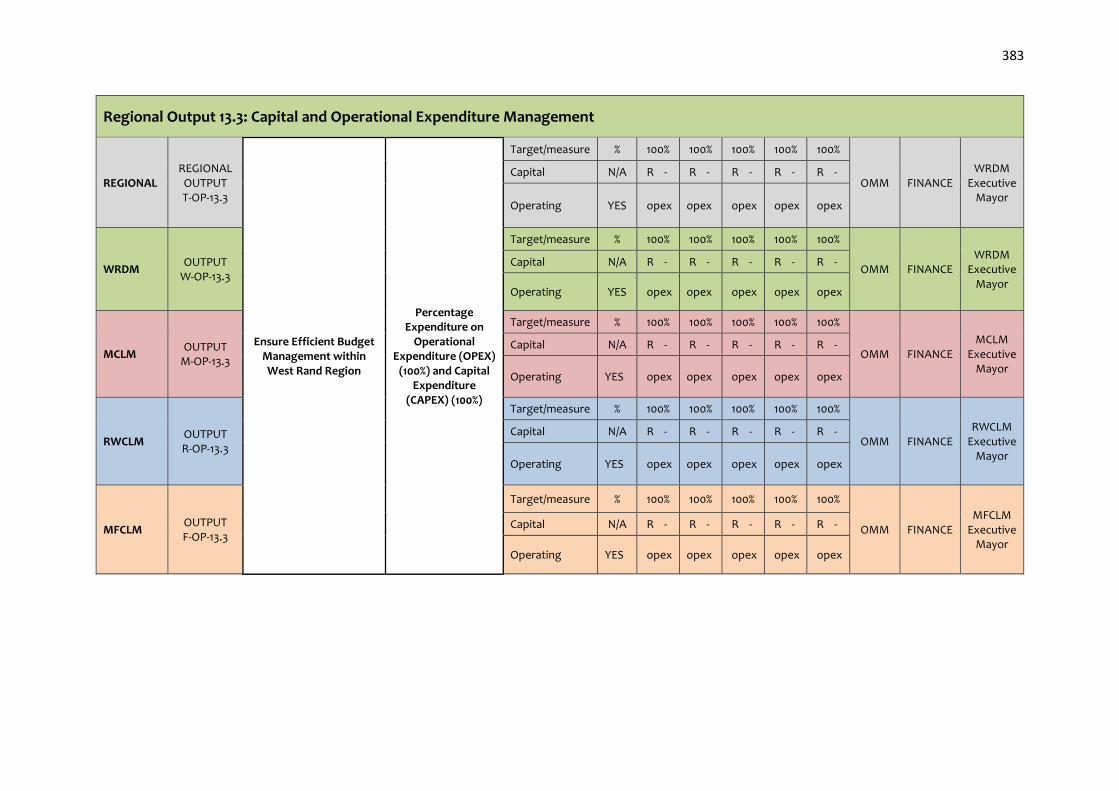
383
Regional Output 13.3: Capital and Operational Expenditure Management
REGIONAL REGIONAL
OUTPUT T-OP-13.3
Ensure Efficient Budget Management within West Rand Region
Percentage Expenditure on
Operational Expenditure (OPEX)
(100%) and Capital Expenditure
(CAPEX) (100%)
Target/measure % 100% 100% 100% 100% 100%
OMM FINANCE WRDM
Executive Mayor
Capital N/A R - R - R - R - R -
Operating YES opex opex opex opex opex
WRDM OUTPUT
W-OP-13.3
Target/measure % 100% 100% 100% 100% 100%
OMM FINANCE WRDM
Executive Mayor
Capital N/A R - R - R - R - R -
Operating YES opex opex opex opex opex
MCLM OUTPUT
M-OP-13.3
Target/measure % 100% 100% 100% 100% 100%
OMM FINANCE MCLM
Executive Mayor
Capital N/A R - R - R - R - R -
Operating YES opex opex opex opex opex
RWCLM OUTPUT R-OP-13.3
Target/measure % 100% 100% 100% 100% 100%
OMM FINANCE RWCLM
Executive Mayor
Capital N/A R - R - R - R - R -
Operating YES opex opex opex opex opex
MFCLM OUTPUT F-OP-13.3
Target/measure % 100% 100% 100% 100% 100%
OMM FINANCE MFCLM
Executive Mayor
Capital N/A R - R - R - R - R -
Operating YES opex opex opex opex opex

384
Regional Sub Output 13.3.1: Capital Budget Spent on Capital Projects
REGIONAL
REGIONAL SUB
OUTPUT T-SO-13.3.1
Ensure Efficient Capital Expenditure
Management within West Rand Region
Percentage Expenditure on
Capital Expenditure (CAPEX) (100%)
Target/measure % 100% 100% 100% 100% 100%
OMM FINANCE WRDM MMC Capital N/A R - R - R - R - R -
Operating YES opex opex opex opex opex
WRDM SUB
OUTPUT W-SO-13.3.1
Target/measure % 100% 100% 100% 100% 100%
OMM FINANCE WRDM MMC Capital N/A R - R - R - R - R -
Operating YES opex opex opex opex opex
MCLM SUB
OUTPUT M-SO-13.3.1
Target/measure % 100% 100% 100% 100% 100%
OMM FINANCE MCLM MMC Capital N/A R - R - R - R - R -
Operating YES opex opex opex opex opex
RWCLM SUB
OUTPUT R-SO-13.3.1
Target/measure % 100% 100% 100% 100% 100%
OMM FINANCE RWCLM
MMC Capital N/A R - R - R - R - R -
Operating YES opex opex opex opex opex
MFCLM SUB
OUTPUT M-SO-13.3.1
Target/measure % 100% 100% 100% 100% 100%
OMM FINANCE MFCLM
MMC Capital N/A R - R - R - R - R -
Operating YES opex opex opex opex opex

385
Regional Sub Output 13.3.2: Annual Operational Budget Spend
REGIONAL
REGIONAL SUB
OUTPUT T-SO-13.3.2
Ensure Efficient Operational Expenditure
Management within West Rand Region
Percentage Expenditure on
Operational Expenditure (OPEX)
(100%)
Target/measure % 100% 100% 100% 100% 100%
OMM FINANCE WRDM MMC Capital N/A R - R - R - R - R -
Operating YES opex opex opex opex opex
WRDM SUB
OUTPUT W-SO-13.3.2
Target/measure % 100% 100% 100% 100% 100%
OMM FINANCE WRDM MMC Capital N/A R - R - R - R - R -
Operating YES opex opex opex opex opex
MCLM SUB
OUTPUT M-SO-13.3.2
Target/measure % 100% 100% 100% 100% 100%
OMM FINANCE MCLM MMC Capital N/A R - R - R - R - R -
Operating YES opex opex opex opex opex
RWCLM SUB
OUTPUT R-SO-13.3.2
Target/measure % 100% 100% 100% 100% 100%
OMM FINANCE RWCLM
MMC Capital N/A R - R - R - R - R -
Operating YES opex opex opex opex opex
MFCLM SUB
OUTPUT M-SO-13.3.2
Target/measure % 100% 100% 100% 100% 100%
OMM FINANCE MFCLM
MMC Capital N/A R - R - R - R - R -
Operating YES opex opex opex opex opex

386
Regional Sub Output 13.3.3: Credible and Accurate Budgeting
REGIONAL
REGIONAL SUB
OUTPUT T-SO-13.3.3
Credible and Accurate Budgeting
Number of Funded Annual Budget compiled
Target/measure Number 1 1 1 1 1
OMM FINANCE WRDM MMC Capital N/A R - R - R - R - R -
Operating YES opex opex opex opex opex
WRDM
SUB OUTPUT
W-SO-13.3.3
Target/measure Number 1 1 1 1 1
OMM FINANCE WRDM MMC Capital N/A R - R - R - R - R -
Operating YES opex opex opex opex opex
MCLM
SUB OUTPUT
M-SO-13.3.3
Target/measure Number 1 1 1 1 1
OMM FINANCE MCLM MMC Capital N/A R - R - R - R - R -
Operating YES opex opex opex opex opex
RWCLM SUB
OUTPUT R-SO-13.3.3
Target/measure Number 1 1 1 1 1
OMM FINANCE RWCLM
MMC Capital N/A R - R - R - R - R -
Operating YES opex opex opex opex opex
MFCLM
SUB OUTPUT
M-SO-13.3.3
Target/measure Number 1 1 1 1 1
OMM FINANCE MFCLM
MMC Capital N/A R - R - R - R - R -
Operating YES opex opex opex opex opex

387
Regional Output 13.4: Effective and Efficient Supply Chain Management
REGIONAL REGIONAL
OUTPUT T-OP-13.4
Effective and Efficient Supply Chain Management
Number of reports compiled on effectiveness and efficiency of supply chain management
Target/measure . 1 1 1 1 1
OMM FINANCE WRDM
Executive Mayor
Capital N/A R - R - R - R - R -
Operating YES opex opex opex opex opex
WRDM OUTPUT
W-OP-13.4
Target/measure . 1 1 1 1 1
OMM FINANCE WRDM MMC
Capital N/A R - R - R - R - R -
Operating YES opex opex opex opex opex
MCLM OUTPUT
M-OP-13.4
Target/measure . 1 1 1 1 1
OMM FINANCE MCLM MMC
Capital N/A R - R - R - R - R -
Operating YES opex opex opex opex opex
RWCLM OUTPUT R-OP-13.4
Target/measure . 1 1 1 1 1
OMM FINANCE RWCLM
MMC
Capital N/A R - R - R - R - R -
Operating YES opex opex opex opex opex
MFCLM OUTPUT F-OP-13.4
Target/measure . 1 1 1 1 1
OMM FINANCE MFCLM
MMC Capital N/A R - R - R - R - R -
Operating YES opex opex opex opex opex

388
Regional Sub Output 13.4.1: Supply Chain Process Efficiency
REGIONAL
REGIONAL SUB
OUTPUT T-SO-13.4.1
Supply Chain Process Efficiency
Number of reports compiled on efficiency of supply chain processes
Target/measure . 1 1 1 1 1
OMM FINANCE WRDM MMC Capital N/A R - R - R - R - R -
Operating YES opex opex opex opex opex
WRDM SUB
OUTPUT W-SO-13.4.1
Target/measure . 1 1 1 1 1
OMM FINANCE WRDM MMC Capital N/A R - R - R - R - R -
Operating YES opex opex opex opex opex
MCLM SUB
OUTPUT M-SO-13.4.1
Target/measure . 1 1 1 1 1
OMM FINANCE MCLM MMC Capital N/A R - R - R - R - R -
Operating YES opex opex opex opex opex
RWCLM SUB
OUTPUT R-SO-13.4.1
Target/measure . 1 1 1 1 1
OMM FINANCE RWCLM
MMC Capital N/A R - R - R - R - R -
Operating YES opex opex opex opex opex
MFCLM SUB
OUTPUT M-SO-13.4.1
Target/measure . 1 1 1 1 1
OMM FINANCE MFCLM
MMC Capital N/A R - R - R - R - R -
Operating YES opex opex opex opex opex

389
Regional Sub Output 13.4.2: Delivery against the Procurement Plan
REGIONAL
REGIONAL SUB
OUTPUT T-SO-13.4.2
Delivery against the Procurement Plan
% compliance to procurement plan
Target/measure . 100 100 100 100 100
OMM FINANCE WRDM MMC Capital N/A 0 0 0 0 0
Operating YES Opex Opex Opex Opex Opex
WRDM SUB
OUTPUT W-SO-13.4.2
Target/measure . 100 100 100 100 100
OMM FINANCE WRDM MMC Capital N/A 0 0 0 0 0
Operating YES Opex Opex Opex Opex Opex
MCLM SUB
OUTPUT M-SO-13.4.2
Target/measure . 100 100 100 100 100
OMM FINANCE MCLM MMC Capital N/A 0 0 0 0 0
Operating YES Opex Opex Opex Opex Opex
RWCLM SUB
OUTPUT R-SO-13.4.2
Target/measure . 100 100 100 100 100
OMM FINANCE RWCLM
MMC Capital N/A 0 0 0 0 0
Operating YES Opex Opex Opex Opex Opex
MFCLM SUB
OUTPUT M-SO-13.4.2
Target/measure . 100 100 100 100 100
OMM FINANCE MFCLM
MMC Capital N/A 0 0 0 0 0
Operating YES Opex Opex Opex Opex Opex

390
Regional Sub Output 13.4.3: Value Added Procurement
REGIONAL
REGIONAL SUB
OUTPUT T-SO-13.4.3
Development of Suppliers & Staff knowledge with SCM Regulations/Prescripts
Number of reports compiled on Coordinating & integrating the flow of services/goods, information and finances
Target/measure Number 1 1 1 1 1
OMM FINANCE WRDM MMC Capital N/A R - R - R - R - R -
Operating YES opex opex opex opex opex
WRDM
SUB OUTPUT
W-SO-13.4.3
Target/measure Number 1 1 1 1 1
OMM FINANCE WRDM MMC Capital N/A R - R - R - R - R -
Operating YES opex opex opex opex opex
MCLM
SUB OUTPUT
M-SO-13.4.3
Target/measure Number 1 1 1 1 1
OMM FINANCE MCLM MMC Capital N/A R - R - R - R - R -
Operating YES opex opex opex opex opex
RWCLM SUB
OUTPUT R-SO-13.4.3
Target/measure Number 1 1 1 1 1
OMM FINANCE RWCLM
MMC Capital N/A R - R - R - R - R -
Operating YES opex opex opex opex opex
MFCLM
SUB OUTPUT
M-SO-13.4.3
Target/measure Number 1 1 1 1 1
OMM FINANCE MFCLM
MMC Capital N/A R - R - R - R - R -
Operating YES opex opex opex opex opex

391
Regional Sub Output 13.4.4: Supply Chain Legislative Compliance
REGIONAL
REGIONAL SUB
OUTPUT T-SO-13.4.4
Supply Chain Legislative Compliance
% Compliance to supply chain legislative prescript
Target/measure . 100 100 100 100 100
OMM FINANCE WRDM MMC Capital N/A 0 0 0 0 0
Operating YES Opex Opex Opex Opex Opex
WRDM
SUB OUTPUT
W-SO-13.4.4
Target/measure . 100 100 100 100 100
OMM FINANCE WRDM MMC Capital N/A 0 0 0 0 0
Operating YES Opex Opex Opex Opex Opex
MCLM
SUB OUTPUT
M-SO-13.4.4
Target/measure . 100 100 100 100 100
OMM FINANCE MCLM MMC Capital N/A 0 0 0 0 0
Operating YES Opex Opex Opex Opex Opex
RWCLM SUB
OUTPUT R-SO-13.4.4
Target/measure . 100 100 100 100 100
OMM FINANCE RWCLM
MMC Capital N/A 0 0 0 0 0
Operating YES Opex Opex Opex Opex Opex
MFCLM
SUB OUTPUT
M-SO-13.4.4
Target/measure . 100 100 100 100 100
OMM FINANCE MFCLM
MMC Capital N/A 0 0 0 0 0
Operating YES Opex Opex Opex Opex Opex

392
Regional Sub Output 13.4.5: Contract Management
REGIONAL
REGIONAL SUB
OUTPUT T-SO-13.4.5
Contract Management
Number of reports compiled on effective contract management
Target/measure . 1 1 1 1 1
OMM FINANCE WRDM MMC Capital N/A R - R - R - R - R -
Operating YES opex opex opex opex opex
WRDM SUB
OUTPUT W-SO-13.4.5
Target/measure . 1 1 1 1 1
OMM FINANCE WRDM MMC Capital N/A R - R - R - R - R -
Operating YES opex opex opex opex opex
MCLM SUB
OUTPUT M-SO-13.4.5
Target/measure . 1 1 1 1 1
OMM FINANCE MCLM MMC Capital N/A R - R - R - R - R -
Operating YES opex opex opex opex opex
RWCLM SUB
OUTPUT R-SO-13.4.5
Target/measure . 1 1 1 1 1
OMM FINANCE RWCLM
MMC Capital N/A R - R - R - R - R -
Operating YES opex opex opex opex opex
MFCLM SUB
OUTPUT M-SO-13.4.5
Target/measure . 1 1 1 1 1
OMM FINANCE MFCLM
MMC Capital N/A R - R - R - R - R -
Operating YES opex opex opex opex opex
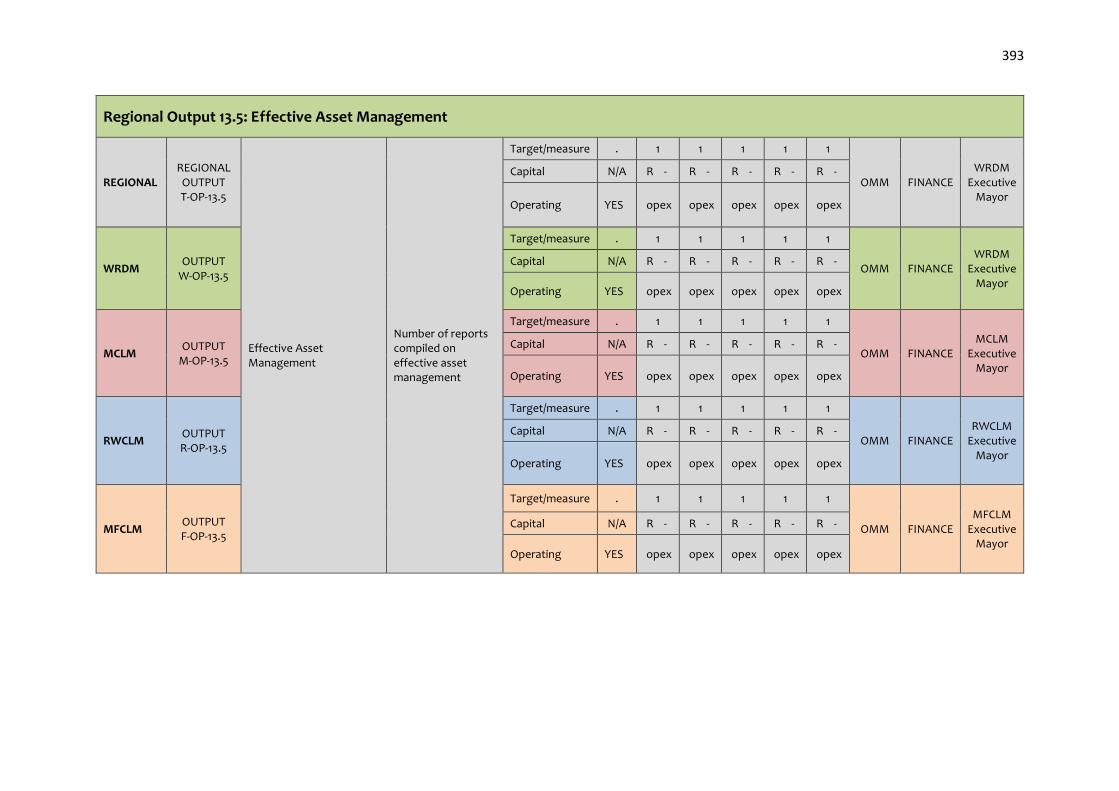
393
Regional Output 13.5: Effective Asset Management
REGIONAL REGIONAL
OUTPUT T-OP-13.5
Effective Asset Management
Number of reports compiled on effective asset management
Target/measure . 1 1 1 1 1
OMM FINANCE WRDM
Executive Mayor
Capital N/A R - R - R - R - R -
Operating YES opex opex opex opex opex
WRDM OUTPUT
W-OP-13.5
Target/measure . 1 1 1 1 1
OMM FINANCE WRDM
Executive Mayor
Capital N/A R - R - R - R - R -
Operating YES opex opex opex opex opex
MCLM OUTPUT
M-OP-13.5
Target/measure . 1 1 1 1 1
OMM FINANCE MCLM
Executive Mayor
Capital N/A R - R - R - R - R -
Operating YES opex opex opex opex opex
RWCLM OUTPUT R-OP-13.5
Target/measure . 1 1 1 1 1
OMM FINANCE RWCLM
Executive Mayor
Capital N/A R - R - R - R - R -
Operating YES opex opex opex opex opex
MFCLM OUTPUT F-OP-13.5
Target/measure . 1 1 1 1 1
OMM FINANCE MFCLM
Executive Mayor
Capital N/A R - R - R - R - R -
Operating YES opex opex opex opex opex

394
Regional Sub Output 13.5.1: Complete Accurate Fixed Asset Register
REGIONAL
REGIONAL SUB
OUTPUT T-SO-13.4.1
Complete Accurate Fixed Asset Register
Number of reports on completeness and accuracy of the fixed asset register
Target/measure . 1 1 1 1 1
OMM FINANCE WRDM MMC Capital N/A R - R - R - R - R -
Operating YES opex opex opex opex opex
WRDM SUB
OUTPUT W-SO-13.4.1
Target/measure . 1 1 1 1 1
OMM FINANCE WRDM MMC Capital N/A R - R - R - R - R -
Operating YES opex opex opex opex opex
MCLM SUB
OUTPUT M-SO-13.4.1
Target/measure . 1 1 1 1 1
OMM FINANCE MCLM MMC Capital N/A R - R - R - R - R -
Operating YES opex opex opex opex opex
RWCLM SUB
OUTPUT R-SO-13.4.1
Target/measure . 1 1 1 1 1
OMM FINANCE RWCLM
MMC Capital N/A R - R - R - R - R -
Operating YES opex opex opex opex opex
MFCLM SUB
OUTPUT M-SO-13.4.1
Target/measure . 1 1 1 1 1
OMM FINANCE MFCLM
MMC Capital N/A R - R - R - R - R -
Operating YES opex opex opex opex opex
395
OUTCOME 14

396
. WEST RAND REGIONAL FIVE YEAR PLAN
Regional Outcome 14: Institutional Planning and Transformation
Part 1: National and Provincial Alignment National Outcomes 9. A responsive, accountable, effective and efficient local government system;
Provincial 10 Pillars
1. Radical economic transformation 2. Decisive spatial transformation 3. Accelerating social transformation 4. Transformation of the State and governance 5. Modernisation of the economy 6.Modernisation of the public service and the state 7.Modernisation of human settlements and urban development 8. Modernisation of public transport and other infrastructure 9.Re-industrialising Gauteng as our country’s economic hub 10.Taking a lead in Africa’s new industrial revolution.
Back to Basics Goals 1. Put People & Their Concerns First: Listen and Communicate 2. Deliver Municipal Services to Right Quality & Standard 3. Good Governance & Sound Administration 4. Sound Financial Management & Accounting
COGTA KPA's KPA 4 : Institutional Transformation & Organisational Development
Strategic Goal 5. Business Excellence within the WRDM
Part 2: Regional Five Year Game Changer Projects
Muni. Year 1
PROJECTS/ PROGRAMMES
Year 2 PROJECTS/ PROGRAMMES
Year 3 PROJECTS/
PROGRAMMES
Year 4 PROJECTS/ PROGRAMMES
Year 5 PROJECTS/ PROGRAMMES
REFER TO SECTION G

397
Part 3: West Rand Regional Five Year Plan
MUNI. PLANNING
LEVEL PLANNING
STATEMENT INDICATOR TYPE UOM
Year 1
2016/ 17
Year 2 2017/
18
Year 3 2018/
19
Year 4 2019/
20
Year 5
2020/ 21
Administrative Political
DEPT RESP
PERSON OVER-SIGHT
Regional Outcome 14.0: Institutional Planning and Transformation
REGIONAL REGIONAL OUTCOME
T-O-14.0
Institutional Planning and Transformation
Number of reports on institutional planning and transformation initiatives conducted
Target/measure Number 1 1 1 1 1
OMM WRDM
Executive Mayor
WRDM Executive
Mayor Capital N/A R - R - R - R - R -
Operating N/A Opex Opex Opex Opex Opex
WRDM OUTCOME W-O-14.0
Target/measure Number 1 1 1 1 1 Office of
Exec Mayor
WRDM Executive
Mayor
WRDM Executive
Mayor Capital N/A R - R - R - R - R -
Operating N/A Opex Opex Opex Opex Opex
MCLM OUTCOME M-O-14.0
Target/measure Number 1 1 1 1 1 Office of
Exec Mayor
MCLM Executive
Mayor
MCLM Executive
Mayor Capital N/A R - R - R - R - R -
Operating N/A Opex Opex Opex Opex Opex
RWCLM OUTCOME
R-O-14.0
Target/measure Number 1 1 1 1 1 Office of
Exec Mayor
RWCLM Executive
Mayor
RWCLM Executive
Mayor
Capital N/A R - R - R - R - R -
Operating N/A Opex Opex Opex Opex Opex
MFCLM OUTCOME
F-O-14.0
Target/measure Number 1 1 1 1 1 Office of
Exec Mayor
MFCLM Executive
Mayor
MFCLM Executive
Mayor Capital 0 R - R - R - R - R -
Operating Yes Opex Opex Opex Opex Opex

398
Regional Output 14.1: Alternative Service Delivery Models
REGIONAL REGIONAL
OUTPUT T-OP-14.1
Alternative Service Delivery Models
% development and implementation of Alternative Service Delivery Models
Target/measure Percentage 100 100 100 100 100
. WRDM
MM
WRDM Executive
Mayor
Capital 0 R - R - R - R - R -
Operating Yes Opex Opex Opex Opex Opex
WRDM OUTPUT
W-OP-14.1
Target/measure Percentage 100 100 100 100 100
. WRDM
MM
WRDM Executive
Mayor Capital 0 R - R - R - R - R -
Operating Yes Opex Opex Opex Opex Opex
MCLM OUTPUT
M-OP-14.1
Target/measure Percentage 100 100 100 100 100
. MCLM
MM
MCLM Executive
Mayor
Capital 0 R - R - R - R - R -
Operating Yes Opex Opex Opex Opex Opex
RWCLM OUTPUT R-OP-14.1
Target/measure Percentage 100 100 100 100 100
. RWCLM
MM
RWCLM Executive
Mayor Capital 0 R - R - R - R - R -
Operating Yes Opex Opex Opex Opex Opex
MFCLM OUTPUT F-OP-14.1
Target/measure Percentage 100 100 100 100 100
. MFCLM
MM
MFCLM Executive
Mayor Capital 0 R - R - R - R - R -
Operating Yes Opex Opex Opex Opex Opex

399
Regional Sub Output 14.1.1: Anti-Corruption Programmes
REGIONAL
REGIONAL SUB
OUTPUT T-SO-14.1.1
Anti-Corruption Programmes
% Implementation of Anti-Corruption Programmes
Target/measure Percentage 100 100 100 100 100
WRDM
HOD WRDM MMC
Capital 0 R - R - R - R - R -
Operating Yes Opex Opex Opex Opex Opex
WRDM
SUB OUTPUT
W-SO-14.1.1
Target/measure Percentage 100 100 100 100 100
WRDM
HOD WRDM MMC
Capital 0 R - R - R - R - R -
Operating Yes Opex Opex Opex Opex Opex
MCLM
SUB OUTPUT
M-SO-14.1.1
Target/measure Percentage 100 100 100 100 100
MCLM HOD
MCLM MMC
Capital 0 R - R - R - R - R -
Operating Yes Opex Opex Opex Opex Opex
RWCLM
SUB OUTPUT
R-SO-14.1.1
Anti-Corruption
Programmes
% Implementation of Anti-Corruption
Programmes
Target/measure
Percentage 100 100 100 100 100
RWCLM
HOD RWCLM
MMC Capital 0 R - R - R - R -
R -
Operating Yes Opex Opex Opex Opex Opex
MFCLM
SUB OUTPUT
M-SO-14.1.1
Target/measure
Percentage 100 100 100 100 100
. MFCLM
HOD MFCLM
MMC Capital 0 R - R - R - R -
R -
Operating Yes Opex Opex Opex Opex Opex
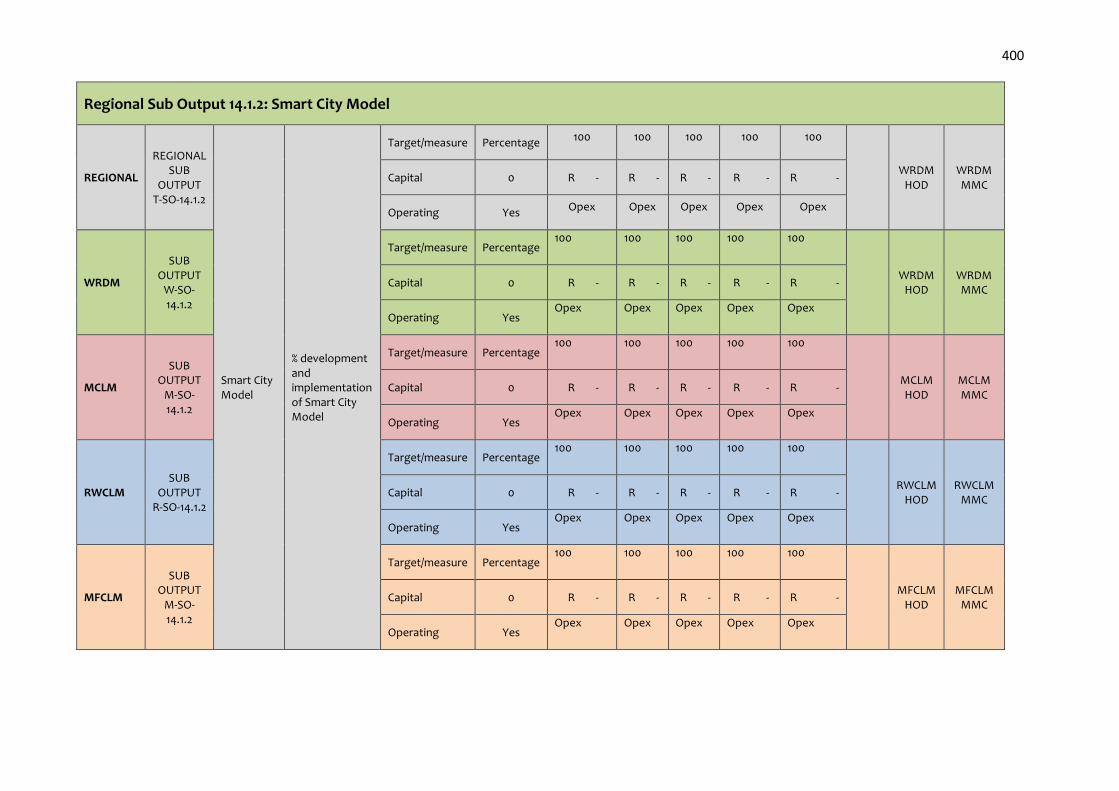
400
Regional Sub Output 14.1.2: Smart City Model
REGIONAL
REGIONAL SUB
OUTPUT T-SO-14.1.2
Smart City Model
% development and implementation of Smart City Model
Target/measure Percentage 100 100 100 100 100
WRDM
HOD WRDM MMC
Capital 0 R - R - R - R - R -
Operating Yes Opex Opex Opex Opex Opex
WRDM
SUB OUTPUT
W-SO-14.1.2
Target/measure Percentage 100 100 100 100 100
WRDM
HOD WRDM MMC
Capital 0 R - R - R - R - R -
Operating Yes Opex Opex Opex Opex Opex
MCLM
SUB OUTPUT
M-SO-14.1.2
Target/measure Percentage 100 100 100 100 100
MCLM HOD
MCLM MMC
Capital 0 R - R - R - R - R -
Operating Yes Opex Opex Opex Opex Opex
RWCLM SUB
OUTPUT R-SO-14.1.2
Target/measure Percentage 100 100 100 100 100
RWCLM
HOD RWCLM
MMC Capital 0 R - R - R - R - R -
Operating Yes Opex Opex Opex Opex Opex
MFCLM
SUB OUTPUT
M-SO-14.1.2
Target/measure Percentage 100 100 100 100 100
MFCLM
HOD MFCLM
MMC Capital 0 R - R - R - R - R -
Operating Yes Opex Opex Opex Opex Opex

401
egional Output 14.2: Clean Audit: Non-Financial Performance (Pre-Determined Objectives)
REGIONAL REGIONAL
OUTPUT T-OP-14.2
Clean Audit: Non-Financial Performance (Pre-Determined Objectives)
Quarterly Organisational Audit of Predetermined Objectives.
Target/measure Number 4 4 4 4 4
OMM MANAGER
IA
WRDM Executive
Mayor
Capital 0 R - R - R - R - R -
Operating yes Opex Opex Opex Opex Opex
Clean Audit: Non-Financial Performance (Pre-Determined Objectives)
Mid-term and Annual Performance Assessment of Sec 57 Managers.
Target/measure Number 4 4 4 4 4
Capital 0 R - R - R - R - R -
Operating yes Opex Opex Opex Opex Opex
WRDM OUTPUT
W-OP-14.2
Clean Audit: Non-Financial Performance (Pre-Determined Objectives)
Quarterly Organisational Audit of Predetermined Objectives.
Target/measure Number 4 4 4 4 4
OMM MANAGER
IA
WRDM Executive
Mayor
Capital 0 R - R - R - R - R -
Operating yes Opex Opex Opex Opex Opex
Clean Audit: Non-Financial Performance (Pre-Determined Objectives)
Mid-term and Annual Performance Assessment of Sec 57 Managers.
Target/measure Number 2 2 2 2 2
Capital 0 R - R - R - R - R -
Operating yes Opex Opex Opex Opex Opex
MCLM OUTPUT
M-OP-14.2
Clean Audit: Non-Financial Performance (Pre-Determined Objectives)
Quarterly Organisational Audit of Predetermined Objectives.
Target/measure Number 4 4 4 4 4
OMM CAE MCLM
Executive Mayor
Capital N/A
Operating yes Opex Opex Opex Opex Opex
Clean Audit: Non-Financial Performance (Pre-Determined Objectives)
Mid-term and Annual Performance Assessment of Sec 57 Managers.
Target/measure Number 2 2 2 2 2
Capital 0 R - R - R - R - R -
Operating yes Opex Opex Opex Opex Opex
RWCLM Target/measure Number 4 4 4 4 4 OMM CAE

402
OUTPUT R-OP-14.2
Clean Audit: Non-Financial Performance (Pre-Determined Objectives)
Quarterly Organisational Audit of Predetermined Objectives.
Capital N/A R - R - R - R - R -
RWCLM Executive
Mayor
Operating N/A
Opex Opex Opex Opex Opex
Clean Audit: Non-Financial Performance (Pre-Determined Objectives)
Mid-term and Annual Performance Assessment of Sec 57 Managers.
Target/measure Number 2 2 2 2 2
Capital N/A R - R - R - R - R -
Operating N/A Opex Opex Opex Opex Opex
MFCLM OUTPUT F-OP-14.2
Clean Audit: Non-Financial Performance (Pre-Determined Objectives)
Quarterly Organisational
Audit of Predetermined
Objectives.
Target/measure Number 4 4 4 4 4
OMM MANAGER
IA
MFCLM Executive
Mayor
Capital N/A R - R - R - R - R -
Operating N/A Opex Opex Opex Opex Opex
Clean Audit: Non-Financial Performance (Pre-Determined Objectives)
Mid-term and Annual
Performance Assessment of
Sec 57 Managers.
Target/measure Number 2 2 2 2 2
Capital N/A
Operating N/A
Regional Sub Output 14.2.1: Robust Regional Integrated Planning and Performance Management
REGIONAL
REGIONAL SUB
OUTPUT T-SO-14.2.1
Robust Regional Integrated Planning and Performance Management
Number of robust Regional Integrated Planning and Annual Performance Report submitted to Council
Target/measure Number 2 2 2 2 2
WRDM
HOD WRDM MMC
Capital 0 R - R - R - R - R -
Operating yes Opex Opex Opex Opex Opex
WRDM
SUB OUTPUT
W-SO-14.2.1
Target/measure Number 2 2 2 2 2
WRDM
HOD WRDM MMC
Capital 0 R - R - R - R - R -

403
Operating yes Opex Opex Opex Opex Opex
MCLM
SUB OUTPUT
M-SO-14.2.1
Target/measure Number 2 2 2 2 2
MCLM HOD
MCLM MMC
Capital 0 R - R - R - R - R -
Operating yes Opex Opex Opex Opex Opex
RWCLM
SUB OUTPUT
R-SO-14.2.1
Target/measure Number 2 2 2 2 2
RWCLM
HOD RWCLM
MMC Capital 0 R - R - R - R - R -
Operating yes Opex Opex Opex Opex Opex
MFCLM
SUB OUTPUT
M-SO-14.2.1
Target/measure Number 2 2 2 2 2
MFCLM
HOD MFCLM
MMC Capital 0 R - R - R - R - R -
Operating yes 0 0 0 0 0
Regional Sub Output 14.2.2: Effective and Efficient IGR Model
REGIONAL
REGIONAL SUB
OUTPUT T-SO-14.2.2
Effective and Efficient IGR Model
% implementation of an effective and efficient IGR Model
Target/measure
Percentage 100 100 100 100 100
WRDM
HOD WRDM MMC
Capital 0 R - R - R - R - R -
Operating Yes Opex Opex Opex Opex Opex
WRDM
SUB OUTPUT
W-SO-14.2.2
Target/measure
Percentage 100 100 100 100 100
WRDM
HOD WRDM MMC Capital 0 R - R - R - R -
R -
Operating Yes Opex Opex Opex Opex Opex

404
MCLM
SUB OUTPUT
M-SO-14.2.2
Target/measure
Percentage 100 100 100 100 100
MCLM HOD
MCLM MMC Capital 0 R - R - R - R -
R -
Operating Yes Opex Opex Opex Opex Opex
RWCLM SUB
OUTPUT R-SO-14.2.2
Target/measure
Percentage 100 100 100 100 100
RWCLM
HOD RWCLM
MMC Capital 0 R - R - R - R -
R -
Operating Yes Opex Opex Opex Opex Opex
MFCLM
SUB OUTPUT
M-SO-14.2.2
Effective and Efficient IGR Model
Target/measure
Percentage 100 100 100 100 100
MFCLM
HOD MFCLM
MMC Capital 0 R - R - R - R - R -
Operating Yes Opex Opex Opex Opex Opex
Regional Output 14.3: Efficient Corporate Support Services
REGIONAL REGIONAL
OUTPUT T-OP-14.3
Efficient Corporate Support Services
No of reports submitted to Council on the provision of administrative support to ensure the appropriate use of resources
Target/measure
Number 4 4 4 4 4
CS WRDM
MM
WRDM Executive
Mayor Capital 0 0 0 0 0 0
Operating Yes opex opex opex opex opex
WRDM OUTPUT
W-OP-14.3
Target/measure
Number 4 4 4 4 4
CS WRDM
MM
WRDM Executive
Mayor Capital 0 0 0 0 0 0
Operating Yes opex opex opex opex opex
MCLM OUTPUT
M-OP-14.3
Target/measure
Number 4 4 4 4 4 CS
MCLM MM
MCLM Executive
Mayor Capital 0 R - R - R - R - R -

405
Operating Yes opex opex opex opex opex
RWCLM OUTPUT R-OP-14.3
Target/measure
Number 4 4 4 4 4
CS RWCLM
MM
RWCLM Executive
Mayor Capital 0 R - R - R - R - R -
Operating Yes opex opex opex opex opex
MFCLM OUTPUT F-OP-14.3
Target/measure
Number 4 4 4 4 4
CS MFCLM
MM
MFCLM Executive
Mayor Capital 0 R - R - R - R - R -
Operating Yes opex opex opex opex opex
Regional Sub Output 14.3.1: IMPROVED COMMITTEE SERVICES
REGIONAL
REGIONAL SUB
OUTPUT T-SO-14.3.1
Efficient Committee Services
% Council resolutions taken vs executed within specified time
Target/measure
Percentage 100 100 100 100 100
CS WRDM
HOD WRDM MMC Capital 0
R -
R - R - R - R -
Operating Yes opex opex opex opex opex
WRDM
SUB OUTPUT
W-SO-14.3.1
Target/measure
Percentage 100 100 100 100 100
CS WRDM
HOD WRDM MMC Capital 0
R -
R - R - R - R -
Operating Yes opex opex opex opex opex
MCLM
SUB OUTPUT
M-SO-14.3.1
Target/measure
Percentage 100 100 100 100 100
CS MCLM HOD
MCLM MMC Capital 0
R -
R - R - R - R -
Operating Yes opex opex opex opex opex
RWCLM Target/measure
Percentage 100 100 100 100 100 CS RWCLM
HOD RWCLM
MMC

406
SUB OUTPUT
R-SO-14.3.1
Capital 0 R -
R - R - R - R -
Operating Yes opex opex opex opex opex
MFCLM
SUB OUTPUT
M-SO-14.3.1
Target/measure
Percentage 100 100 100 100 100
CS MFCLM
HOD MFCLM
MMC Capital 0 R -
R - R - R - R -
Operating Yes opex opex opex opex opex
Regional Sub Output 14.3.2: Responsive Legal Services
REGIONAL
REGIONAL SUB
OUTPUT T-SO-14.3.2
Responsive Legal Services
No of reports submitted to Council on responsive of legal services No of reports
submitted to
Council on
responsive of
legal services
No of reports
submitted to
Council on
responsive of
legal services
No of reports
submitted to
Council on
Target/measure Number 4 4 4 4 4
CS WRDM
HOD WRDM MMC
Capital 0 R - R - R - R - R -
Operating Yes opex opex opex opex opex
WRDM
SUB OUTPUT
W-SO-14.3.2
Target/measure Number 4 4 4 4 4
CS WRDM
HOD WRDM MMC Capital 0 R - R - R - R - R -
Operating Yes opex opex opex opex opex
MCLM
SUB OUTPUT
M-SO-14.3.2
Target/measure Number 4 4 4 4 4
CS MCLM HOD
MCLM MMC
Capital 0 R - R - R - R - R -
Operating Yes opex opex opex opex opex
RWCLM
SUB OUTPUT
R-SO-14.3.2
Target/measure Number 4 4 4 4 4
CS RWCLM
HOD RWCLM
MMC
Capital 0 R - R - R - R - R -
Operating Yes opex opex opex opex opex

407
responsive of
legal services
MFCLM
SUB OUTPUT
M-SO-14.3.2
No of reports
submitted to
Council on
responsive of
legal services
Target/measure Number 4 4 4 4 4
CS MFCLM
HOD MFCLM
MMC
Capital 0 R - R - R - R - R -
Operating Yes opex opex opex opex opex
Regional Sub Output 14.3.3: Facilities Management
REGIONAL
REGIONAL SUB
OUTPUT T-SO-14.3.3
Facilities Management
Number of reports on effective and efficient facilities management
Target/measure Number 4 4 4 4 4
. WRDM
HOD WRDM MMC
Capital 0 R - R - R - R - R -
Operating Yes Opex Opex Opex Opex Opex
WRDM
SUB OUTPUT
W-SO-14.3.3
Target/measure Number 4 4 4 4 4
WRDM
HOD WRDM MMC
Capital 0 R - R - R - R - R -
Operating Yes Opex Opex Opex Opex Opex
MCLM
SUB OUTPUT
M-SO-14.3.3
Target/measure Number 4 4 4 4 4
MCLM HOD
MCLM MMC
Capital 0 R - R - R - R - R -
Operating Yes Opex Opex Opex Opex Opex
RWCLM
SUB OUTPUT
R-SO-14.3.3
Target/measure Number 4 4 4 4 4
RWCLM
HOD RWCLM
MMC Capital 0 R - R - R - R - R -
Operating Yes Opex Opex Opex Opex Opex
MFCLM
SUB OUTPUT
M-SO-14.3.3
Target/measure Number 4 4 4 4 4
MFCLM
HOD MFCLM
MMC Capital 0 R - R - R - R - R -
Operating Yes Opex Opex Opex Opex Opex

408
Regional Sub Output 14.3.4: ICT Services
REGIONAL
REGIONAL SUB
OUTPUT T-SO-14.3.4
ICT Services
Number of reports on effective and efficient ICT Services submitted to Council
Target/measure Number 4 4 4 4 4
WRDM
HOD WRDM MMC
Capital 0 R - R - R - R - R -
Operating Yes Opex Opex Opex Opex Opex
WRDM
SUB OUTPUT
W-SO-14.3.4
Target/measure Number 4 4 4 4 4
WRDM
HOD WRDM MMC
Capital Yes R - R - R - R - R -
Operating Yes Opex Opex Opex Opex Opex
MCLM
SUB OUTPUT
M-SO-14.3.4
Target/measure Number 4 4 4 4 4
MCLM HOD
MCLM MMC
Capital 0 R - R - R - R - R -
Operating Yes Opex Opex Opex Opex Opex
RWCLM
SUB OUTPUT
R-SO-14.3.4
Target/measure Number 4 4 4 4 4
RWCLM
HOD RWCLM
MMC Capital 0 R - R - R - R - R -
Operating Yes Opex Opex Opex Opex Opex
MFCLM
SUB OUTPUT
M-SO-14.3.4
Target/measure Number 4 4 4 4 4
MFCLM
HOD MFCLM
MMC Capital 0 R - R - R - R - R -
Operating Yes Opex Opex Opex Opex Opex

409
Regional Sub Output 14.3.5: Records and Archive Management
REGIONAL
REGIONAL SUB
OUTPUT T-SO-14.3.5
Records and Archive Management
No of reports on effective and efficient records and archive management submitted to Council
Target/measure Number 4 4 4 4 4
Corporate Services
WRDM HOD
WRDM MMC
Capital 0 R - R - R - R - R -
Operating Yes opex opex opex opex opex
WRDM
SUB OUTPUT
W-SO-14.3.5
Target/measure Number 4 4 4 4 4
Corporate Services
WRDM HOD
WRDM MMC
Capital 0 R - R - R - R - R -
Operating Yes opex opex opex opex opex
MCLM
SUB OUTPUT
M-SO-14.3.5
Target/measure Number 4 4 4 4 4 Corporate Services
MCLM HOD
MCLM MMC
Capital 0 R - R - R - R - R -
Operating Yes opex opex opex opex opex
RWCLM
SUB OUTPUT
R-SO-14.3.5
Target/measure Number 4 4 4 4 4 Corporate Services
RWCLM HOD
RWCLM MMC
Capital 0 R - R - R - R - R -
Operating Yes opex opex opex opex opex
MFCLM
SUB OUTPUT
M-SO-14.3.5
Target/measure Number 4 4 4 4 4
Corporate Services
MFCLM HOD
MFCLM MMC
Capital N/A R - R - R - R - R -
Operating Yes opex opex opex opex opex

410
Regional Sub Output 14.3.6: Improved Corporate Communication and Branding
REGIONAL
REGIONAL SUB
OUTPUT T-SO-14.3.6
Corporate Communication and Branding
% Development and implementation of marketing strategy
Target/measure Percentage 100 100 100 100 100
Corporate Services
WRDM HOD
WRDM MMC
Capital 0 R - R - R - R - R -
Operating Yes opex opex opex opex opex
WRDM
SUB OUTPUT
W-SO-14.3.6
Target/measure Percentage 100 100 100 100 100
Corporate Services
WRDM HOD
WRDM MMC
Capital 0 R - R - R - R - R -
Operating Yes opex opex opex opex opex
MCLM
SUB OUTPUT
M-SO-14.3.6
Target/measure Percentage 100 100 100 100 100
Corporate Services
MCLM HOD
MCLM MMC
Capital 0 R - R - R - R - R -
Operating Yes opex opex opex opex opex
RWCLM
SUB OUTPUT
R-SO-14.3.6
Target/measure Percentage 100 100 100 100 100
Corporate Services
RWCLM HOD
RWCLM MMC
Capital 0 R - R - R - R - R -
Operating Yes opex opex opex opex opex
MFCLM
SUB OUTPUT
M-SO-14.3.6
Target/measure Percentage 100 100 100 100 100
Corporate Services
MFCLM HOD
MFCLM MMC
Capital 0 R - R - R - R - R -
Operating Yes opex opex opex opex opex

411
Regional Sub Output 14.3.7: Responsive Organisational Development
REGIONAL
REGIONAL SUB
OUTPUT T-SO-14.3.7
Effective Organisational Development
% alignment of organogram to strategy
Target/measure Percentage 60 70 80 100 100
CS WRDM
HOD WRDM MMC
Capital 0 R - R - R - R - R -
Operating Yes opex opex opex opex opex
WRDM
SUB OUTPUT
W-SO-14.3.7
Target/measure Percentage 60 70 80 100 100
CS WRDM
HOD WRDM MMC
Capital 0 R - R - R - R - R -
Operating Yes opex opex opex opex opex
MCLM
SUB OUTPUT
M-SO-14.3.7
Target/measure Percentage 60 70 80 100 100
CS MCLM HOD
MCLM MMC Capital 0 R - R - R - R - R -
Operating Yes opex opex opex opex opex
RWCLM
SUB OUTPUT
R-SO-14.3.7
Target/measure Percentage 60 70 80 100 100
CS RWCLM
HOD RWCLM
MMC Capital 0 R - R - R - R - R -
Operating Yes opex opex opex opex opex
MFCLM
SUB OUTPUT
M-SO-14.3.7
Target/measure Percentage R - R - R - R - R -
CS MFCLM
HOD MFCLM
MMC Capital 0 R - R - R - R - R -
Operating Yes opex opex opex opex opex

412
Regional Sub Output 14.3.8: Fleet Management
REGIONAL
REGIONAL SUB
OUTPUT T-SO-14.3.8
Fleet Management
Number of reports on effective and efficient fleet management
Target/measure Number 4 4 4 4 4
WRDM
HOD WRDM MMC
Capital 0 R - R - R - R - R -
Operating Yes opex opex opex opex opex
WRDM
SUB OUTPUT
W-SO-14.3.8
Target/measure Number 4 4 4 4 4
WRDM
HOD WRDM MMC
Capital 0 R - R - R - R - R -
Operating Yes opex opex opex opex opex
MCLM
SUB OUTPUT
M-SO-14.3.8
Target/measure Number 4 4 4 4 4
MCLM HOD
MCLM MMC
Capital 0 R - R - R - R - R -
Operating Yes opex opex opex opex opex
RWCLM
SUB OUTPUT
R-SO-14.3.8
Target/measure Number 4 4 4 4 4
RWCLM
HOD RWCLM
MMC Capital 0 R - R - R - R - R -
Operating Yes 0 0 0 0 0
MFCLM
SUB OUTPUT
M-SO-14.3.8
Target/measure Number 4 4 4 4 4
MFCLM
HOD MFCLM
MMC Capital 0 R - R - R - R - R -
Operating Yes
opex opex opex opex opex

413
Regional Output 14.4: Regional Institutional Performance Index
REGIONAL REGIONAL
OUTPUT T-OP-14.4
Regional Institutional Performance Index
Number of reports on Regional Institutional Performance Index
Target/measure percentage 4 4 4 4 4
WRDM
MM
WRDM Executive
Mayor Capital 0 R - R - R - R - R -
Operating Yes Opex Opex Opex Opex Opex
WRDM OUTPUT
W-OP-14.4
Target/measure percentage 4 4 4 4 4
WRDM
MM
WRDM Executive
Mayor Capital 0 R - R - R - R - R -
Operating Yes Opex Opex Opex Opex Opex
MCLM OUTPUT
M-OP-14.4
Target/measure percentage 4 4 4 4 4
MCLM
MM
MCLM Executive
Mayor Capital 0 R - R - R - R - R -
Operating Yes Opex Opex Opex Opex Opex
RWCLM OUTPUT R-OP-14.4
Target/measure percentage 4 4 4 4 4
RWCLM
MM
RWCLM Executive
Mayor Capital 0 R - R - R - R - R -
Operating Yes Opex Opex Opex Opex Opex
MFCLM OUTPUT F-OP-14.4
Target/measure percentage 4 4 4 4 4
MFCLM
MM
MFCLM Executive
Mayor Capital 0 R - R - R - R - R -
Operating Yes Opex Opex Opex Opex Opex
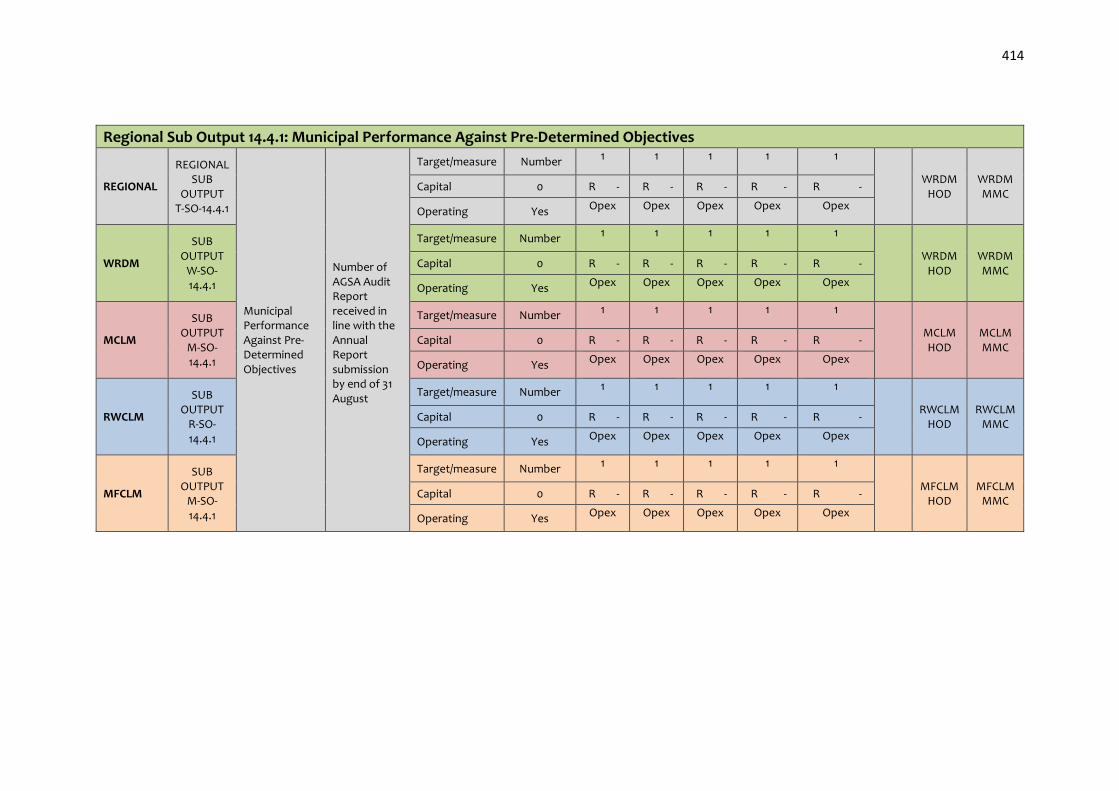
414
Regional Sub Output 14.4.1: Municipal Performance Against Pre-Determined Objectives
REGIONAL
REGIONAL SUB
OUTPUT T-SO-14.4.1
Municipal Performance Against Pre-Determined Objectives
Number of AGSA Audit Report received in line with the Annual Report submission by end of 31 August
Target/measure Number 1 1 1 1 1
WRDM
HOD WRDM MMC
Capital 0 R - R - R - R - R -
Operating Yes Opex Opex Opex Opex Opex
WRDM
SUB OUTPUT
W-SO-14.4.1
Target/measure Number 1 1 1 1 1
WRDM
HOD WRDM MMC
Capital 0 R - R - R - R - R -
Operating Yes Opex Opex Opex Opex Opex
MCLM
SUB OUTPUT
M-SO-14.4.1
Target/measure Number 1 1 1 1 1
MCLM HOD
MCLM MMC
Capital 0 R - R - R - R - R -
Operating Yes Opex Opex Opex Opex Opex
RWCLM
SUB OUTPUT
R-SO-14.4.1
Target/measure Number 1 1 1 1 1
RWCLM
HOD RWCLM
MMC Capital 0 R - R - R - R - R -
Operating Yes Opex Opex Opex Opex Opex
MFCLM
SUB OUTPUT
M-SO-14.4.1
Target/measure Number 1 1 1 1 1
MFCLM
HOD MFCLM
MMC Capital 0 R - R - R - R - R -
Operating Yes Opex Opex Opex Opex Opex

415
Regional Output 14.5: Client and Customer Satisfaction Index
REGIONAL REGIONAL
OUTPUT T-OP-14.5
Client and Customer Satisfaction Index
Number of reports on Client and Customer Satisfaction Index
Target/measure Number 0 0 0 1 0
WRDM
MM
WRDM Executive
Mayor Capital 0 R - R - R - R - R -
Operating Yes Opex Opex Opex Opex Opex
WRDM OUTPUT
W-OP-14.5
Target/measure Number 0 0 0 1 0
WRDM
MM
WRDM Executive
Mayor Capital 0 R - R - R - R - R -
Operating Yes Opex Opex Opex Opex Opex
MCLM OUTPUT
M-OP-14.5
Target/measure Number 0 0 0 1 0
MCLM
MM
MCLM Executive
Mayor Capital 0 R - R - R - R - R -
Operating Yes Opex Opex Opex Opex Opex
RWCLM OUTPUT R-OP-14.5
Target/measure Number 0 0 0 1 0
RWCLM
MM
RWCLM Executive
Mayor Capital 0 R - R - R - R - R -
Operating Yes Opex Opex Opex Opex Opex
MFCLM OUTPUT F-OP-14.5
Target/measure Number 0 0 0 1 0
MFCLM
MM
MFCLM Executive
Mayor Capital 0 R - R - R - R - R -
Operating Yes Opex Opex Opex Opex Opex

416
Regional Sub Output 14.5.1: Internal Client Satisfaction Index
REGIONAL
REGIONAL SUB
OUTPUT T-SO-14.5.1
Internal Client Satisfaction Index
Number of reports on Internal Client Satisfaction Index
Target/measure Number 0 0 0 1 0
WRDM
HOD WRDM MMC
Capital 0 R - R - R - R - R -
Operating Yes Opex Opex Opex Opex Opex
WRDM
SUB OUTPUT
W-SO-14.5.1
Target/measure Number 0 0 0 1 0
WRDM
HOD WRDM MMC
Capital 0 R - R - R - R - R -
Operating Yes Opex Opex Opex Opex Opex
MCLM
SUB OUTPUT
M-SO-14.5.1
Target/measure Number 0 0 0 1 0
MCLM HOD
MCLM MMC
Capital 0 R - R - R - R - R -
Operating Yes Opex Opex Opex Opex Opex
RWCLM
SUB OUTPUT
R-SO-14.5.1
Target/measure Number 0 0 0 1 0
RWCLM
HOD RWCLM
MMC Capital 0 R - R - R - R - R -
Operating Yes Opex Opex Opex Opex Opex
MFCLM
SUB OUTPUT
M-SO-14.5.1
Target/measure Number 0 0 0 1 0
MFCLM
HOD MFCLM
MMC Capital 0 R - R - R - R - R -
Operating Yes Opex Opex Opex Opex Opex

417
Regional Sub Output 14.5.2: External Client Satisfaction Index
REGIONAL
REGIONAL SUB
OUTPUT T-SO-14.5.2
External Client Satisfaction Index
Number of reports on External Client Satisfaction Index
Target/measure Number 0 0 0 1 0
WRDM
HOD WRDM MMC
Capital 0 R - R - R - R - R -
Operating Yes Opex Opex Opex Opex Opex
WRDM
SUB OUTPUT
W-SO-14.5.2
Target/measure Number 0 0 0 1 0
WRDM
HOD WRDM MMC
Capital 0 R - R - R - R - R -
Operating Yes Opex Opex Opex Opex Opex
MCLM
SUB OUTPUT
M-SO-14.5.2
Target/measure Number 0 0 0 1 0
MCLM HOD
MCLM MMC
Capital 0 R - R - R - R - R -
Operating Yes Opex Opex Opex Opex Opex
RWCLM
SUB OUTPUT
R-SO-14.5.2
Target/measure Number 0 0 0 1 0
RWCLM
HOD RWCLM
MMC Capital 0 R - R - R - R - R -
Operating Yes Opex Opex Opex Opex Opex
MFCLM
SUB OUTPUT
M-SO-14.5.2
Target/measure Number 0 0 0 1 0
MFCLM
HOD MFCLM
MMC Capital 0 R - R - R - R - R -
Operating Yes Opex Opex Opex Opex Opex

418
Alignment of KPIs to MsCOA
REVENUE IDP
Description Budget Year +1 2020/21
Budget Year +2 2021/22
Budget Year +2 2022/23 Project KPA Outcome KPI
Urban International Development Framework
Performance Objectives
Strategic Objectives Strategic Risk
Rental of equipment 1 460 914 1 533 959 1 610 657 Default
5 - Municipal financial viability and management
09 - Responsive, accountable, effective and efficient local government
Reports on percentage increase in municipal revenue 03 - Growth
Facilities Management
Business Excellence within the WRDM
Financial unsustainability of the WRDM
Licences and permits 400 000 420 000 450 000 Default 2 - Basic service delivery
02 - A long and healthy life for all South Africans
Reports on atmospheric emission license issued
02 - Inclusion & access
Ensure compliance with Air Quality Act
Health & Social Development
Decline in the economic viability of the District
Interest on outstanding debtors 426 610 319 957 239 968
5 - Municipal financial viability and management
09 - Responsive, accountable, effective and efficient local government
Reports on percentage increase in municipal revenue 03 - Growth
Facilities Management
Business Excellence within the WRDM
Financial unsustainability of the WRDM
Local Government Equitable Share 42 397 000 45 670 000 49 195 672 Default
2 - Basic service delivery
09 - Responsive, accountable, effective and efficient local government
Reports on percentage increase in municipal revenue
02 - Inclusion & access
Financial Accounting Controls
Business Excellence within the WRDM
Financial unsustainability of the WRDM
RSC Levy Replacement 172 608 000 177 450 000 182 427 828 Default
2 - Basic service delivery
09 - Responsive, accountable, effective and efficient local government
Reports on percentage increase in municipal revenue
02 - Inclusion & access
Financial Accounting Controls
Business Excellence within the WRDM
Financial unsustainability of the WRDM
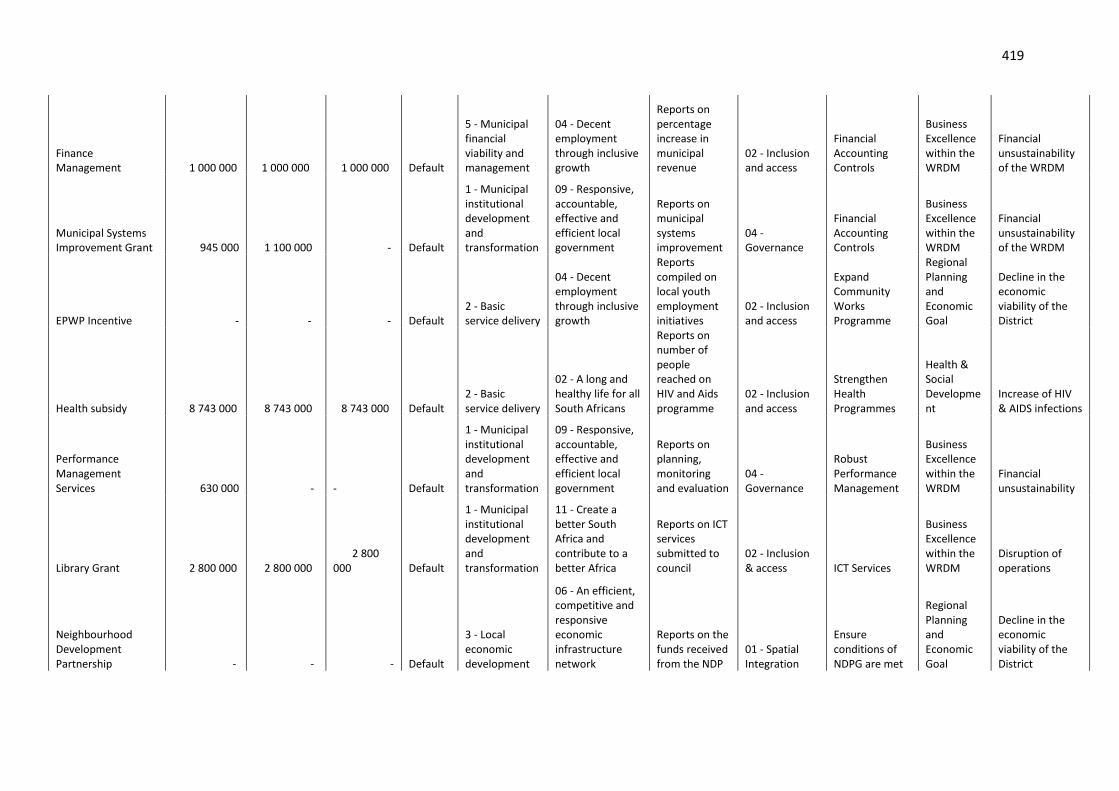
419
Finance Management 1 000 000 1 000 000 1 000 000 Default
5 - Municipal financial viability and management
04 - Decent employment through inclusive growth
Reports on percentage increase in municipal revenue
02 - Inclusion and access
Financial Accounting Controls
Business Excellence within the WRDM
Financial unsustainability of the WRDM
Municipal Systems Improvement Grant 945 000 1 100 000 - Default
1 - Municipal institutional development and transformation
09 - Responsive, accountable, effective and efficient local government
Reports on municipal systems improvement
04 - Governance
Financial Accounting Controls
Business Excellence within the WRDM
Financial unsustainability of the WRDM
EPWP Incentive - - - Default 2 - Basic service delivery
04 - Decent employment through inclusive growth
Reports compiled on local youth employment initiatives
02 - Inclusion and access
Expand Community Works Programme
Regional Planning and Economic Goal
Decline in the economic viability of the District
Health subsidy 8 743 000 8 743 000 8 743 000 Default 2 - Basic service delivery
02 - A long and healthy life for all South Africans
Reports on number of people reached on HIV and Aids programme
02 - Inclusion and access
Strengthen Health Programmes
Health & Social Development
Increase of HIV & AIDS infections
Performance Management Services 630 000 -
- Default
1 - Municipal institutional development and transformation
09 - Responsive, accountable, effective and efficient local government
Reports on planning, monitoring and evaluation
04 - Governance
Robust Performance Management
Business Excellence within the WRDM
Financial unsustainability
Library Grant 2 800 000 2 800 000 2 800 000 Default
1 - Municipal institutional development and transformation
11 - Create a better South Africa and contribute to a better Africa
Reports on ICT services submitted to council
02 - Inclusion & access ICT Services
Business Excellence within the WRDM
Disruption of operations
Neighbourhood Development Partnership - - - Default
3 - Local economic development
06 - An efficient, competitive and responsive economic infrastructure network
Reports on the funds received from the NDP
01 - Spatial Integration
Ensure conditions of NDPG are met
Regional Planning and Economic Goal
Decline in the economic viability of the District

420
Rural Asset Management(Capital Grant) 2 906 000 3 066 000 3 234 809 Default
3 - Local economic development
07 - Vibrant, equitable, sustainable rural communities contributing towards food sustainability
Reports on percentage increase in municipal revenue
01 - Spatial Integration
Coordinate & Monitor Rural Roads Administrative Management System
Regional Planning and Economic Goal
Decline in the economic viability of the District
LG Seta 1 580 000 - -
5 - Municipal financial viability and management
05 - A skilled and capable workforce to support and inclusive growth path
Reports on annual training
02 - Inclusion & access
Ensure a Skilled Capacitated Competent and Motivated Force
Ensure Skilled Capacitated Competent & Motivated West Rand Working Force
Human Capital ineffectively optimised
Sale of plants 200 000 250 000 300 000 Default
3 - Local economic development
07 - Vibrant, equitable, sustainable rural communities contributing towards food sustainability
Reports on new revenue streams identified 03 - Growth
Financial Accounting Controls
Regional Planning and Economic Goal
Decline in the economic viability of the District
WRDA Revenue 450 000 473 265 497 733 Default
3 - Local economic development
09 - Responsive, accountable, effective and efficient local government
Reports on new revenue streams identified 03 - Growth
Financial Accounting Controls
Regional Planning and Economic Goal
Decline in the economic viability of the District
Vat recovery 8 565 000 8 901 000 9 282 000 Default
5 - Municipal financial viability and management
12 - An efficient, effective and development-orientated public service
Reports on percentage increase in municipal revenue 03 - Growth
Financial Accounting Controls
Business Excellence within the WRDM
Financial unsustainability of the WRDM
Service charges - other 1 750 000 1 840 475 1 935 628 Default
2 - Basic service delivery
03 - All people in South Africa are and feel safe
Reports on fire emergencies responded
02 - Inclusion and access
Protection of the West Rand District region
Public Safety
Loss of life and property
TOTAL REVENUE 246 861 524 253 567 657 261 717 295

421
EXPENDITURE IDP
Description Budget Year +1 2020/21
Budget Year +2 2021/22
Budget Year +2 2022/23 Project KPA Outcome KPI
Urban International Development Framework
Performance Objectives
Strategic Objectives Strategic Risk
Employee related costs 193 157 658 201 712 906 211 084 245
Municipal Running Cost
2 - Basic service delivery
04 - Decent employment through inclusive growth
Reports on operational and capital expenditure
02 - Inclusion and access
Reduce unemployment within the West Rand District region
Business Excellence within the WRDM
Non-payments of services rendered by the employees
Remuneration of councillors 13 580 000 14 100 000 14 600 000
Municipal Running Cost
2 - Basic service delivery
09 - Responsive, accountable, effective and efficient local government
Reports on operational and capital expenditure
04 - Governance
Reduce unemployment within the West Rand District region
Business Excellence within the WRDM
Non-payments of services rendered by the employees
Depreciation & asset impairment 7 000 000 5 600 000 4 480 000
Machinery and Equipment: Depreciation on PPE
5 - Municipal financial viability and management
10 - Protect and enhance our environmental assets and natural resources
Reports on the fixed assets register compiled
02 - Inclusion and access
Compile Accurate Fixed Asset Register
Business Excellence within the WRDM
Financial unsustainability of municipal assets
Finance charges 1 676 661 1 120 000 763 345 Municipal Running Cost
5 - Municipal financial viability and management
09 - Responsive, accountable, effective and efficient local government
Reports on operational and capital expenditure
02 - Inclusion & access
Ensure Efficient Expenditure Management
Business Excellence within the WRDM
Financial unsustainability

422
Other materials 220 000 250 000 270 000 Municipal Running Cost
5 - Municipal financial viability and management
09 - Responsive, accountable, effective and efficient local government
Reports on operational and capital expenditure
02 - Inclusion & access
Ensure Efficient Expenditure Management
Business Excellence within the WRDM
Financial unsustainability
Security Services 2 950 000 2 950 000 2 950 000
Public Protection and Safety
2 - Basic service delivery
03 - All people in South Africa are and feel safe
Reports on compliance to the regional safety plan submitted
02 - Inclusion & access
To ensure that People of the WRDM are and feel safe Public Safety
Increase in crime
Fire services - - -
Public Protection and Safety
2 - Basic service delivery
03 - All people in South Africa are and feel safe
Reports on compliance to the regional safety plan submitted
02 - Inclusion & access
Maintain professionalism of the fire services Public Safety
Loss of life and property
External Computer Service: Network Extensions - - -
Library Programmes: Library Programmes
1 - Municipal institutional development and transformation
12 - An efficient, effective and development-orientated public service
Reports on ICT services submitted to council
02 - Inclusion and access ICT Services
Business Excellence within the WRDM
Service disruption
One pangea 21 034 22 121 23 265 Municipal Running Cost
5 - Municipal financial viability and management
09 - Responsive, accountable, effective and efficient local government
Reports on operational and capital expenditure
02 - Inclusion & access
Clean Audit on Financial Performance
Business Excellence within the WRDM
Financial unsustainability
Vision active 630 000 662 571 696 826 Performance Management
1 - Municipal institutional development and transformation
09 - Responsive, accountable, effective and efficient
Reports on planning, monitoring and evaluation
04 - Governance
Robust Performance Management
Business Excellence within the WRDM
Financial unsustainability

423
local government
Rural Asset Management Expenditure 2 906 000 3 066 000 3 234 809
Assistance and Support: Agricultural Assistance and Support
3 - Local economic development
07 - Vibrant, equitable, sustainable rural communities contributing towards food sustainability
Reports on the framework plan developed on the rollout farmer support initiatives 03 - Growth
Coordinate & Monitor Rural Roads Administrative Management System
Economic Development
Decline in the economic viability of the District
VAT consultants - 12% 300 000 - -
Municipal Running Cost
5 - Municipal financial viability and management
09 - Responsive, accountable, effective and efficient local government
Reports on operational and capital expenditure
02 - Inclusion & access
Ensure Efficient Expenditure Management
Business Excellence within the WRDM
Financial unsustainability
Asset verification 905 116 905 116 905 116 Asset Verifications
5 - Municipal financial viability and management
10 - Protect and enhance our environmental assets and natural resources
Reports on the fixed assets register compiled
02 - Inclusion and access
Compile Accurate Fixed Asset Register
Business Excellence within the WRDM
Financial unsustainability of municipal assets
Qualification verification - - -
Qualification verifications
1 - Municipal institutional development and transformation
05 - A skilled and capable workforce to support and inclusive growth path
Career and succession planning review
02 - Inclusion & access
Career and Succession Planning
Ensure Skilled, Capacitated, Competent & Motivated West Rand Working Force
Human Capital ineffectively optimised

424
Valuation of investment in controlled entities 200 000 - -
Municipal Running Cost
Legal fees 500 000 736 190 774 251 Municipal Running Cost
5 - Municipal financial viability and management
09 - Responsive, accountable, effective and efficient local government
Reports on legal cases handled
04 - Governance
Ensure Efficient Expenditure Management
Business Excellence within the WRDM
Lost cases resulting in payouts
Maintenance of unspecified assets 575 204 575 204 575 204
Unspecified assets
5 - Municipal financial viability and management
10 - Protect and enhance our environmental assets and natural resources
Reports on the fixed assets register compiled
02 - Inclusion and access
Compile Accurate Fixed Asset Register
Business Excellence within the WRDM
Financial unsustainability of municipal assets
Pauper burials 211 202 211 202 211 202 Burials
2 - Basic service delivery
02 - A long and healthy life for all South Africans
Reports on support provided to pauper burial
02 - Inclusion & access
Status on support provided to pauper burial
Health & Social Development
Loss of life and property
Audit committee 220 857 232 275 244 284 Municipal Running Cost
4 - Good governance and public participation
09 - Responsive, accountable, effective and efficient local government
Reports on the status of the effectiveness of initiatives 03 - Growth
Status on the Effective International and Local Governance
To ensure financially viable and sustainable municipality
Financial unsustainability
Membership fees 1 800 000 1 800 000 1 800 000
Public Participation Meeting
4 - Good governance and public participation
09 - Responsive, accountable, effective and efficient local government
Reports on the status of the effectiveness of initiatives 03 - Growth
Status on the Effective International and Local Governance
To ensure financially viable and sustainable municipality
Financial unsustainability

425
Training 1 000 000 1 000 000 1 000 000 Training Programmes
1 - Municipal institutional development and transformation
05 - A skilled and capable workforce to support and inclusive growth path
Reports on annual training
02 - Inclusion & access
Ensure a Skilled Capacitated Competent and Motivated Force
Ensure Skilled Capacitated Competent & Motivated West Rand Working Force
Human Capital ineffectively optimised
Insurance Underwriting: Excess Payments 15 000 15 776 16 827
Municipal Running Cost
5 - Municipal financial viability and management
13 - Robust Financial Administration
Reports on operational and capital expenditure
02 - Inclusion & access
Ensure Efficient Expenditure Management
Business Excellence within the WRDM
Financial unsustainability
Professional institutes 90 000 94 653 94 653
Municipal Running Cost
5 - Municipal financial viability and management
09 - Responsive, accountable, effective and efficient local government
Reports on operational and capital expenditure
02 - Inclusion & access
Ensure Efficient Expenditure Management
Business Excellence within the WRDM
Financial unsustainability
WRDA Expenditure 4 868 220 4 047 028 2 547 000 Municipal Running Cost
3 - Local economic development
11 - Create a better South Africa and contribute to a better Africa
Reports on operational and capital expenditure 03 - Growth
Ensure Efficient Expenditure Management
Business Excellence within the WRDM
Financial unsustainability
Fuel and oil 1 300 000 1 100 000 1 156 870 Municipal Running Cost
5 - Municipal financial viability and management
03 - All people in South Africa are and feel safe
Reports on effective and efficient fleet management
04 - Governance
Ensure Efficient Expenditure Management
Business Excellence within the WRDM
Financial unsustainability
Telephone Fax Telegraph and Telex 944 000 644 000 644 000
Municipal Running Cost
5 - Municipal financial viability and management
09 - Responsive, accountable, effective and efficient local government
Reports on operational and capital expenditure
04 - Governance
Ensure Efficient Expenditure Management
Business Excellence within the WRDM
Financial unsustainability
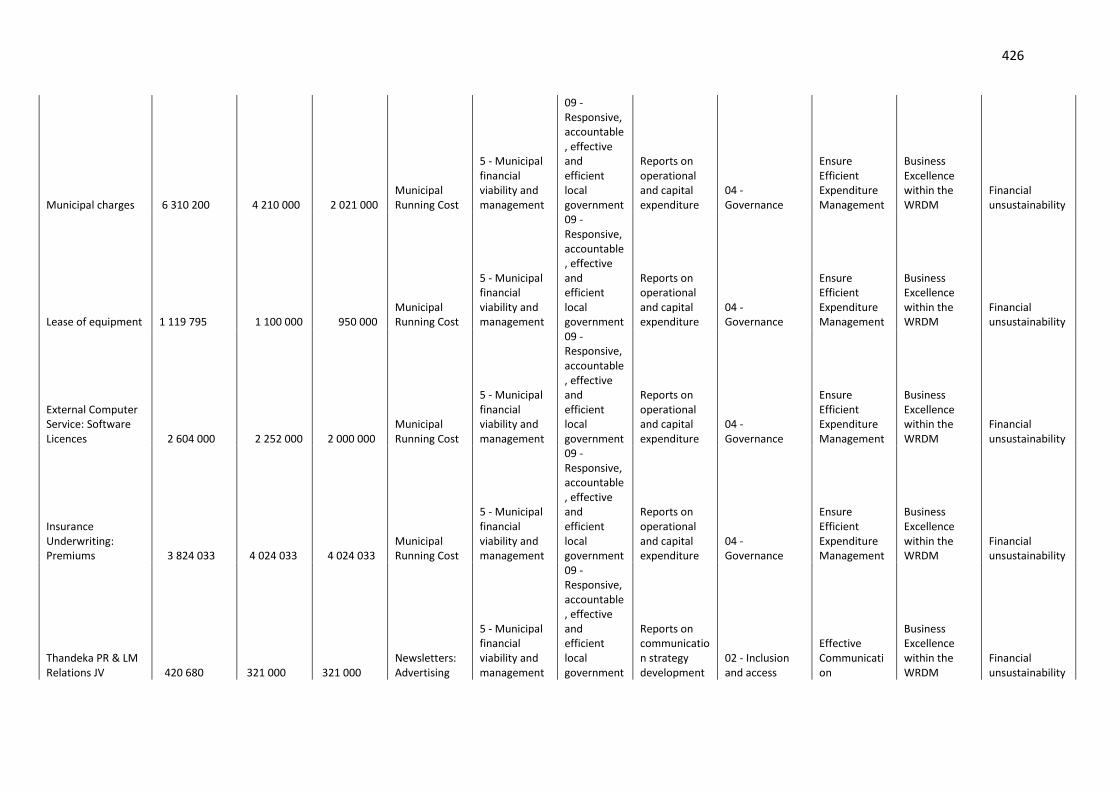
426
Municipal charges 6 310 200 4 210 000 2 021 000 Municipal Running Cost
5 - Municipal financial viability and management
09 - Responsive, accountable, effective and efficient local government
Reports on operational and capital expenditure
04 - Governance
Ensure Efficient Expenditure Management
Business Excellence within the WRDM
Financial unsustainability
Lease of equipment 1 119 795 1 100 000 950 000 Municipal Running Cost
5 - Municipal financial viability and management
09 - Responsive, accountable, effective and efficient local government
Reports on operational and capital expenditure
04 - Governance
Ensure Efficient Expenditure Management
Business Excellence within the WRDM
Financial unsustainability
External Computer Service: Software Licences 2 604 000 2 252 000 2 000 000
Municipal Running Cost
5 - Municipal financial viability and management
09 - Responsive, accountable, effective and efficient local government
Reports on operational and capital expenditure
04 - Governance
Ensure Efficient Expenditure Management
Business Excellence within the WRDM
Financial unsustainability
Insurance Underwriting: Premiums 3 824 033 4 024 033 4 024 033
Municipal Running Cost
5 - Municipal financial viability and management
09 - Responsive, accountable, effective and efficient local government
Reports on operational and capital expenditure
04 - Governance
Ensure Efficient Expenditure Management
Business Excellence within the WRDM
Financial unsustainability
Thandeka PR & LM Relations JV 420 680 321 000 321 000
Newsletters: Advertising
5 - Municipal financial viability and management
09 - Responsive, accountable, effective and efficient local government
Reports on communication strategy development
02 - Inclusion and access
Effective Communication
Business Excellence within the WRDM
Financial unsustainability

427
Trisiano Travel - Travelling Agency 50 000 45 000 50 000
Public Participation Meeting: Public Participation Meeting
5 - Municipal financial viability and management
09 - Responsive, accountable, effective and efficient local government
Reports on the status of the effectiveness of initiatives
04 - Governance
Status on the Effective International and Local Governance
To ensure financially viable and sustainable municipality
Financial unsustainability
SALGA Affiliation fees - - -
Events and Organisations: Events
1 - Municipal institutional development and transformation
14 - A diverse, socially cohesive society with a common national identity
Reports on attendance of the OR Tambo games
02 - Inclusion and access
Status on the Effective International and Local Governance
To ensure financially viable and sustainable municipality
Financial unsustainability
OR Tambo games - Incidental costs -
-
-
Events and Organisations: Events
1 - Municipal institutional development and transformation
14 - A diverse, socially cohesive society with a common national identity
Reports on attendance of the OR Tambo games
02 - Inclusion and access
Status on the Effective International and Local Governance
To ensure financially viable and sustainable municipality
Financial unsustainability
Bank charges 42 068 44 243 46 530
Audit fees 3 680 950 3 871 255 4 071 399 Performance Management
4 - Good governance and public participation
09 - Responsive, accountable, effective and efficient local government
Reports on the status of the effectiveness of initiatives 03 - Growth
Status on the Effective International and Local Governance
To ensure financially viable and sustainable municipality
Financial unsustainability
Uniform 833 333 833 333 833 333
Public Protection and Safety
2 - Basic service delivery
03 - All people in South Africa are and feel safe
Reports on compliance to the regional safety plan submitted
02 - Inclusion & access
Maintain professionalism of the fire services Public Safety
Loss of life and property

428
SPLUMA Compliance 50 000 50 000 50 000
WRDA - - Municipal Running Cost
3 - Local economic development
11 - Create a better South Africa and contribute to a better Africa
Reports on operational and capital expenditure 03 - Growth
Ensure Efficient Expenditure Management
Business Excellence within the WRDM
Financial unsustainability
Local municipalities 8 743 000 8 743 000 8 743 000
Support and Distribution Programmes: Aids/HIV
2 - Basic service delivery
02 - A long and healthy life for all South Africans
Reports on number of people reached on HIV and Aids programme
02 - Inclusion and access
Strengthen Health Programmes
Health & Social Development
Increase of HIV & AIDS infections
262 749 011 266 338 905 272 182 192
CAPEX IDP
Description Budget Year 2020/21
Budget Year +1 2021/22
Budget Year +2 2022/23 Project KPA Outcome KPI
Urban International Development Framework
Performance Objectives
Strategic Objectives Strategic Risk
Purchase of vehicles 4 500 000 - -
Capital: Non-infrastructure: New: Transport Assets
2 - Basic service delivery
03 - All people in South Africa are and feel safe
02 - Inclusion and access 03 - Growth
Financial Accounting Controls Public Safety
Financial unsustainability of municipal assets
Computer Equipment 150 000
4 650 000 - -
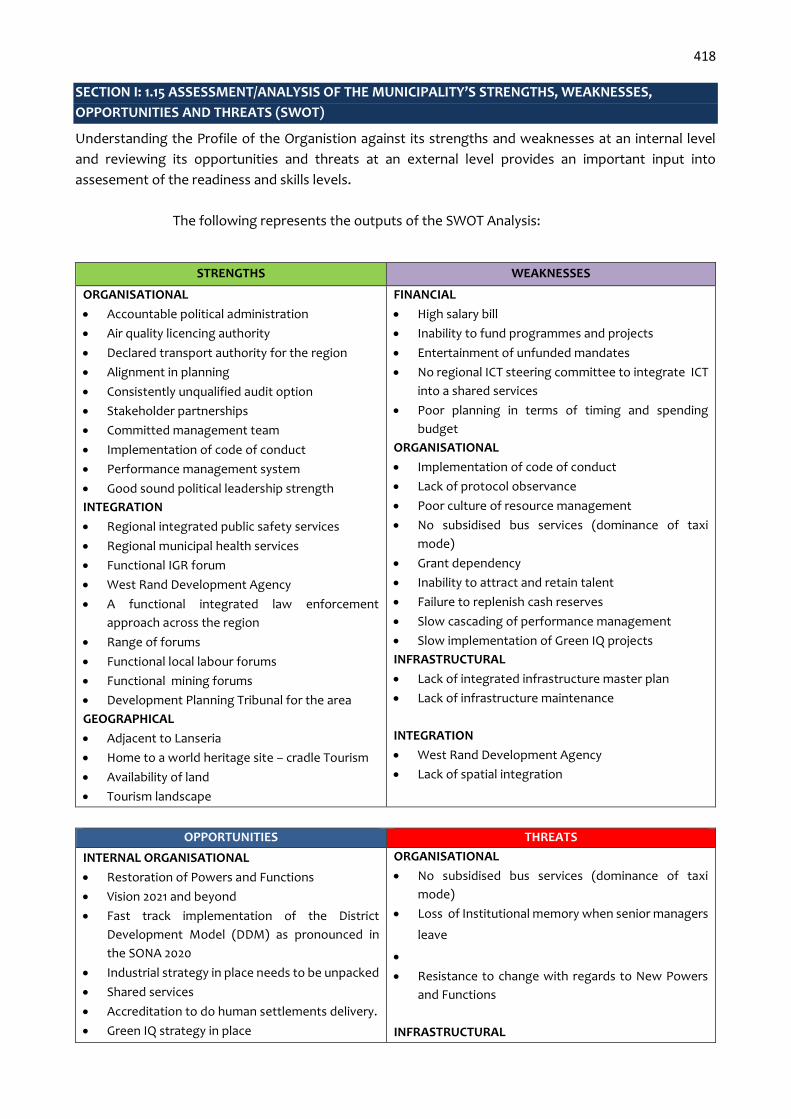
418 SECTION I: 1.15 ASSESSMENT/ANALYSIS OF THE MUNICIPALITY’S STRENGTHS, WEAKNESSES,
OPPORTUNITIES AND THREATS (SWOT)
Understanding the Profile of the Organistion against its strengths and weaknesses at an internal level
and reviewing its opportunities and threats at an external level provides an important input into
assesement of the readiness and skills levels.
15 YEAR ION PL The following represents the outputs of the SWOT Analysis:
STRENGTHS WEAKNESSES
ORGANISATIONAL
Accountable political administration
Air quality licencing authority
Declared transport authority for the region
Alignment in planning
Consistently unqualified audit option
Stakeholder partnerships
Committed management team
Implementation of code of conduct
Performance management system
Good sound political leadership strength
INTEGRATION
Regional integrated public safety services
Regional municipal health services
Functional IGR forum
West Rand Development Agency
A functional integrated law enforcement
approach across the region
Range of forums
Functional local labour forums
Functional mining forums
Development Planning Tribunal for the area
GEOGRAPHICAL
Adjacent to Lanseria
Home to a world heritage site – cradle Tourism
Availability of land
Tourism landscape
FINANCIAL
High salary bill
Inability to fund programmes and projects
Entertainment of unfunded mandates
No regional ICT steering committee to integrate ICT
into a shared services
Poor planning in terms of timing and spending
budget
ORGANISATIONAL
Implementation of code of conduct
Lack of protocol observance
Poor culture of resource management
No subsidised bus services (dominance of taxi
mode)
Grant dependency
Inability to attract and retain talent
Failure to replenish cash reserves
Slow cascading of performance management
Slow implementation of Green IQ projects
INFRASTRUCTURAL
Lack of integrated infrastructure master plan
Lack of infrastructure maintenance
INTEGRATION
West Rand Development Agency
Lack of spatial integration
OPPORTUNITIES THREATS
INTERNAL ORGANISATIONAL
Restoration of Powers and Functions
Vision 2021 and beyond
Fast track implementation of the District
Development Model (DDM) as pronounced in
the SONA 2020
Industrial strategy in place needs to be unpacked
Shared services
Accreditation to do human settlements delivery.
Green IQ strategy in place
ORGANISATIONAL
No subsidised bus services (dominance of taxi
mode)
Loss of Institutional memory when senior managers
leave
Resistance to change with regards to New Powers
and Functions
INFRASTRUCTURAL

419 Improve employment practices to become an
employer of choice
Establishment of fire houses
INTEGRATION
5yr Regional Plan
Regional corporate governance risk committee
Shared resources between municipalities
Integrated budgeting process
ECONOMIC DEVELOPMENT
Create conducive environment for the private
sector to create jobs
Neighbourhood development plan
Seek funding elsewhere for unfunded mandates
especially regional and national
Agriculture opportunity-partnership with
Gauteng
Enables primary and secondary industry growth
within the geographic landscape
Deepest mine in the world (tourism)
Go-West
INCOME GENERATION
Treatment of water and job creations,
opportunities around acid mine drainage-Green
IQ strategy implementation.
Deepest mine in the world
Introduction of tariffs and finalisation of fines
(non-compliance to by-laws)
Rebranding and marketing of the region
Tourism-economic development
Lack of tertiary institutions in the West Rand
Declining mining operations-unemployment rates
Aging infrastructure and increased vandalism
Insufficient funding to upgrade infrastructure
ECONOMIC
People reluctant to invest in infrastructure in a
dolomitic area
Global economic downturn
Negative credit rating
Impact of imports and exports
REGULATORY
Over regulation compliance
Slow process in rehabilitation of mining areas
Approval of the fine schedule by-laws by the
magistrate
Pollution (air, water, acid mine drainage)
Non-compliance to SANS
SOCIO ECONOMIC
Declining mining activities
In-migration from rural areas
HIV/Aids
Poverty- Increasing unemployment rates
Increase in child headed families
Illegal trading
Increase of foreign owned businesses in the Region
OPPORTUNITIES THREATS
Cont…INCOME GENERATION
Single public safety unit-licensing
Development of broadband backbone/network
across the region
Introduction of firefighting levies in the region
Ability to increase revenue base
Establishment of training academy
INFRASTRUCTURE
Geographic location, corridor to the region
(SADC)
Availability of land and green positioning
Revitalisation of mining towns
Neighbourhood development project
Ability to access grant funding
REGULATORY
Water reclamation
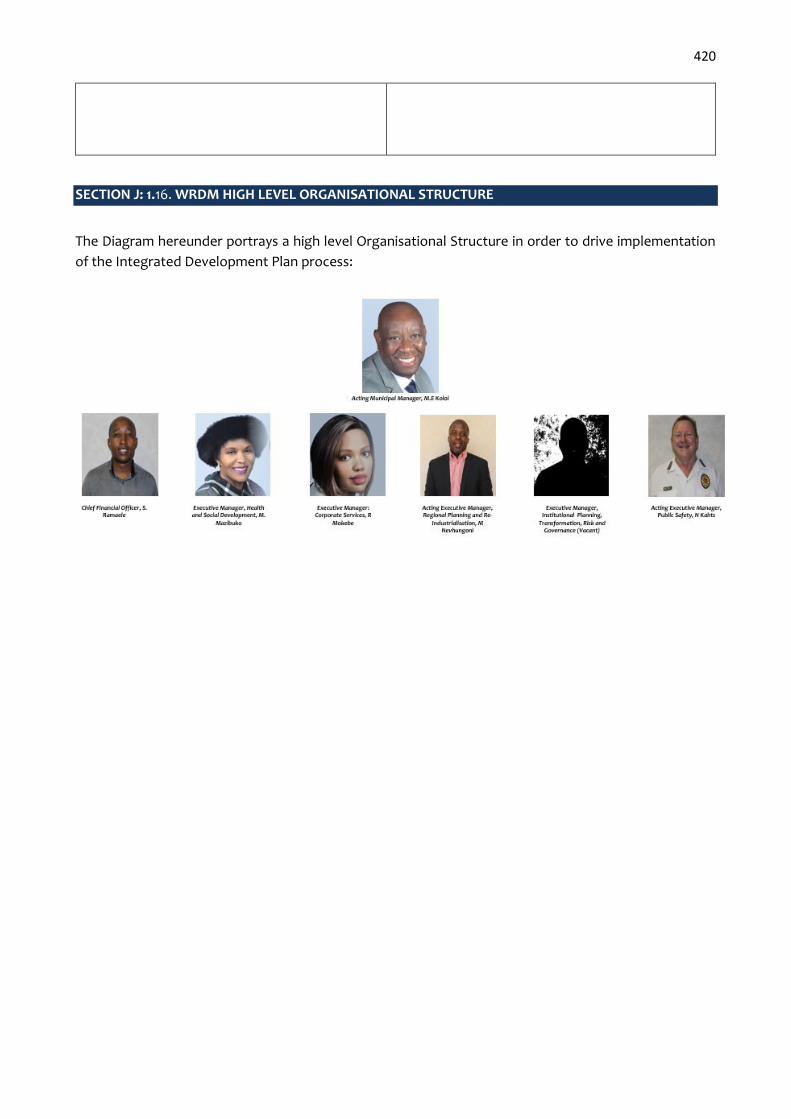
420
SECTION J: 1.16. WRDM HIGH LEVEL ORGANISATIONAL STRUCTURE
The Diagram hereunder portrays a high level Organisational Structure in order to drive implementation
of the Integrated Development Plan process:

421 SECTION K: 1.17 CONSTITUENT LOCAL MUNICIPALITIES PRIORITIES / NEEDS / PROJECTS /
PROGRAMMES
1.17.1 MOGALE CITY LOCAL MUNICIPALITY
To be tabeld
1.17.2 RAND WEST CITY LOCAL MUNICIPALITY

422

423

424
1.17.3 MERAFONG CITY LOCAL MUNICIPALITY
Community Priorities 2020 – 2021
Kpa 1: Basic Service Delivery and Infrastructure
Priority/Need Priority Ranking
Wards Affected Municipal Department
Comments
1 2 3 2020
Basic Water Access
Formal Areas: Number of household without access to water connections.
X 2,3,6,8,9 X 18%
Maintenance: Sufficient maintenance to water network inside/outside the yard (meter leakages, pipes)
X
1,2,3,4,5,6,7,8,10,12,13,14,16,17,18,20,22,23,24,25,28
X 75%
Informal Structures:
Number of households that do not have access to JoJo tanks/standpipes (25 litres per day)
X
1,2,3,5,6,8,9,10,11,14,15,21,23,24,27,28
X 57%
Maintenance: Sufficient maintenance to water network (taps, pipes)
X
1,2,3,4,6,8,10,14,17,18,20, 24, 25
X 46%
Sanitation Access:
Formal Areas –Each erven one flush toilet linked to sewer or septic tank.
X 3,6,9 X 11%
Maintenance of sewer/toilet blockages X
1,2,3,4,6,9,10,11,13,14,16, 17, 18,20,21,22,23,25,28
X 68%
Informal Structures One VIP toilet or waste separatory or dry compositing toilet.
X 3,4,5,6,9,10,15,21,23,27,28 X 39%
Maintenance of VIP’s X 3,6,10,15,22 X 18%
Households with Basic Electricity Access:
Formal Areas – Each erven Grid electricity 60 amps.
X 3,6,8,9,14,20,26 X 25%
Informal structures-Each erven grid electricity 40 amps supply
X 3,4,6,8,10,15,21,23,25,28 X 36%
Electricity: Public Lighting (street) access X
1,2,3,4,6,7,8,9,10,11,12,13,14, 15,16,20,22,23,24,25,26
X 75%
Maintenance of Street lights/public lighting
X
1,2,3,4,6,7,8,9,10,11,12,13, 16,17,18,20,21,22,23,24,25,26,28
X 82%
Roads:
Access of tarred/paved roads to formal areas
X
1,2,3,5,6,7,8,10,11,12,14,18,20,24,25,27
X 57%
Grading of gravel roads in formal & informal areas
X
2,3,4,6,7,8,9,10,11,12,15,20,21,22,23,24,25,28
X 64%
Repair of potholes in municipal tarred roads
X
3,4,5,6,7,8,10,11,15,16,17, 18, 20,21,22,24,25,28
X 64%
Installation of speed humps X 3,6,13,20,21,22,24,25 29%
Stormwater: X
2,3,6,7,8,9,10,11,12,14,20, 21,22,23,24,25,26
X 61%
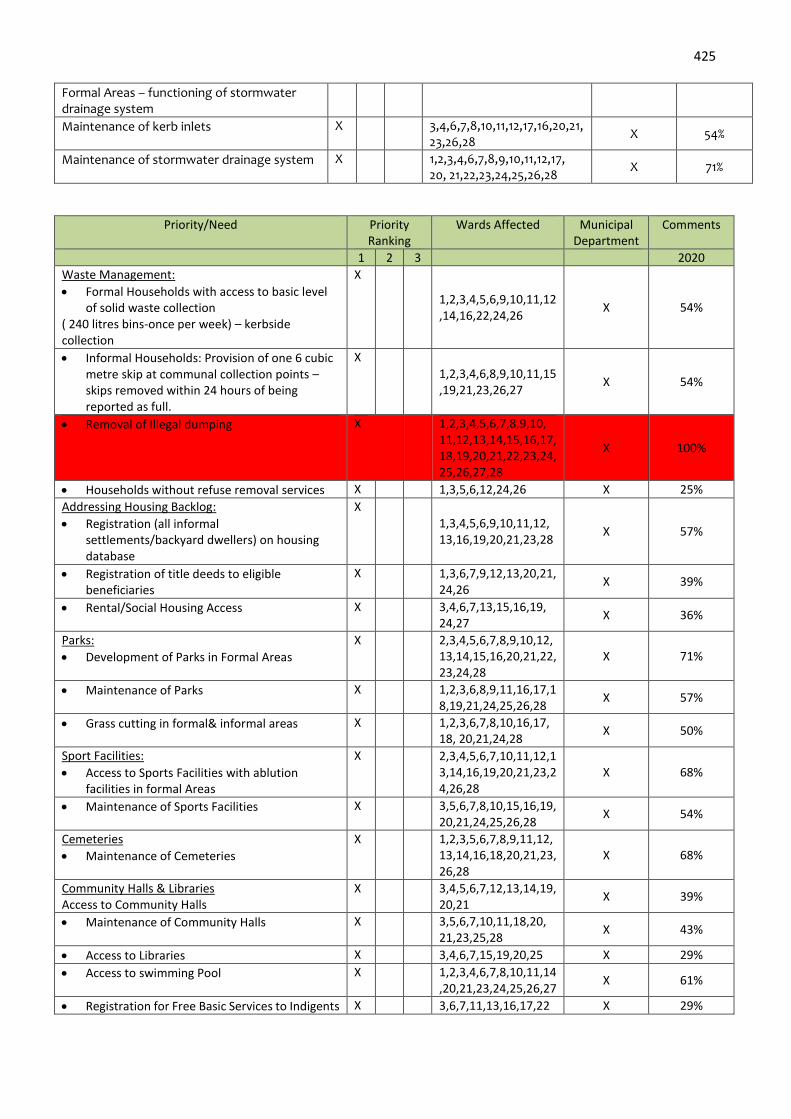
425
Formal Areas – functioning of stormwater drainage system
Maintenance of kerb inlets X
3,4,6,7,8,10,11,12,17,16,20,21,23,26,28
X 54%
Maintenance of stormwater drainage system X
1,2,3,4,6,7,8,9,10,11,12,17, 20, 21,22,23,24,25,26,28
X 71%
Priority/Need Priority Ranking
Wards Affected Municipal Department
Comments
1 2 3 2020
Waste Management:
Formal Households with access to basic level of solid waste collection
( 240 litres bins-once per week) – kerbside collection
X
1,2,3,4,5,6,9,10,11,12,14,16,22,24,26
X 54%
Informal Households: Provision of one 6 cubic metre skip at communal collection points – skips removed within 24 hours of being reported as full.
X
1,2,3,4,6,8,9,10,11,15,19,21,23,26,27
X 54%
Removal of Illegal dumping X
1,2,3,4,5,6,7,8,9,10, 11,12,13,14,15,16,17,18,19,20,21,22,23,24,25,26,27,28
X 100%
Households without refuse removal services X 1,3,5,6,12,24,26 X 25%
Addressing Housing Backlog:
Registration (all informal settlements/backyard dwellers) on housing database
X
1,3,4,5,6,9,10,11,12, 13,16,19,20,21,23,28
X 57%
Registration of title deeds to eligible beneficiaries
X
1,3,6,7,9,12,13,20,21,24,26
X 39%
Rental/Social Housing Access X
3,4,6,7,13,15,16,19, 24,27
X 36%
Parks:
Development of Parks in Formal Areas
X
2,3,4,5,6,7,8,9,10,12,13,14,15,16,20,21,22,23,24,28
X 71%
Maintenance of Parks X
1,2,3,6,8,9,11,16,17,18,19,21,24,25,26,28
X 57%
Grass cutting in formal& informal areas X 1,2,3,6,7,8,10,16,17, 18, 20,21,24,28
X 50%
Sport Facilities:
Access to Sports Facilities with ablution facilities in formal Areas
X 2,3,4,5,6,7,10,11,12,13,14,16,19,20,21,23,24,26,28
X 68%
Maintenance of Sports Facilities X 3,5,6,7,8,10,15,16,19,20,21,24,25,26,28
X 54%
Cemeteries
Maintenance of Cemeteries
X 1,2,3,5,6,7,8,9,11,12,13,14,16,18,20,21,23,26,28
X 68%
Community Halls & Libraries Access to Community Halls
X 3,4,5,6,7,12,13,14,19,20,21
X 39%
Maintenance of Community Halls X 3,5,6,7,10,11,18,20, 21,23,25,28
X 43%
Access to Libraries X 3,4,6,7,15,19,20,25 X 29%
Access to swimming Pool X 1,2,3,4,6,7,8,10,11,14,20,21,23,24,25,26,27
X 61%
Registration for Free Basic Services to Indigents X 3,6,7,11,13,16,17,22 X 29%

426 KPA 2: Local Economic Development
Priority/Need Priority Ranking
Wards Affected Municipal Department
Comments
1 2 3 2020
Job creation through LED Initiatives X
1,2,3,4,6,7,9,10,11,12,13,14,15,16,17,18,19,20,21,23,24,25,26,27,28
X 89%
Development of Informal Traders Facilities X
1,2,3,4,5,6,7,9,10,11,12,13,14,15,16,17,19,20,21,23,25,26,27,28
X 86%
SMME development
Training/ Skills development needs
X
1,2,3,4,6,7,8,9,10,11,12,13,14,15,16,17,19,20,23,24,25,26,27,28
X 86%
Priority/Need Priority Ranking
Wards Affected Municipal Department
Comments
1 2 3 2020
Traffic Function
Formal Areas; -Traffic police to dispatch an accident within reasonable time. -Visible Patrols
X
3,6,10,11,14,15,17,21,24
X 32%
Road Marking/Street signage X
1,2,3,5,6,8,9,10,14,17,21,24,25,26,28
X 54%
Disaster Management:
Need for information campaigns - Dolomitic Risk Management (Sinkholes)
X 2,3,4,5,6,7,8,9,10,11,12,16,20
X 46%
KPA 4: Good Governance and Public Participation
Priority/Need Priority Ranking
Wards Affected Municipal Department
Comments
1 2 3 2020
Access to municipal call/contact centre X
1,3,4,5,6,7,9,10,11,12,13,14,18,20,21,23,24,25,26,28
X 71%
Ward Committees Functionality X 3,5,6,14 X 14%
Establishment of Youth Services X
1,2,3,5,6,7,8,10,12,14,15,19,20,21,23,24,25,26,28
X 68%
Community Participation X
1,3,5,6,7,11,13,14,18,20,23,26,28
X 46%
Implementation of prepaid Water and Electricity meters
X
1,2,3,5,6,7,8,9,10,14,15,16,18,20,21,23,25,26
X 64%
Functionality of 107 emergency numbers X
1,2,3,5,6,7,8,9,10,11,14,15,16,20,23,26,28
X 61%
% Payment of services per ward X
1,2,3,6,7,8,9,10,12,20,23,26
X 43%
Spatial Planning
Priority/Need Priority Ranking
Wards Affected Municipal Department
Comments
1 2 3 2020
Town Planning:
Formal Areas
X
1,2,3,4,5,6,7,8,9,11, 15,16,20,21,24
X 54%

427
- Processing of town planning applications
Approval of building plans in accordance with legislative time-frames.
X
1,2,3,5,6,7,8,9,16,20,21,24,25,28
X 50%
Illegal occupation of land/Illegal buildings X
1,2,3,5,6,7,8,9,14,21,23,24,25,27,28
X 54%
Availability of land to community members (legally)
X
1,2,3,5,6,7,8,9,10,11,12,15,19,20,21,22,23,24,25,27,28
X 75%
Encroachment of Erf boundaries X
1,2,3,6,7,8,9,10,17,20,23,25,28
X 46%
Sector Departments/ Intervention Required
Priority/Need Priority Ranking
Wards Affected Sector Departments
Comments
1 2 3 2020
Clinics / Health Services(24hrs ): Primary Health Care: -Access 15 minutes in – vehicle travel time or 1,5 km walking distance. -Thresholds to serve a population of about 5 000 – 70 000 depending on the catchment size.
X 1,2,3,4,5,6,8,9,10, 11,14,15,17,19,20,23,24,25,26
X 68%
Health – district hospitals:
Access up to 30 minutes in vehicle travel time.
450 000 people (planning should be aligned in terms of the Provincial Spatial Development Framework)
X
1,2,3,5,6,8,9,14,21,23,26
X 39%
Early childhood development centres: (Inspections)
Demand is very dependent on social structures within communities and may vary widely.
X
1,3,6,7,8,12,13,14,15,16,19,20,25
X 46%
Development of Disability Centres (New):
Development of a disability centre for people with disabilities
X
1,2,3,4,5,6,7,8,9,10, 11,12,13,14,15,16,17,18,19,20,21,22,23, 24,25,26,27,28
X 100%
Public Safety Facilities: Police stations:
To improve visible policing and response times the provision of one station per 30 000 people is considered desirable by planners. Manpower and operational challenges make this unrealistic at present
X
1,2,3,4,5,6,8,9,10, 11,12,13,14,15,16,19,20,21,22,24,25,26
X 79%
Magistrate Courts:
No agreed common norms – Department of Justice considers proximity to users, political issues, caseloads of courts and crime hot spots.
Planning is undertaken on a national or provincial basis by Government.
X 3,6,11,16,20 X 18%

428
Priority/Need Priority Ranking
Wards Affected Sector Department
Comments
1 2 3 2020
Home Affairs Offices:
Access 30 minutes in – vehicle travel time.
Thresholds 200 000 people.
X
3,5,6,7,14,15,16,19,20,23,24,25
X 43%
Fire Station:
100 000 people (indicative only, overriding factor is reach & density)
X
3,4,5,6,7,8,9,10,11,14,15,19,22,24,25, 26
X 57%
Emergency Services:
Ambulances
X
1,2,3,5,6,7,8,9,10, 11,13,14,15,19,20, 23, 24,26
X 64%
Schools/Education:
Pre-Schools
Access -750m
Estimated minimum population
X
3,5,6,7,12,14,19,20 X 29%
Primary Schools:
Access maximum 15 minutes in – vehicle travel time. Preferably within walking distance of 1 km.
Estimated population threshold 5 500.
X
1,3,6,7,14,15,19,20,22,25
X 36%
Secondary Schools:
Access maximum 15 minutes in – vehicle travel time. Preferably within walking distance of 1.5 km.
Estimated population threshold 12 500.
X
3,5,6,7,12,13,14,15,20,21,22,23,26
X 46%
HIV/AIDS Awareness Campaigns X
1,2,3,5,6,7,10,14,19,20,22,24,25,26,28
X 54%
Development of Libraries on newly developed areas X 3,4,6,7,12,14,25,26 X 29%

429 SECTION L: 1.18 IDP VERTICAL ALIGNMENT: SECTOR PROJECTS AND PROGRAMMES:
Allocations for the WRDM are as follows:
C DC48 West Rand
2020/21
R thousands
2021/22
R thousands
2022/23
R thousands
Direct transfers
Equitable share and related 215 078 223 207 230 349
Fuel levy sharing
Infrastructure 2 615 2 759 2 919
Municipal infrastructure grant
Urban settlement development grant
Public transport network grant
Integrated national electrification programme (municipal) grant
Neighbourhood development partnership grant (capital grant)
Rural roads assets management systems grant 2 615 2 759 2 919
Integrated city development grant
Regional bulk infrastructure grant
Water services infrastructure grant
Municipal disaster recovery grant
Integrated urban development grant
Metro informal settlements partnership grant
Capacity building and other current transfers 2 020 1 000 1 200
Local government financial management grant 1 000 1 000 1 200
Municipal systems improvements grant
Expanded public works programme integrated grant for municipalities 1 020
Infrastructure skills development grant
Municpal emergency housing grant
Energy efficiency and demand side management grant
Municipal disaster grant
Municipal human settlements capacity grant
Municipal demarcation transition grant
Sub total direct transfers 219 713 226 966 234 468
Indirect transfers
Infrastructure transfers 14 935 30 863 -
Regional bulk infrastructure grant
Integrated national electrification programme (Eskom) grant
Neighbourhood development partnership grant (technical assistance) 14 935 30 863
Rural households infrastructure grant
Water services infrastructure grant
Bucket eradication programme grant
Capacity building and other current transfers - 945 1 100
Municipal systems improvements grant 945 1 100
Sub total indirect transfers 14 935 31 808 1 100
Total 234 648 258 774 235 568
Transfers from Provincial Departments
Municipal Allocations from Provincial Departments 726 - -
of which
Department of Cooperative Governance and Traditional Affairs 726 - -
Functional Fire and Rescue Services
Expanded Public Works Programme (CoGTA)
Peformance Management System 726
Total: Transfers from Provincial Departments 726 - -
LOCAL GOVERNMENT MTEF ALLOCATIONS: 2020/21 - 2022/23

430
STATE OF THE NATION ADDRESS: 13 FEBRUARY 2020
The Key priority areas highlighted in the State of the Nation Address by Mr Matamela Cyril Ramaphosa, the President of the Republic of South Africa are as follows:
2.4 million Children are in Early Childhood Development ECD centres and pre-schools.
720,000 students received state funding for TVET colleges and universities during last year.
I6.8 million South Africans knows their HIV status, 5 million people are initiated on antiretroviral treatment and the 4.2 million people HIV viral load is undetectable.
National Development Plan to eliminate poverty and reduce inequality by 2030.
Stabilise the economy and build a foundation for growth. We are taking the following measures to rapidly and significantly increase generation capacity outside of Eskom:
Initiating the procurement of emergency power from projects that can deliver electricity into the grid within 3 to 12 months from approval.
Municipalities in good financial standing to procure their own power from independent power producers.
The finalisation of the Climate Change Bill, to effective management of climate change.
To reduce government spending, prioritise resources and improve the efficiency of tax system.
Proceeding with the establishment of a state bank with the effort to extend access to financial
services to all South Africans.
The business rescue practioners to unveil their plans for restructuring the airline.
Modernising PRASA’s rail network.
Investing R1.4 billion for commuter rail lines to provide a safe, reliable and affordable service.
Growth and job creation be driven by private enterprise.
Water use licences issued within 90 days.
Introduction of coding and robotics in grades R to 3 in 200 schools, with a plan to implement it fully by 2022.
Establishment of a new University of Science and Innovation in Ekurhuleni.
Prioritisation of Police visibility, effective training and better resourcing of police/stations. 7,000 new police trainees enlisted this year to strengthen local policing.
Establishment of a Crime Detection University in Hammanskraal.

431
R1.6 billion to support to end the crisis of violence perpetrated by men against women.
Amendment of the Domestic Violence Act and the Sexual Offences Act to better protect victims of domestic violence.
Launching of the National Anti-Corruption Strategy by mid-year.
R9 billion of private investment in the construction of 37 000 rental apartments.
R64 billion for student accommodation and leverage at least another R64 billion in private
investment.
Creation of opportunities for youth employment and self-employment.
Setting aside 1% of the budget to deal with the high levels of youth unemployment.
To designate 1,000 locally produced products that must be procured from SMMEs.
To launch a new auto SEZ hub in Tshwane, to expand production and local manufacture of components.
Completed Poultry Master Plan to support chicken farmers and save 54,000 jobs while creating
new jobs.
To accelerate Land Reform and Agriculture and land redistribution, to expand agricultural production and transform the industry.
In preparation for NHI, more than 44 million people are registered at over 3,000 clinics in the
electronic Health Patient Registration System, and implementing this system in hospitals.
Establishment of the Presidential Working Group on Disability.
South African Sign Language to be a home language and also the 12th official language recommended by the Parliamentary Constitutional Review Committee.
South Africa assumed the chair ship of the African Union for 2020.
The African Continental Free Trade Area will come into effect in 2020.
Expansion of the district development model to 23 new districts, drawing on lessons from the
three pilot districts – OR Tambo District Municipality, Ethekwini and Waterberg District Municipality.
432 STATE OF THE PROVINCE ADDRESS: 25 FEBRUARY 2020 The Key priority areas highlighted in the State of the Province Address by Mr David Makhura, the Premier of Gauteng are as follows: The focus are on the following seven priorities: Economy, Jobs and Infrastructure
Focusing on high growth sectors and new industries to create new jobs. The Gauteng Provincial Government will spend R60 billion on building and maintaining
infrastructure.
The release of 30 000 hectares of land by Sibanye Gold has unlocked major investment projects in the West Rand.
The Gauteng Provincial Government and municipalities will collectively invest no less than R100 billion in bulk infrastructure in the five corridors.
The private sector, state-owned enterprises, provincial government and municipal
infrastructure projects will bring in at least R760 billion into the Gauteng economy over the next 5-10 years.
BUILDING INTEGRATED HUMAN SETTLEMENTS AND NEW CITIES
Over 1.2 million public government-subsidised houses have been built in Gauteng, benefitting million people. Finalise all incomplete human settlements projects including the Urban Renewal Projects in
Alexandra, Evaton, Kliptown, Bekkersdal and Winterveldt.
To provide additional 250 000 people with affordable rental and decent accommodation over the next 5-10 years.
Building a new city stretching from Lanseria (Gauteng) to Haartebeespoort Dam (Madibeng,
North West). Education, Skills and Health
Developed improvement plans for all primary schools in our province, focusing primarily on improving literacy, numeracy, languages and mathematics.
Providing funding, curriculum development and training for teachers.
To reach one million of children aged 0-4 for Grade R, Early Childhood Development in 2025.
To build 100 new schools in the next 10 years, 50% of which will be built in the next five years.
Strengthening school safety, by working together with School Governing Bodies and law
enforcement agencies.
Making progress with the UNAIDS by ending AIDS by 2030.
Provides 24-hour services in all 32 community health centres in the five corridors of Gauteng City Region.
By 2025, all patient records will be digitised in Gauteng and paper files will be history.

433
In the next 24 months, 10 priority hospitals will undergo major renovations.
Building of six new Hospitals during this decade.
Building of a new Medical School during this decade to expand the capacity to train more doctors and other health professionals.
Safety, Social Cohesion and Food Security
To release bi-annual audits of the performance on the reduction of priority crimes on 142 police stations.
All patrollers have full uniforms provided by the Gauteng Provincial Government.
Employ 400 additional traffic police officers over the next three years.
Sustainable Development for Future Generations
Reducing Greenhouse gas (GHGs) emissions by 42% in 2030.
Developing climate mitigation and adaptation strategies.
Municipalities to have Early Warning Systems in place to prevent floods and other climate-induced disasters.
Rolling out 33 of air quality monitoring stations to ensure that the air is healthy and breathable
across all corners of our province and intervene where there is pollution. A Capable, Ethical and Developmental State
To use multi-channel digital technology to improve direct interaction between residents and the government by 2025.
Lifestyle audits of public office bearers and government officials be conducted.
Focusing on anti-corruption drive, fraud and corruption in law enforcement agencies, Health,
Education, Licensing and Human Settlements. A Better Africa and a Better World
To ensure overall progress in achieving the Sustainable Development Goals.
Breaking the back of patriarchy and racism and make meaningful progress towards a non-sexist and non-racial society.
Ensuring that the size of Gauteng economy reaches R2 trillion by 2010.
Creation of 3.1 million jobs through specific sectoral and spatial interventions outlined in Plan of
Action.

434 STATE OF THE NATION ADDRESS: 26 FEBRUARY 2020 The Key priority areas highlighted in the 2020 Budget Speech by Mr Tito Mboweni, the Minister of Finance are as follows: Economic context In 2020, global economic growth is expected to strengthen to 3.3%. SA economy will grow 0.9% and inflation will average 4.5% in 2020. Towards an economic strategy An Economic Strategy plan, is to put focus in the following basic and fundamental pillars of
approach: 1. Focusing spending on education, health and social development; 2. Focusing on job-creating sectors, such as agriculture and tourism.
Prudent Fiscal Policy Outline of the budget for 2020-21 For 2020-21, revenue is projected to be R1.58-trillion, or 29.2% of GDP. Expenditure is projected at R1.95-trillion, or 36% of GDP. This means a consolidated budget deficit of R370.5bn, or 6.8% of GDP in 2020-21. Tax adjustments Personal income tax relief. Broadening of the corporate income tax base. Reducing the scope for fraud and abuse of state funds. An increased excise duties to keep pace with inflation.
A 340ml can of beer or cider will cost only an extra 8c; A bottle of 750ml spirits, including whisky, gin or vodka, will rise by R2.89; A packet of 20 cigarettes will be an extra 74c;
Plastic bag levy increased by 25c. Reducing structurally high spending Consolidated government spending to grow at an average annual rate of 5.1%, from R1.95-trillion in
2020-21 to R2.14-trillion in 2022-23. Reduction of R261bn on wage bill. These are partially offset by additions and reallocations of R111bn.
R60bn, is for Eskom and SAA. Programme spending adjustments Adjustments amount of R14.6bn for human settlements. Adjustments of R2.8bn to the Municipal Infrastructure Grant. Education infrastructure allocations adjusted by R5.2bn and health is adjusted by R3.9bn. The wage bill Second adjustments on the wage bill by R160bn. Hiring in important areas such as education, police, and health care. Aim to save R37.8bn in the next financial year. Wasteful expenditure and corruption Approved the publication of a new Public Procurement Bill. Acceleration of merging and consolidating public entities. Propose a new law to stop excessive salaries in these public entities.

435 To deal decisively with the excessive, high cost of leasing government buildings.
Appropriate monetary policy The Reserve Bank will continue to undertake its duties in line with section 224 of the constitution
which is to perform its functions independently without fear, favour or prejudice in the interest of balanced and sustainable growth in the Republic.
Aligning spending priorities to the economic growth plan A need to make sure children are well educated, people are healthy and money is invested properly. Learning, health and social development Learning and culture, receives R396bn, health R230bn, and social development R310bn. Introducing coding and robotics to learners in grades R to 3. Establishment of a new university of science and innovation in Ekurhuleni. R500-million has been provisionally set aside for disaster management. The infrastructure fund The Development Bank of Southern Africa will package blended finance megaprojects of R200bn. Youth employment Helping 8.2-million young people between the ages of 15 and 34 are not in education, employment
or training. Social grants Grants are adjusted as follows:
1. R80 increase for the old-age, disability and care-dependency grants to R1,860 per month; 2. R80 increase in the war veterans grant to R1,880; 3. R40 increase for the foster care grant to R1,040 per month; and 4. The child support grant will increase by R20 to R445 per month.
Modernising network industries and restructuring the SOEs To modernise network industries and to restructure the state-owned enterprises. Electricity Government will ensure a stable electricity supply. Allocation of R230bn over ten years to achieve the restructuring of the electricity sector. SAA SAA is placed in business rescue, which will lead to a radically restructured airline. An allocation of R16.4bn to settle guaranteed debt and interest. Rail Approval of the Economic Regulation of Transport Bill in November.
Opening up our markets to trade with the rest of the continent Raising an exempt amount for foreign remuneration to R1.25m. Reimagining our industrial strategy
1. An innovation fund will be capitalised with R1.2bn over the next three years; 2. Industrial business incentives worth R18.5bn will create and retain about 56,500 jobs;
Lowering the cost of doing business ICASA will be appropriately capacitated.
436 A voucher system will be introduced to allow households to acquire digital devices. Supporting agriculture and tourism An allocation of R495.1m to the department of agriculture, land reform and rural development. An additional R500m is reprioritized to finalise land claims. Formalising the tourism levy. Enforcing justice The NPA, Special Investigating Unit and Directorate for Priority Crime Investigation get an additional
R2.4bn. Off-budget initiatives to grow the economy Supporting lending The Help to buy scheme has supported nearly R1bn in new lending. State bank Consolidate the currently fragmented system of national and provincial development finance
institutions. Sovereign wealth fund Strengthening the fiscal framework. The formation of the SA Sovereign Wealth Fund with a capital amount of R30bn. An efficient and capable state Re-establishing SARS institutional integrity and fighting criminal activity. Strengthening municipalities R426bn allocation by local government from nationally raised funds. Lanseria has been identified as a potential smart city. Strengthening provinces Provinces provide health care and education and are at the frontline of service delivery. Strengthening regulatory oversight Strengthening of the Independent Regulatory Board for Auditors. Appoint of an independent panel of experts to review practices in the auditing profession.

437
STATE OF THE DISTRICT ADDRES: 2020
To be tabled.

438 SECTION N: 1.20 2020/21 DRAFT BUDGET REPORT
Budget overview

439

440