Embed Size (px)
Citation preview
WEST Region
Regional Composite
REGIONALDATA REPORT
JAN – DEC2012 vs. 2011
2
Methodology
• Sales and Market Data is obtained using CAST (Category Avocado Sales Trend)– Symphony Information Resources Inc. Group (SymphonyIRI Group) gathers chain-wide
sales across all RMAs (Retail Market Areas)• Regional figures include data collected from all reporting retailers, as well as imputed data (non-
reporting retailers such as club, warehouse and independent stores) for a total of 100% of retail sales for the area
– Data is entered into CAST system– Using CAST, data is queried and reported
• Average Selling Price (ASP) is not Advertised Retail Price– Average selling price is the average of all prices including coupons, promotional
pricing, club/loyalty card deals that are given at the register at the time of purchase
• Timeframe: YTD Q4 (January– December)
• Retail data provided by SymphonyIRI Group / FreshLook Marketing
• Important Note: SymphonyIRI Group / FreshLook Marketing periodically restates retail data, therefore this review cannot be compared or used in conjunction with prior reviews

3
West: Region Highlights - YTD Q4
• Overview based on the following markets:– Boise, ID; Denver, CO; Las Vegas, NV; Phoenix, AZ; Portland, OR; Seattle, WA; Spokane,
WA
• West Overview– Avocado retail dollar average trends through Q4 outpaced Fruit and Produce retail dollar
trends – Category dollars grew +6% in 2011 and 2012 for a net growth of +13% over 2010– Category units declined -16% in 2011, but grew +32% in 2012 for a net growth +11%
over 2010– Category average selling price (ASP) increased +27% in 2011, but declined -19% in 2012
to $0.90/unit
• West Per Store Averages– 2012 Average dollars of $13,730 per store were +8% higher than 2011 and +16% higher
than 2010– 2012 Average units of 15,015 per store were +38% higher than 2011 and +13% higher
than 2010
• West versus Total U.S. trends– WE’s category unit growth of +32% was -7 points lower than the national average– WE’s category dollar trend of +6% was -5 points lower than the national average– WE’s 2012 category ASP of $0.90/unit was -2% lower than the national average of
$0.92/unit
4
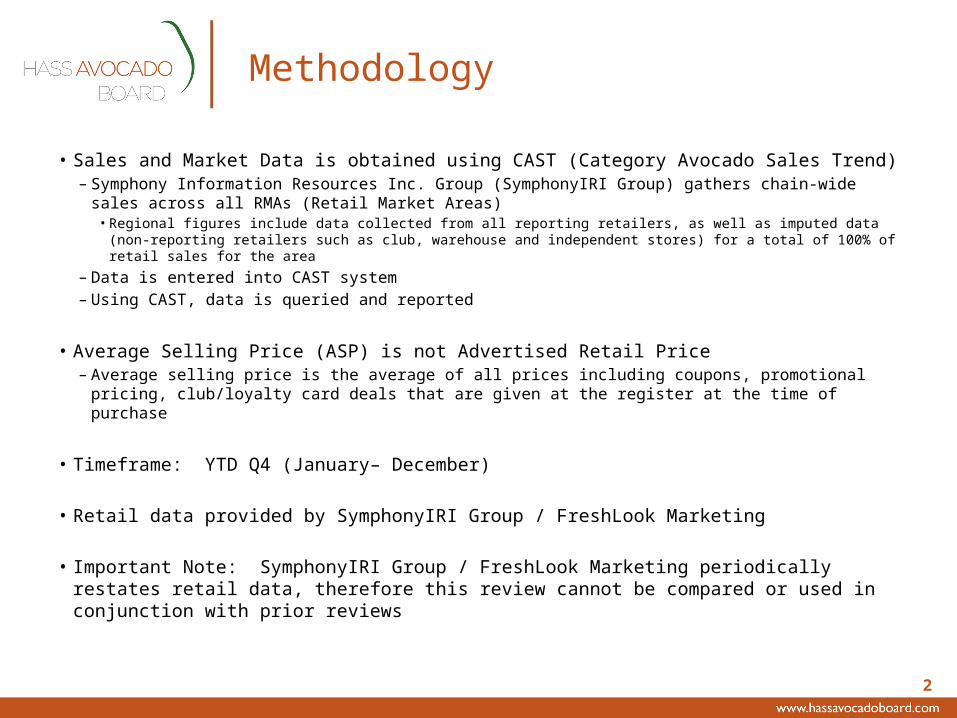
West: YTD Q4 Retail Dollar Trend ComparisonsAvocados vs. Fruit vs. Produce
• Avocado retail dollar average trends through Q4 outpaced Fruit and Produce retail dollar trends– 2011 versus 2010, Avocados outpaced Fruit and Produce by +2 points– 2012 versus 2011, Avocados outpaced Fruit by +3 points and Produce
by +6 points– 2012 versus 2010, Avocados dollars grew +13% which outpaced Fruit
by +6 points and Produce by +8 points
5
West: YTD Q4 Avocado Retail Overview
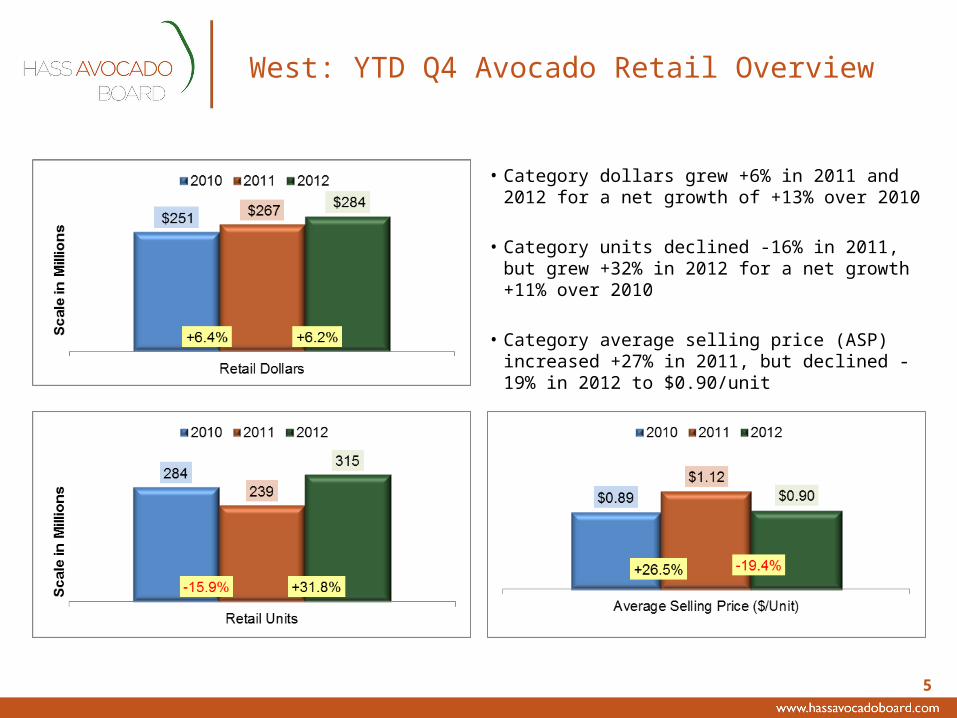
• Category dollars grew +6% in 2011 and 2012 for a net growth of +13% over 2010
• Category units declined -16% in 2011, but grew +32% in 2012 for a net growth +11% over 2010
• Category average selling price (ASP) increased +27% in 2011, but declined -19% in 2012 to $0.90/unit
6
West vs. Total U.S.YTD Q4 PLU Comparisons
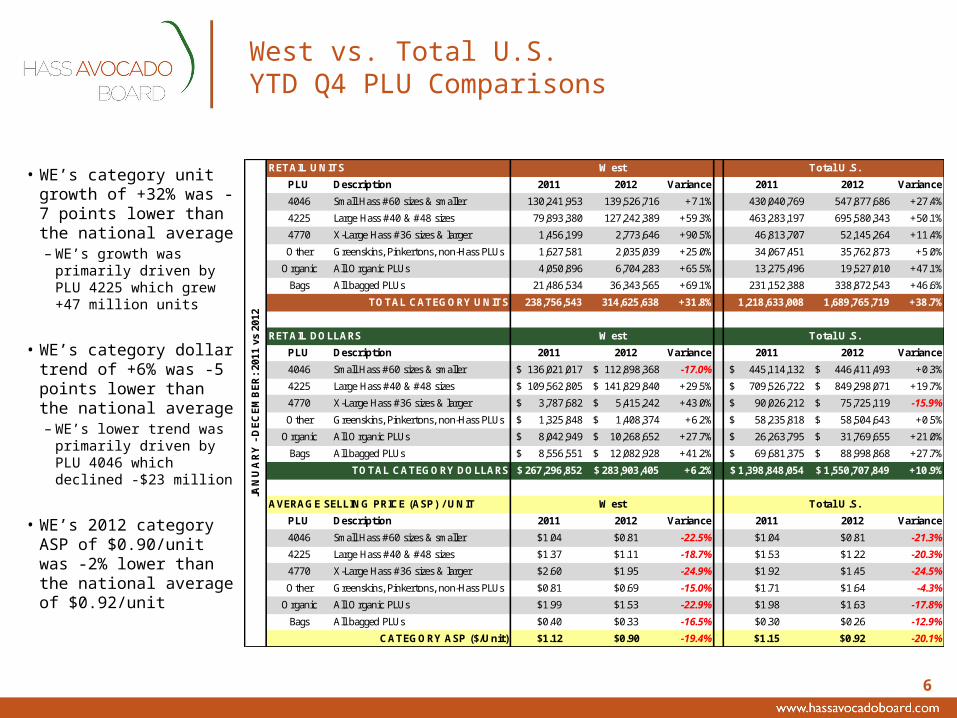
• WE’s category unit growth of +32% was -7 points lower than the national average– WE’s growth was
primarily driven by PLU 4225 which grew +47 million units
• WE’s category dollar trend of +6% was -5 points lower than the national average– WE’s lower trend
was primarily driven by PLU 4046 which declined -$23 million
• WE’s 2012 category ASP of $0.90/unit was -2% lower than the national average of $0.92/unit
RETAIL UNITS
PLU Description 2011 2012 Variance 2011 2012 Variance
4046 Small Hass #60 sizes & smaller 130,241,953 139,526,716 +7.1% 430,040,769 547,877,686 +27.4%
4225 Large Hass #40 & #48 sizes 79,893,380 127,242,389 +59.3% 463,283,197 695,580,343 +50.1%
4770 X-Large Hass #36 sizes & larger 1,456,199 2,773,646 +90.5% 46,813,707 52,145,264 +11.4%
Other Greenskins, Pinkertons, non-Hass PLUs 1,627,581 2,035,039 +25.0% 34,067,451 35,762,873 +5.0%
Organic All Organic PLUs 4,050,896 6,704,283 +65.5% 13,275,496 19,527,010 +47.1%
Bags All bagged PLUs 21,486,534 36,343,565 +69.1% 231,152,388 338,872,543 +46.6%
238,756,543 314,625,638 +31.8% 1,218,633,008 1,689,765,719 +38.7%
RETAIL DOLLARS
PLU Description 2011 2012 Variance 2011 2012 Variance
4046 Small Hass #60 sizes & smaller 136,021,017$ 112,898,368$ -17.0% 445,114,132$ 446,411,493$ +0.3%
4225 Large Hass #40 & #48 sizes 109,562,805$ 141,829,840$ +29.5% 709,526,722$ 849,298,071$ +19.7%
4770 X-Large Hass #36 sizes & larger 3,787,682$ 5,415,242$ +43.0% 90,026,212$ 75,725,119$ -15.9%
Other Greenskins, Pinkertons, non-Hass PLUs 1,325,848$ 1,408,374$ +6.2% 58,235,818$ 58,504,643$ +0.5%
Organic All Organic PLUs 8,042,949$ 10,268,652$ +27.7% 26,263,795$ 31,769,655$ +21.0%
Bags All bagged PLUs 8,556,551$ 12,082,928$ +41.2% 69,681,375$ 88,998,868$ +27.7%
267,296,852$ 283,903,405$ +6.2% 1,398,848,054$ 1,550,707,849$ +10.9%
AVERAGE SELLING PRICE (ASP) / UNIT
PLU Description 2011 2012 Variance 2011 2012 Variance
4046 Small Hass #60 sizes & smaller $1.04 $0.81 -22.5% $1.04 $0.81 -21.3%
4225 Large Hass #40 & #48 sizes $1.37 $1.11 -18.7% $1.53 $1.22 -20.3%
4770 X-Large Hass #36 sizes & larger $2.60 $1.95 -24.9% $1.92 $1.45 -24.5%
Other Greenskins, Pinkertons, non-Hass PLUs $0.81 $0.69 -15.0% $1.71 $1.64 -4.3%
Organic All Organic PLUs $1.99 $1.53 -22.9% $1.98 $1.63 -17.8%
Bags All bagged PLUs $0.40 $0.33 -16.5% $0.30 $0.26 -12.9%
$1.12 $0.90 -19.4% $1.15 $0.92 -20.1%
Total U.S.
Total U.S.
Total U.S.
JAN
UA
RY - D
EC
EM
BER: 20
11 v
s 20
12
West
TOTAL CATEGORY UNITS
West
TOTAL CATEGORY DOLLARS
West
CATEGORY ASP ($/Unit)
7
13,345
10,868
15,015
-18.6% +38.2%
Avg Retail Units Per Store
2010 2011 2012
$11,828$12,732
$13,730
+7.6% +7.8%
Avg Retail Dollars Per Store
2010 2011 2012
West: YTD Q4 Category Per Store Averages
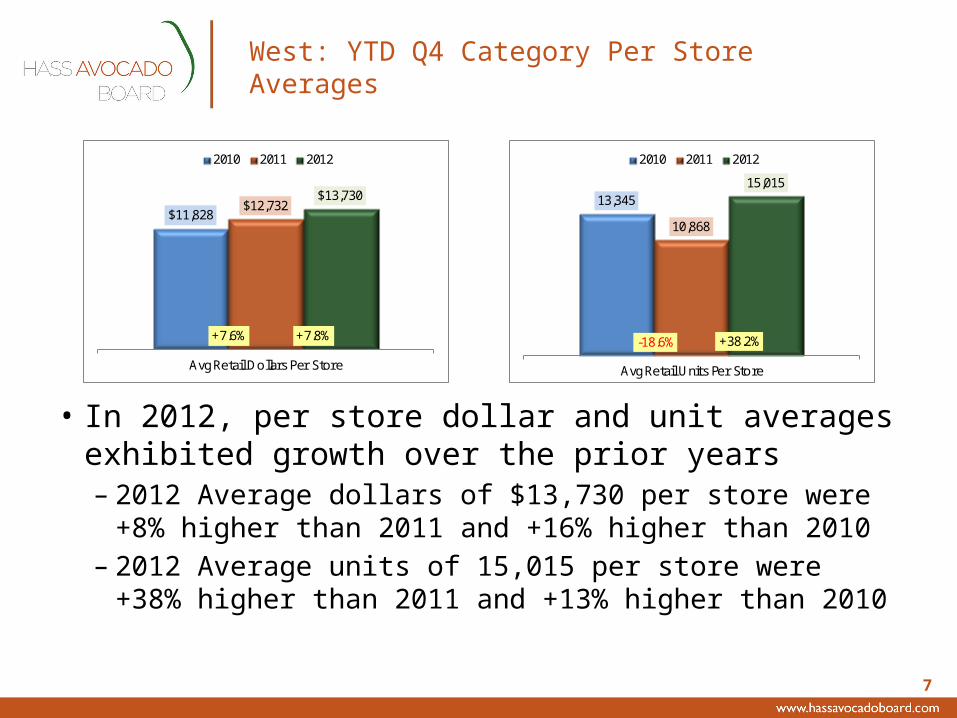
• In 2012, per store dollar and unit averages exhibited growth over the prior years– 2012 Average dollars of $13,730 per store were
+8% higher than 2011 and +16% higher than 2010– 2012 Average units of 15,015 per store were +38%
higher than 2011 and +13% higher than 2010
8
West: 2010 through Q4-2012 Per Store AveragesBy Quarter - Units vs. ASP
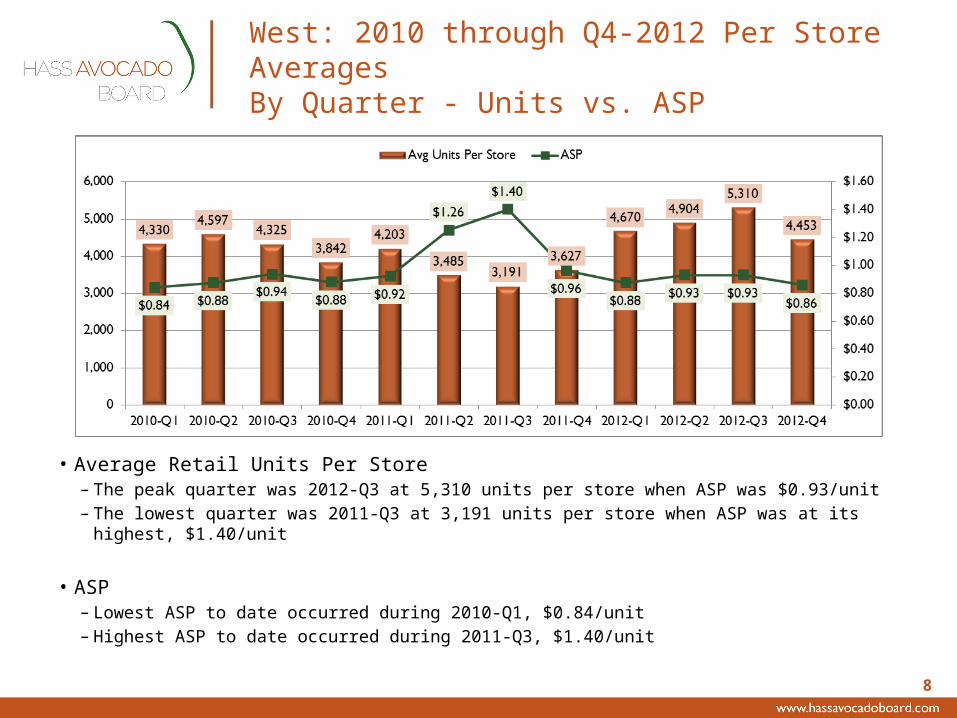
• Average Retail Units Per Store– The peak quarter was 2012-Q3 at 5,310 units per store when ASP was $0.93/unit– The lowest quarter was 2011-Q3 at 3,191 units per store when ASP was at its
highest, $1.40/unit
• ASP– Lowest ASP to date occurred during 2010-Q1, $0.84/unit– Highest ASP to date occurred during 2011-Q3, $1.40/unit
9
West: Region Highlights - YTD Q4
• Overview based on the following markets:– Boise, ID; Denver, CO; Las Vegas, NV; Phoenix, AZ; Portland, OR; Seattle, WA; Spokane,
WA
• West Overview– Avocado retail dollar average trends through Q4 outpaced Fruit and Produce retail dollar
trends – Category dollars grew +6% in 2011 and 2012 for a net growth of +13% over 2010– Category units declined -16% in 2011, but grew +32% in 2012 for a net growth +11%
over 2010– Category average selling price (ASP) increased +27% in 2011, but declined -19% in 2012
to $0.90/unit
• West Per Store Averages– 2012 Average dollars of $13,730 per store were +8% higher than 2011 and +16% higher
than 2010– 2012 Average units of 15,015 per store were +38% higher than 2011 and +13% higher
than 2010
• West versus Total U.S. trends– WE’s category unit growth of +32% was -7 points lower than the national average– WE’s category dollar trend of +6% was -5 points lower than the national average– WE’s 2012 category ASP of $0.90/unit was -2% lower than the national average of
$0.92/unit
10
Appendix
• Retail scan data is collected and entered into CAST approximately every 4 weeks– Data collection began in 1997– Data is collected and distributed by Symphony
Information Research, Inc. Group (SymphonyIRI Group) / FreshLook Marketing
– Data is scrubbed and reviewed for accuracy prior to entry
• Total U.S. totals and averages utilized in comparisons includes all regions