Embed Size (px)
Citation preview

Adhikari Samrachana World 1 East 443 LeFebvre Nichole World 2 West 453Aldrich Laura World 1 East 460 Vogelgesang Jimmy World 2 West 474Andrei Amanda World 1 East 484 McClutchy Sarah World 2 West 441Austin Ben World 1 East 523 Nguyen Helen World 2 West 419Barros Katie World 1 East 528 Peterson Jenna World 2 West 511Barrows Christie World 1 East 555 Potter Sarah World 2 West 490Bell David World 1 East 617 Potter Dylan World 2 West 442Bernier Arcand Philippe World 1 East 593 Powell Andrew World 2 West 494Boskovski Joe World 1 East 581 Quinn Abigail World 2 West 454Buchanan Joy World 1 West 511 Rosenthal Evan World 3 East 627Calise Cristina World 1 West 455 Scott Katherine World 3 East 426Chang Elizabeth World 1 West 529 Shivers Tionya World 3 East 516Choi Moses World 1 West 469 Smith Julie World 3 East 502Crail Drew World 1 West 458 Smith Ross World 3 East 352Crooks Ashley World 1 West 484 Sriram Matt World 3 East 484Dhar Sreyashe World 1 West 602 Stegman Robert World 3 East 382Diggs Amy World 1 West 594 Stewart Michaela World 3 East 577DiMaggio Vanessa World 1 West 516 Sung Vannie World 3 East 512Ennis Sean World 1 West 570 Syeddah Ayesha World 3 East 607Galvez Xondra World 2 East 557 Sylaj Adelina World 3 West 498Grape Richard World 2 East 673 Thompson Jessica World 3 West 570Guzenko Maria World 2 East 414 Turcotte Scott World 3 West 577Harning Brian World 2 East 433 Tushe Isida World 3 West 463Harris Brandon World 2 East 434 Ueyama Kimberly World 3 West 529Herman Lisa World 2 East 515 Underwood Brittany World 3 West 535Huerter John World 2 East 614 Vasilyev Pavel World 3 West 454Inden Margaret World 2 East 548 Wang Jusy World 3 West 510Johnson Jennifer World 2 East 569 Yee Natalie World 3 West 471Kotkin Rachel World 2 West 495 Zhang Di World 3 West 479
Role Score to DateStudent Score to DateRole Student
West sits on this side of the room.East sits on this side of the room.
Sit with people in your world.
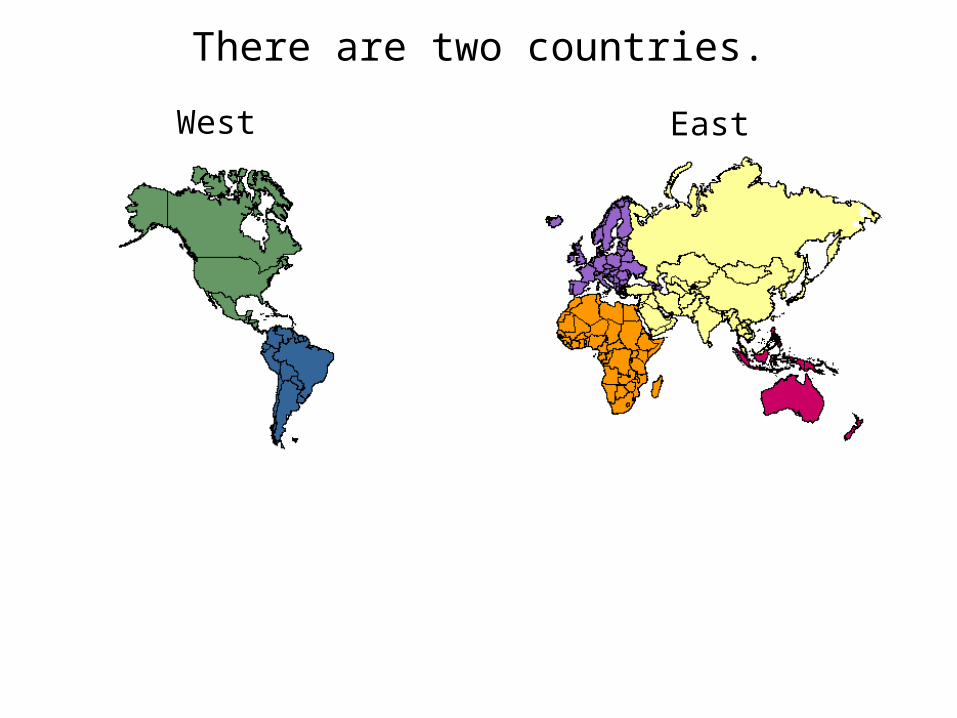
There are two countries.
West East

In each country, there are 20 workers.
West East
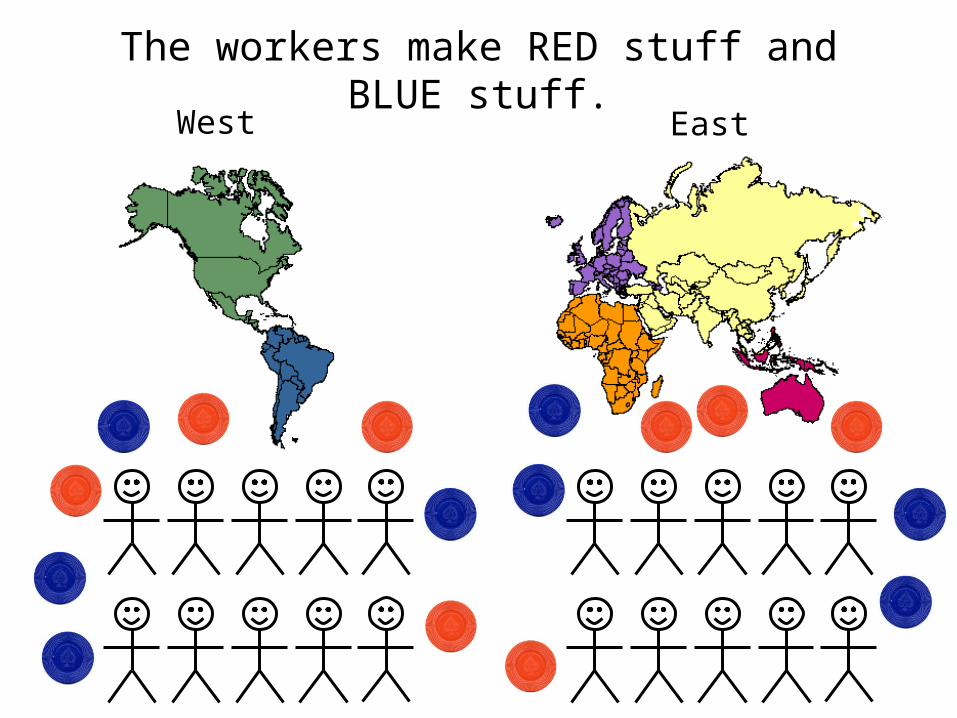
The workers make RED stuff and BLUE stuff.
West East

The workers eat the RED stuff and BLUE stuff.
West East
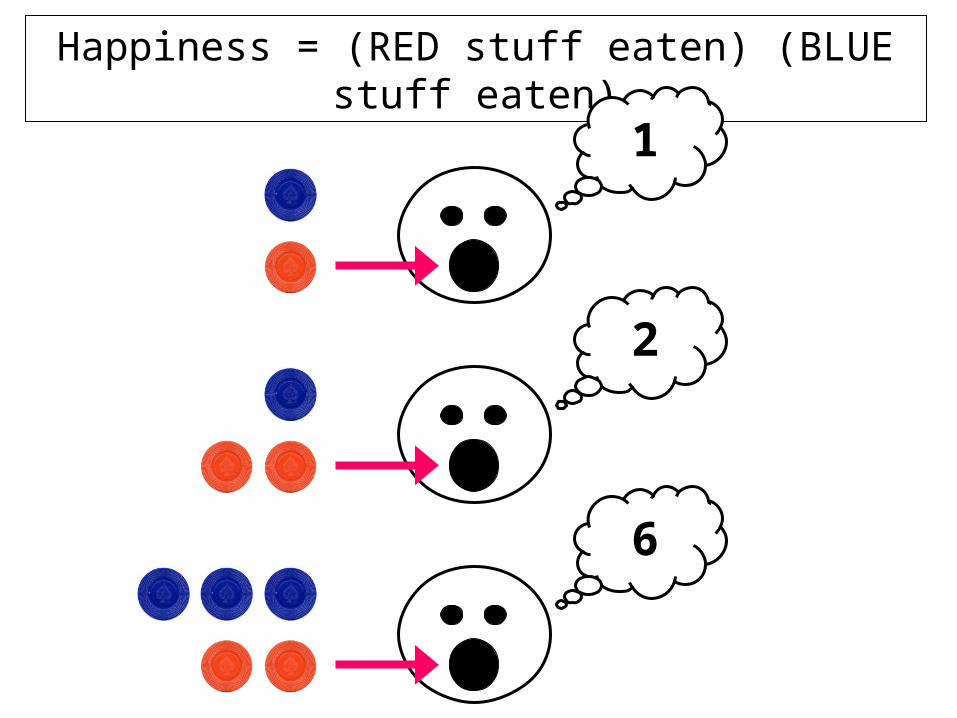
Happiness = (RED stuff eaten) (BLUE stuff eaten)
1
2
6
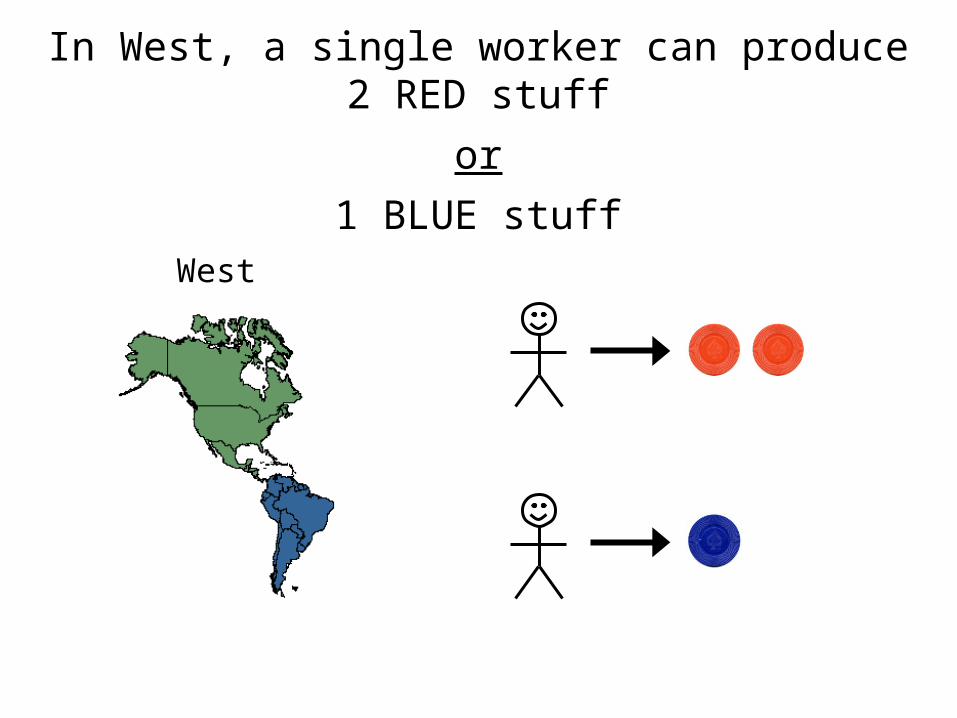
In West, a single worker can produce 2 RED stuff
or
1 BLUE stuffWest
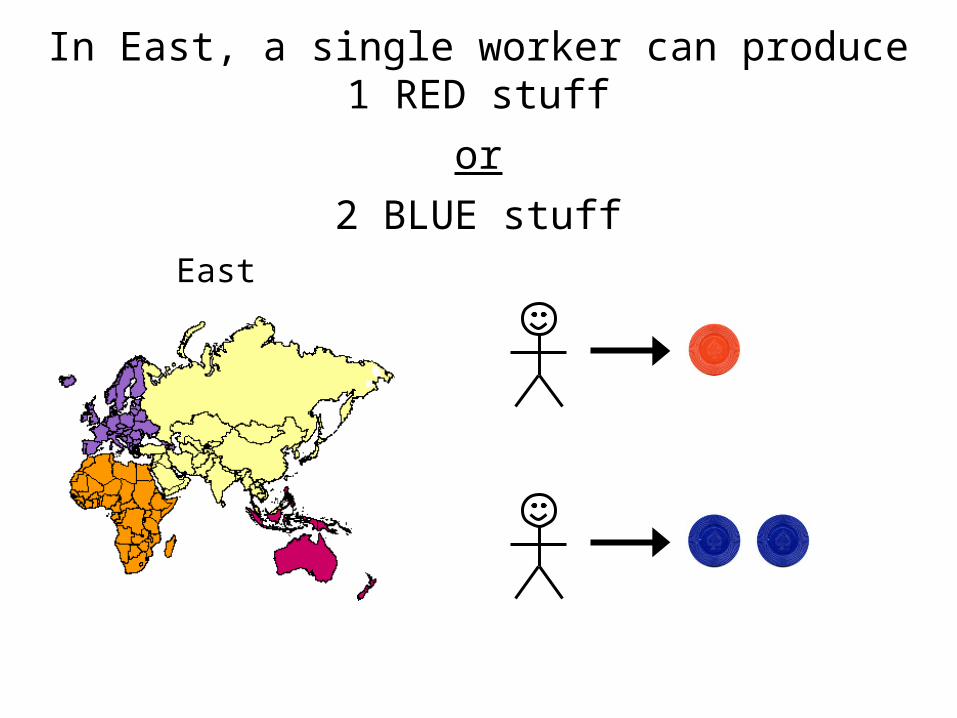
In East, a single worker can produce 1 RED stuff
or
2 BLUE stuffEast
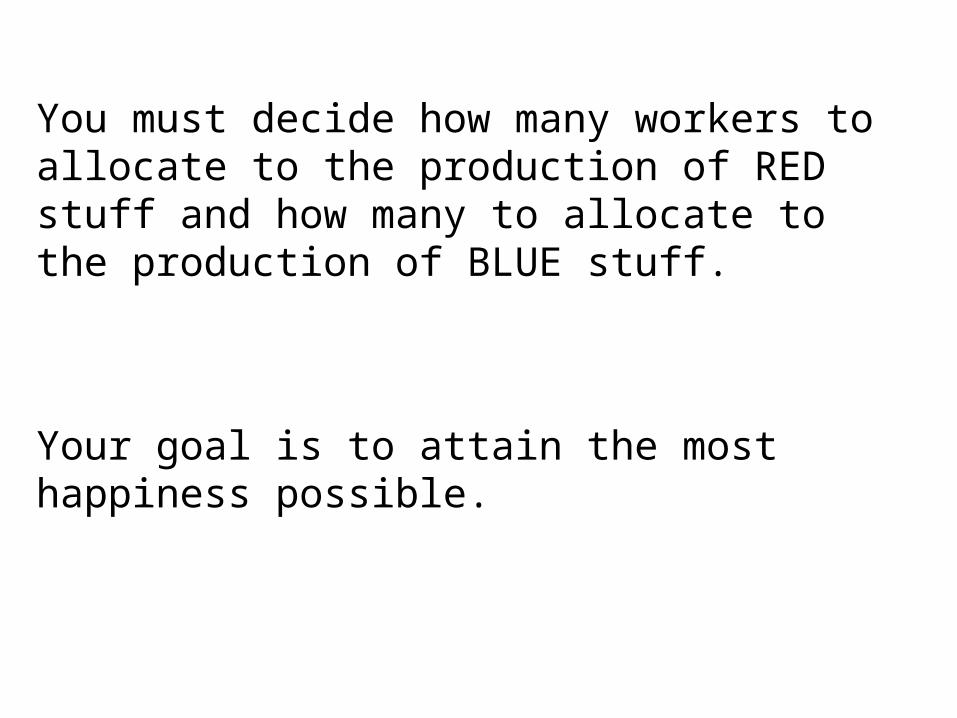
You must decide how many workers to allocate to the production of RED stuff and how many to allocate to the production of BLUE stuff.
Your goal is to attain the most happiness possible.

Example (using West):
Assign 1 Worker to RED production and 19 Workers to Blue productionProduce: 2 RED and 19 BLUE
Consume: 2 RED and 19 BLUE
Happiness = (2) (19) = 38
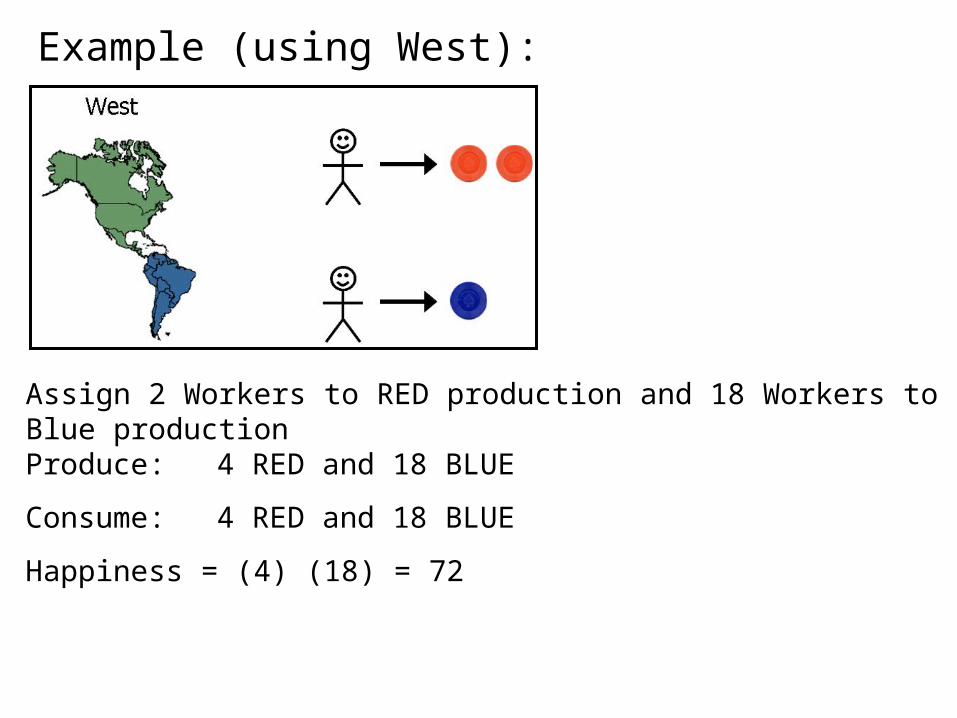
Example (using West):
Assign 2 Workers to RED production and 18 Workers to Blue productionProduce: 4 RED and 18 BLUE
Consume: 4 RED and 18 BLUE
Happiness = (4) (18) = 72
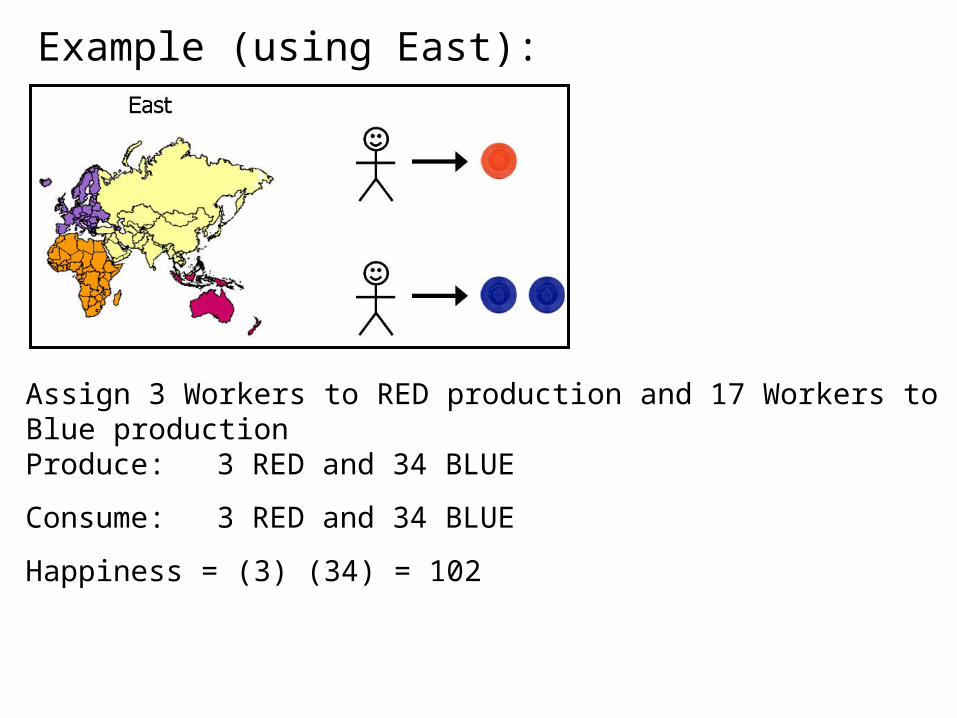
Example (using East):
Assign 3 Workers to RED production and 17 Workers to Blue productionProduce: 3 RED and 34 BLUE
Consume: 3 RED and 34 BLUE
Happiness = (3) (34) = 102

Record Your Decisions
Production of Red Production of Blue Units of Red Units of Blue Units of Red Units of BlueLabor Allocation (must total 20) Production Imports (negative = exports)
Units of Red Units of BlueConsumption (production plus imports)
Happiness (red consumed x blue consumed)
3 17
3 34
3 34
102

Round 1: Autarky
Allocate 20 workers to maximize happiness.

Now, you may produce, exchange, then consume.
West East

Record Your Decisions
Production of Red Production of Blue Units of Red Units of Blue Units of Red Units of BlueLabor Allocation (must total 20) Production Imports (negative = exports)
Units of Red Units of BlueConsumption (production plus imports)
Happiness (red consumed x blue consumed)
3 17
3 34
13
24
312
10
-10
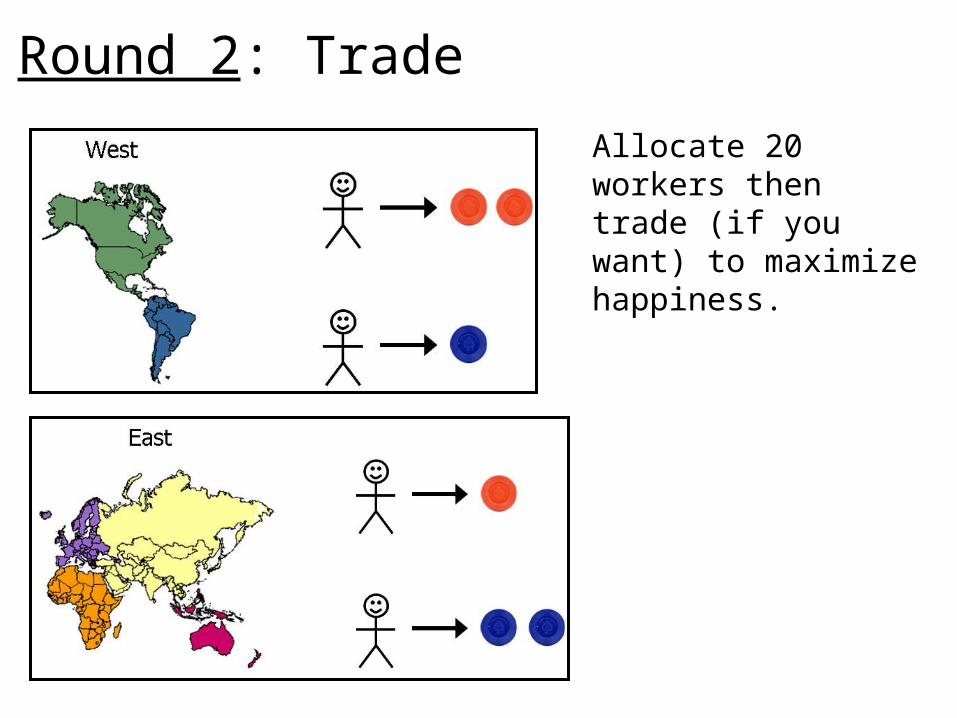
Round 2: Trade
Allocate 20 workers then trade (if you want) to maximize happiness.

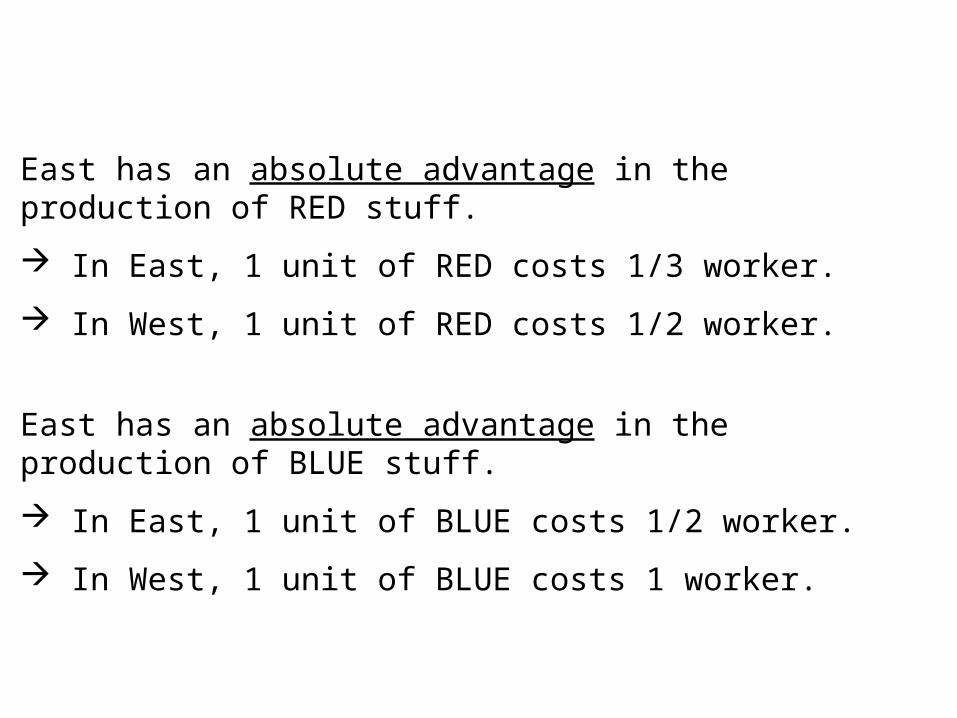
West has an absolute advantage in the production of RED stuff.
In West, 1 unit of RED costs 1/2 worker.
In East, 1 unit of RED costs 1 worker.
East has an absolute advantage in the production of BLUE stuff.
In East, 1 unit of BLUE costs 1/2 worker.
In West, 1 unit of BLUE costs 1 worker.

What if West is a lesser developed country such that East has an absolute advantage in the production of both RED and BLUE?

In West, a single worker can produce 2 RED stuff
or
1 BLUE stuffWest

In East, a single worker can produce 3 RED stuff
or
2 BLUE stuffEast
East has an absolute advantage in the production of RED stuff.
In East, 1 unit of RED costs 1/3 worker.
In West, 1 unit of RED costs 1/2 worker.
East has an absolute advantage in the production of BLUE stuff.
In East, 1 unit of BLUE costs 1/2 worker.
In West, 1 unit of BLUE costs 1 worker.

Round 3: Trade
Allocate 20 workers then trade (if you want) to maximize happiness.
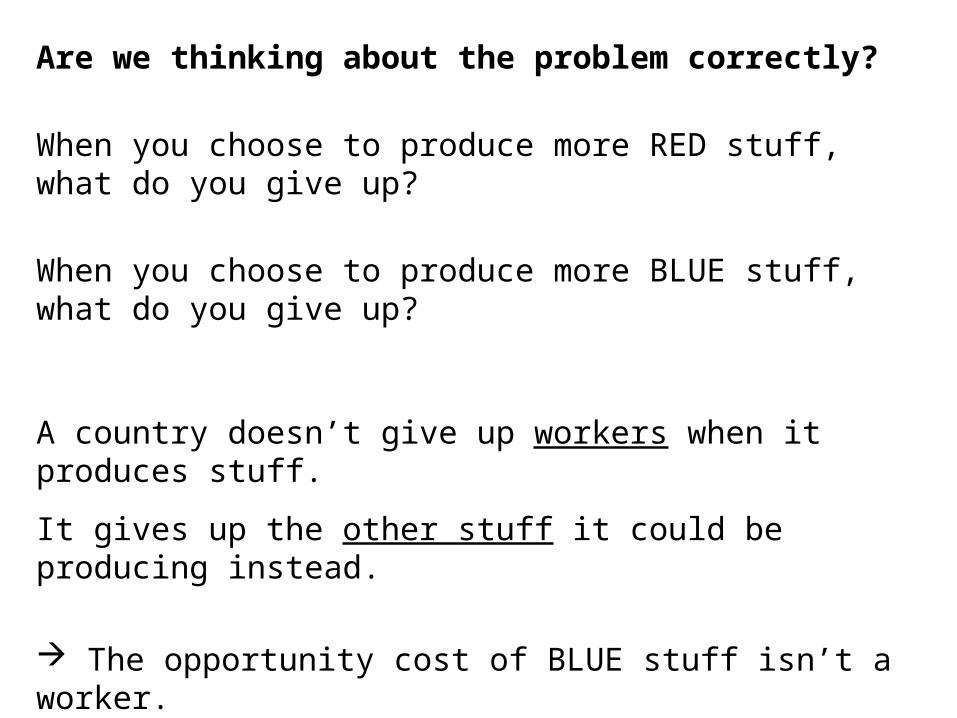
Are we thinking about the problem correctly?
When you choose to produce more RED stuff, what do you give up?
When you choose to produce more BLUE stuff, what do you give up?
A country doesn’t give up workers when it produces stuff.
It gives up the other stuff it could be producing instead.
The opportunity cost of BLUE stuff isn’t a worker.
The opportunity cost of BLUE stuff is RED stuff!

How many RED stuff does West have to give up to produce 1 more unit of BLUE stuff?
In West, the cost of 1 BLUE stuff is 2 RED stuff.
How many BLUE stuff does West have to give up to produce 1 more unit of RED stuff?
In West, the cost of 1 RED stuff is 1/2 of a BLUE stuff.

How many RED stuff does East have to give up to produce 1 more unit of BLUE stuff?
In East, the cost of 1 BLUE stuff is 3/2 RED stuff.
How many BLUE stuff does East have to give up to produce 1 more unit of RED stuff?
In East, the cost of 1 RED stuff is 2/3 of a BLUE stuff.
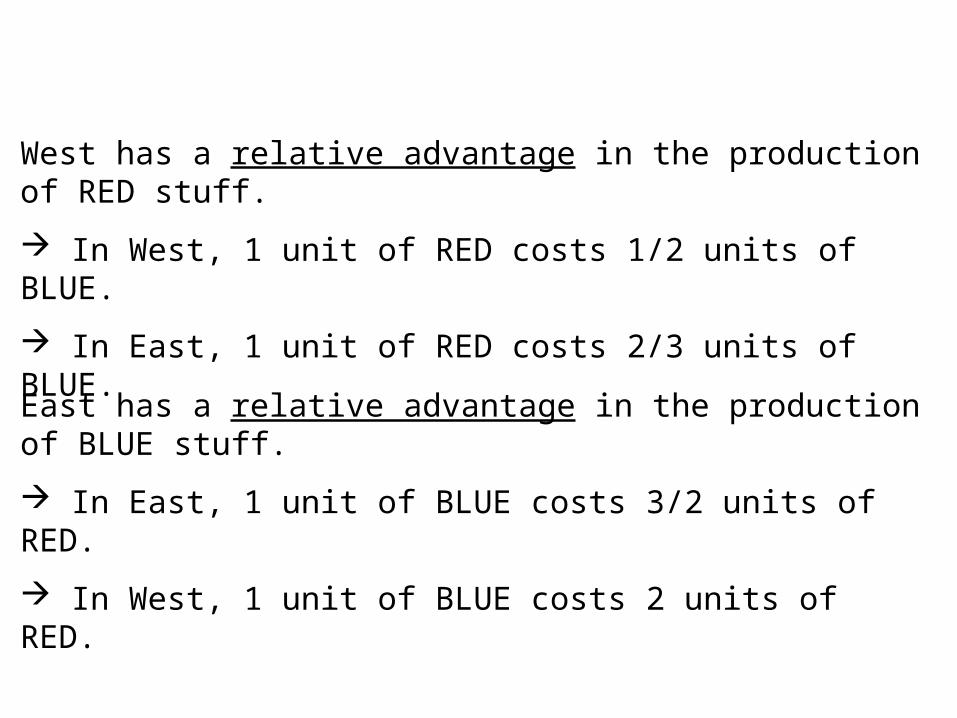
West has a relative advantage in the production of RED stuff.
In West, 1 unit of RED costs 1/2 units of BLUE.
In East, 1 unit of RED costs 2/3 units of BLUE.
East has a relative advantage in the production of BLUE stuff.
In East, 1 unit of BLUE costs 3/2 units of RED.
In West, 1 unit of BLUE costs 2 units of RED.
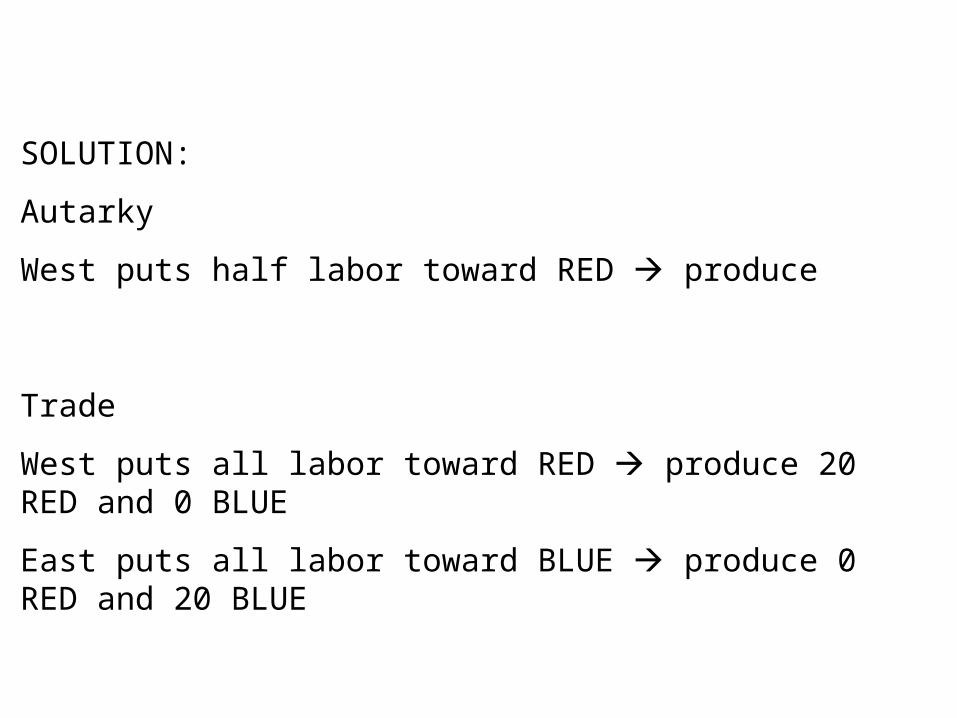
SOLUTION:
Autarky
West puts half labor toward RED produce
Trade
West puts all labor toward RED produce 20 RED and 0 BLUE
East puts all labor toward BLUE produce 0 RED and 20 BLUE
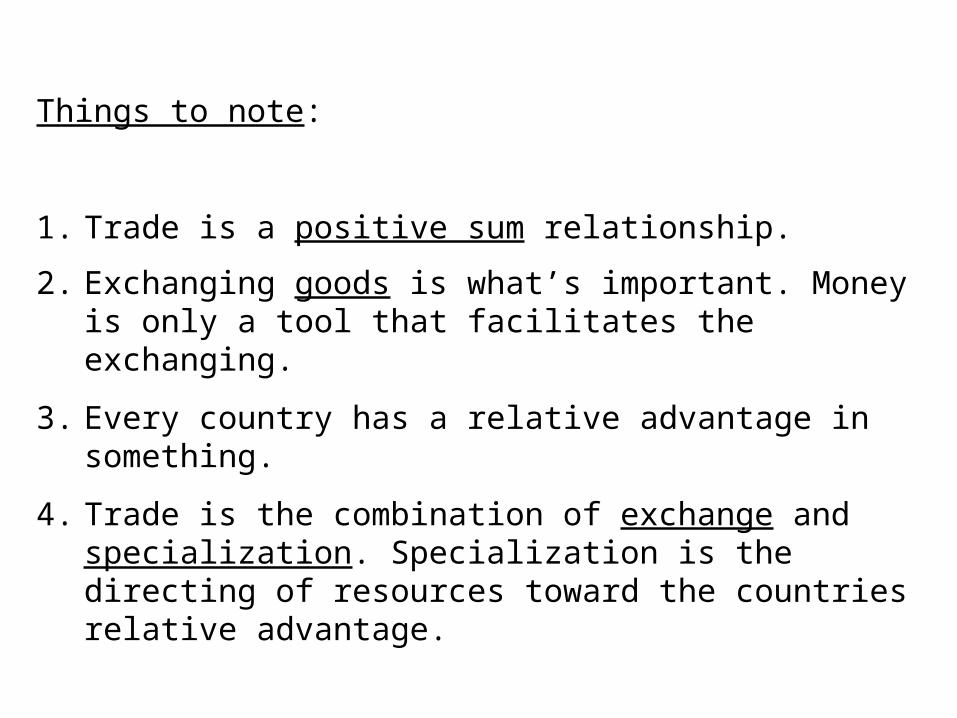
Things to note:
1. Trade is a positive sum relationship.
2. Exchanging goods is what’s important. Money is only a tool that facilitates the exchanging.
3. Every country has a relative advantage in something.
4. Trade is the combination of exchange and specialization. Specialization is the directing of resources toward the countries relative advantage.
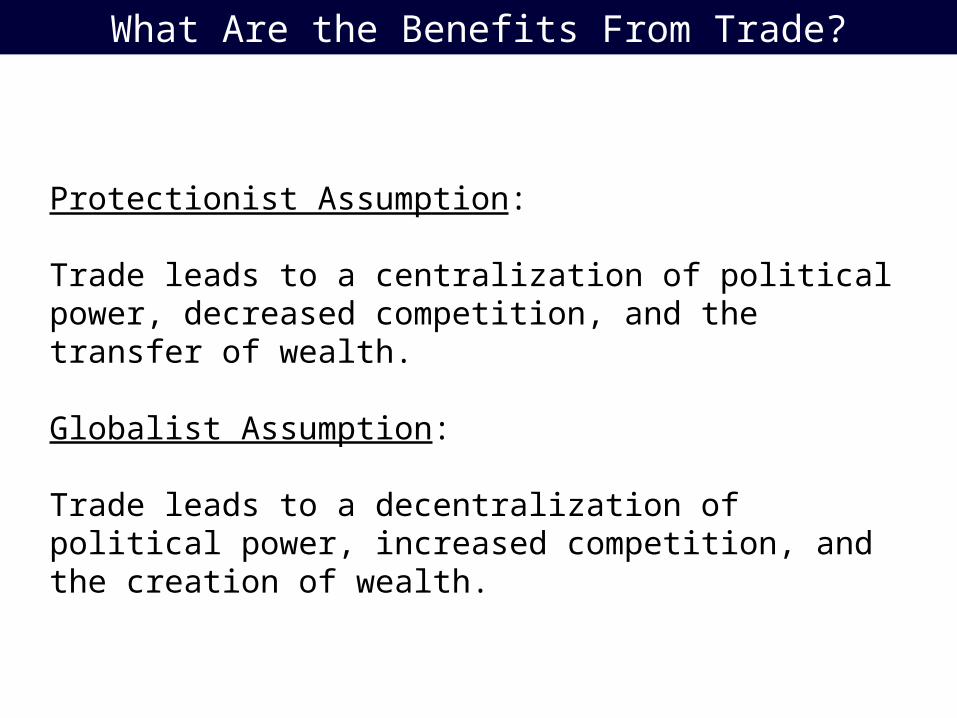
What Are the Benefits From Trade?
Protectionist Assumption:
Trade leads to a centralization of political power, decreased competition, and the transfer of wealth.
Globalist Assumption:
Trade leads to a decentralization of political power, increased competition, and the creation of wealth.
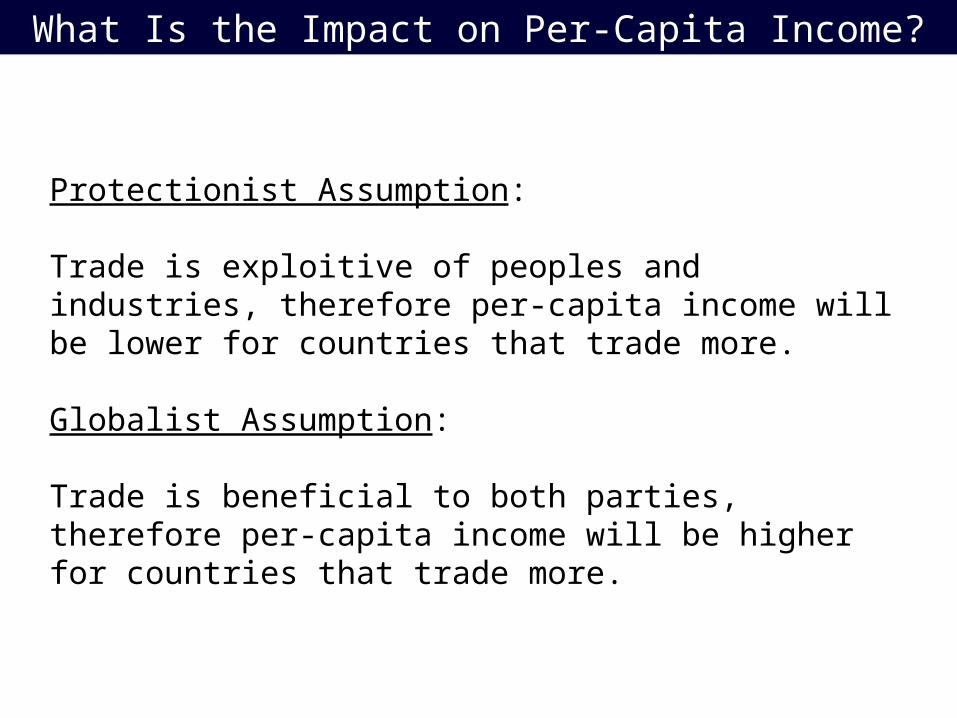
What Is the Impact on Per-Capita Income?
Protectionist Assumption:
Trade is exploitive of peoples and industries, therefore per-capita income will be lower for countries that trade more.
Globalist Assumption:
Trade is beneficial to both parties, therefore per-capita income will be higher for countries that trade more.
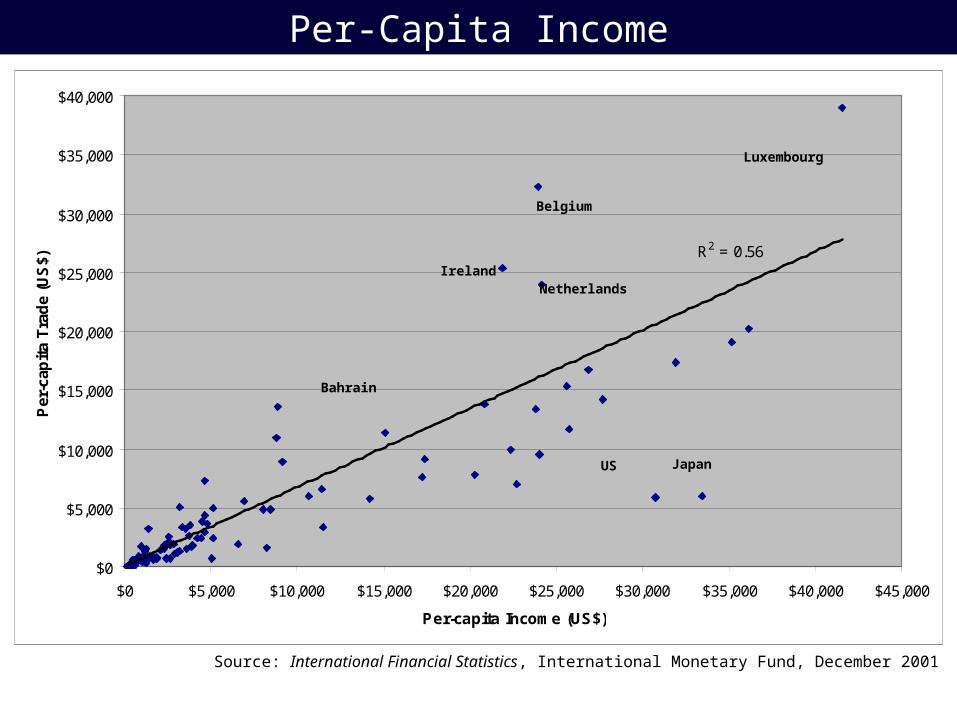
Per-Capita Income
R2 = 0.56
$0
$5,000
$10,000
$15,000
$20,000
$25,000
$30,000
$35,000
$40,000
$0 $5,000 $10,000 $15,000 $20,000 $25,000 $30,000 $35,000 $40,000 $45,000
Per-capita Income (US$)
Per
-cap
ita
Tra
de
(US
$)
Luxembourg
Belgium
IrelandNetherlands
JapanUS
Bahrain
Source: International Financial Statistics, International Monetary Fund, December 2001
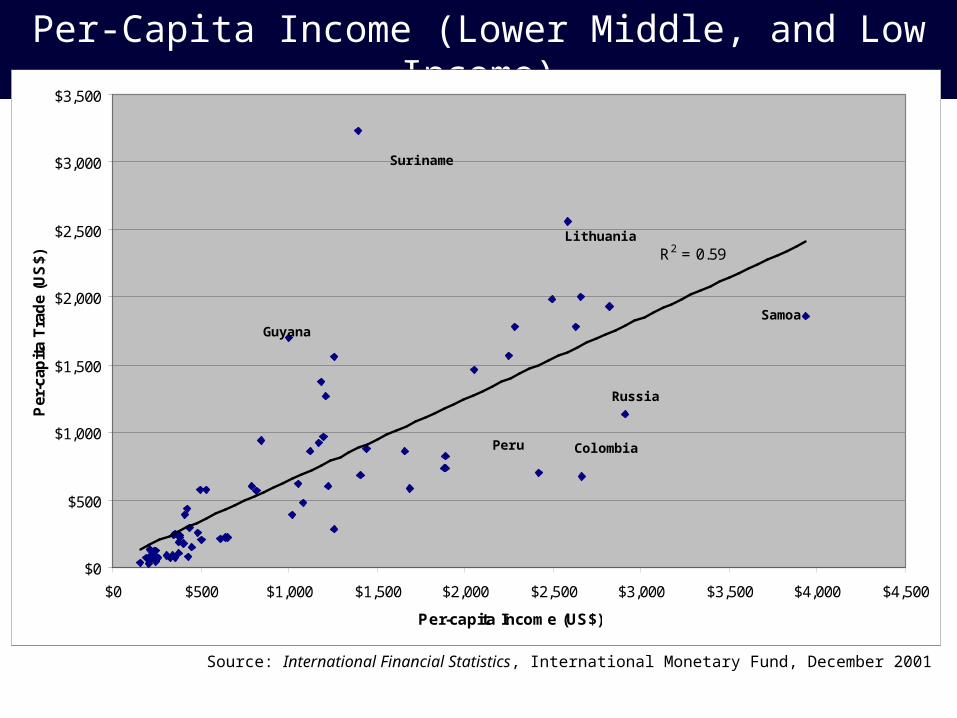
Per-Capita Income (Lower Middle, and Low Income)
R2 = 0.59
$0
$500
$1,000
$1,500
$2,000
$2,500
$3,000
$3,500
$0 $500 $1,000 $1,500 $2,000 $2,500 $3,000 $3,500 $4,000 $4,500
Per-capita Income (US$)
Per
-cap
ita
Tra
de
(US
$)
Suriname
Lithuania
Samoa
Russia
ColombiaPeru
Guyana
Source: International Financial Statistics, International Monetary Fund, December 2001
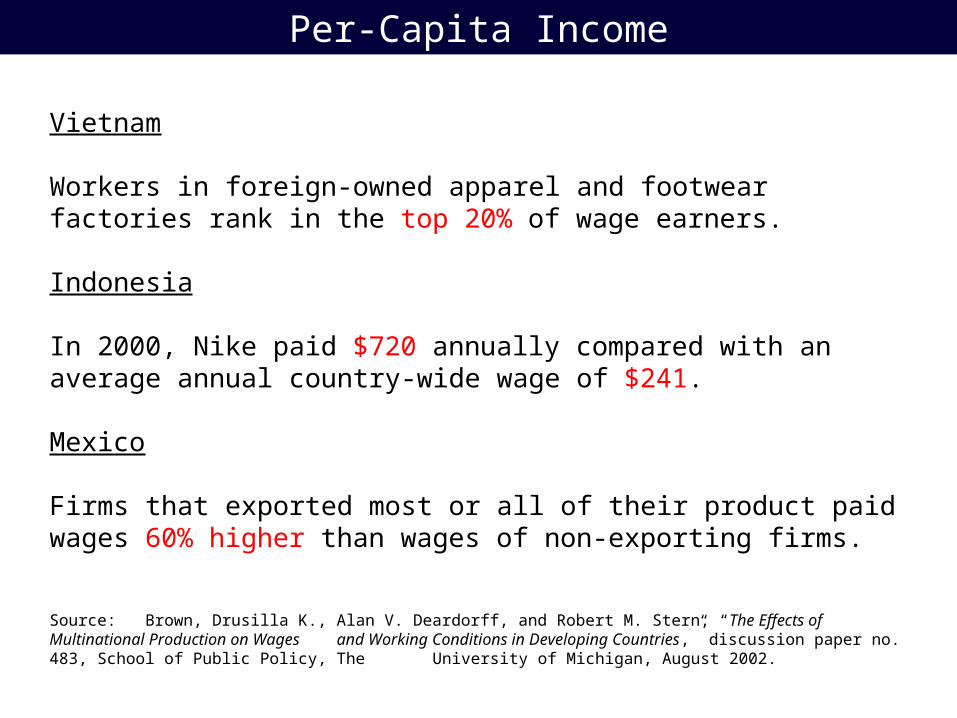
Per-Capita Income
Vietnam
Workers in foreign-owned apparel and footwear factories rank in the top 20% of wage earners.
Indonesia
In 2000, Nike paid $720 annually compared with an average annual country-wide wage of $241.
Mexico
Firms that exported most or all of their product paid wages 60% higher than wages of non-exporting firms.
Source: Brown, Drusilla K., Alan V. Deardorff, and Robert M. Stern, “The Effects of Multinational Production on Wages and Working Conditions in Developing Countries,” discussion paper no. 483, School of Public Policy, The University of Michigan, August 2002.

What Is the Impact on Income Distribution?
Protectionist Assumption:
Trade consolidates income in the hands of the powerful, therefore countries that trade more will have a less equitable income distribution.
Globalist Assumption:
Trade creates income across trading partners, therefore countries that trade more will have a more equitable income distribution.

Income Distribution
$0
$5,000
$10,000
$15,000
$20,000
$25,000
$30,000
$35,000
$40,000
15.0 20.0 25.0 30.0 35.0 40.0 45.0 50.0 55.0 60.0 65.0
Gini Coefficient (0 = equitable, 100 = inequitable)
Per
-cap
ita
Tra
de
(US
$)
US
Switzerland
Ireland
Finland
Cyprus
Netherlands
Singapore
Hong Kong
Norway
DenmarkSwedenAustria
CanadaGermany
IsraelFrance
Slovenia
GabonSouth Africa
Malaysia
Source: International Financial Statistics, International Monetary Fund, December 2001, and Measuring Income Inequality: A New Database, Deininger, Klaus, and Lyn Squire, World Bank, 2002
No carrot: A too inequitable distribution signals a lack of entrepreneurial opportunity.
No stick: A too equitable distribution signals no cost to free riders.
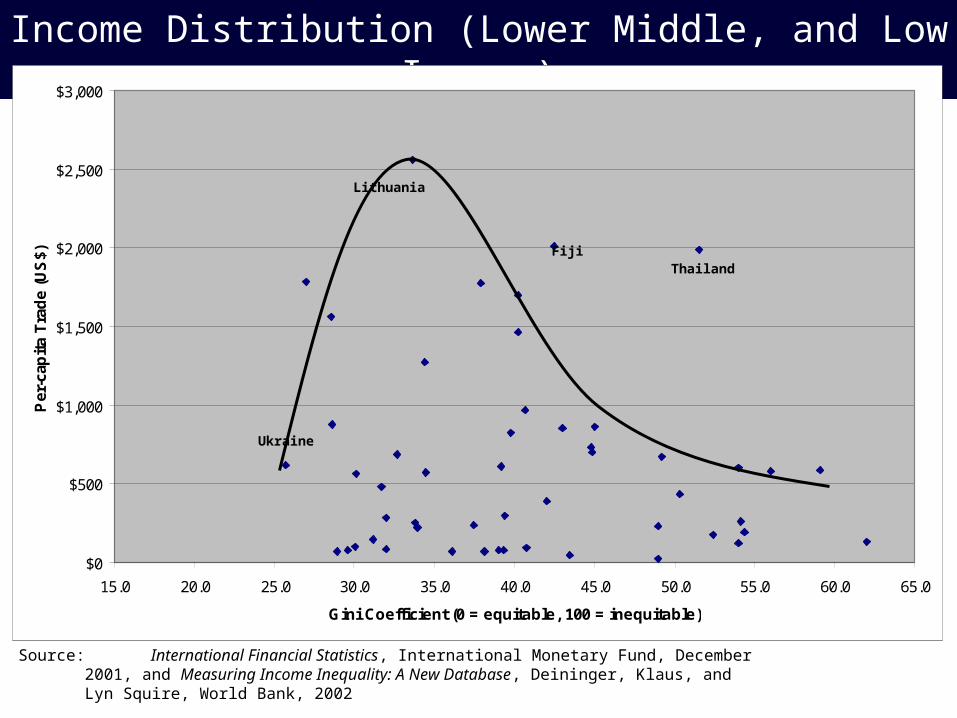
Income Distribution (Lower Middle, and Low Income)
$0
$500
$1,000
$1,500
$2,000
$2,500
$3,000
15.0 20.0 25.0 30.0 35.0 40.0 45.0 50.0 55.0 60.0 65.0
Gini Coefficient (0 = equitable, 100 = inequitable)
Per
-cap
ita
Tra
de
(US
$)
Thailand
Lithuania
Fiji
Ukraine
Source: International Financial Statistics, International Monetary Fund, December 2001, and Measuring Income Inequality: A New Database, Deininger, Klaus, and Lyn Squire, World Bank, 2002
0%
2%
4%
6%
8%
10%
12%
14%
16%
18%
20%
< $
15,0
00
$15,0
00 -
$25,0
00
$25,0
00 -
$35,0
00
$35,0
00 -
$50,0
00
$50,0
00 -
$75,0
00
$75,0
00 -
$100,0
00
> $
100,0
00
% o
f H
ou
seh
old
s
1980
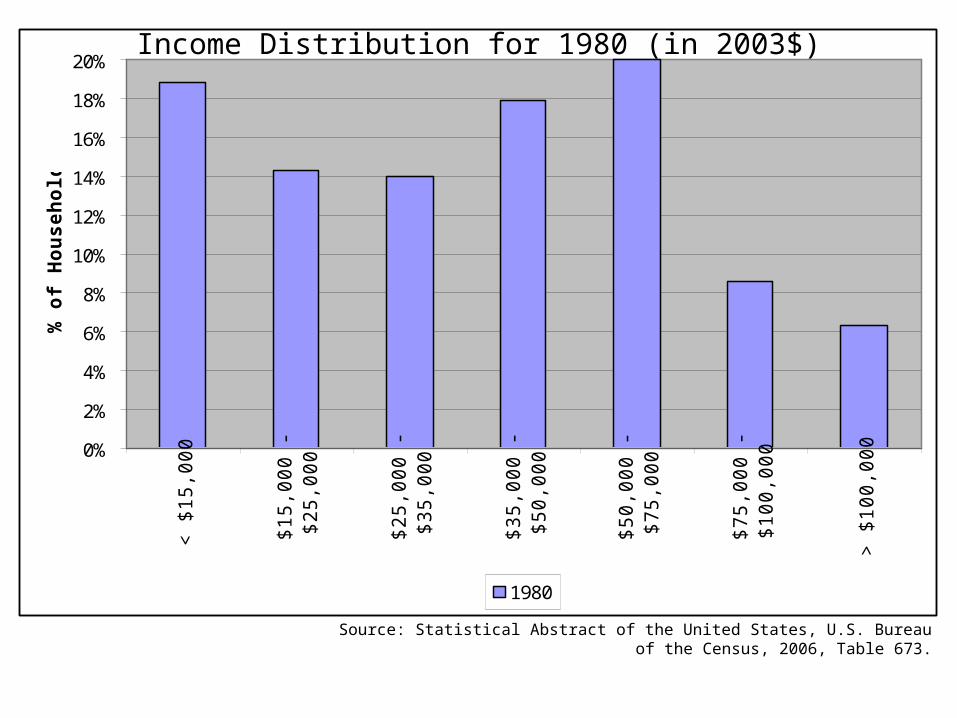
Source: Statistical Abstract of the United States, U.S. Bureau of the Census, 2006, Table 673.
Income Distribution for 1980 (in 2003$)
0%
2%
4%
6%
8%
10%
12%
14%
16%
18%
20%
< $
15,0
00
$15,0
00 -
$25,0
00
$25,0
00 -
$35,0
00
$35,0
00 -
$50,0
00
$50,0
00 -
$75,0
00
$75,0
00 -
$100,0
00
> $
100,0
00
% o
f H
ou
seh
old
s
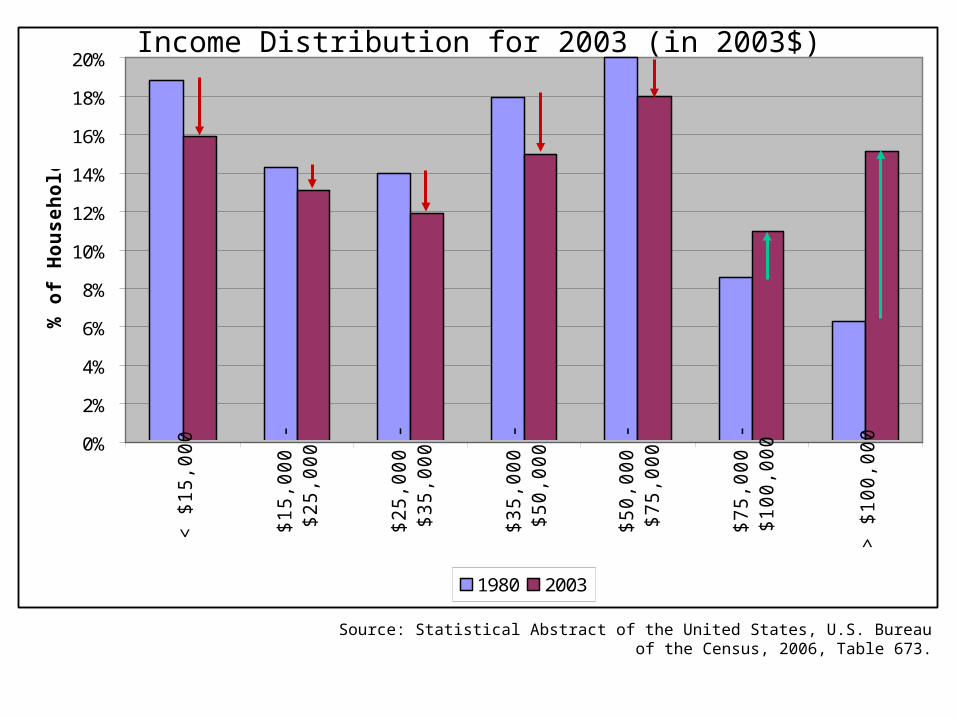
1980 2003
Source: Statistical Abstract of the United States, U.S. Bureau of the Census, 2006, Table 673.
Income Distribution for 2003 (in 2003$)
0%
10%
20%
30%
40%
50%
60%
70%
80%
90%
100%
0% 10% 20% 30% 40% 50% 60% 70% 80% 90% 100%
% of the Popuation
% o
f T
ota
l In
com
e
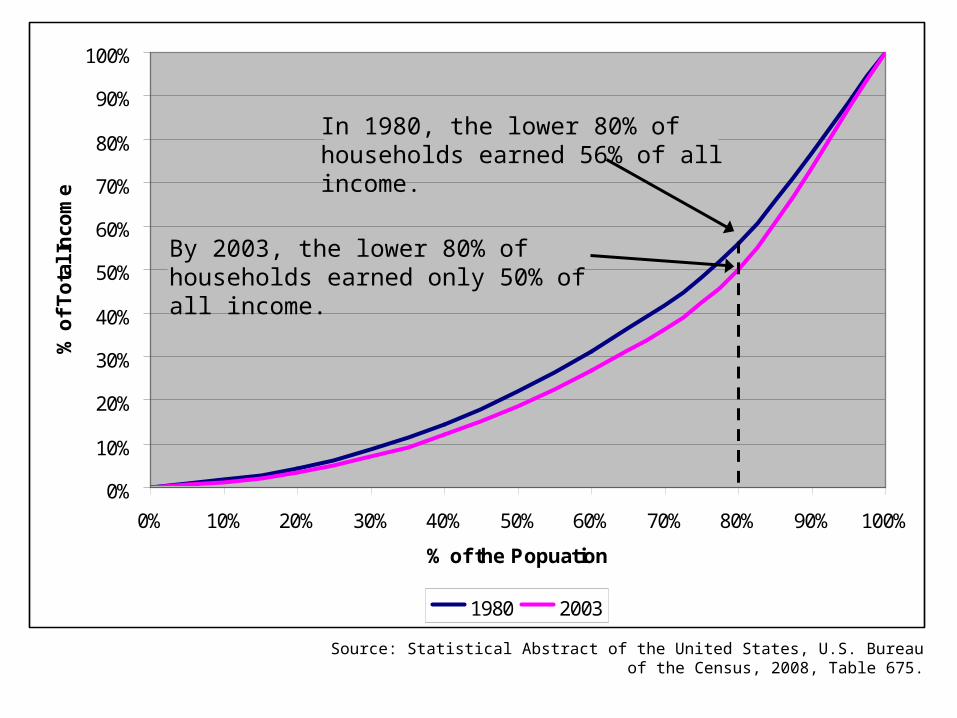
1980 2003
Source: Statistical Abstract of the United States, U.S. Bureau of the Census, 2008, Table 675.
In 1980, the lower 80% of households earned 56% of all income.
By 2003, the lower 80% of households earned only 50% of all income.
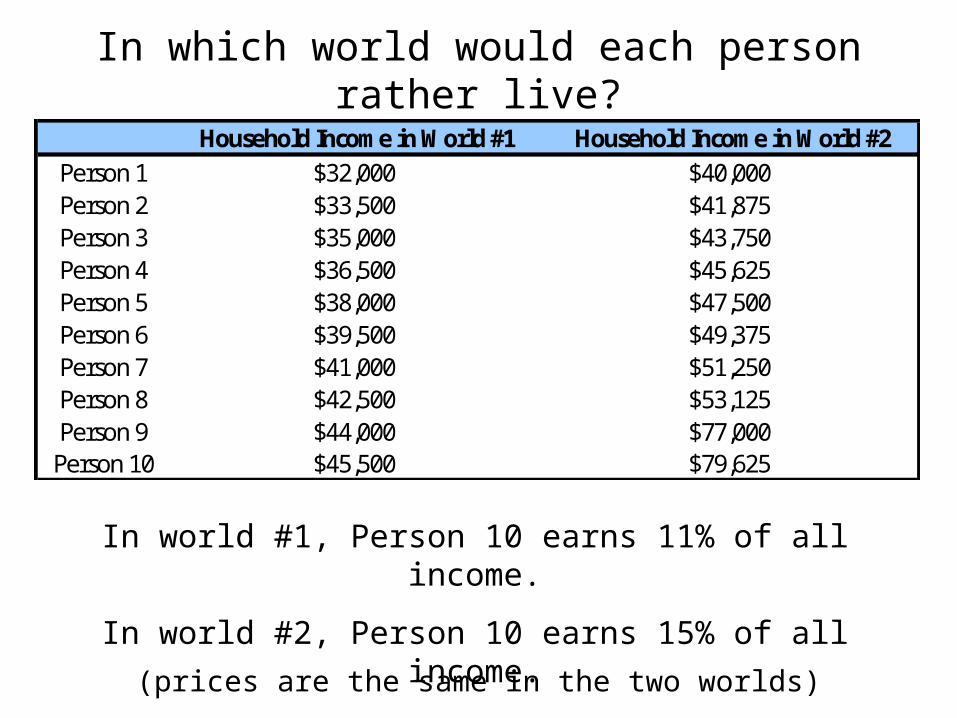
In which world would each person rather live?
(prices are the same in the two worlds)
Household Income in World #1 Household Income in World #2Person 1 $32,000 $40,000Person 2 $33,500 $41,875Person 3 $35,000 $43,750Person 4 $36,500 $45,625Person 5 $38,000 $47,500Person 6 $39,500 $49,375Person 7 $41,000 $51,250Person 8 $42,500 $53,125Person 9 $44,000 $77,000
Person 10 $45,500 $79,625
In world #1, Person 10 earns 11% of all income.
In world #2, Person 10 earns 15% of all income.
0%
10%
20%
30%
40%
50%
60%
70%
80%
90%
100%
0% 10% 20% 30% 40% 50% 60% 70% 80% 90% 100%
% of the Popuation
% o
f T
ota
l In
com
e
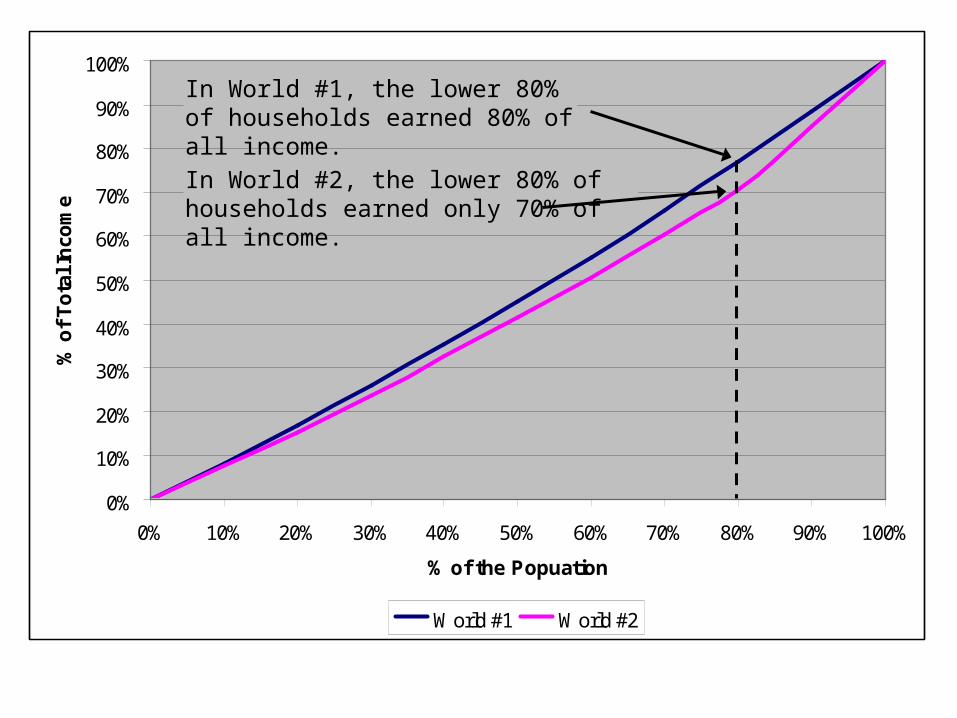
World #1 World #2
In World #1, the lower 80% of households earned 80% of all income.In World #2, the lower 80% of households earned only 70% of all income.

In which world would each person rather live?
(prices are the same in the two worlds)
World #3’s income distribution is the same as World #1’s.
Household Income in World #1 Household Income in World #2 Household Income in World #3Person 1 $32,000 $40,000 $6,400Person 2 $33,500 $41,875 $6,700Person 3 $35,000 $43,750 $7,000Person 4 $36,500 $45,625 $7,300Person 5 $38,000 $47,500 $7,600Person 6 $39,500 $49,375 $7,900Person 7 $41,000 $51,250 $8,200Person 8 $42,500 $53,125 $8,500Person 9 $44,000 $77,000 $8,800
Person 10 $45,500 $79,625 $9,100
What Is the Impact on Social Equality?
Protectionist Assumption:
Trade exploits the weak.
Globalist Assumption:
Trade empowers the weak.

Gender Related Development Index
R2 = 0.80
$1
$10
$100
$1,000
$10,000
$100,000
0.00 0.10 0.20 0.30 0.40 0.50 0.60 0.70 0.80 0.90 1.00
Gender Related Development Index (0 = low gender adjusted HDI, 1 = high gender adjusted HDI)
Pe
r-c
ap
ita
Tra
de
(U
S$
, lo
ga
rith
mic
sc
ale
)
US
Myanmar
OmanBotswana
Ivory Coast
Azerbaijan and Albania
GDI measures equality of quality of life (longevity, education, literacy, income).
Source: International Financial Statistics, International Monetary Fund, December 2001, and World Development Indicators, World Bank, 2002
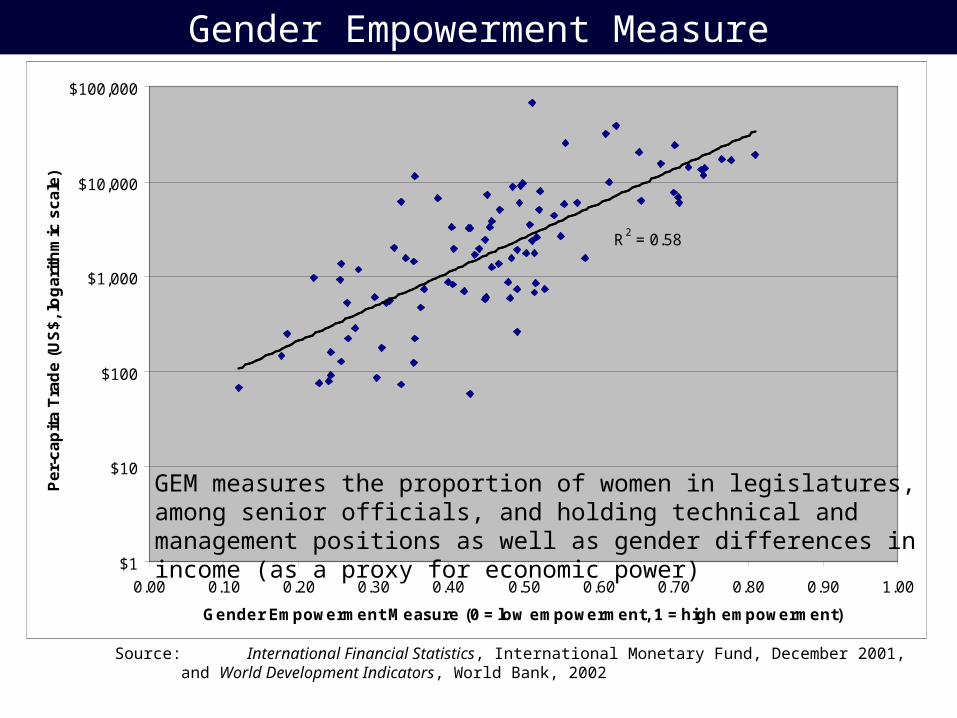
Gender Empowerment Measure
R2 = 0.58
$1
$10
$100
$1,000
$10,000
$100,000
0.00 0.10 0.20 0.30 0.40 0.50 0.60 0.70 0.80 0.90 1.00
Gender Empowerment Measure (0 = low empowerment, 1 = high empowerment)
Pe
r-c
ap
ita
Tra
de
(U
S$
, lo
ga
rith
mic
sc
ale
)
GEM measures the proportion of women in legislatures, among senior officials, and holding technical and management positions as well as gender differences in income (as a proxy for economic power)
Source: International Financial Statistics, International Monetary Fund, December 2001, and World Development Indicators, World Bank, 2002

Child Labor
R2 = 0.54
$1
$10
$100
$1,000
$10,000
$100,000
0 10 20 30 40 50
Children 10 to 14 in the Labor Force (as % of age group)
Per
-cap
ita
Tra
de
(US
$, l
og
arit
hm
ic s
cale
)
US
Hong Kong
Sierra LeoneBurundi
GabonBotswana
Source: International Financial Statistics, International Monetary Fund, December 2001, and World Development Indicators, World Bank, 2002

What Is the Impact on Unemployment?
Protectionist Assumption:
Trade destroys jobs.
Globalist Assumption:
Trade creates jobs.
(beware of the “information availability” problem)

Unemployment vs. Trade Over Time
Source: Bureau of Labor Statistics, and Bureau of Economic Analysis
January 1975 to June 2006
0%
2%
4%
6%
8%
10%
12%
12% 14% 16% 18% 20% 22% 24% 26% 28% 30%
Trade (imports plus exports) as % of GDP
Un
emp
loym
ent
Rat
e
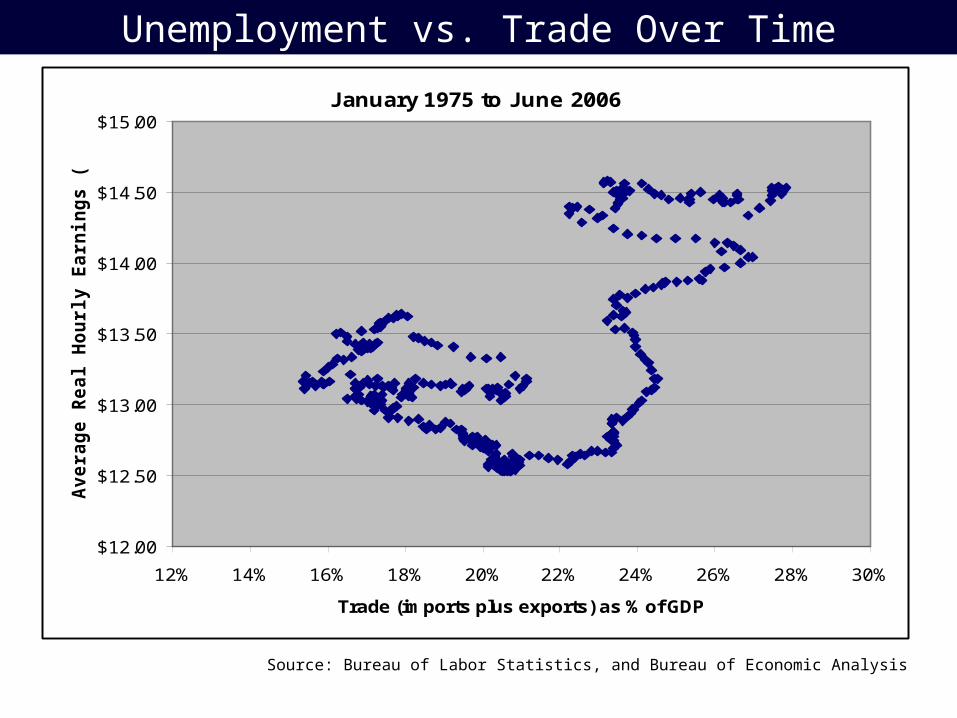
Unemployment vs. Trade Over Time
Source: Bureau of Labor Statistics, and Bureau of Economic Analysis
January 1975 to June 2006
$12.00
$12.50
$13.00
$13.50
$14.00
$14.50
$15.00
12% 14% 16% 18% 20% 22% 24% 26% 28% 30%
Trade (imports plus exports) as % of GDP
Av
era
ge
Re
al H
ou
rly
Ea
rnin
gs
(2
00
0$
)

What About Outsourcing?
Protectionist Assumption:
Outsourcing puts Americans out of work.
Globalist Assumption:
Outsourcing is trade (of labor), and trade is beneficial.

Source: Balance of Payment Statistics Yearbook, IMF
Outsourcing (2002)
$0
$5,000
$10,000
$15,000
$20,000
$25,000
$30,000
$35,000
$40,000
$45,000
$50,000
Ger
man
y
US
Japa
n
Net
herla
nds
Ital
y
Fra
nce
UK
Indi
a
Chi
na
Rus
sia
Mil
lio
ns
curr
ent
$
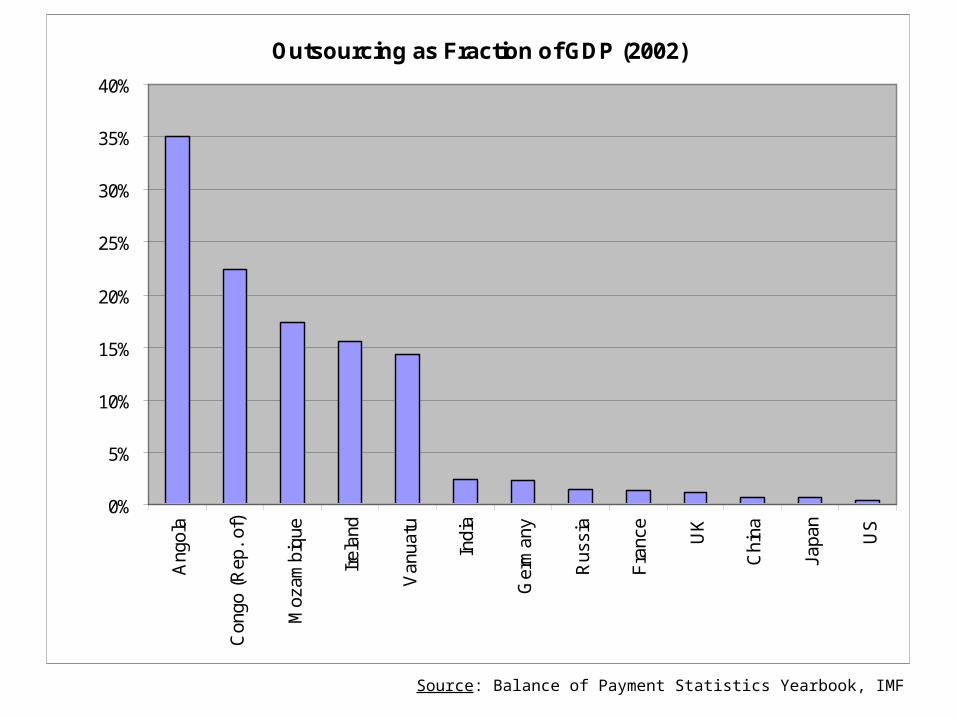
Outsourcing as Fraction of GDP (2002)
0%
5%
10%
15%
20%
25%
30%
35%
40%
Ang
ola
Con
go (
Rep
. of
)
Moz
ambi
que
Irel
and
Van
uatu
Indi
a
Ger
man
y
Rus
sia
Fra
nce
UK
Chi
na
Japa
n
US
Source: Balance of Payment Statistics Yearbook, IMF
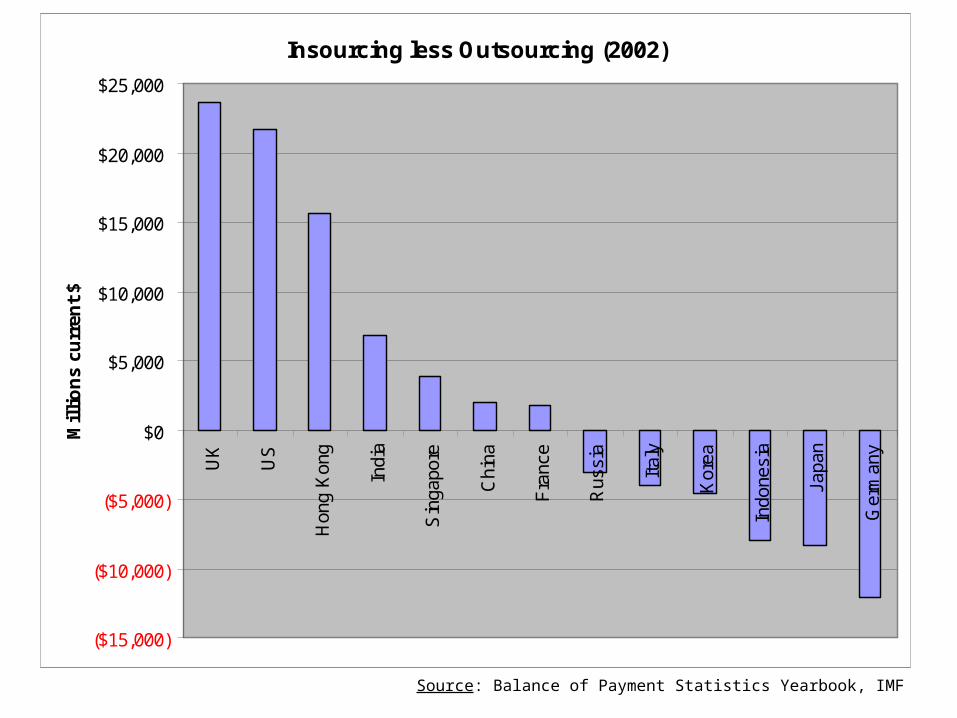
Insourcing less Outsourcing (2002)
($15,000)
($10,000)
($5,000)
$0
$5,000
$10,000
$15,000
$20,000
$25,000
UK
US
Hon
g K
ong
Indi
a
Sin
gapo
re
Chi
na
Fra
nce
Rus
sia
Ital
y
Kor
ea
Indo
nesi
a
Japa
n
Ger
man
y
Mil
lio
ns
curr
ent
$
Source: Balance of Payment Statistics Yearbook, IMF

Name two metrics that distinguish the first world
from the third world.

If you hit a light bulb with a hammer, will you make a
mess?


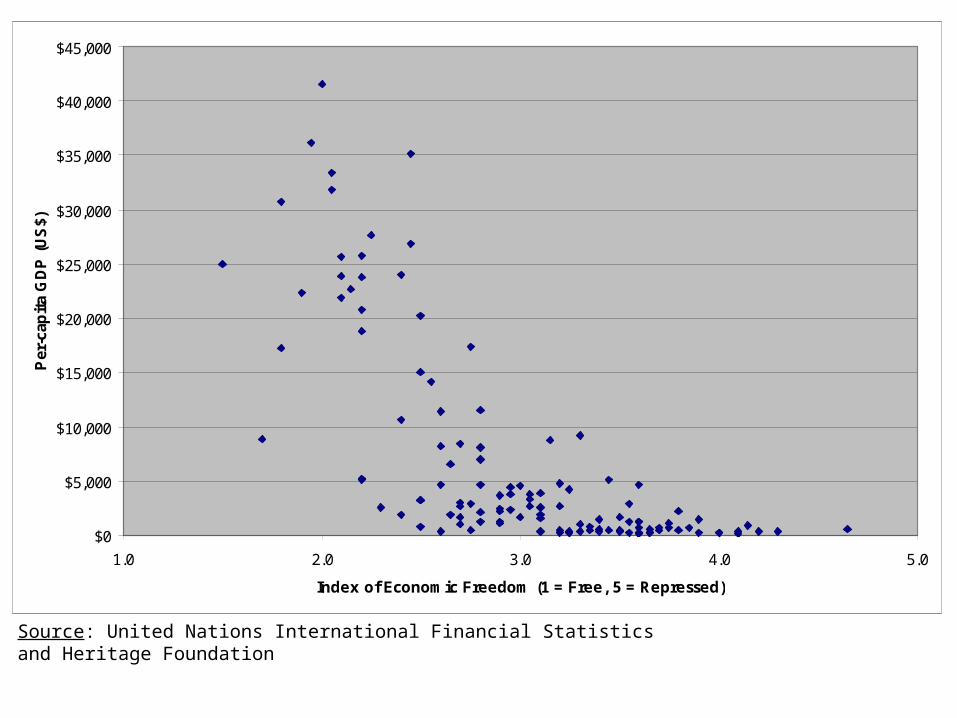
Source: United Nations International Financial Statistics and Heritage Foundation
$0
$5,000
$10,000
$15,000
$20,000
$25,000
$30,000
$35,000
$40,000
$45,000
1.0 126.0 251.0 376.0 501.0
Index of Economic Freedom (1 = Free, 5 = Repressed)
Per
-cap
ita
GD
P (
US
$)
2.0 3.0 4.0 5.01.0
$0
$5,000
$10,000
$15,000
$20,000
$25,000
$30,000
$35,000
$40,000
$45,000
1.0 2.0 3.0 4.0 5.0
Index of Economic Freedom (1 = Free, 5 = Repressed)
Per
-cap
ita
GD
P (
US
$)
Source: United Nations International Financial Statistics and Heritage Foundation

Political freedom makes economic freedom possible.
Economic freedom makes political freedom meaningful.